
Molecular Dynamics Study of Interdiffusion for Cubic and Hexagonal SiC/Al Interfaces

1
Department of Mechanical Engineering, Ferdowsi University of Mashhad, Mashhad 91779-48974, Iran
2
Institute of Fundamental Technological Research, Polish Academy of Sciences, Pawińskiego 5B, 02-106 Warsaw, Poland
3
Department of Solid Mechanics, Lublin University of Technology, 20-618 Lublin, Poland
*
Authors to whom correspondence should be addressed.
Crystals 2023, 13(1), 46; https://0-doi-org.brum.beds.ac.uk/10.3390/cryst13010046
Submission received: 19 November 2022
/
Revised: 19 December 2022
/
Accepted: 22 December 2022
/
Published: 27 December 2022
(This article belongs to the Special Issue Feature Papers on "Hybrid and Composite Crystalline Materials" 2021-2022)
Abstract
:The mechanical properties of the SiC/Al interface are crucial in estimating the overall strength of this ceramic-metal composite. The present work investigates the interdiffusion at the SiC/Al interface using molecular dynamics simulations. One cubic and one hexagonal SiC with a higher probability of orientations in contact with Al are examined as two samples of metal-matrix nanocomposites with whisker and particulate reinforcements. These reinforcements with the Si- and C-terminated surfaces of the SiC/Al interfaces are also studied. The average main and cross-interdiffusion coefficients are evaluated using a single diffusion couple for each system. The effect of temperature and annealing time are analysed on the self- and interdiffusion coefficients. It is found that the diffusion of Al in SiC is similar in cubic and hexagonal SiC and as expected, the interdiffusion coefficient increases as the temperature and annealing time increase. The model after diffusion can be used to evaluate the overall mechanical properties of the interface region in future studies.
1. Introduction
In recent decades, the use of ceramics in various engineering applications such as aerospace and automobile industries, cutting tools, and gas turbines has increased significantly. The advantages of ceramics are their excellent high-temperature, outstanding wear, and great corrosion resistance. However, they possess some disadvantages including brittleness, relatively low thermal conductivity, low fracture toughness and strength, poor resistance to creep, fatigue, and thermal shock. The disadvantages of ceramics can be overcome by microstructural engineering such as the development of metal-matrix composites (MMCs). They are usually used under extreme loading conditions such as impacts, high dynamic loads, elevated temperatures, and thermal shocks. To this end, accurate determination of the mechanical properties of MMCs is of great importance.
Silicon carbide (SiC), alumina (Al2O3), and tungsten carbide (WC) are the popular reinforcements, and aluminium, magnesium and titanium are the most common metal matrix materials. The SiC/Al metal-matrix nanocomposites have extensive applications due to their excellent properties, such as high strength, high fatigue, high toughness, excellent mechanical damping, good wear resistance, low density, and low coefficient of thermal expansion [1,2].
The SiC/Al MMC is mainly used in microelectronics as a substrate for power semiconductor devices and high-density multi-chip modules, where it aids in the removal of waste heat. It can be used as heatsinks, substrates for power electronics, heat spreaders, housings for electronics, and lids for chips (e.g., microprocessors).
The significance of the interface properties between the phases in the polycrystals was shown, for example, in [3,4], where WC/Co composites were investigated by employing cohesive law between phases.
MMCs usually consist of a few phases and some additions; therefore, the interface properties can severely affect their performance and stability. Furthermore, because of diffusion, the interface of grains at the atomic level is not ideal; in reality, it is a combination of atoms of the phases connected. To this end, the equivalent material properties of the interface between phases play an essential role in the mechanical response of MMCs to loading.
The diffusion in solids occurs due to the thermally activated random motion of atoms. Interdiffusion, or diffusion couple, is a process of diffusional exchange of atoms across two materials that are in contact. The rate of substitutional diffusion depends on the vacancy concentration and activation energy available for exchange. Interstitial diffusion may also exist when smaller atoms diffuse between atoms. Accurate determination of the interdiffusion coefficients, especially for multi-component systems, is a challenge in the materials community. The interested reader will find sufficient references and methods for the determination of interdiffusion coefficients is metallic solids in the review article by Zhong et al. [5].
The diffusion of Al into SiC has been studied by some investigators. Chang et al. [6] investigated this diffusion in the field of semiconductors and determined diffusion coefficient D at a temperature between 1700 to 2400 °C. Mokhov et al. [7] also estimated the diffusion constant of Al-containing vapour in SiC at different temperatures using experimental data. Van Opdorp [8] showed that the penetration depth of Al into SiC from a vapour source was more considerable than that from a solid source. The activation energies obtained by different investigators are in reasonably good agreement. Tajima et al. [9] determined the diffusion constant of Al into SiC at temperatures from 1350 to 1800 °C and characterised a low activation energy and low pre-exponential constant compared with previously reported results. They illustrated that the self- and most impurity diffusion into SiC occurs via a vacancy.
The wettability of SiC single crystals by Al and Al–Si alloys was investigated by Laurent et al. [10]. They discovered that adding silicon to aluminium in amounts sufficient to prevent the formation of aluminium carbide at the interface has no significant effect on wettability in both pure Al/SiC and Al–Si alloys/SiC systems. Narciso et al. [11] examined the reactivity of unoxidised and thermally oxidised SiC particulates with Al-Si alloys. They showed, using optical microscopy, that thermal oxidisation of SiC particles reduces the production of aluminium carbide, which has a negative influence on the properties of a composite. In addition, they concluded that the morphology changes, with large particles appearing in the case of unoxidised SiC and rather uniform layers at the surface of the particulates or much smaller particles appearing in the case of oxidised SiC. They also studied how increasing the amount of silicon reduces the formation of aluminium carbide.
The interested reader will find sufficient references to cover the literature in more depth concerning surface treatments and coating of SiC in the review article by Rajan et al. [12]. The overall conclusion of this article is that metallic coatings improve the wettability of reinforcement while also changing the matrix alloy composition by alloying with the matrix. Moreover, ceramic coatings act as a diffusion barrier between the reinforcement and the matrix, reducing the interfacial reaction.
Tham et al. [13] prepared composites with interfacial microstructures by varying the contact time between SiC particles and molten aluminium during processing. The composites were synthesised using the disintegrated melt deposition technique, which involved incorporating the pre-heated SiC particles in the air for 60 min at 950 °C by mechanically stirring the fully molten aluminium alloy superheated to 950 °C with an impeller. They observed that the formation of a thin Al4C3 reaction layer along the particle-matrix interface increases the composite yield strength, ultimate tensile strength, work-hardening rate, and work-to-fracture. However, Lee et al. [14] emphasised that the formation of brittle and unstable Al4C3 at the SiC/Al interface results in the degradation of the mechanical properties of composites. The composite is also sensitive to some corrosive environments due to the hydrophilic nature of Al4C3. To this end, the formation of Al4C3 during composite fabrication must be either avoided or minimised. The addition of Si into the matrix, coating of SiC, and passive oxidation of SiC are often suggested to avoid the formation of Al4C3 or to obtain the desired SiC/Al interface [14].
Sozhamannan and Prabu [15] prepared samples with interface bonding of SiC/Al by various processing temperatures at a constant holding time. The interface compounds at the interface were evaluated by an energy dispersive spectroscope (EDS). The diffusion length of the compounds was calculated, and the interface characteristics were evaluated by tensile and microhardness tests. They found that, at high temperatures, the SiC was segregated into Si and C, and the dissolution of Si in liquid Al was faster compared to C. Hence, vacancies were created in the SiC due to the absence of Si near the interface. Further, the presence of carbon near the interface reacted with Al to form the Al4C3.
Soloviev et al. [16] studied the diffusion of Al in 4H-SiC substrates with different orientations at temperatures of 1900 to 2000 °C and measured impurity profiles using secondary ion mass spectrometry (SIMS). They concluded that the diffusion into face SiC was deeper and reported the diffusion coefficient of Al for this case. Müting et al. [17] investigated the diffusion of Al in 4H-SiC during post-implantation annealing. They found Al diffuses into SiC with a low diffusion rate during heat treatment using defect-enhanced diffusion mechanisms. They studied diffusion using SIMS as well as transmission electron microscopy (TEM).
In the present study, the self-diffusion and interdiffusion at the interface of SiC/Al are investigated using the molecular dynamics (MD) method, and the effects of temperature and annealing time on the diffusion coefficients of the components are studied. The average ternary interdiffusion coefficients are evaluated by the method proposed by Dayananda and Sohn [18]. An particulate-reinforced Al composite and a whisker-reinforced Al composite with a higher probability of observing orientations are modelled, and their diffusions are investigated. Furthermore, the effect of the Si- and C-terminated SiC at the interface with Al on the diffusion and thickness of the diffusion zone is examined. The systems, after annealing and forming a diffusion region, can be utilised for estimating the equivalent mechanical properties or cohesive law of the fuzzy interface using modes I and II fracture tests by the MD method.
2. Modelling and Simulation Method
Molecular dynamics is the computational simulation of a complex system that describes motions, interactions, and dynamics at the atomic level by choosing a force field describing all the interatomic interactions and by integrating the Newtonian equations, which give the position and speed of atoms over time. In this study, the MD simulations were performed using the LAMMPS open-source MD software (version 23 June 2022) [19]. LAMMPS is a classical molecular dynamics code with a focus on materials modelling. The OVITO software (version 3.7.12) [20] was used for scientific visualisation and data analysis. The interatomic potential used in the MD simulations can be obtained from ab initio calculations or experimental data. The interatomic potentials for aluminium, silicon carbide, and aluminium with silicon carbide at the interface are discussed in the following section.
2.1. Interatomic Potentials
For face-centred cubic (fcc) metallic materials, the embedded atom method (EAM) is one of the most popular inter-atomic potentials. In this study, the EAM potential obtained by Mishin et al. [21] was used to model the force between aluminium atoms. In this EAM model, the total energy of a monoatomic system is represented by [21]:
where V(rij) is a pair potential as a function of distance rij between atoms i and j, and F is the embedding energy as a function of the density induced on atom i by all other atoms in the system. The density is given by:
where is the atomic density function.
The most widely employed potential for SiC is the bond-order potential by Tersoff [22,23,24]. The many-body Tersoff potential between atoms i and j is defined as:
where , , and are, respectively, the repulsive, attractive and cut-off potential functions, rij is the length of the atomic bond between atom i and j, and bij is a function that modulates the attractive interaction.
The Lennard-Jones (LJ) and Mores potentials are the conventional potential functions for modelling interactions between ceramic and metal atoms. Dandekar and Shin [25] compared the LJ and Morse potentials. They showed that the LJ potential cannot completely describe Al, Si, and C interactions but is useful in describing the adhesive interface between the components. However, the Morse potential can represent the system best and is matched by the ab initio data obtained by Zhao et al. [26]. Their proposed Morse potential function is as follows [25]:
where r, r0, D0, and α are the distance between atoms, the equilibrium bond length, the well depth of the potential, and the width of the potential, respectively. Dandekar and Shin [25] obtained the Morse parameters for Al–Si and Al–C interactions by curve fitting the potential function to the ab initio results. These parameters for Al–C interactions are eV, 1/Å and Å, and for Al–Si interactions, they are eV, 1/Å and Å [26]. The Morse potential was used in this study to model the interactions of atoms at the interface.
To verify the validity of the potential functions, the elastic constants of fcc Al and cubic silicon carbide (3C-SiC) with lattice parameters of 4.0495 and 4.348 Å, respectively, were obtained with the aforementioned potential functions and compared with the experimental and MD simulations in Table 1. The bulk modulus K, shear modulus G and Poisson’s ratio v were obtained using the elastic constants:
It can be seen that the present results agree very well with those obtained by experiments and MD simulations of other investigators. Therefore, the potential functions used here can adequately model the interactions between atoms.
2.2. Simulation Model
Many experimental studies on the SiC/Al interface observed an orientation relationship between SiC and Al in either particulate-reinforced Al or β-SiC whisker-reinforced Al composites. The has a hexagonal crystal structure (similar to Wurtzite), but the β-SiC has a cubic crystal structure (similar to diamond). In this study, one cubic (3C–SiC) and one hexagonal (6H–SiC) SiC with a higher probability of observation were modelled as one sample for each SiC crystal structure. Li et al. [31] used a quantum chemical method to calculate the total energies of . They concluded that the bond strength between SiC and Al could be stronger than the bond between Al and Al, and the adhesive energy in this orientation is large. Also, Luo et al. [32] showed that has large cohesive energy, which is consistent with a high probability of observation in the STEM experiment [33]. To this end, in this work, these two types of orientation at the interface were considered.
The present model consists of a dual-layer nanocomposite of SiC and Al. The lattice constants of fcc Al and cubic 3C–SiC are 4.0495 and 4.348 Å, respectively. Also, the lattice constants of hexagonal 6H–SiC are a = b = 3.081 Å and c = 15.120 Å.
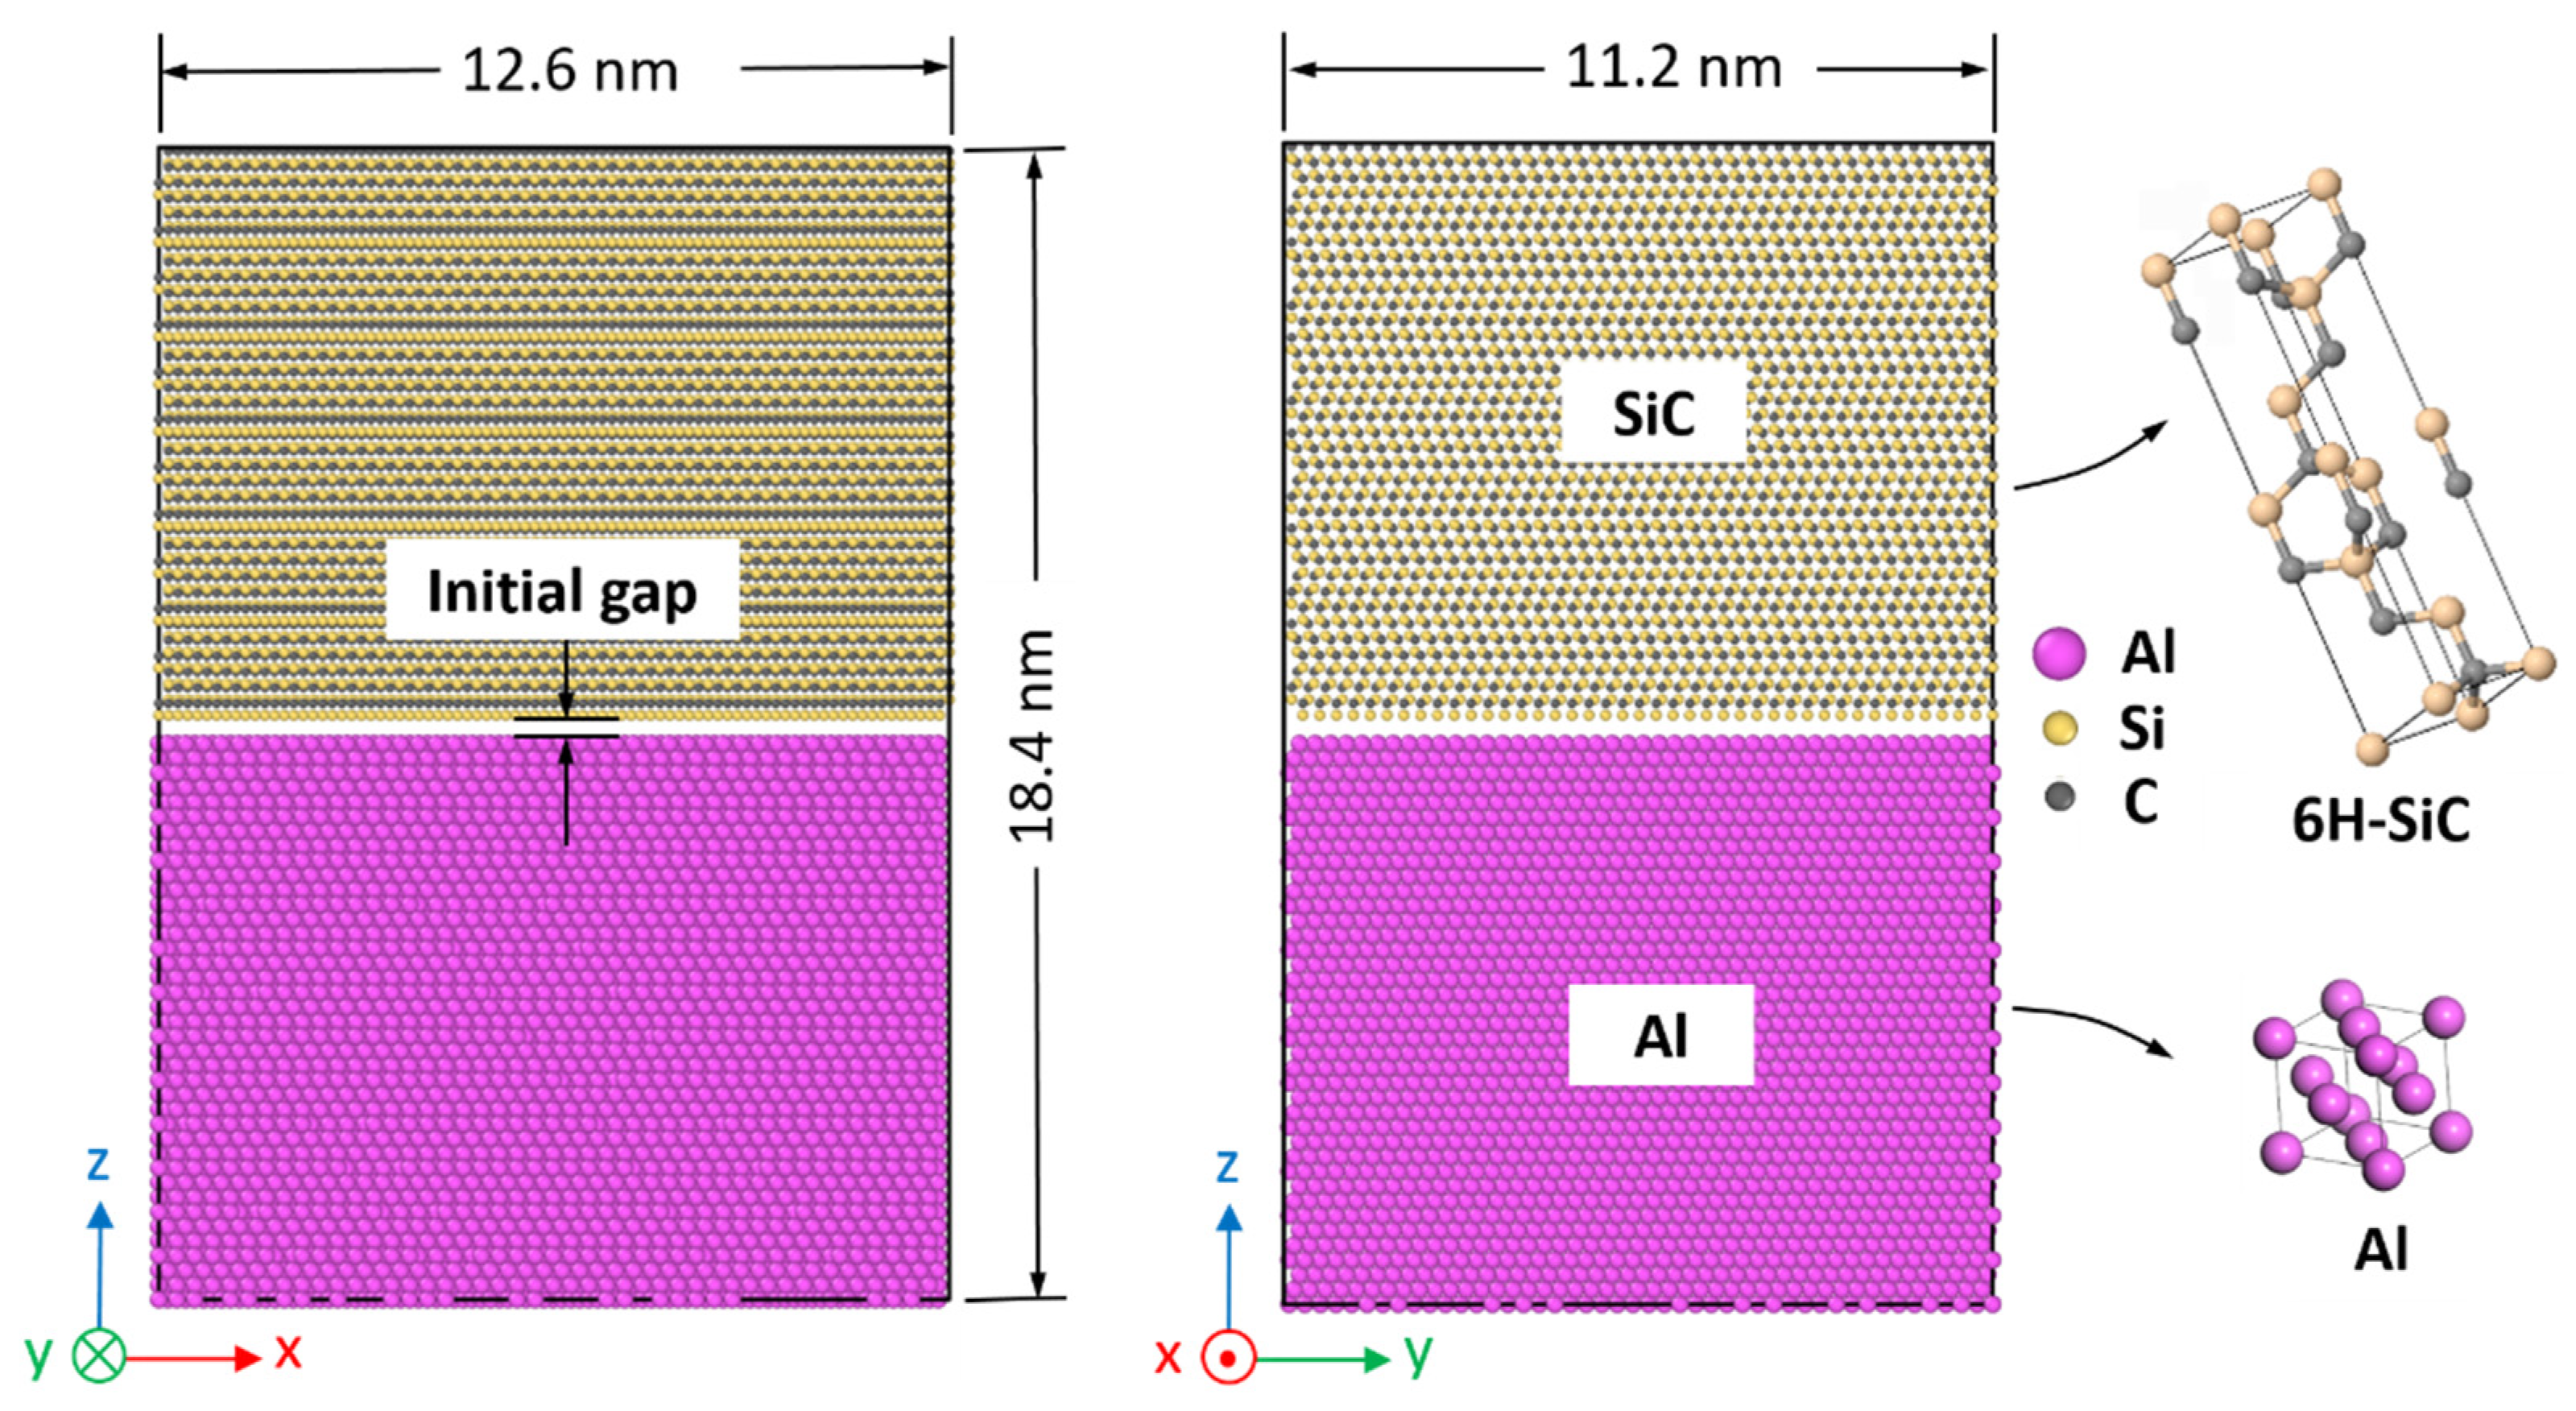
The initial three-dimensional MD model considered for analysing the interfacial mechanical properties of SiC/Al is shown in Figure 1. Aiming at generating the grain boundaries, two crystals are rotated along the appropriate rotation axis and angle. The initial SiC/Al interface is considered as a single crystal of Al (bottom) and single crystal of SiC (top) with an initial gap. The gap is set to the previously obtained [34] Al–C bond length (1.95 Å) for the C-terminated interfaces, the Al–Si bond length (2.41 Å) for the Si-terminated interfaces, and the average of the Al–C and Al–Si bond lengths (2.18 Å) for nonpolar SiC interfaces.
The typical dimension of the MD model is approximately 126 Å × 112 Å × 184 Å with a total of 201,204 atoms. The accurate dimensions for each model are selected considering the amount of lattice misfit between the crystal surfaces at the interface to produce the Al and SiC parts with the least difference in the x- and y-directions. In all models, two cases of C-terminated and Si-terminated configurations at the interface are analysed. The periodic boundary conditions are applied in all three directions of the samples, and a time step of 1 fs is considered throughout the simulations.
Optimisation of the geometric configuration is first performed using the conjugate gradient energy minimisation algorithm with a specified energy tolerance of 1 × 10⁻¹⁰ and a force tolerance of 1 × 10⁻¹⁰ eV/Å. The NVT canonical ensemble at a constant temperature of 300 K is imposed on the sample for 20 ps and then the isothermal–isobaric (NPT) ensemble at a zero pressure and constant 300 K is used for 30 ps to adjust the volume and relax the assembled interface system. Next, to study the diffusion of atoms, the sample is heated to a pre-set temperature at a heating rate of 1 K/ps. Afterwards, the temperature is maintained at the given temperature for 6.0 ns to study the interdiffusion, and the movements of Al, Si and C atoms are recorded during this period. Finally, the sample is cooled to 300 K at a rate of 1 K/ps. Then, the structural relaxation process is performed for 20 ps under the condition of zero pressure and 300 K for removing the internal residual stresses. The NPT ensemble with zero pressure is considered for all these processes. After cooling, the final sample can be used to analyse the strength of the SiC/Al and specifically, the average mechanical properties of the diffused interface in future works. To study the interdiffusion of Al in SiC, temperatures of 1000, 1200, 1500, and 2000 K are considered for the simulations.
3. Results and Discussion
3.1. Self-Diffusion
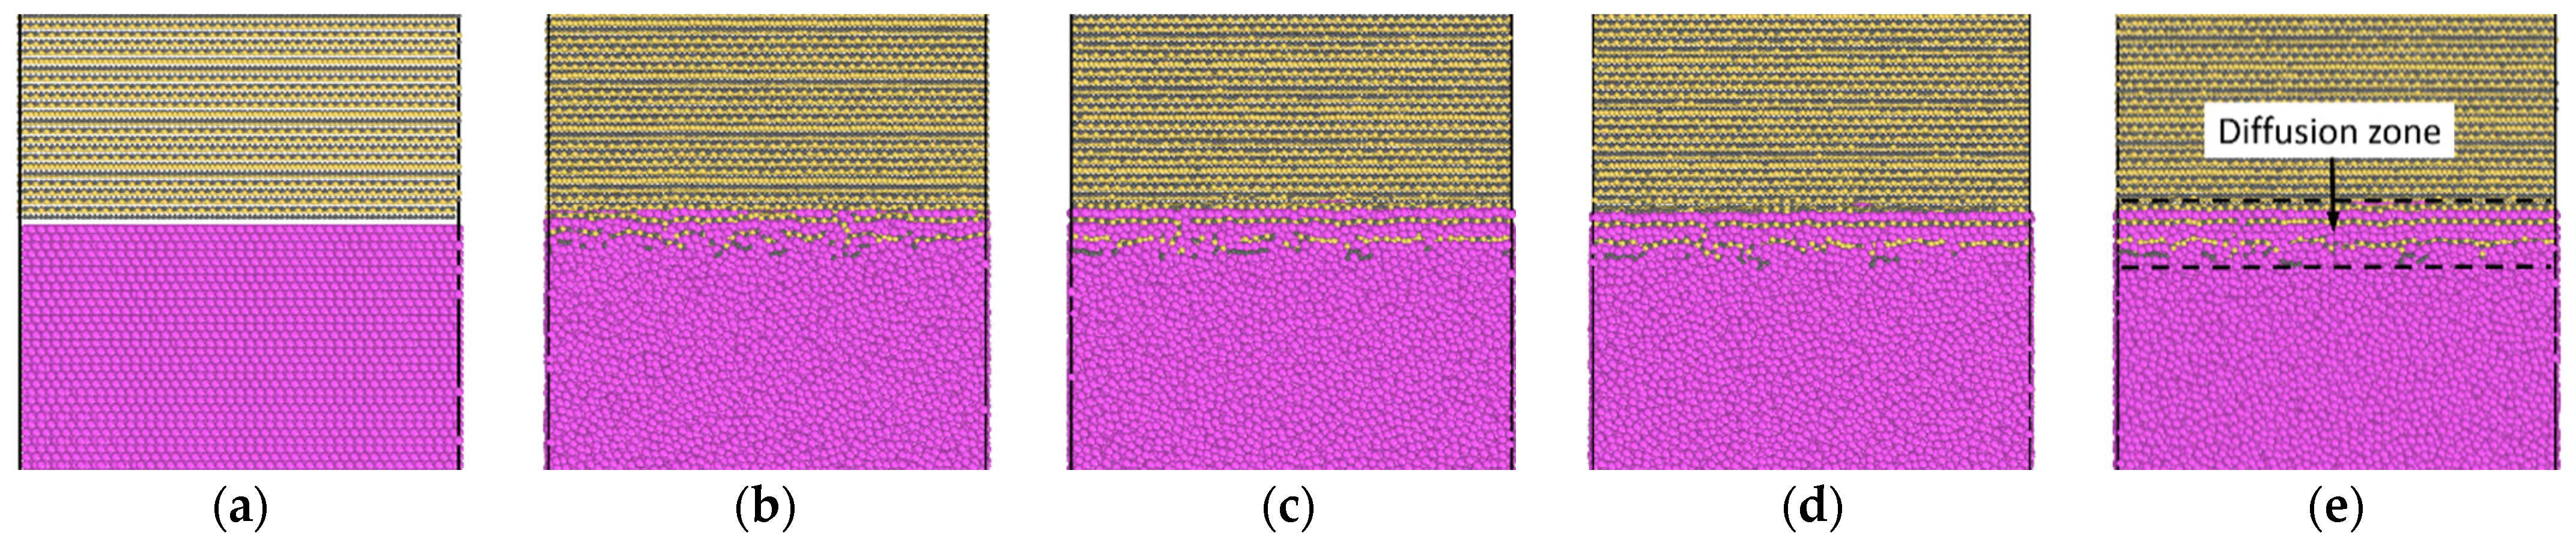
The diffusion characteristics of the SiC/Al interface are studied by heating the system to a pre-set temperature and maintaining it for 6.0 ns at this temperature. Figure 2 shows the evolution of the interface diffusion for different snapshots with 2.0 ns intervals for the C-terminated 6H–SiC/Al interface and heating up to 2000 K. Figure 2a shows the sharp interface between SiC and Al considering an initial gap equal to the C-Al bond length. It can be seen from Figure 2b that before the temperature reaches 2000 K, the Al atoms move locally near the interface because of the strong interfacial bond between Al and SiC. Hoekstra and Kohyama [35], using the ab initio pseudopotential method, showed that the C–Al bond is almost twice as strong as the Si–Al bond, and in general, the interfacial bond between the SiC and Al is stronger than the intralayer bonds within the pure aluminium. By maintaining the system at 2000 K, more atoms pass through the interface, and a thicker fuzzy interface is produced. The diffusion zone after maintaining the system at 2000 K for 6.0 ns is illustrated in Figure 2e.
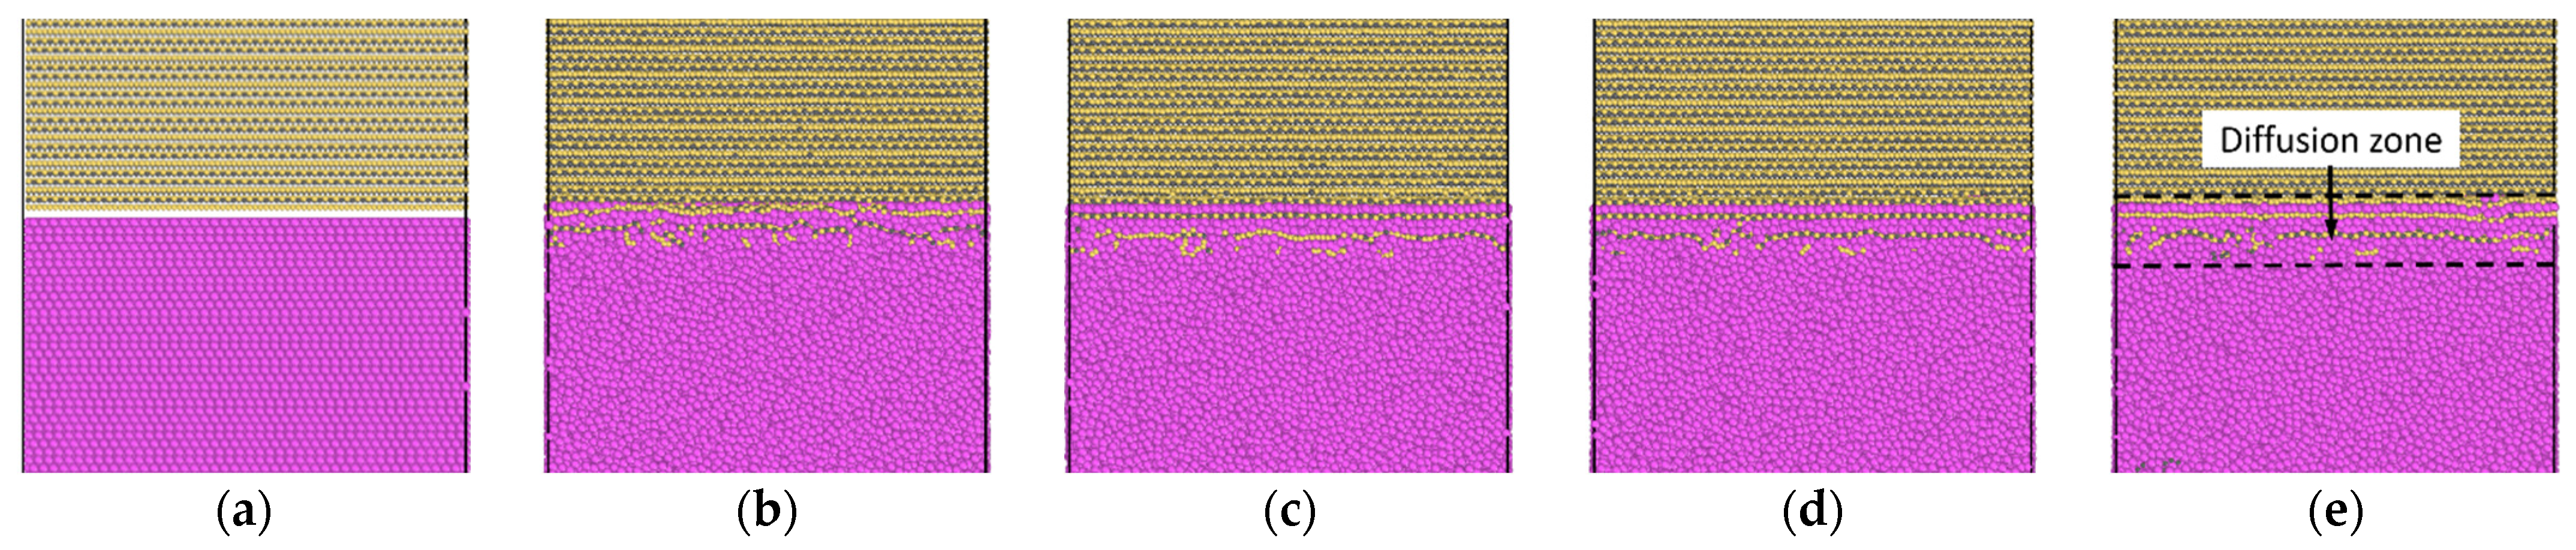
Similarly, Figure 3 shows the evolution of the interface diffusion for the C-terminated 3C–SiC/Al interface when the system is heated up to 2000 K and maintained at this temperature for 6.0 ns.
It can be seen from Figure 2 and Figure 3 that the C atoms at the interface are separated from their SiC lattice and diffuse into Al atoms, and Al atoms also diffuse into the SiC lattice and form a layered structure of SiC and Al near the interface. The thickness of this layered structure at the interface increases with the increase of the annealing time. A similar behaviour also exists at the Si-terminated interface. The Si atoms at the interface are peeled off the SiC lattice, and Al atoms diffuse into SiC and form a layered structure. The present results show that the dissolution of the first layer of Si atoms in the Si-terminated cases is faster of C atoms in the C-terminated ones. The segregation of SiC into Si and C and the dissolution of them in liquid Al at high temperatures at the interface were also observed by Sozhamannan and Prabu [15] during the preparation of their samples. The segregated Si was eventually driven in the opposite direction and slowly dissolved in liquid Al and carbon elements were left out at the interface. The dissolution of Si in liquid Al was faster compared to carbon. They observed the interface structure of α-SiC/Al utilising scanning electron microscope (SEM) analysis and found that the segregation level is increased by increasing the temperature.
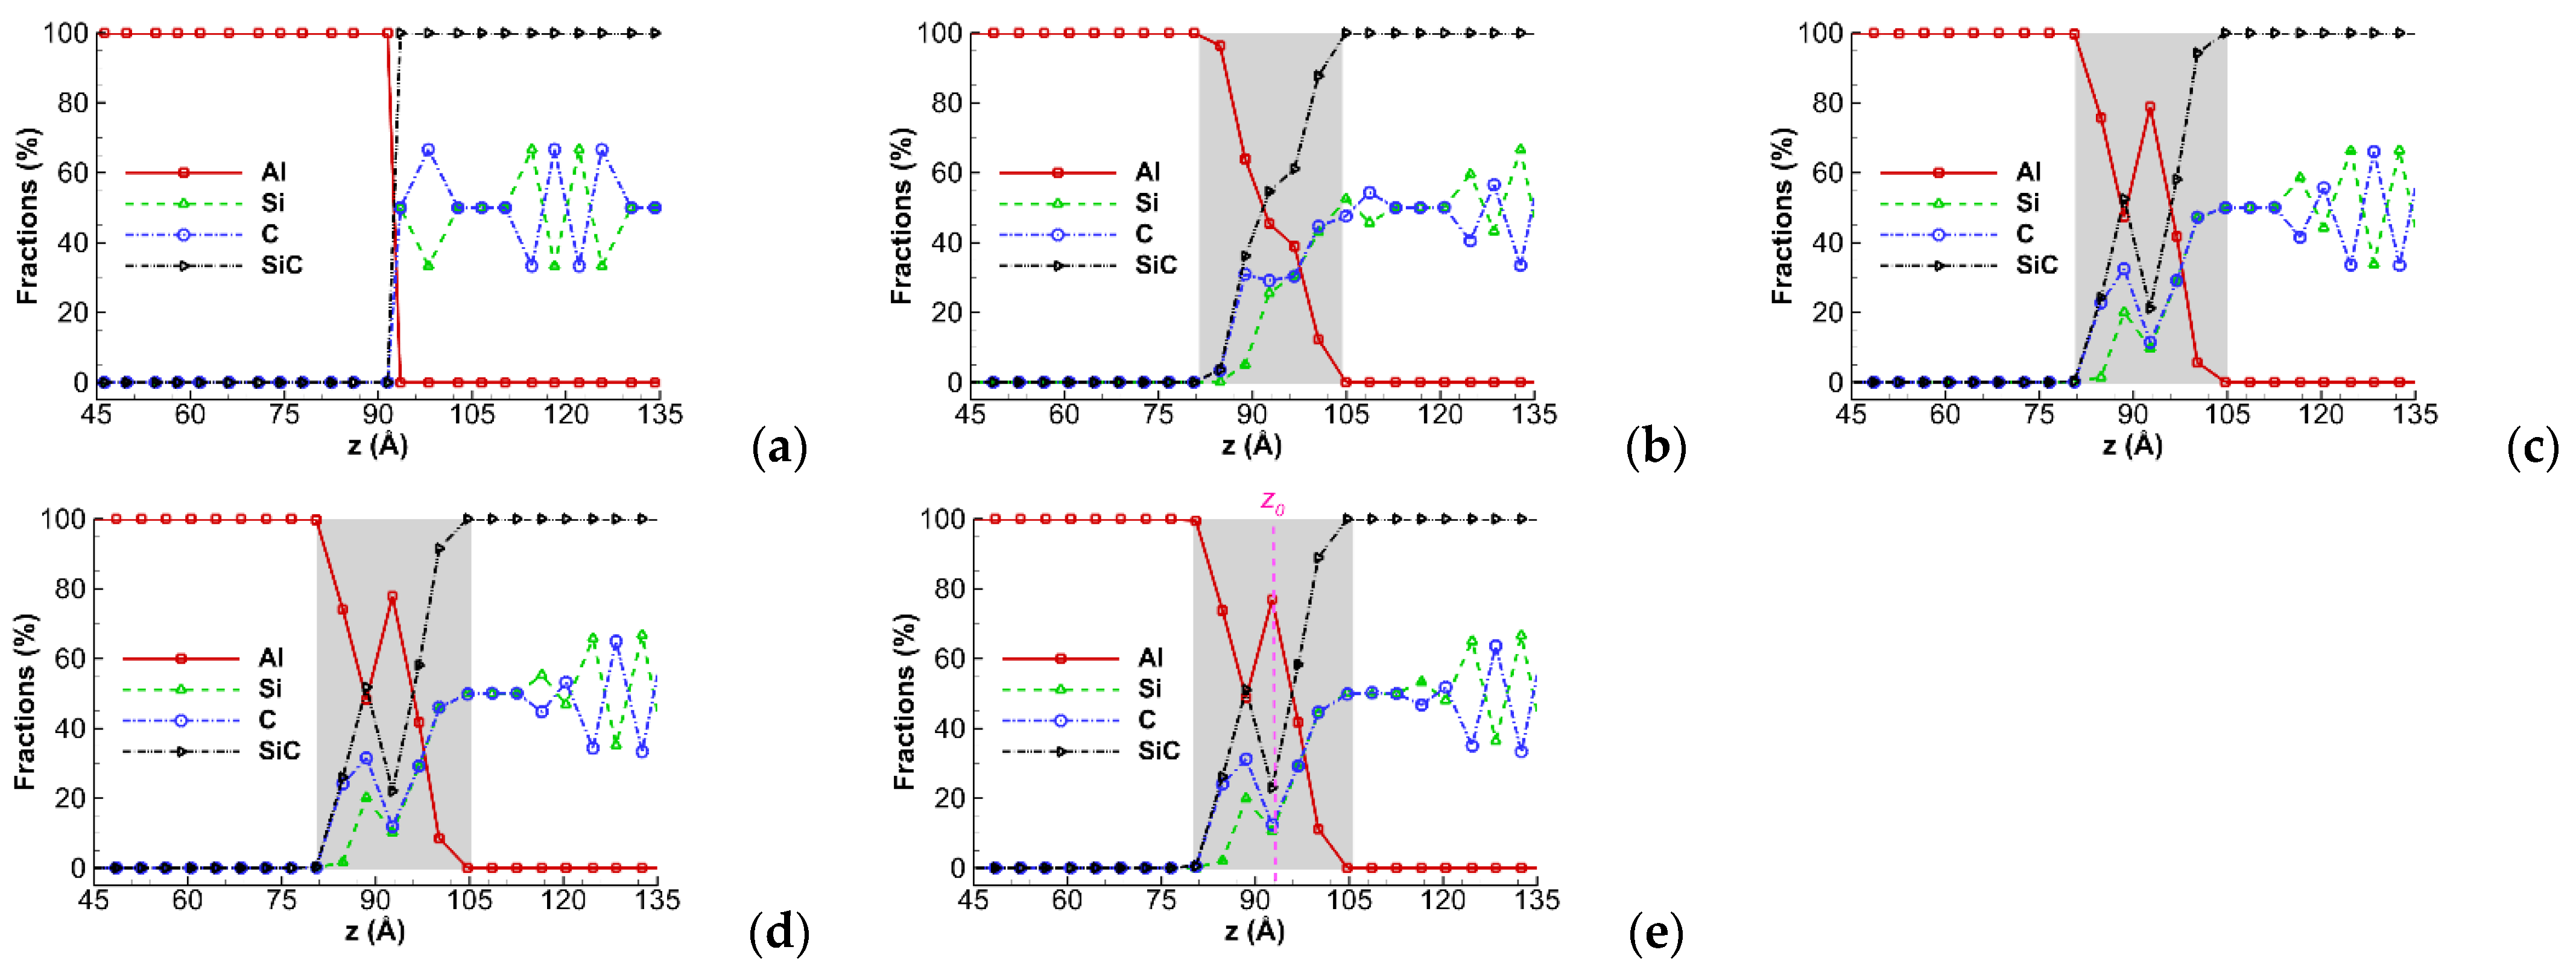
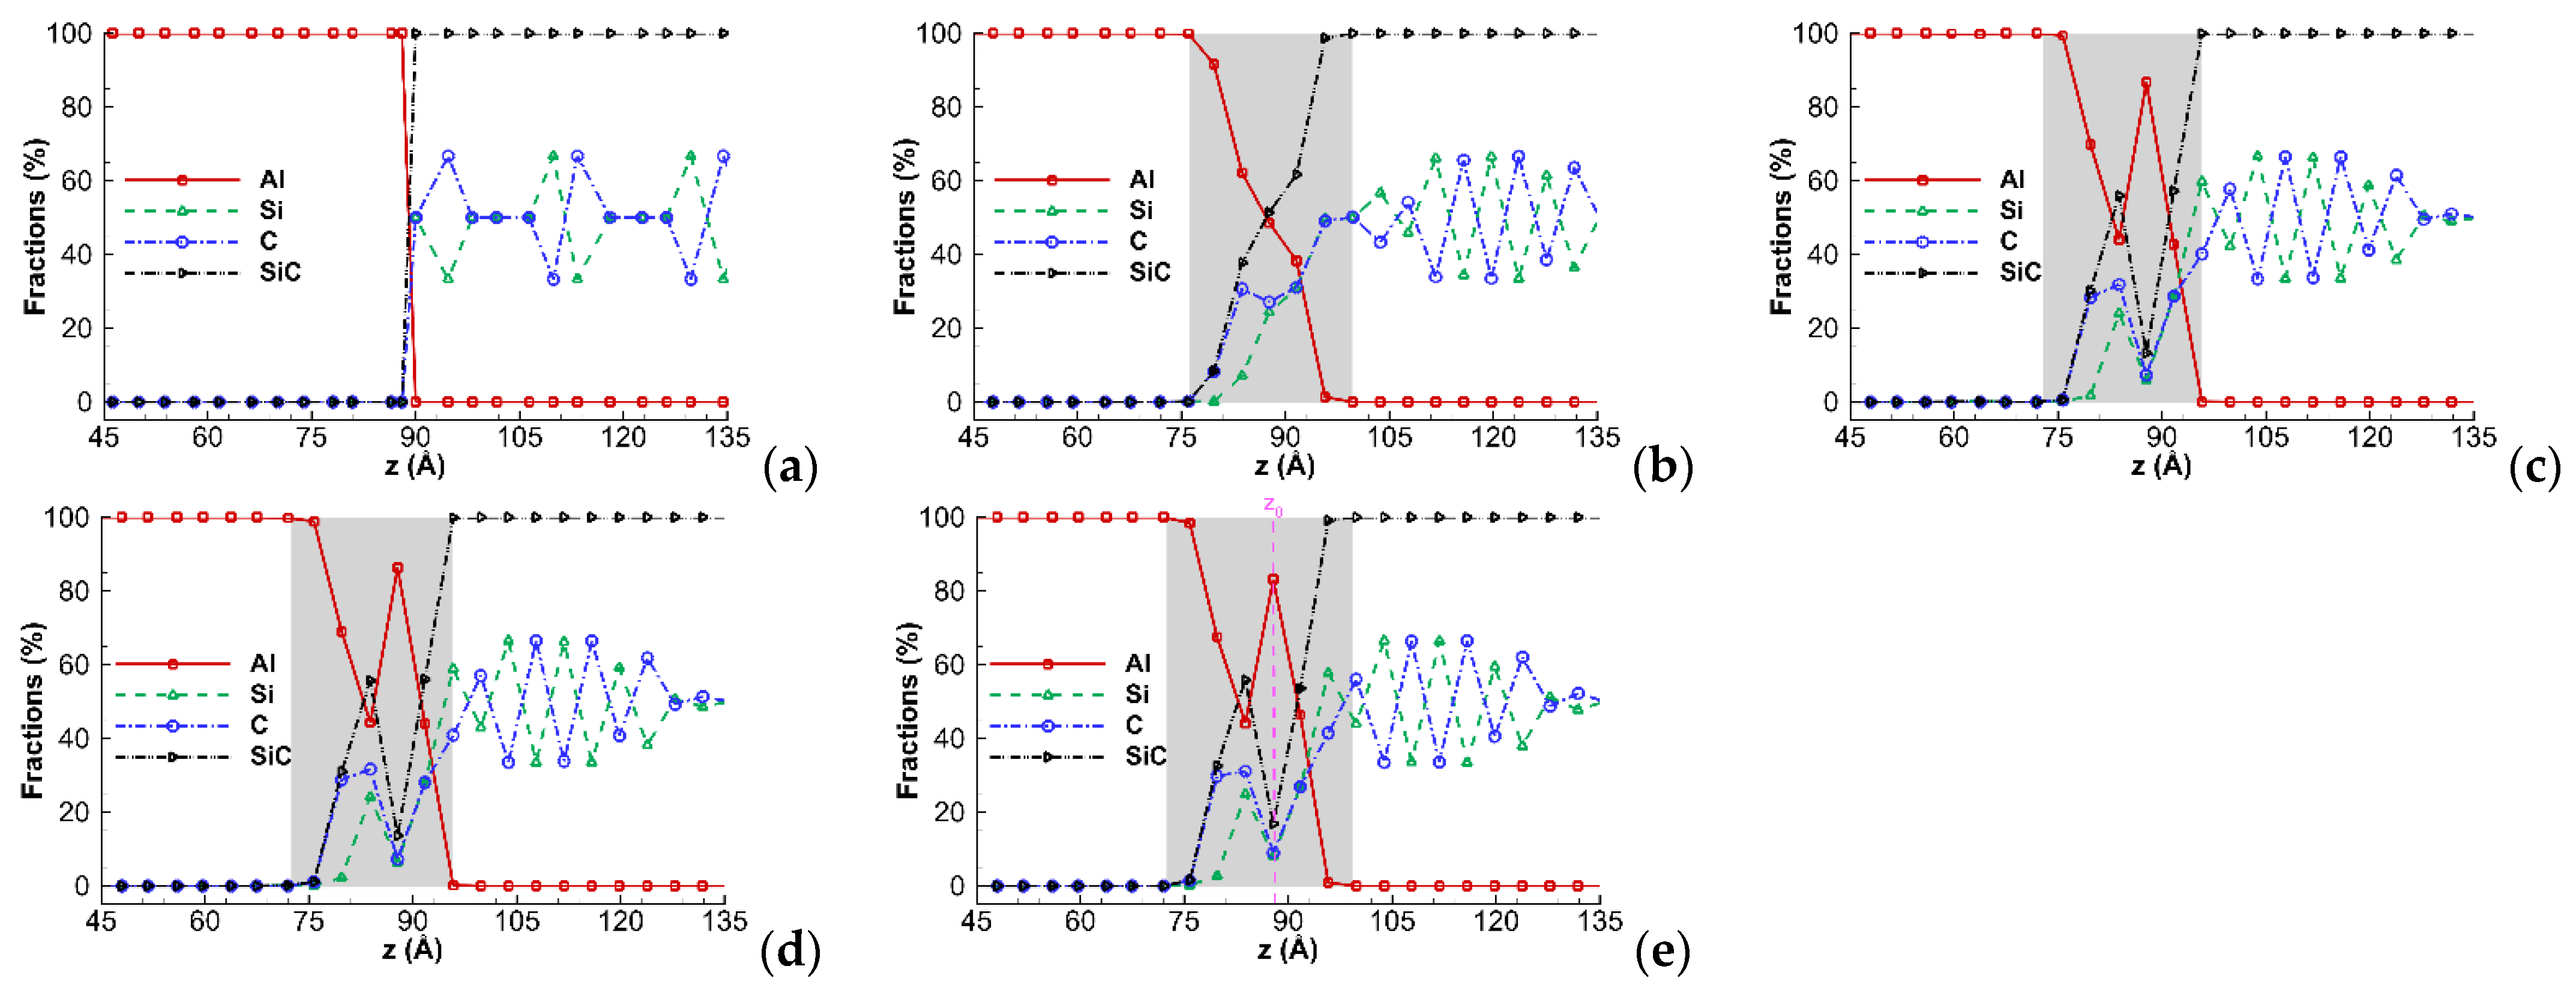
To quantitatively study the diffusion process, the concentration profiles of Al, Si, and C atoms along the z-direction, perpendicular to the interface plane, at the selected time are illustrated in Figure 4 for the C-terminated 6H–SiC/Al interface. The concentration profiles at each time are obtained by cutting the sample into thin slices of thickness 4 Å along the z-direction, and the number of each atom type are counted. This figure depicts that, as expected, the thickness of the diffusion zone increases as time passes and reaches 20 Å after maintaining the system at a temperature of 2000 K for 6.0 ns. Figure 5 also shows similar results for the C-terminated 3C–SiC/Al interface. The thickness of the diffusion zone reaches 23 Å after maintaining the system at a temperature of 2000 K for 6.0 ns.
The concentration profiles for the Si-terminated interfaces, which are not presented here for the sake of brevity, reveal that there is no significant difference between the diffusion zone thicknesses in the Si- and C-terminated samples. A similar conclusion was drawn by Soloviev et al. [16] in their experimental observations.
The TEM micrographs of the SiC/Al interface and the X-ray data for the Al and SiC profiles at the interface presented by Romero and Arsennault [36] showed interdiffusion of Al in SiC at temperatures above 650 °C, which is qualitatively comparable with the present findings. Furthermore, Tajima et al. [9] obtained profiles of Al near the interface of SiC/Al using secondary ion mass spectrometry that showed the depth of Al diffusion which can be qualitatively compared with the concentration profiles of the present study. The investigation of Usov et al. [37] is another study that showed the diffusion layer at the SiC/Al interface. They presented the SIMS depth profiles of Al implanted into 6H–SiC and cross-sectional TEM images of 6H–SiC samples implanted with Al. Müting et al. [17] also discovered that various diffusion mechanisms change the initial implantation profile in terms of the spatial distribution and doping concentration during post-implantation annealing of implanted Al dopants in 4H–SiC at 1650 °C for 30 min. The SIMS measurements were taken before and after the annealing process to monitor the aluminium concentration. All these experimental observations confirm Al diffusion in SiC at high annealing temperatures, which agree qualitatively with the current findings.
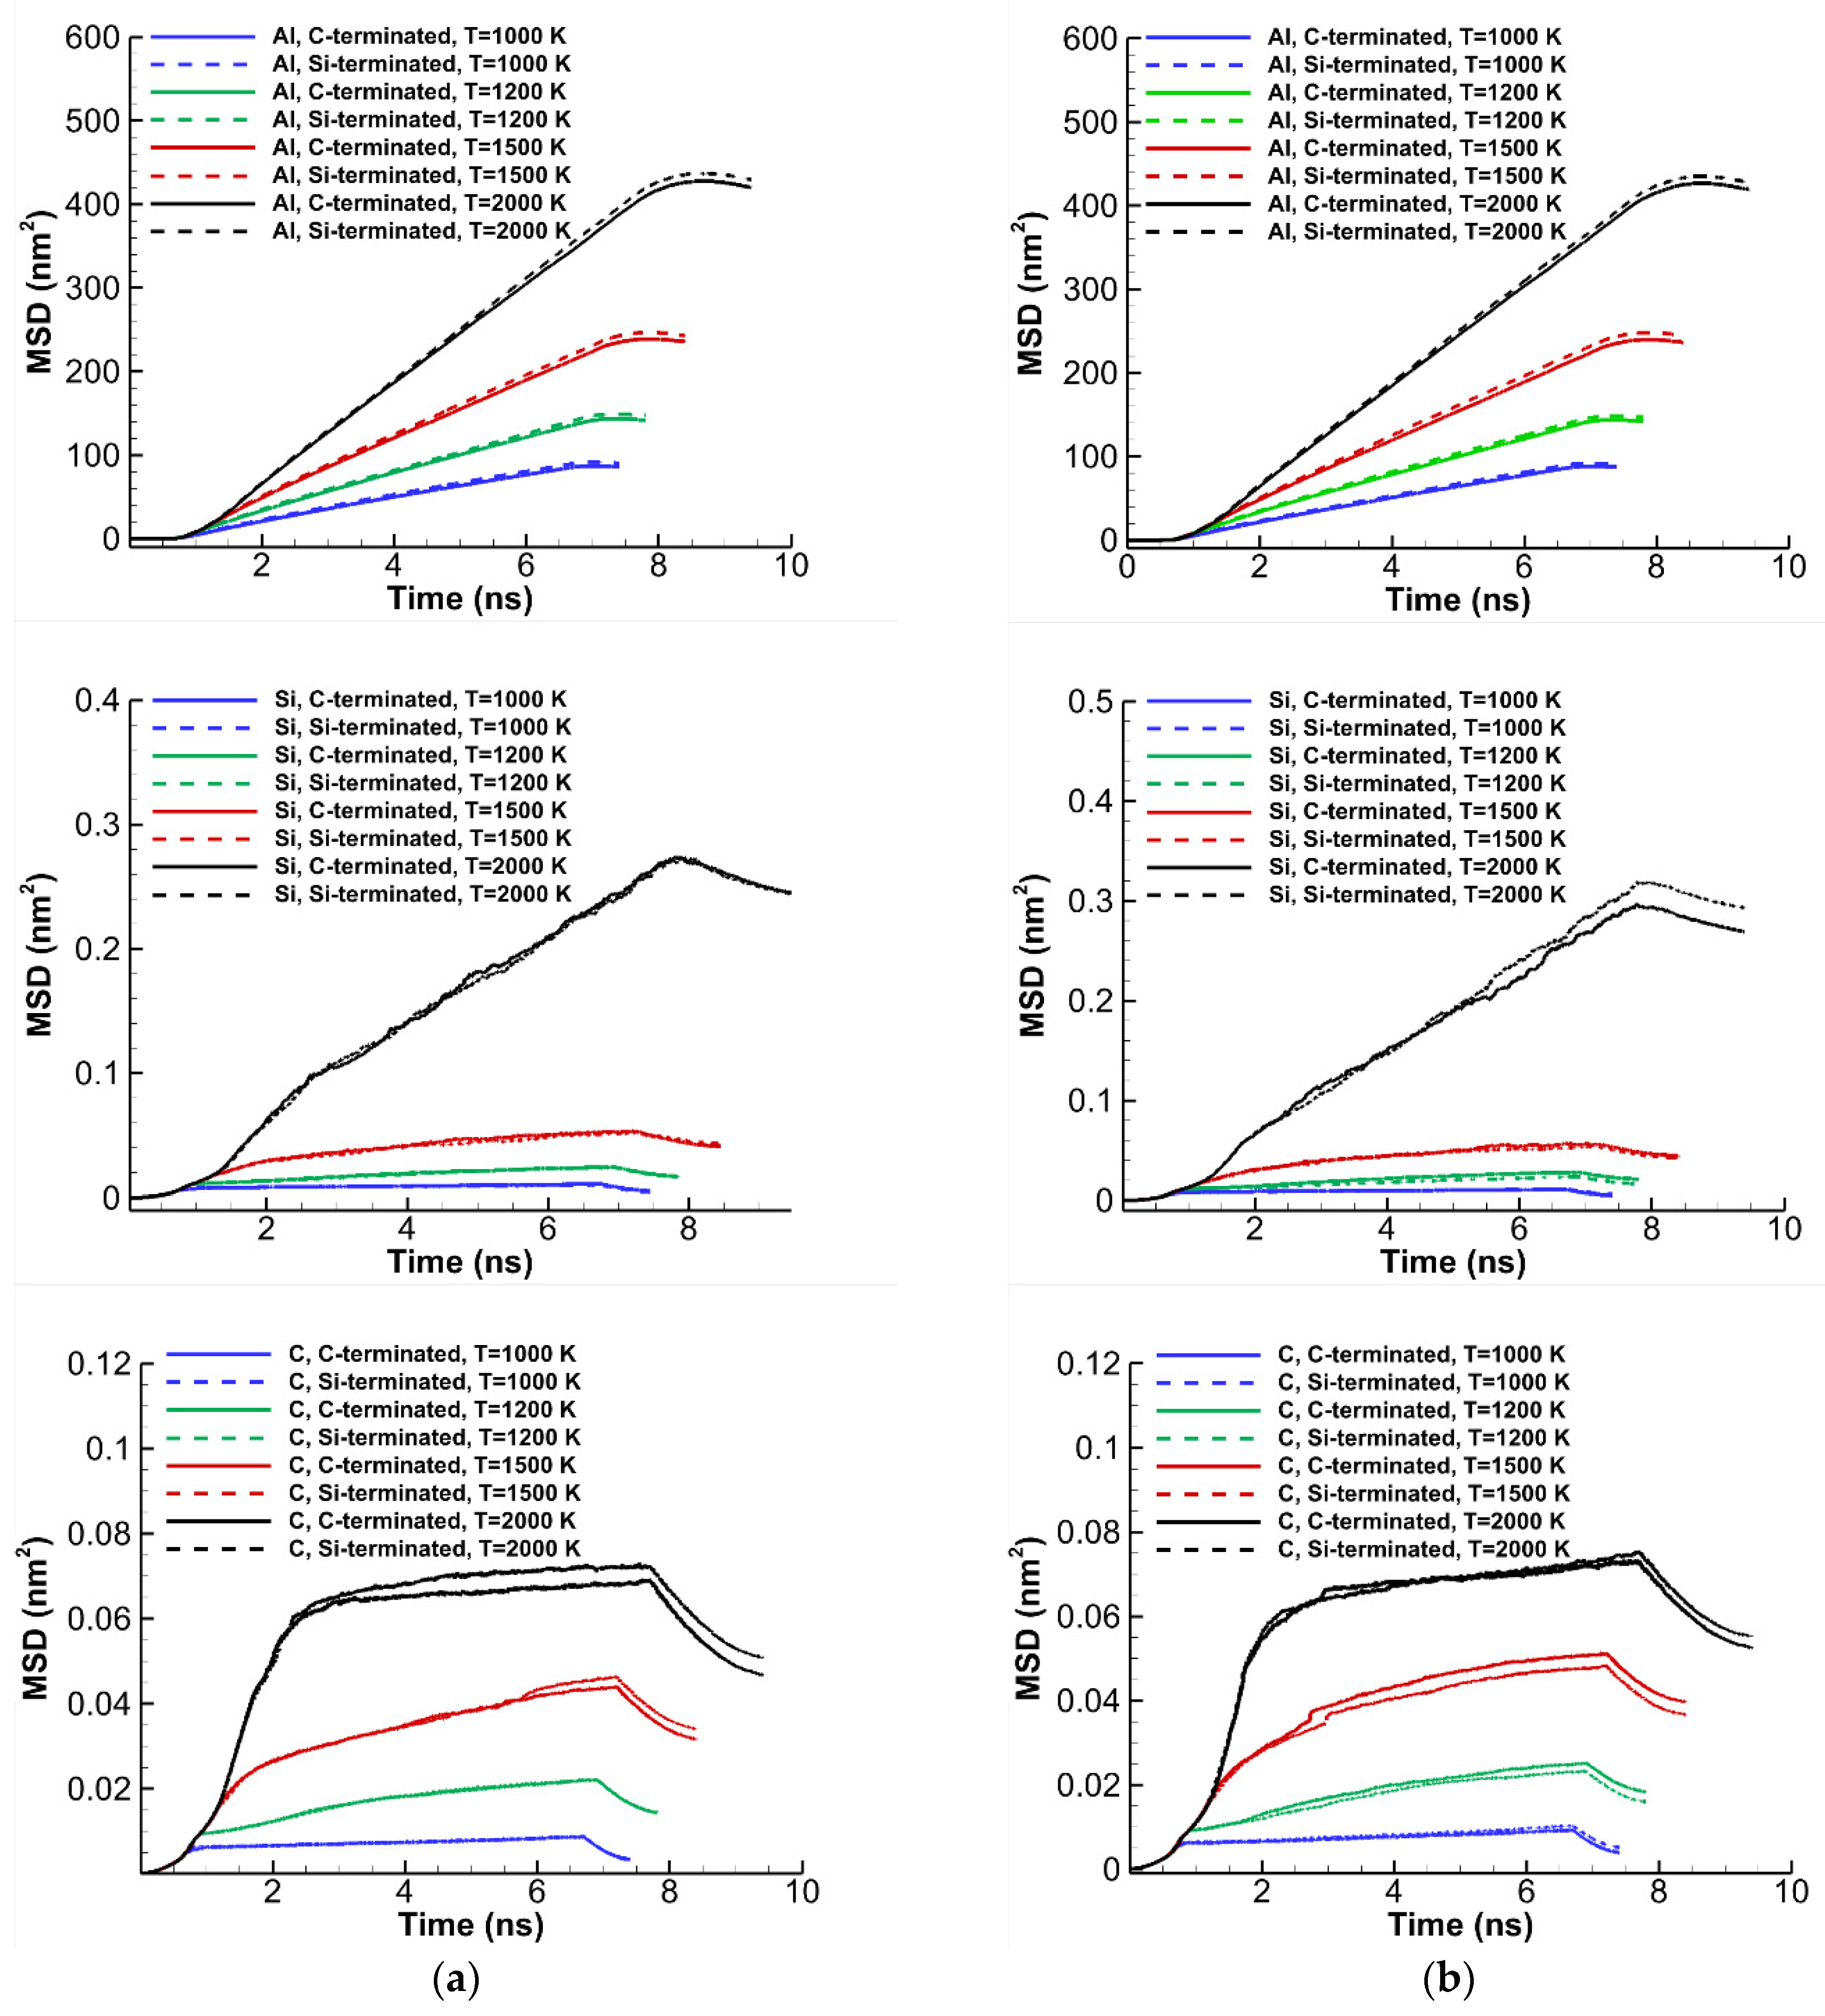
The self-diffusion coefficients are determined from the slope of the mean square displacements (MSDs) versus time as:
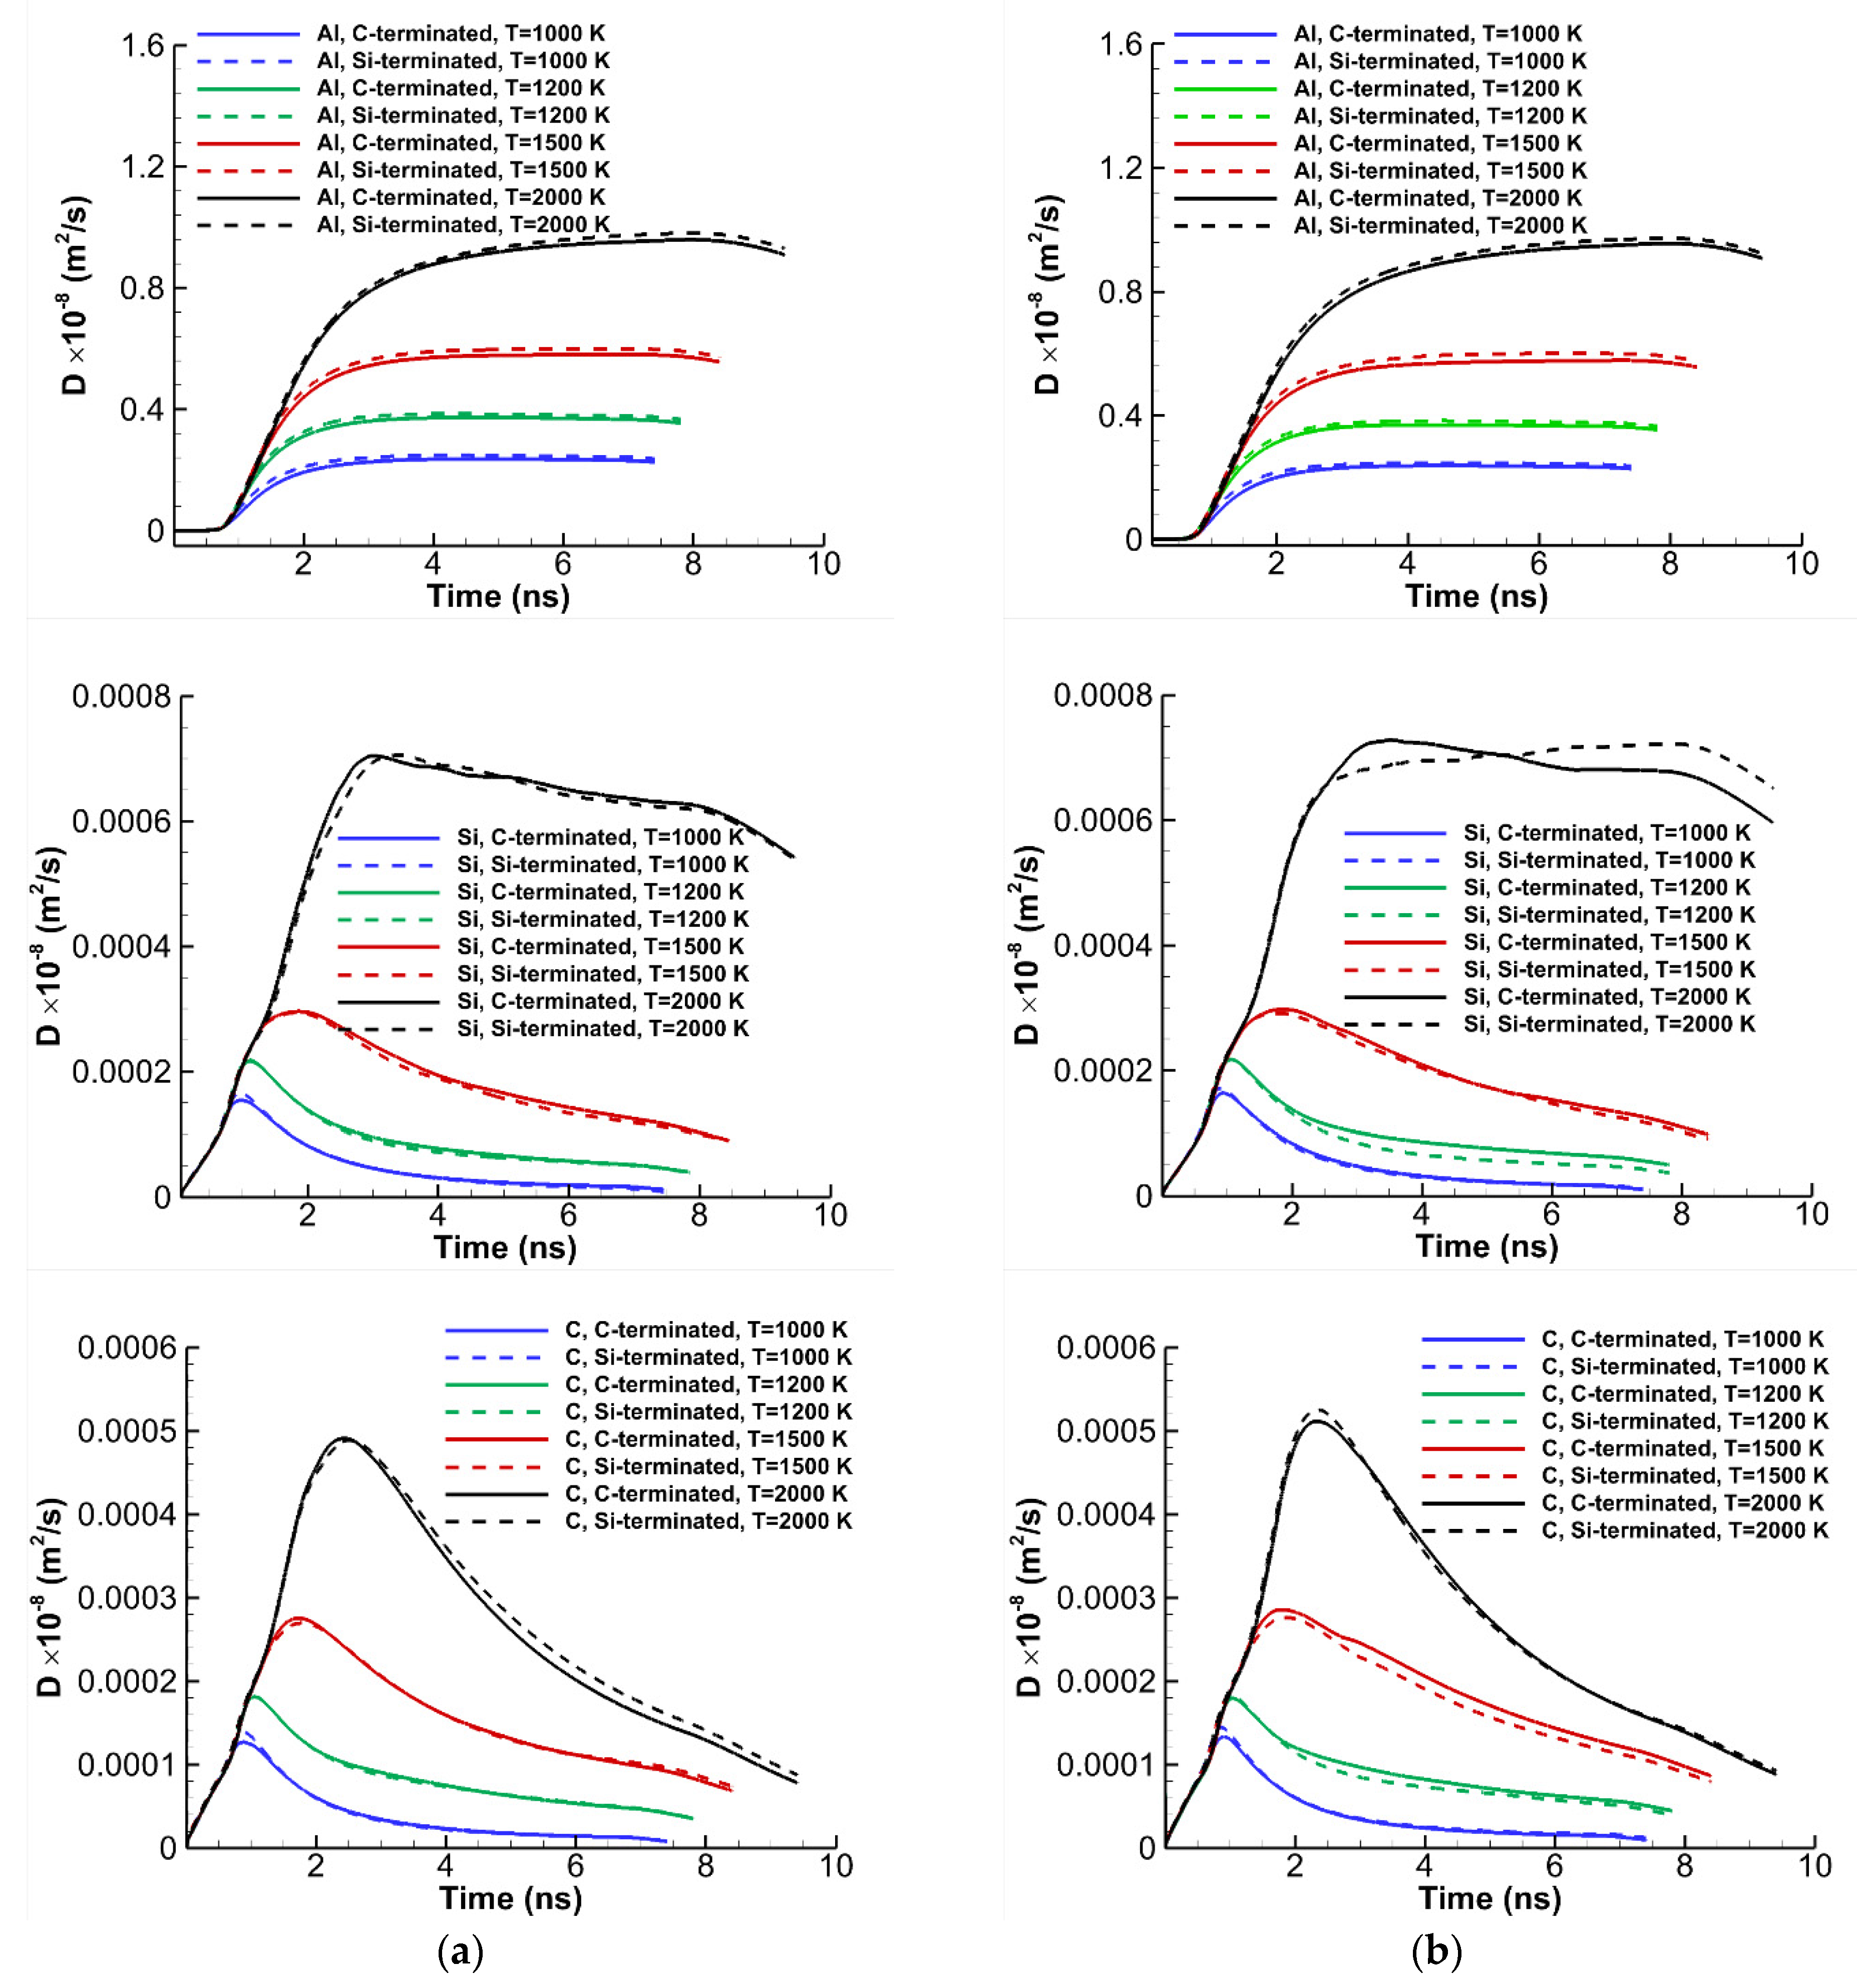
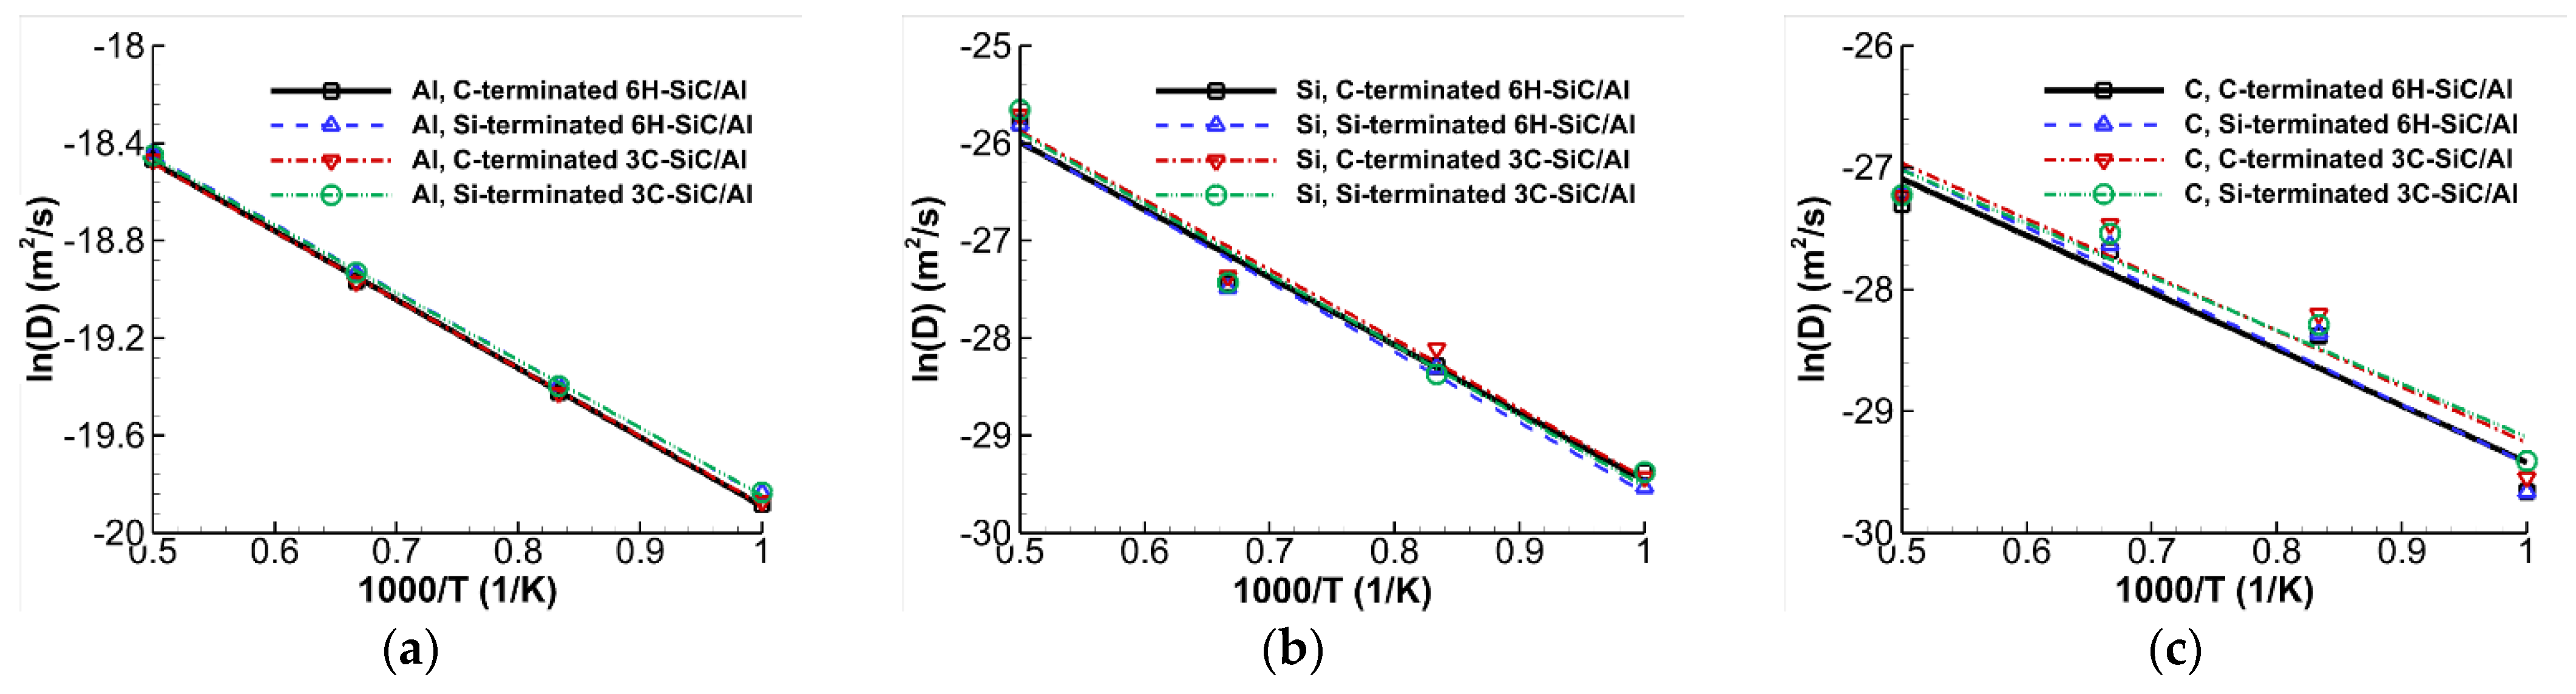
where d is the system’s dimensionality, N is the number of atoms, and r is their coordinates. In Equation (6), denotes the average over all atoms of the same type. The time histories of the MSD of Al, Si, and C atoms for different temperatures are illustrated in Figure 6. The time in this figure is started when the systems are heated from 300 K to the pre-set temperature. It can be seen that the MSDs increase with increasing temperature and time before cooling the samples. Using Equation (6) and the MSD results, the variations of self-diffusion coefficients of atoms are plotted in Figure 7 for various temperatures and times. It is worth mentioning that the self-diffusion coefficients of Al increase rapidly from 0.0 to 2.0 ns and then reach almost constant values at 6.0 ns. To compare the self-diffusion of atoms in various models more easily, Figure 8 displays the variations of self-diffusion coefficients versus temperature for the C- and Si-terminated 6H–SiC/Al and 3C–SiC/Al interfaces. The self-diffusion coefficient is a little larger for the 3C–SiC/Al compared to the 6H–SiC/Al. This figure also clearly indicates that, as expected, the self-diffusion coefficient of Al is larger than those of Si and C atoms at the same temperature. By fitting the Arrhenius equation to Figure 8, the activation energy Q and pre-exponential factor D0 of atoms can be determined, which are presented in Table 2. It can be seen that the activation energy of Si atoms is higher than those of C and Al atoms. Additionally, in terms of self-diffusion, there is little distinction between the 6H–SiC/Al and 3C–SiC/Al systems.
3.2. Interdiffusion
For a binary system in an isothermal condition, the interdiffusion flux of component i and its concentration gradient is given by Fick’s law. However, for interdiffusion of a multi-component system containing n components, Onsager’s formalism [38,39] of Fick’s law can be expressed as:
where is the interdiffusion coefficients and Ci is the mole fraction of component i. For a closed system, the number of independent components is only (n − 1). Therefore, for the present ternary system, four independent interdiffusion coefficients and are required to describe the system’s behaviour.
The Boltzmann–Matano [40,41] method can be used for the present ternary system to calculate the four interdiffusion coefficients. The interdiffusion fluxes for each component at time t can be determined from the concentration profiles as [42]:
where and are the mole fraction of component i at the bottom and top terminal ends of the diffusion couple, respectively, and z0 is the position of the Matano plane. The Matano’s plane position, assuming , can be determined as follows:
In this study, the average ternary interdiffusion coefficients are estimated by the proposed method by Dayananda and Sohn [18] using only a single diffusion couple. They showed that the average values for the main and cross-interdiffusion coefficients are consistent with those determined by the Boltzmann–Matano analysis in the diffusion zone.
By applying the following equations to any two components in a ternary system, four equations can be obtained [18]:
From these equations, four average ternary interdiffusion coefficients (main and cross)— and – can be determined, which are treated as constants over the compositional range. By selecting nonlinear parts of the profiles and , we can ensure that the four equations are independent [18]. The calculated interdiffusion coefficients for each of the couples should satisfy the following stability requirements [43]:
In the present study, the Gaussian error function is used to fit the concentration curve for each component i:
where p1i to p4i are the fit parameters to be determined for each component. The curve fit is performed, and the coefficients are obtained in each time step. The fitted curves are employed in Equations (10) and (11) for two components of the present ternary system to obtain the four independent interdiffusion constants. The Boltzman function [44] is also used for fitting the concentration curves and the interdiffusion coefficients were found to be very close to those reported here.
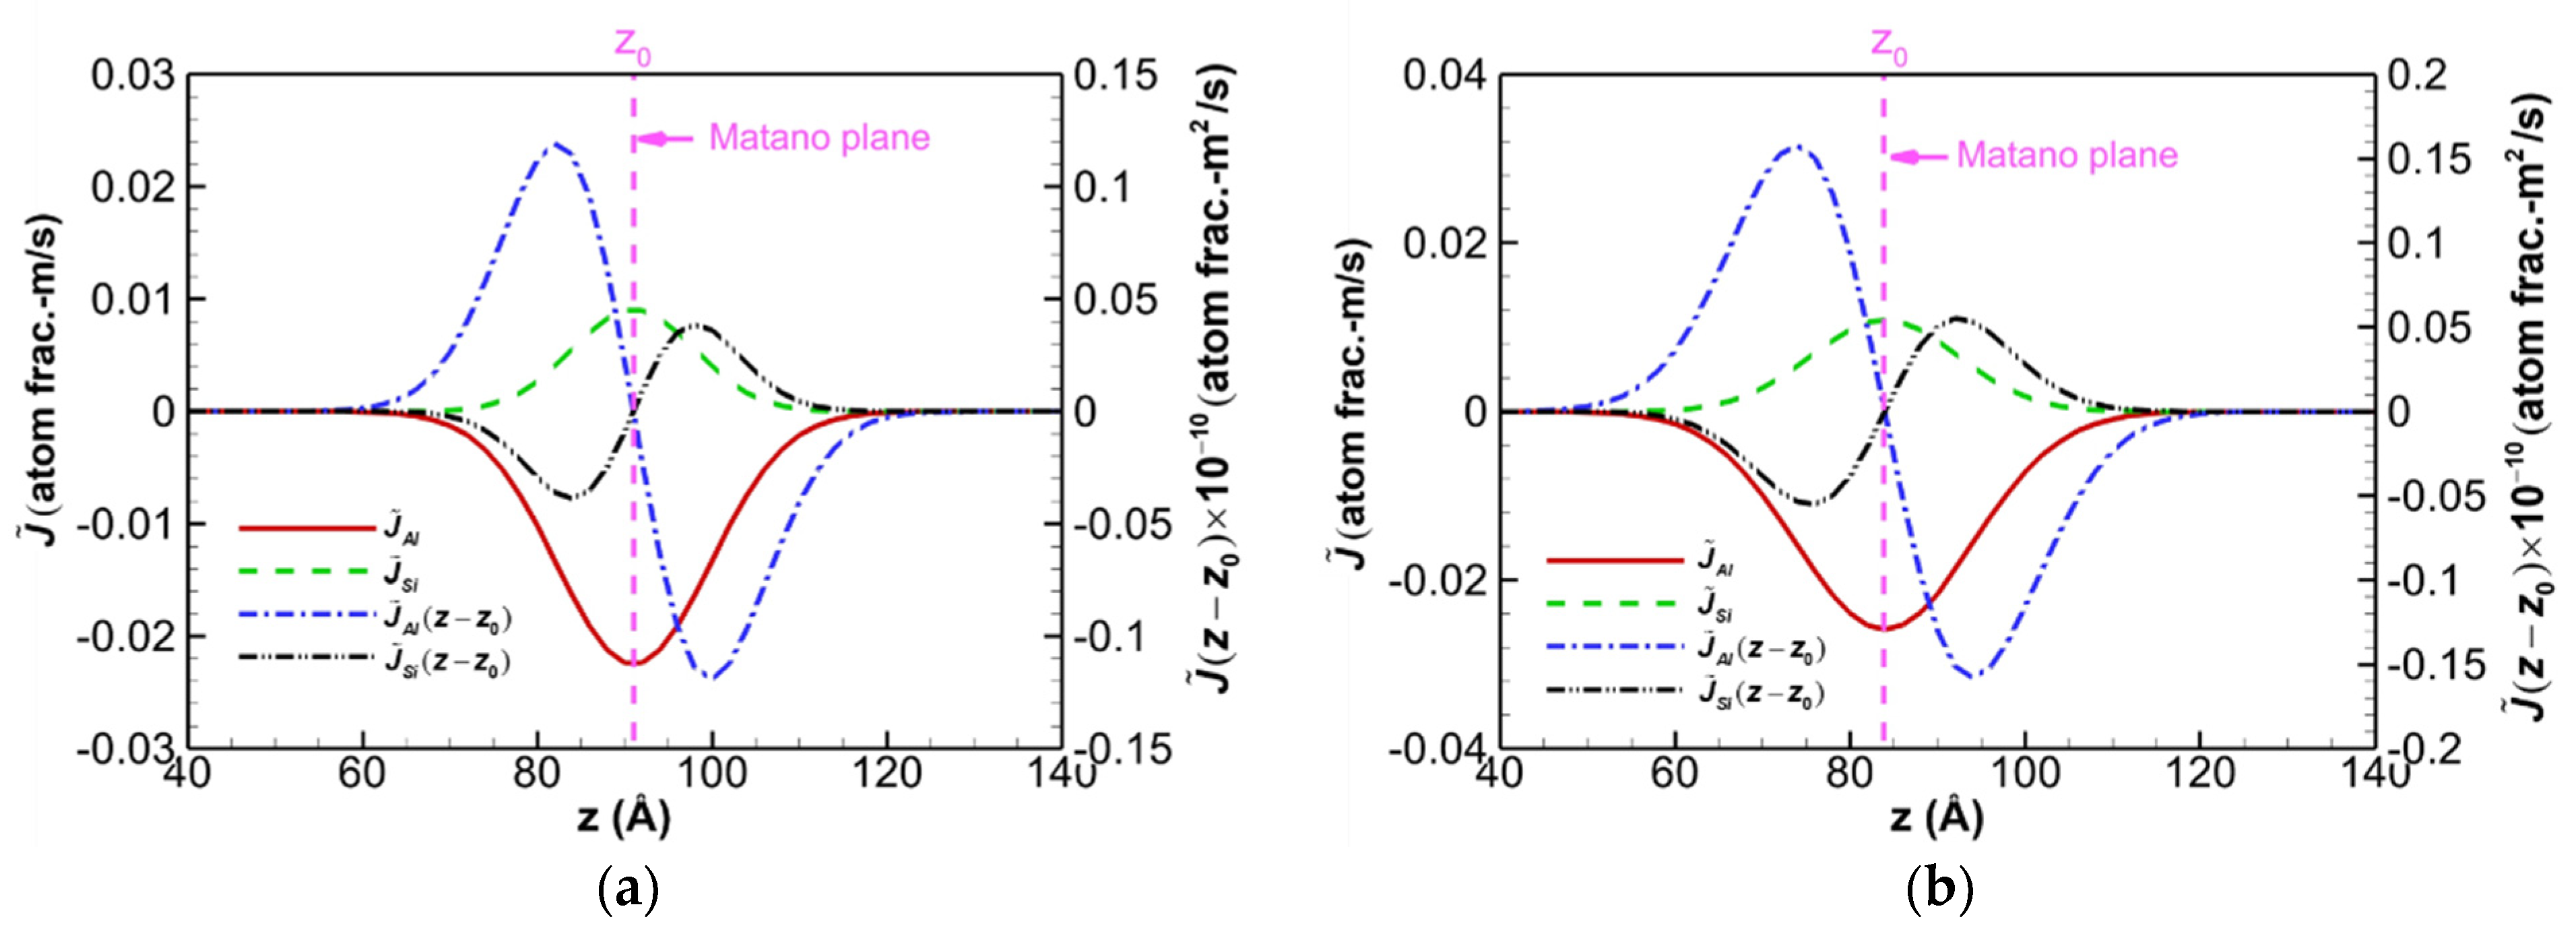
Figure 9 shows, for example, the profiles of the interdiffusion flux and for the C-terminated 6H–SiC/Al and 3C–SiC/Al diffusion couples after maintaining the systems at 2000 K for 6 ns. The Matano plane is marked as z0 in Figure 4e, Figure 5e and Figure 9 based on Equation (9). In the analysis, the Al and Si atoms are chosen as independent variables, and the C atom is selected as the dependent variable. It can be seen that the absolute of corresponds to a relative maximum of the interdiffusion flux at the Matano plane. Moreover, similar variations of the profiles are seen to exist for the two diffusion couples. It is seen that Al atoms exhibit greater interdiffusion fluxes than Si atoms in both diffusion systems, as predicted. The interdiffusion flux for dependent component 3 (here the C atoms) can be evaluated from the equation . Hence, it is simple to demonstrate that for both diffusion systems, the interdiffusion fluxes of C atoms are higher than those of Si atoms, but lower than those of Al atoms. Furthermore, the maxima of the interdiffusion fluxes of Al and Si in 6H–SiC/Al are about 13% and 17% smaller, respectively, than those of 3C–SiC/Al.
The average values of the main and cross-interdiffusion coefficients obtained for the Si- and C-terminated 6H–SiC/Al and 3C–SiC/Al interdiffusion couples at different annealing temperatures are presented in Table 3. These coefficients are obtained for composition ranges at the bottom and top sides of the Matano plane. It can be seen that the average interdiffusion coefficients on each side of the Matano plane are very close to each other. Also, the cross-interdiffusion coefficients are insignificant in the present ternary systems since they are one to eight orders of magnitude smaller than the main interdiffusion coefficients. It is noted here that the average values of interdiffusion coefficients approach to the true values of if the interval between z1 and z2 is sufficiently small [45]. The results in Table 3 indicate that the Si-terminated interface in the 6H-SiC/Al diffusion couple has a higher diffusivity than the C-terminated one, whereas this is not the case for the 3C–SiC/Al diffusion couple. Therefore, very different properties may result for SiC/Al metal-ceramic composites depending on the hexagonal or cubic SiC lattice structure and the surface species of the SiC when the interface is created.
It is worth mentioning that the present work was a numerical attempt to evaluate the interdiffusion of Al in SiC and obtain the composition of atoms in the diffused zone and the thickness of this region as functions of the annealing temperature and time. To ensure numerical stability, the time steps in an MD simulation must be short, typically only a few femtoseconds each. Nevertheless, most physical processes occur in much longer timescales, several orders of magnitude over our current research capabilities. To this end, it is not possible to set a period as long as experimental studies in MD analysis because of the resulting huge simulation costs. On the other hand, it is well known that the magnitude of the interdiffusion coefficient depends on the annealing time [46]. Therefore, our findings obtained through MD simulations can only be compared qualitatively to those of experimental observations.
There are some limitations in this study that need to be acknowledged here. It should be noted that the simplification made in this study was to model the interdiffusion at the interface of an ideal SiC/Al without oxygen and defects. To improve the consistency of the results with experimental research, a more realistic interface considering defects or adding oxygen or silicon to prevent the formation of aluminium carbide must be considered in future studies. The ultimate goal of this study in future work is to estimate the cohesive zone model of the diffused interface layer. To that end, the upper bound of interface strength will be obtained using this ideal interface with no defects.
4. Conclusions
In this study, extensive molecular dynamics simulations were performed to investigate diffusion bonding at the Si- and C-terminated interface of 6H–SiC/Al and 3C–SiC/Al metal-ceramic nanocomposites. The self-diffusion and interdiffusion coefficients were evaluated for various diffusion couples at 1000–2000 K annealing temperatures. The following results can be drawn from this investigation:
- Al atoms diffused into SiC during diffusion and a layered structure of Al and SiC near the interface was produced.
- The interdiffusion coefficients increased with the increasing temperature and annealing time.
- The Si-terminated interface in the 6H–SiC/Al diffusion couple had a higher diffusivity than the C-terminated one, while the opposite was true for the 3C–SiC/Al diffusion couple.
- In terms of the interdiffusion, there was no significant difference between 6H–SiC/Al and 3C–SiC/Al.
- The average ternary interdiffusion coefficients of SiC/Al systems of SiC/Al systems were obtained for the first time using the concentration profiles of atoms during diffusion.
The samples after diffusion and cooling can be used in future studies to estimate the effective mechanical properties of the fuzzy interface of SiC/Al and, therefore, the mechanical properties of SiC/Al metal-matrix composites.
Author Contributions
All authors contributed to the study conception and design. Material preparation, data collection and analysis were performed by M.T. The first draft of the manuscript was written by M.T. and all authors commented on previous versions of the manuscript. All authors have read and agreed to the published version of the manuscript.
Funding
This research was funded by the Polish National Agency for Academic Exchange (NAWA) under grant number [BPN/ULM/2021/1/00115/U/DRAFT/00001].
Data Availability Statement
Not applicable.
Acknowledgments
E.P. and T.S. acknowledges the National Science Centre, Poland, grant No. UMO 345 2019/33/B/ST8/01263. The calculations were performed at the Academic Computer Centre Cyfronet, AGH University of Science and Technology in Krakow, Poland, and at the Academic Computer Centre in Gdańsk, Poland.
Conflicts of Interest
The authors declare no conflict of interest.
References
- Ünlü, B.S. Investigation of tribological and mechanical properties Al2O3–SiC reinforced Al composites manufactured by casting or P/M method. Mater. Des. 2008, 29, 2002–2008. [Google Scholar] [CrossRef]
- Bhattacharyya, J.J.; Mitra, R. Effect of hot rolling temperature and thermal cycling on creep and damage behavior of powder metallurgy processed Al–SiC particulate composite. Mater. Sci. Eng. A 2012, 557, 92–105. [Google Scholar] [CrossRef]
- Postek, E.; Sadowski, T. Dynamic pulse sensitivity of WC/Co composite. Compos. Struct. 2018, 203, 498–512. [Google Scholar] [CrossRef]
- Postek, E.; Sadowski, T. Distributed microcracking process of WC/Co cermet under dynamic impulse compressive loading. Compos. Struct. 2018, 194, 494–508. [Google Scholar] [CrossRef]
- Zhong, J.; Chen, L.; Zhang, L. High-throughput determination of high-quality interdiffusion coefficients in metallic solids: A review. J. Mater. Sci. 2020, 55, 10303–10338. [Google Scholar] [CrossRef]
- Chang, H.C.; Le May, C.Z.; Wallace, L.F. Use of silicon carbide in high temperature transistors. In Proceedings of the Conference of Silicon Carbide, Boston, MA, USA, 2–3 April 1959; pp. 496–507. [Google Scholar]
- Mokhov, E.; Vodakov, Y.; Lomakina, G. Aluminum diffusion in silicon carbide. Fiz. Tverd. Tela 1969, 11, 519–522. [Google Scholar]
- Van Opdorp, C. Anomalous diffusion of Al into SiC. Solid·State Electron. 1971, 14, 613–625. [Google Scholar] [CrossRef]
- Tajima, Y.; Kijima, K.; Kingery, W.D. Diffusion of ion implanted aluminum in silicon carbide. J. Chem. Phys. 1982, 77, 2592–2598. [Google Scholar] [CrossRef]
- Laurent, V.; Chatain, D.; Eustathopoulos, N. Wettability of SiC by aluminium and Al-Si alloys. J. Mater. Sci. 1987, 22, 244–250. [Google Scholar] [CrossRef]
- Narciso, J.; Garcia-Cordovilla, C.; Louis, E. Reactivity of thermally oxidized and unoxidized SiC particulates with aluminium-silicon alloys. Mater. Sci. Eng. B 1992, 15, 148–155. [Google Scholar] [CrossRef]
- Rajan, T.P.D.; Pillai, R.M.; Pai, B.C. Reinforcement coatings and interfaces in aluminium metal matrix composites. J. Mater. Sci. 1998, 33, 3491–3503. [Google Scholar] [CrossRef]
- Tham, L.M.; Gupta, M.; Cheng, L. Effect of limited matrix–reinforcement interfacial reaction on enhancing the mechanical properties of aluminium–silicon carbide composites. Acta Mater. 2001, 49, 3243–3253. [Google Scholar] [CrossRef]
- Lee, J.-C.; Ahn, J.-P.; Shim, J.-H.; Shi, Z.; Lee, H.-I. Control of the interface in SiC/Al composites. Scripta Mater. 1999, 41, 895–900. [Google Scholar] [CrossRef]
- Sozhamannan, G.G.; Prabu, S.B. Influence of interface compounds on interface bonding characteristics of aluminium and silicon carbide. Mater. Charact. 2009, 60, 986–990. [Google Scholar] [CrossRef]
- Soloviev, S.I.; Gao, Y.; Khlebnikov, Y.I.; Khlebnikov, I.I.; Sudarshan, T.S. Aluminum and boron diffusion into (1-100) face SiC substrates. Mater. Sci. Forum 2002, 389–393, 557–560. [Google Scholar] [CrossRef]
- Müting, J.; Bobal, V.; Willinger, M.G.; Zadeh, A.B.; Reidt, S.; Vines, L.; Grossner, U. Spatially resolved diffusion of aluminum in 4H-SiC during postimplantation annealing. IEEE Trans. Electron Devices 2020, 67, 4360–4365. [Google Scholar] [CrossRef]
- Dayananda, M.A.; Sohn, Y.H. A new analysis for the determination of ternary interdiffusion coefficients from a single diffusion couple. Metall. Mater. Trans. A 1999, 30, 535–543. [Google Scholar] [CrossRef]
- Plimpton, S. Fast parallel algorithms for short-range molecular dynamics. J. Comput. Phys. 1995, 117, 1–19. [Google Scholar] [CrossRef] [Green Version]
- Stukowski, A. Visualization and analysis of atomistic simulation data with OVITO–the Open Visualization Tool. Modell. Simul. Mater. Sci. Eng. 2009, 18, 015012. [Google Scholar] [CrossRef]
- Mishin, Y.; Farkas, D.; Mehl, M.J.; Papaconstantopoulos, D.A. Interatomic potentials for monoatomic metals from experimental data and ab initio calculations. Phy. Rev. B 1999, 59, 3393–3407. [Google Scholar] [CrossRef] [Green Version]
- Tersoff, J. Modeling solid-state chemistry: Interatomic potentials for multicomponent systems. Phy. Rev. B 1989, 39, 5566–5568. [Google Scholar] [CrossRef] [PubMed]
- Tersoff, J. Carbon defects and defect reactions in silicon. Phys. Rev. Lett. 1990, 64, 1757–1760. [Google Scholar] [CrossRef] [PubMed]
- Erhart, P.; Albe, K. Analytical potential for atomistic simulations of silicon, carbon, and silicon carbide. Phy. Rev. B 2005, 71, 035211. [Google Scholar] [CrossRef] [Green Version]
- Dandekar, C.R.; Shin, Y.C. Molecular dynamics based cohesive zone law for describing Al–SiC interface mechanics. Compos. Part A 2011, 42, 355–363. [Google Scholar] [CrossRef]
- Zhao, H.; Chen, N. An inverse adhesion problem for extracting interfacial pair potentials for the Al(0 0 1)/3C–SiC(0 0 1) interface. Inverse Probl. 2008, 24, 035019. [Google Scholar] [CrossRef]
- Purja Pun, G.P.; Yamakov, V.; Mishin, Y. Interatomic potential for the ternary Ni–Al–Co system and application to atomistic modeling of the B2–L10 martensitic transformation. Modell. Simul. Mater. Sci. Eng. 2015, 23, 065006. [Google Scholar] [CrossRef] [Green Version]
- Vallin, J.; Mongy, M.; Salama, K.; Beckman, O. Elastic constants of aluminum. J. Appl. Phys. 1964, 35, 1825–1826. [Google Scholar] [CrossRef]
- Vashishta, P.; Kalia, R.K.; Nakano, A.; Rino, J.P. Interaction potential for silicon carbide: A molecular dynamics study of elastic constants and vibrational density of states for crystalline and amorphous silicon carbide. J. Appl. Phys. 2007, 101, 103515. [Google Scholar] [CrossRef] [Green Version]
- Feldman, D.W.; Parker, J.H.; Choyke, W.J.; Patrick, L. Phonon dispersion curves by Raman scattering in SiC, polytypes 3C, 4H, 6H, 15R, and 21R. Phys. Rev. 1968, 173, 787–793. [Google Scholar] [CrossRef]
- Li, S.; Arsenault, R.; Jena, P. Quantum chemical study of adhesion at the SiC/Al interface. J. Appl. Phys. 1988, 64, 6246–6253. [Google Scholar] [CrossRef]
- Luo, X.; Qian, G.; Wang, E.G.; Chen, C. Molecular-dynamics simulation of Al/SiC interface structures. Phy. Rev. B 1999, 59, 10125–10131. [Google Scholar] [CrossRef]
- Geng, L.; Zhang, J.; Meng, Q.-C.; Yao, C.-K. Side-surface structure of a commercial β-silicon carbide whisker. J. Am. Ceram. Soc. 2002, 85, 2864–2866. [Google Scholar] [CrossRef]
- Vedeneyev, V.T. Bond Energies Ionization Potentials and Electron Affinities; Edward Arnold Publishers: London, UK, 1966. [Google Scholar]
- Hoekstra, J.; Kohyama, M. Ab initio calculations of the β-SiC(001)/Al interface. Phy. Rev. B 1998, 57, 2334–2341. [Google Scholar] [CrossRef]
- Romero, J.C.; Arsenault, R.J. Anomalous penetration of Al into SiC. Acta Metall. Mater. 1995, 43, 849–857. [Google Scholar] [CrossRef]
- Usov, I.; Suvorova, A.; Sokolov, V.; Kudryavtsev, Y.A.; Suvorov, A. Transient enhanced diffusion of aluminum in SiC during high temperature ion implantation. J. Appl. Phys. 1999, 86, 6039–6042. [Google Scholar] [CrossRef]
- Onsager, L. Reciprocal relations in irreversible processes. I. Phys. Rev. 1931, 37, 405. [Google Scholar] [CrossRef]
- Onsager, L. Reciprocal relations in irreversible processes. II. Phys. Rev. 1931, 38, 2265. [Google Scholar] [CrossRef] [Green Version]
- Boltzmann, L. Zur integration der diffusionsgleichung bei variabeln diffusionscoefficienten. Ann. Phys. 1894, 289, 959–964. [Google Scholar] [CrossRef] [Green Version]
- Matano, C. On the relation between diffusion-coefficients and concentrations of solid metals. Jpn. J. Phys. 1933, 8, 109–113. [Google Scholar]
- Kim, C.W.; Dayananda, M.A. Zero-flux planes and flux reversals in the Cu-Ni-Zn System at 775 °C. Metall. Trans. A 1984, 15, 649–659. [Google Scholar] [CrossRef]
- Kirkaldy, J.S.; Young, D.J. Diffusion in the condensed state. In The Institute of Metals; Carlton House Terrace: London, UK, 1987. [Google Scholar]
- Wei, M.; Zhang, L. Application of distribution functions in accurate determination of interdiffusion coefficients. Sci. Rep. 2018, 8, 5071. [Google Scholar] [CrossRef] [PubMed] [Green Version]
- Cermak, J.; Rothova, V. Concentration dependence of ternary interdiffusion coefficients in Ni3Al/Ni3Al–X couples with X=Cr, Fe, Nb and Ti. Acta Mater. 2003, 51, 4411–4421. [Google Scholar] [CrossRef]
- Olaye, O.; Ojo, O.A. Time variation of concentration-dependent interdiffusion coefficient obtained by numerical simulation analysis. Materialia 2021, 16, 101056. [Google Scholar] [CrossRef]
Figure 1.
Schematic view of the Si-terminated 6H–SiC/Al interface model for the MD simulations.

Figure 2.
Cross-sectional views of the atomic configurations of C-terminated 6H–SiC/Al interface. (a) Atomic structure at 300 K before relaxation and the configuration after maintaining the system at 2000 K for (b) 0 ns, (c) 2 ns, (d) 4 ns, and (e) 6 ns.
Figure 2.
Cross-sectional views of the atomic configurations of C-terminated 6H–SiC/Al interface. (a) Atomic structure at 300 K before relaxation and the configuration after maintaining the system at 2000 K for (b) 0 ns, (c) 2 ns, (d) 4 ns, and (e) 6 ns.

Figure 3.
Cross-sectional views of the atomic configurations of C-terminated 3C–SiC/Al interface. (a) Atomic structure at 300 K before relaxation and the configuration after maintaining the system at 2000 K for (b) 0 ns, (c) 2 ns, (d) 4 ns, and (e) 6 ns.
Figure 3.
Cross-sectional views of the atomic configurations of C-terminated 3C–SiC/Al interface. (a) Atomic structure at 300 K before relaxation and the configuration after maintaining the system at 2000 K for (b) 0 ns, (c) 2 ns, (d) 4 ns, and (e) 6 ns.

Figure 4.
Concentration profiles of Al, Si, and C atoms along the z-direction during interdiffusion of the C-terminated 6H–SiC/Al interface. The grey zone in the figures indicates the diffusion zone and its thickness. (a) Atomic structure at 300 K before relaxation and the configuration after maintaining the system at 2000 K for (b) 0 ns, (c) 2 ns, (d) 4 ns, and (e) 6 ns.

Figure 5.
Concentration profiles of Al, Si, and C atoms along the z-direction during interdiffusion of the C-terminated 3C–SiC/Al interface. The grey zone in the figures indicates the diffusion zone and its thickness. (a) Atomic structure at 300 K before relaxation and the configuration after maintaining the system at 2000 K for (b) 0 ns, (c) 2 ns, (d) 4 ns, and (e) 6 ns.

Figure 6.
Time histories of the MSD at different temperatures for different atoms of the ternary systems. The C- and Si-terminated (a) 6H–SiC/Al interface and (b) 3C–SiC/Al interface.
Figure 6.
Time histories of the MSD at different temperatures for different atoms of the ternary systems. The C- and Si-terminated (a) 6H–SiC/Al interface and (b) 3C–SiC/Al interface.

Figure 7.
Time histories of the self-diffusion coefficient at different temperatures for different atoms of the ternary systems. The C− and Si−terminated (a) 6H−SiC/Al interface and (b) 3C−SiC/Al interface.
Figure 7.
Time histories of the self-diffusion coefficient at different temperatures for different atoms of the ternary systems. The C− and Si−terminated (a) 6H−SiC/Al interface and (b) 3C−SiC/Al interface.

Figure 8.
Arrhenius plots of (a) Al, (b) Si, and (c) C atoms for the C− and Si−terminated 6H−SiC/Al and 3C−SiC/Al interfaces.
Figure 8.
Arrhenius plots of (a) Al, (b) Si, and (c) C atoms for the C− and Si−terminated 6H−SiC/Al and 3C−SiC/Al interfaces.

Figure 9.
Profiles of the interdiffusion flux and for diffusion couples of the C−terminated (a) 6H−SiC/Al and (b) 3C−SiC/Al annealed at 2000 K for 6 ns.
Figure 9.
Profiles of the interdiffusion flux and for diffusion couples of the C−terminated (a) 6H−SiC/Al and (b) 3C−SiC/Al annealed at 2000 K for 6 ns.


Table 1.
Elastic constants, bulk modulus, Young’s modulus, shear modulus, and Poisson’s ratio obtained by the present MD simulations using the EAM and Tersoff potential functions and compared with those obtained by other MD or experimental data.
Table 1.
Elastic constants, bulk modulus, Young’s modulus, shear modulus, and Poisson’s ratio obtained by the present MD simulations using the EAM and Tersoff potential functions and compared with those obtained by other MD or experimental data.
| Material | Method | C11 (GPa) | C12 (GPa) | C44 (GPa) | K (GPa) | E (GPa) | G (GPa) | v |
|---|---|---|---|---|---|---|---|---|
| Al | Present | 107.03 | 61.06 | 31.05 | 76.38 | 62.67 | 22.99 | 0.363 |
| MD a | 107.21 | 60.60 | 32.88 | 76.14 | 63.44 | 23.31 | 0.361 | |
| Experiment b | 107.3 | 60.08 | 28.3 | 75.7 | 63.83 | 23.48 | 0.359 | |
| 3C-SiC | Present | 383.78 | 144.41 | 239.75 | 224.20 | 304.81 | 119.68 | 0.273 |
| MD c | 390.1 | 142.7 | 191.0 | 225.1 | 313.6 | 123.7 | 0.268 | |
| Experiment d | 390 | 142 | 256 | 225 | 314.2 | 124 | 0.267 |
Table 2.
Diffusion activation energies and pre-exponential factors of Al, Si, and C.
| Diffusion System | Al | Si | C | |||
|---|---|---|---|---|---|---|
| Q (kJ/mol) | D0 × 10−10 (m2/s) | Q (kJ/mol) | D0 × 10−10 (m2/s) | Q (kJ/mol) | D0 × 10−10 (m2/s) | |
| C-terminated 6H–SiC/Al | 26.463 | 387.336 | 57.751 | 1.667 | 38.664 | 0.175 |
| Si-terminated 6H–SiC/Al | 27.144 | 388.659 | 59.863 | 1.900 | 40.150 | 0.207 |
| C-terminated 3C–SiC/Al | 23.275 | 380.809 | 59.287 | 2.051 | 38.115 | 0.192 |
| Si-terminated 3C–SiC/Al | 23.029 | 383.979 | 60.331 | 2.137 | 36.399 | 0.164 |
Table 3.
Average values of ternary main and cross-interdiffusion coefficients on each side of the Matano plane after maintaining the system at the pre-set temperature for 6 ns (indices: 1 = Al; 2 = Si; 3 = C).
Table 3.
Average values of ternary main and cross-interdiffusion coefficients on each side of the Matano plane after maintaining the system at the pre-set temperature for 6 ns (indices: 1 = Al; 2 = Si; 3 = C).
| Diffusion Couple | Temperature (K) | For Composition Range of the Bottom Side of the Matano Plane | For Composition Range of the Top Side of the Matano Plane | ||||||
|---|---|---|---|---|---|---|---|---|---|
| C-terminated 6H–SiC/Al | 1000 | 0.791 | −6.2 × 10⁻⁶ | −3.9 × 10⁻⁷ | 0.361 | 0.791 | 2.3 × 10⁻⁶ | −2.2 × 10⁻⁷ | 0.361 |
| 1200 | 3.213 | 2.2 × 10⁻⁶ | 4.5 × 10⁻⁶ | 1.870 | 3.213 | 1.6 × 10⁻⁶ | −2.9 × 10⁻⁶ | 1.870 | |
| 1500 | 3.572 | 1.7 × 10⁻⁶ | 3.2 × 10⁻⁷ | 2.479 | 3.572 | 2.1 × 10⁻⁶ | 5.5 × 10⁻⁷ | 2.479 | |
| 2000 | 4.929 | −3.2 × 10⁻⁵ | −1.6 × 10⁻⁷ | 3.195 | 4.929 | −3.5 × 10⁻⁵ | 8.3 × 10⁻⁶ | 3.195 | |
| Si- terminated 6H–SiC/Al | 1000 | 1.097 | 3.3 × 10⁻⁷ | 1.2 × 10⁻⁷ | 2.413 | 1.097 | 3.6 × 10⁻⁷ | 9.1 × 10⁻⁸ | 2.413 |
| 1200 | 3.182 | 2.8 × 10⁻⁷ | −5.2 × 10⁻⁷ | 5.295 | 3.182 | 5.7 × 10⁻⁷ | −4.4 × 10⁻⁷ | 5.295 | |
| 1500 | 3.567 | −3.2 × 10⁻⁷ | −7.6 × 10⁻⁷ | 7.019 | 3.567 | 2.9 × 10⁻⁷ | −3.2 × 10⁻⁵ | 7.019 | |
| 2000 | 5.087 | 1.3 × 10⁻⁵ | −7.1 × 10⁻⁴ | 7.983 | 5.087 | 6.4 × 10⁻⁵ | −4.0 × 10⁻⁴ | 7.983 | |
| C- terminated 3C–SiC/Al | 1000 | 0.870 | −5.5 × 10⁻⁸ | −2.0 × 10⁻⁹ | 0.028 | 0.870 | 3.2 × 10⁻⁶ | −0.6 × 10⁻⁹ | 0.028 |
| 1200 | 3.493 | −2.4 × 10⁻⁶ | −3.3 × 10⁻⁸ | 1.936 | 3.493 | −1.6 × 10⁻⁶ | 1.1 × 10⁻⁷ | 1.936 | |
| 1500 | 4.689 | −1.8 × 10⁻⁴ | −2.6 × 10⁻⁸ | 3.029 | 4.689 | −3.9 × 10⁻⁵ | −2.4 × 10⁻⁷ | 3.029 | |
| 2000 | 6.512 | −1.3 × 10⁻² | 6.7 × 10⁻⁵ | 4.571 | 6.515 | −7.2 × 10⁻³ | −5.1 × 10⁻⁵ | 4.571 | |
| Si- terminated 3C–SiC/Al | 1000 | 1.048 | 1.4 × 10⁻⁷ | −1.4 × 10⁻³ | 2.954 | 1.048 | 1.4 × 10⁻⁷ | −1.4 × 10⁻³ | 2.955 |
| 1200 | 2.522 | 9.1 × 10⁻³ | −5.9 × 10⁻² | 4.259 | 2.522 | 8.0 × 10⁻³ | −5.0 × 10⁻² | 4.273 | |
| 1500 | 4.215 | 4.0 × 10⁻¹ | −3.4 × 10⁻¹ | 4.925 | 4.233 | 4.2 × 10⁻¹ | −3.9 × 10⁻¹ | 4.849 | |
| 2000 | 4.279 | 4.4 × 10⁻¹ | −5.2 × 10⁻¹ | 5.536 | 4.311 | 4.8 × 10⁻¹ | −6.7 × 10⁻¹ | 5.300 | |
Disclaimer/Publisher’s Note: The statements, opinions and data contained in all publications are solely those of the individual author(s) and contributor(s) and not of MDPI and/or the editor(s). MDPI and/or the editor(s) disclaim responsibility for any injury to people or property resulting from any ideas, methods, instructions or products referred to in the content. |
© 2022 by the authors. Licensee MDPI, Basel, Switzerland. This article is an open access article distributed under the terms and conditions of the Creative Commons Attribution (CC BY) license (https://creativecommons.org/licenses/by/4.0/).
Share and Cite
MDPI and ACS Style
Tahani, M.; Postek, E.; Sadowski, T. Molecular Dynamics Study of Interdiffusion for Cubic and Hexagonal SiC/Al Interfaces. Crystals 2023, 13, 46. https://0-doi-org.brum.beds.ac.uk/10.3390/cryst13010046
AMA Style
Tahani M, Postek E, Sadowski T. Molecular Dynamics Study of Interdiffusion for Cubic and Hexagonal SiC/Al Interfaces. Crystals. 2023; 13(1):46. https://0-doi-org.brum.beds.ac.uk/10.3390/cryst13010046
Chicago/Turabian StyleTahani, Masoud, Eligiusz Postek, and Tomasz Sadowski. 2023. "Molecular Dynamics Study of Interdiffusion for Cubic and Hexagonal SiC/Al Interfaces" Crystals 13, no. 1: 46. https://0-doi-org.brum.beds.ac.uk/10.3390/cryst13010046
Note that from the first issue of 2016, this journal uses article numbers instead of page numbers. See further details here.