Article

Structural and Luminescence Properties of Cu(I)X-Quinoxaline under High Pressure (X = Br, I)

by
Javier Gonzalez-Platas
1,*,
Ulises R. Rodriguez-Mendoza
2,
Amagoia Aguirrechu-Comeron
3,
Rita R. Hernandez-Molina
4,
Robin Turnbull
5,
Placida Rodriguez-Hernandez
2 and
Alfonso Muñoz
2
1
Instituto Universitario de Estudios Avanzados en Física Atómica, Molecular y Fotónica (IUDEA), MALTA Consolider Team, Departamento de Física, Universidad de La Laguna, E38204 La Laguna, Tenerife, Spain
2
Instituto de Materiales y Nanotecnología (IMN), MALTA Consolider Team, Departamento de Física, Universidad de La Laguna, E38204 La Laguna, Tenerife, Spain
3
Departamento de Física, Universidad de La Laguna, E38204 La Laguna, Tenerife, Spain
4
Instituto Universitario de Bioorgánica Antonio González, Departamento de Química, Unidad Departamental de Química Inorgánica, Universidad de La Laguna, E38204 La Laguna, Tenerife, Spain
5
Departamento de Física Aplicada, Instituto Ciencia de Materiales, MALTA Consolider Team, Universidad de Valencia, E46100 Burjassot, Valencia, Spain
*
Author to whom correspondence should be addressed.
Submission received: 14 December 2022 / Revised: 29 December 2022 / Accepted: 3 January 2023 / Published: 5 January 2023
(This article belongs to the Special Issue Pressure-Induced Phase Transformations (Volume II))

Abstract

:
A study of high-pressure single-crystal X-ray diffraction and luminescence experiments together with ab initio simulations based on the density functional theory has been performed for two isomorphous copper(I) halide compounds with the empirical formula [C8H6Cu2X2N2] (X = Br, I) up to 4.62(4) and 7.00(4) GPa for X-ray diffraction and 6.3(4) and 11.6(4) GPa for luminescence, respectively. An exhaustive study of compressibility has been completed by means of determination of the isothermal equations of state and structural changes with pressure at room temperature, giving bulk moduli of K0 = 14.4(5) GPa and K0 = 7.7(6) for the bromide compound and K0 = 13.0(2) GPa and K0 = 7.4(2) for the iodide compound. Both cases exhibited a phase transition of second order around 3.3 GPa that was also detected in luminescence experiments under the same high-pressure conditions, wherein redshifts of the emission bands with increasing pressure were observed due to shortening of the Cu–Cu distances. Additionally, ab initio studies were carried out which confirmed the results obtained experimentally, although unfortunately, the phase transition was not predicted.

1. Introduction

Coordination complexes based on copper(I) halides with N-donor ligands have been some of the most attractive and widely studied complexes over the last three decades [1,2,3,4,5,6,7,8]. This has been due to the variety of physical and chemical properties exhibited by the copper(I) halide complexes, such as photo- and electroluminescence, nonlinear optics, and electrical conductivity. In particular, the electrical conductivity properties lead to many potential technological applications [9,10,11,12,13,14,15,16,17], such as light-emitting diodes (LEDs) [18], organic light-emitting diodes (OLEDs) [19,20,21,22], simpler light-emitting electrochemical cells (LECs) [23,24,25,26,27], biosensors [28], or solar energy conversion [29,30,31].
Systems based on these copper(I) halide complexes are very interesting because copper (Cu) is more abundant and less expensive than noble or rare earth metals. Copper halides also exhibit remarkable structural diversity [2,4,32]. Specifically, the d10 electron configuration of CuI does not lead to a pre-defined spatial configuration of the ligands; rather, the coordination sphere is determined by molecular mechanics and electrostatic factors. The halide ions exhibit four pairs of electrons in the outer shell and can therefore coordinate with four CuI ions. When a nitrogen-centered Lewis base is added to a CuI halide, the coordination number of the halide ions is reduced, resulting in a cluster of CuI salt (CuX)n. This can give rise to interesting geometries such as mononuclear copper(I) complexes [33], square dimers [34], cubane tetramers [35], or polymers in one or two dimensions [36,37,38,39].
Regarding the photo-physical properties of metal complexes, they are intimately related to the electronic configuration of the metal center and the ligands around it. CuI with a d10 electronic configuration has a completely filled d-subshell, which excludes the possibility of d–d electronic transitions. Therefore, the luminescence of these d10 copper(I) complexes arises from other types of electronic transitions, including metal-to-ligand charge transfer (MLCT), ligand-to-metal charge transfer (LMCT), and ligand-to-ligand charge transfer (LLCT). The presence of other types of interactions is also possible. For example, transitions involving the CuX cluster core, whereby a combination of halide-to-metal charge transfer (XMCT) and metal-cluster-centered d10 → d9s1 (MCC) charge transfer occurs due to the weak attractive d10d10 interactions between the CuI ions in the cluster. In this latter case, known as cuprophilic interaction, the intensity of the interaction is directly connected with the Cu–Cu distances, which play an important role. Cuprophilic interaction has been observed experimentally in systems which exhibit luminescence for Cu–Cu distances shorter than twice the Cu van der Waals radius (2.8 Å). In addition, the d10 configuration favors tetrahedral four-coordinate environments of the ligands around the metal center CuI [40]. Pressure is a valuable thermodynamic variable which can be used as a tool to induce, in a continuous way, changes in the crystal structure and the immediate coordination complex environment, thereby provoking changes in the emission spectra [41,42]. Therefore, high-pressure techniques allow us to relate structural changes with optical properties.
Despite the large number of studies into copper(I) halides, there has historically been a deficit of research into these systems under extreme conditions of temperature or pressure, with still fewer publications utilizing ab initio studies for comparison with experimental results. Pressure and temperature are external stimuli which both affect intermolecular interactions, molecular packing, and structural parameters, thereby affecting emergent physical and chemical properties. Knowledge of how the properties of copper(I) halide complexes are affected by these different external stimuli is essential for technological applications [15,43]. In recent years, this situation seems to be changing with the publication of studies into how temperature [12,44,45] and pressure [31,36,37,38,39,46,47] affect the luminescent properties of CuI iodide complexes.
In this work, we present the pressure-induced changes in the crystal structure and luminescence properties of the 2D isomorphous coordination polymers [(CuX)2(Quin)] (X = Br, I and Quin = quinoxaline) at room temperature.

2. Materials and Methods

2.1. Synthesis of [(CuX)2(Quin)] with X = Br, I

The compound [(CuBr)2(Quin)] was prepared by mixing an equimolar amount of CuBr (0.1 g, 6.9 mmol) dissolved in 20 mL of acetonitrile with quinoxaline (0.09 g, 6.9 mmol) dissolved in 10 mL of acetonitrile. A red-orange precipitate immediately formed. The precipitate was filtered off. This powder was recrystallized from acetonitrile, and orange single crystals suitable for X-ray diffraction were obtained by slow evaporation of the solvent over 1 week. The compound [(CuI)2(Quin)] was prepared from CuI (0.2g, 1.05mmol) and quinoxaline (0.13g, 1mmol) following the same procedure as described above for the equivalent bromine compound [(CuBr)2(Quin)].
Elemental analysis. [(CuBr)2(Quin)] Found: C, 22.9; H, 1.4; N, 6.6%. Calcd: C, 23.0; H, 1.5; N, 6.7%. [(CuI)2(Quin)] Found: C, 18.5; H, 1.2; N, 5.4%. Calcd: C, 18.8; H, 1.2; N, 5.5%.

2.2. X-ray Diffraction Measurements

At ambient conditions, we used an Agilent SuperNOVA diffractometer equipped with an EOS detector (CCD) and a Mo radiation micro-source. Data were collected and processed using CrysAlisPro software [48]. The structures for both compounds were solved and refined using the SHELXT and SHELXL programs [49,50]. The PLATON program [51] was used for geometric calculations.
For high-pressure (HP) X-ray measurements, we used the Agilent SuperNOVA diffractometer for the bromine compound [(CuBr)2(Quin)]. The equivalent iodine compound [(CuI)2(Quin)] was measured at the MSPD beamline at ALBA synchrotron with a focused beam of 15 × 15 µm2 (FWHM) and a Rayonix SX165 CCD detector (Figure S1 in Supporting Information). The synchrotron X-ray energy used was 38.9 keV (λ = 0.3185 Å), selected from the La absorption K-edge. The sample-to-detector distance (240 mm), beam center, and detector tilt were calibrated from LaB6 (NIST) diffraction data measured under the same experimental conditions as the HP experiments. For each pressure, data collection was performed by rotating the DAC around the omega axis in small steps (0.2°) from −30 to 30°. The data were processed using CrysAlisPro software through Esperanto conversion.
For both samples, a single crystal of the compound was placed into a Diacell Bragg-Mini diamond anvil cell (DAC) from Almax-EasyLab (Figure S2 in Supporting Information), with an opening angle of 90° and anvil culets of 500 μm in diameter. The DAC was fitted with a stainless gasket of 60 μm thickness containing a hole of 200 μm in diameter. A small ruby sphere was placed next to the sample on one of the diamond anvils (diffraction side) as a pressure sensor and measured using the ruby R1 fluorescence line [52]. A methanol–ethanol–water mixture (16:3:1) was used as the pressure-transmitting medium (PTM). This PTM remains hydrostatic in the range of pressures used in our experiments [53,54], thereby minimizing deviatoric stresses which can cause incorrect values for the bulk modulus to be determined [55].
Structures were refined using results from the previous pressure as a starting point, and they were refined on F2 by full-matrix least-squares refinement using the SHELXL program. Due to limitations of the opening angle of our DAC, it was only possible to observe about 30% of the reflections which were observed outside of the DAC at ambient conditions. In general, structure refinements were performed with isotropic displacement parameters for all atoms except for the heavy atoms (Cu, Br, or I) that were refined with anisotropic displacement parameters whenever they did not become non-positive. In the case of the [(CuBr)2(Quin)] compound, constraints were introduced to maintain the planarity of the organic ligand as well as to adjust certain thermal factors influenced by the quality of the intensities measured during the HP experiment, which significantly decreased after the phase transition. Hydrogen atoms were included in the final procedure in the same way as for ambient conditions.

2.3. High-Pressure Optical Measurements

Two different setups were used to obtain the high-pressure emission spectra. The first setup consisted of a 375-nanometer continuum diode laser as the excitation source and a 0.75-m single grating monochromator (Spex 750 M) equipped with a cooled photomultiplier (PMT) (Hamamatsu 928b) for detection. The second setup consisted of a 532-nanometer diode laser as the excitation course and a commercial scanning confocal Raman instrument (Renishaw InVia) with a cooled CCD for detection, where a 20× SLWD objective was used to achieve a laser-spot diameter of less than 5 µm. The luminescence of the [(CuBr)2(Quin)] compound was obtained with the second setup, while for the [(CuI)2(Quin)] compound, both setups were used. All the spectra have been corrected for the instrument response. A miniature DAC (Figure S2 in Supplementary Information) designed at the University of Paderborn (Germany) was used for high-pressure experiments using the same hydrostatic pressure-transmitting medium and pressure sensor as for the high-pressure X-ray diffraction experiments. Lifetime measurements were carried out by exciting with an Optical Parametric Oscillator (OPO) (EKSPLA/NT342/3UVE). The emission was focused onto a 0.32-m monochromator (Jobin Yvon Triax 320) coupled with a cooled PMT (Hamamatsu 928P) and recorded and averaged using a digital storage oscilloscope (LeCroy WS424).

2.4. Computer Simulations

Combining ab initio simulations with experimental studies of materials under high pressure has proven to be a very powerful technique [56]. In this work, we have performed first principles simulations in the framework of density functional theory (DFT) using the Vienna ab initio simulation package (VASP) [57,58,59]. A generalized gradient approximation (GGA) with the Perdew–Burke–Ernzerhof (PBE) functional [60] was used to describe the exchange-correlation energy. We have also included the van der Waals dispersion energy correction employing the Grimme D3 method [61] to take into account the weak interactions. Interactions among the core and the valence electrons were treated with pseudopotentials through the projector-augmented wave scheme (PAW) [62] to solve the Schrödinger equation. A plane wave basis with an energy cut-off of 520 eV was used, which assures high accuracy in the results. The integration over the Brillouin zone (BZ) was performed with a Monkhorst–Pack scheme [63] grid of 8 × 2 × 2, which ensures high accuracy in the results since we are working with a primitive cell of 80 atoms in general positions. The structural parameters of the crystalline structures and the atomic positions have been relaxed at selected volumes. During the process of relaxation and optimization of the structures, it was required that the forces on the atoms were less than 0.003 eV/Å, and the stress tensor was diagonal with differences below 0.1 GPa, to ensure hydrostaticity.

3. Results and Discussion

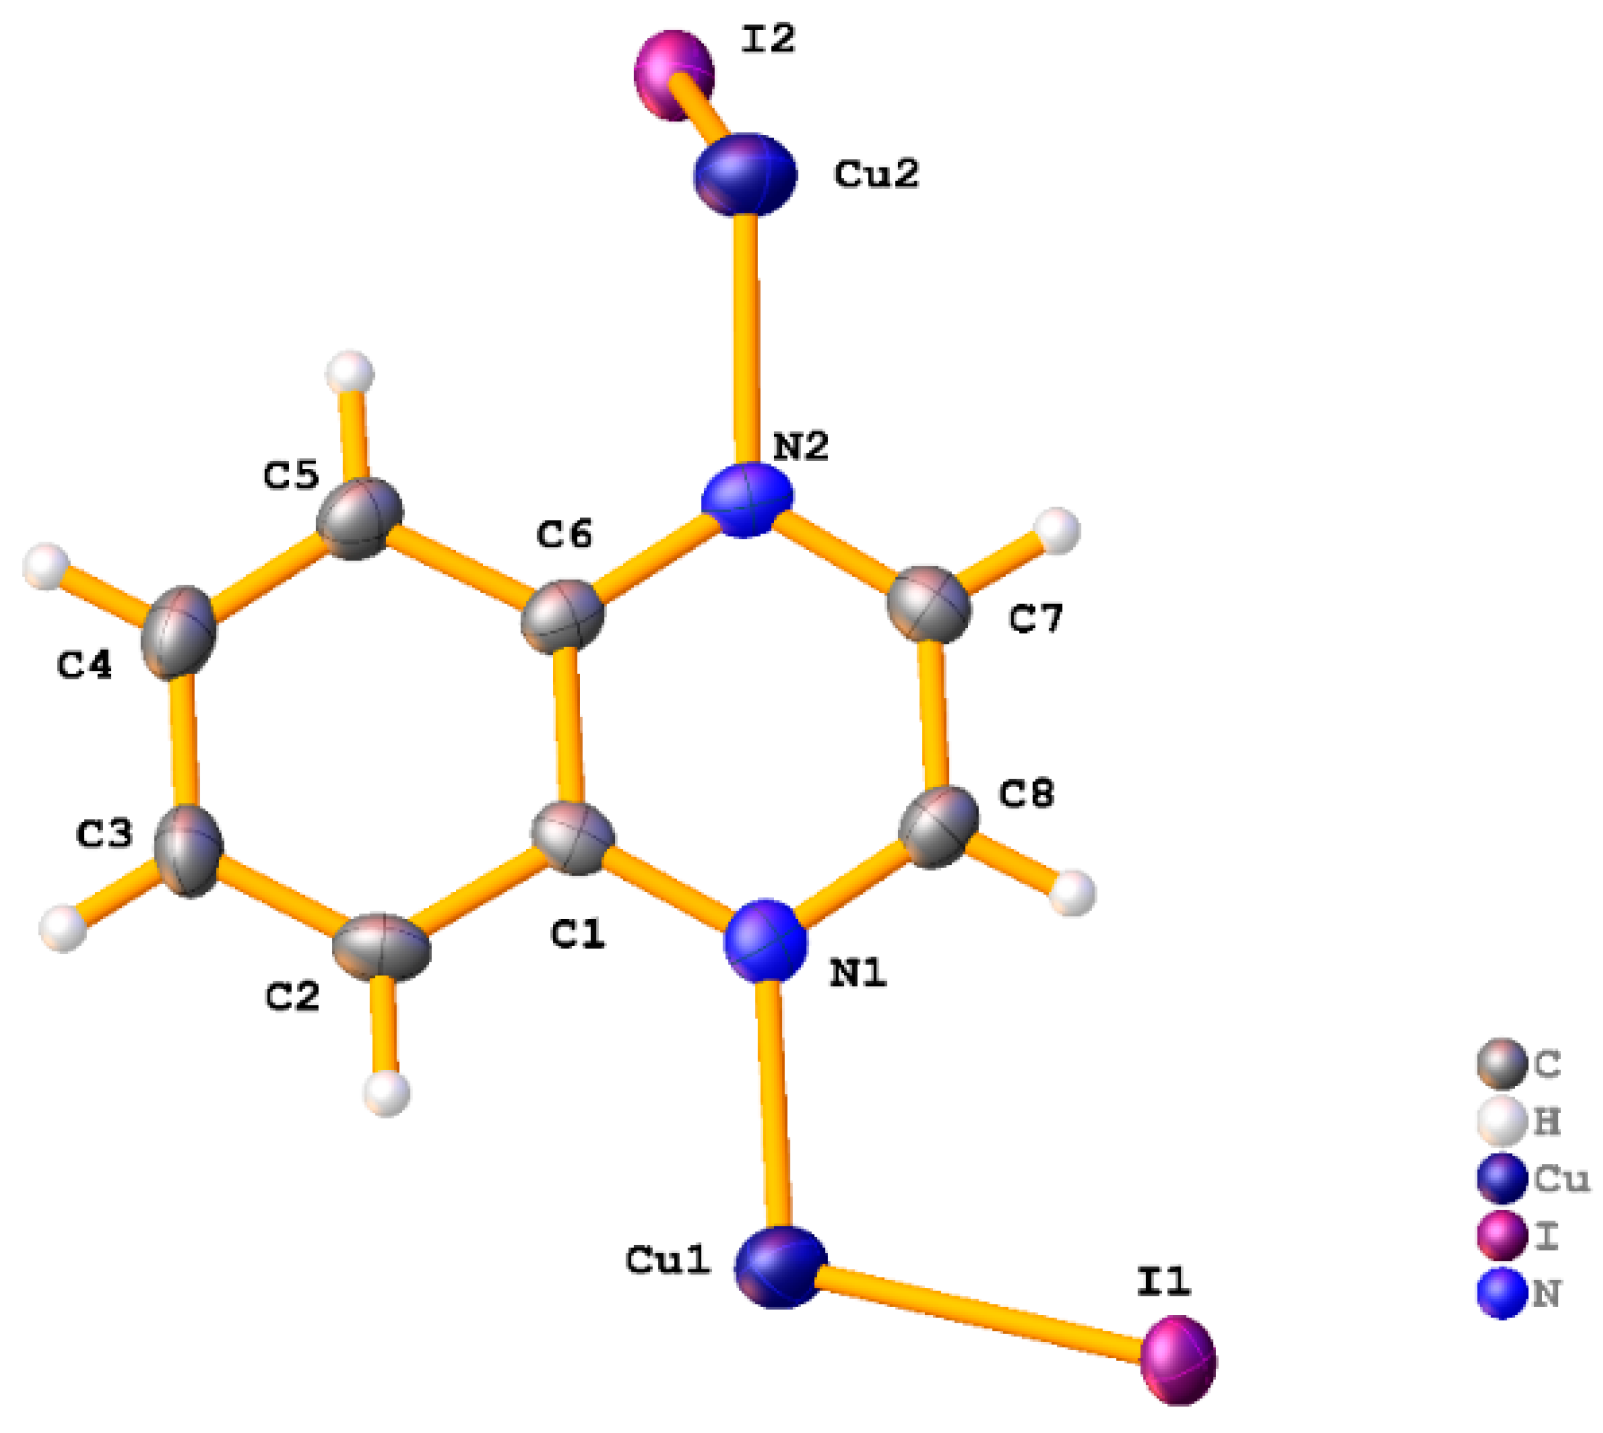
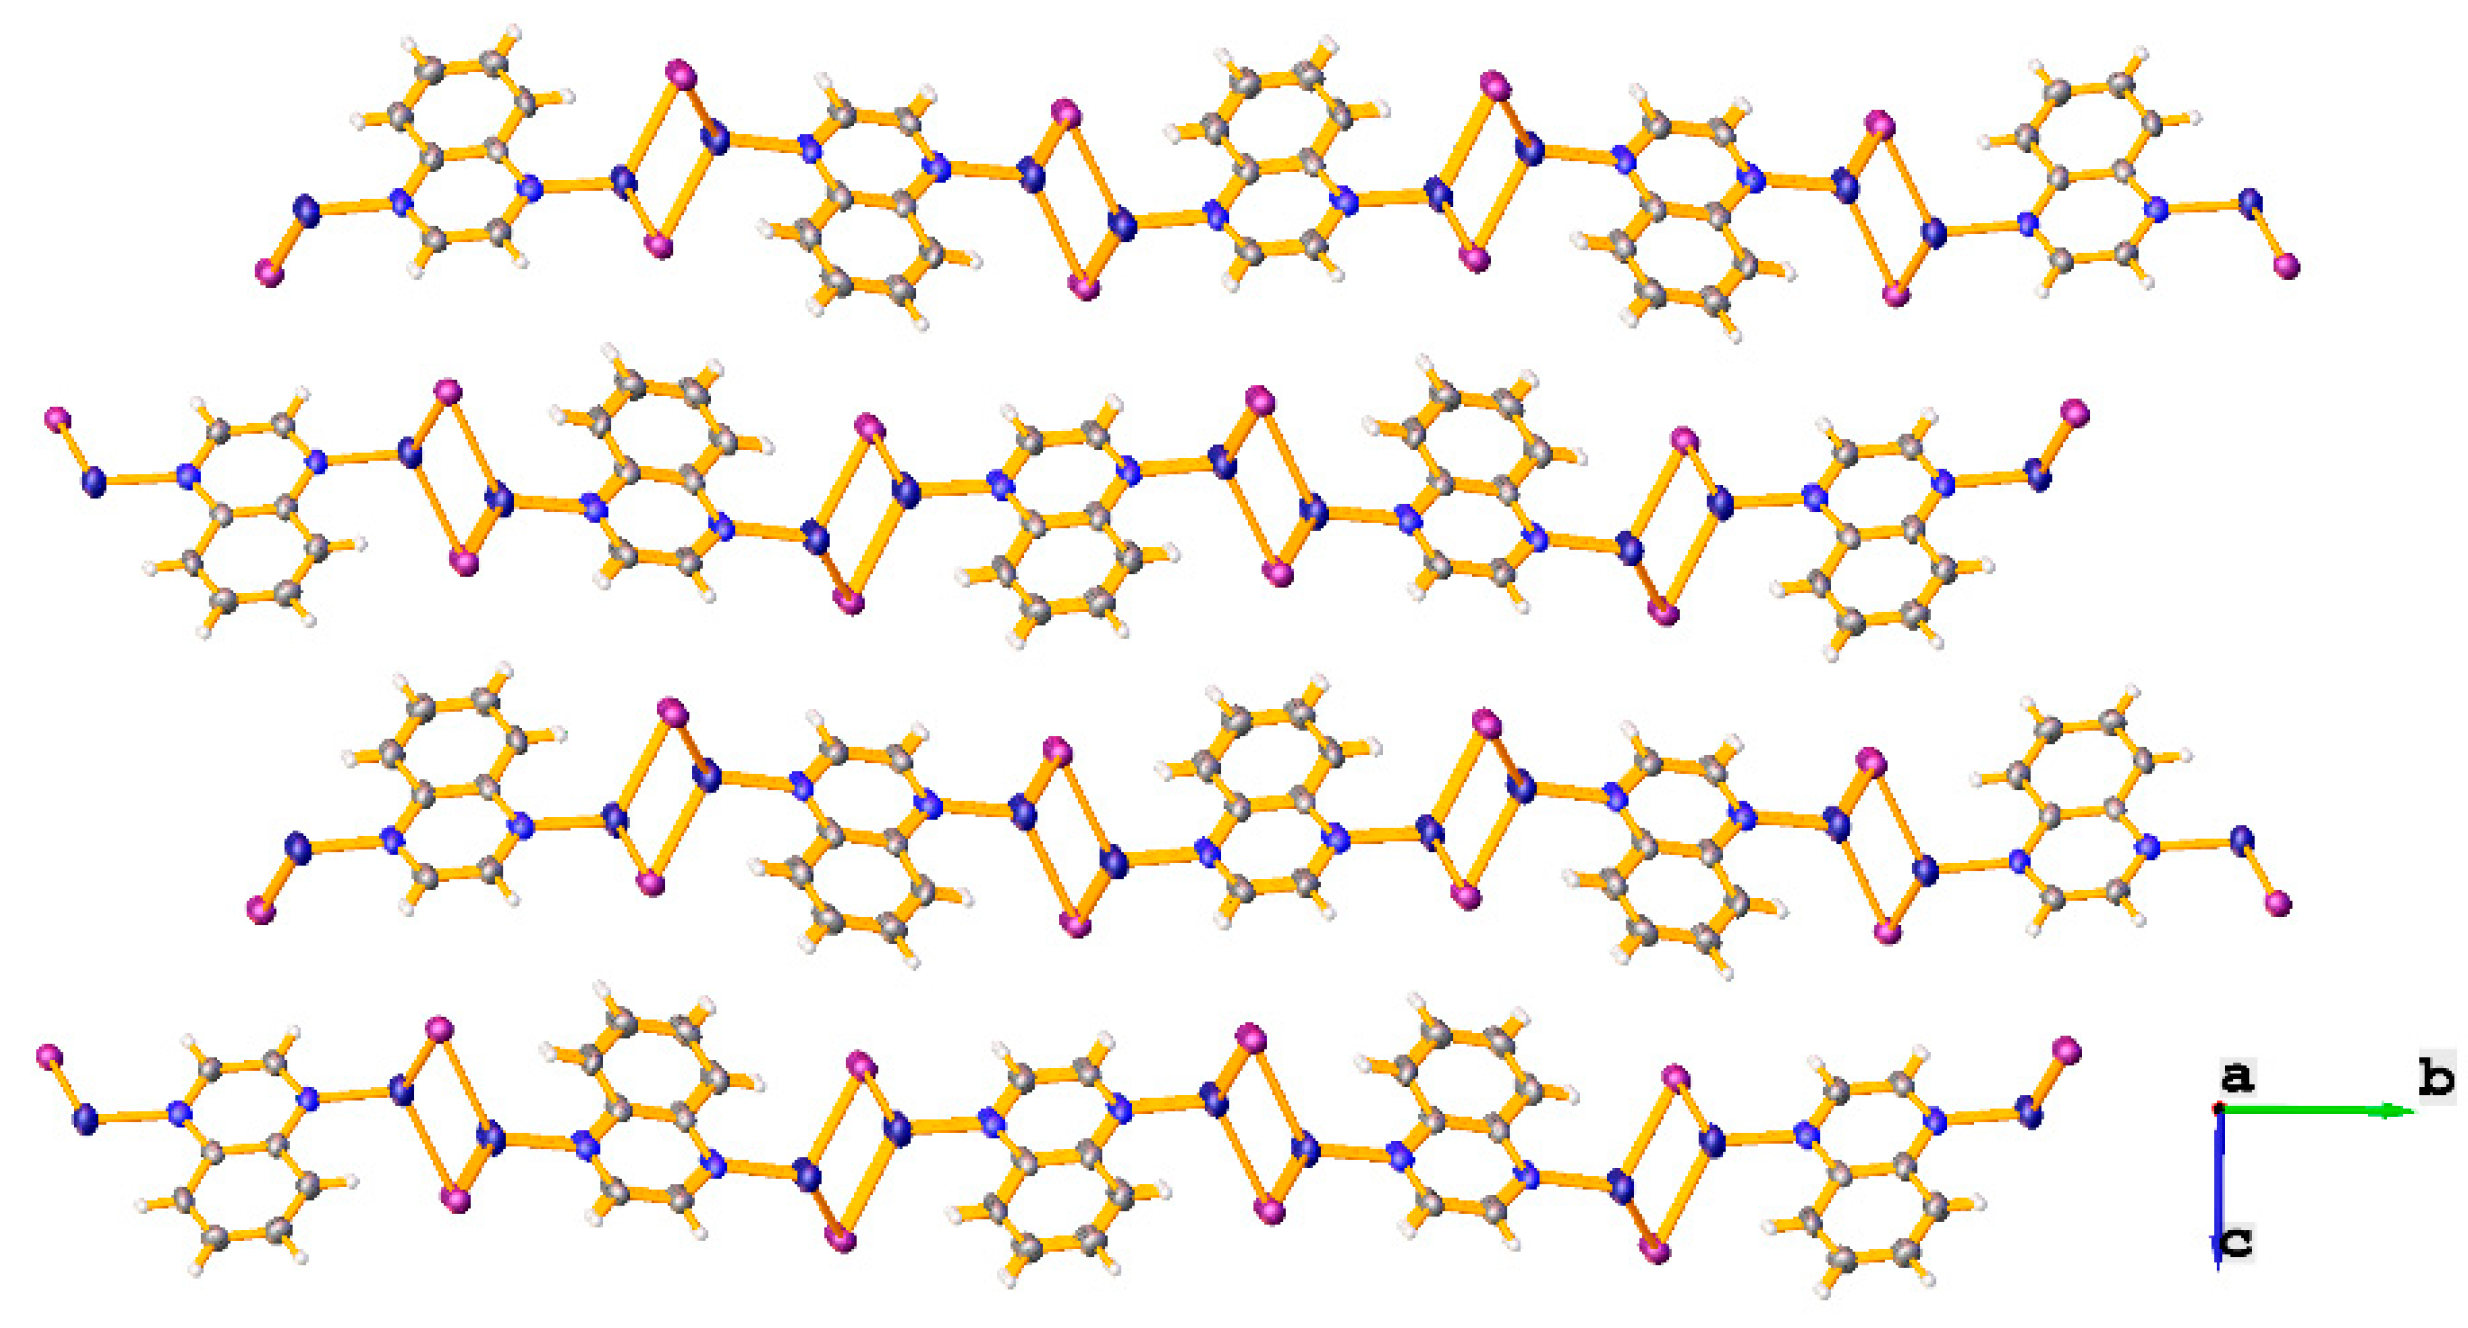
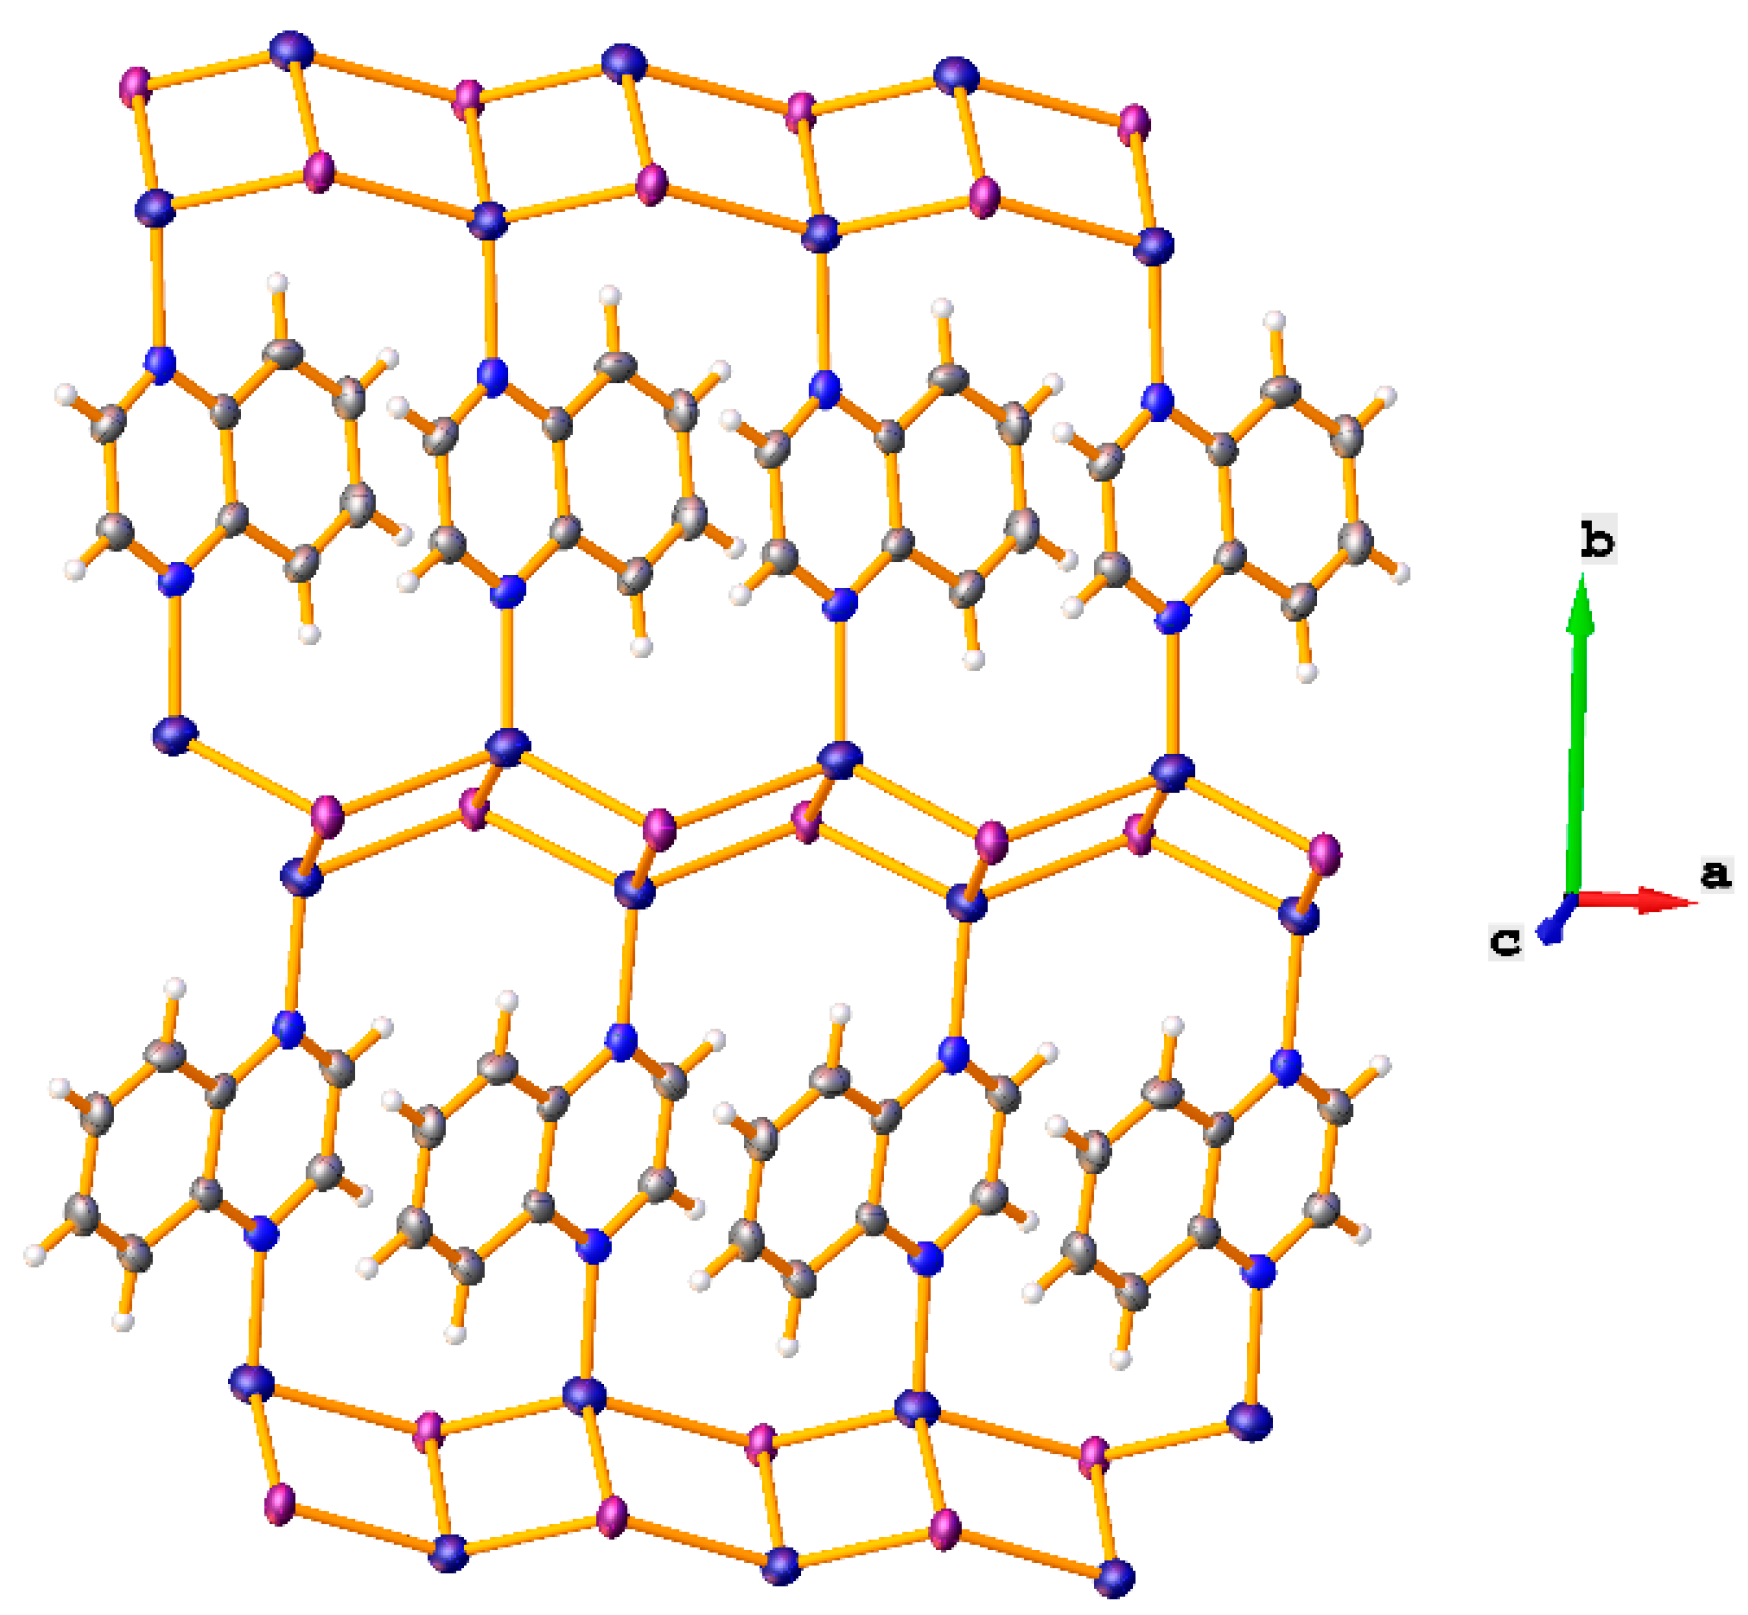
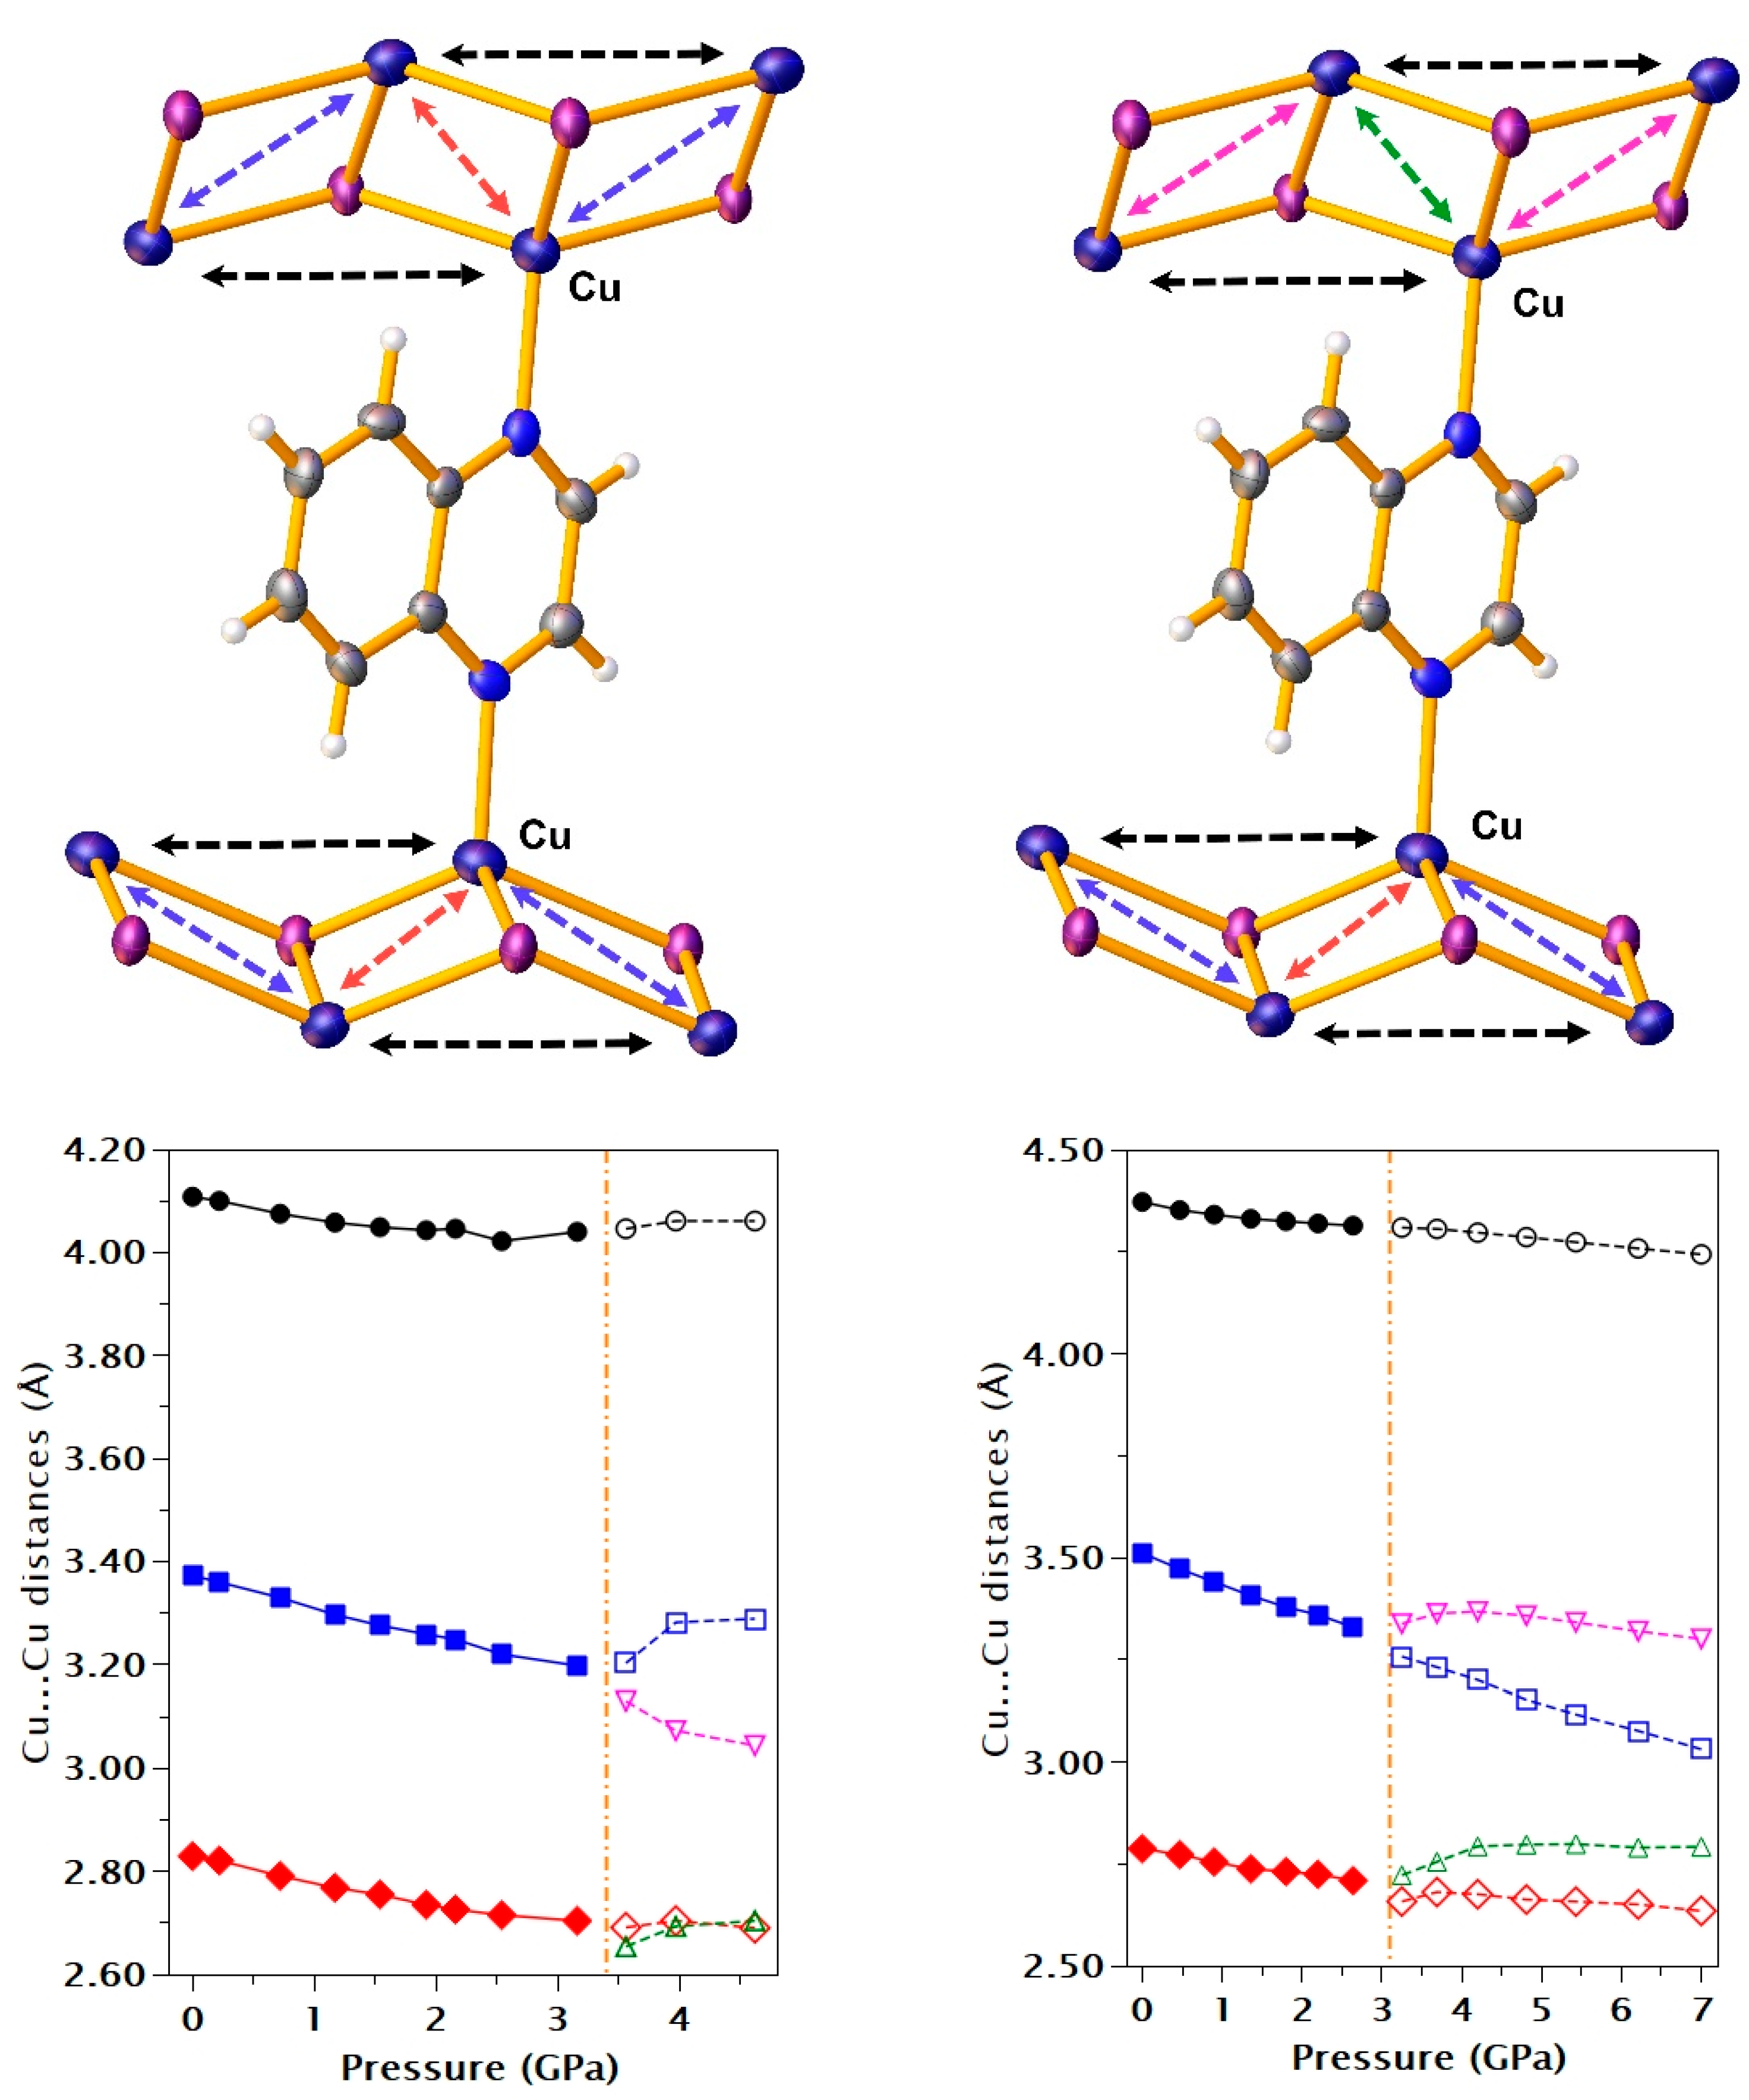
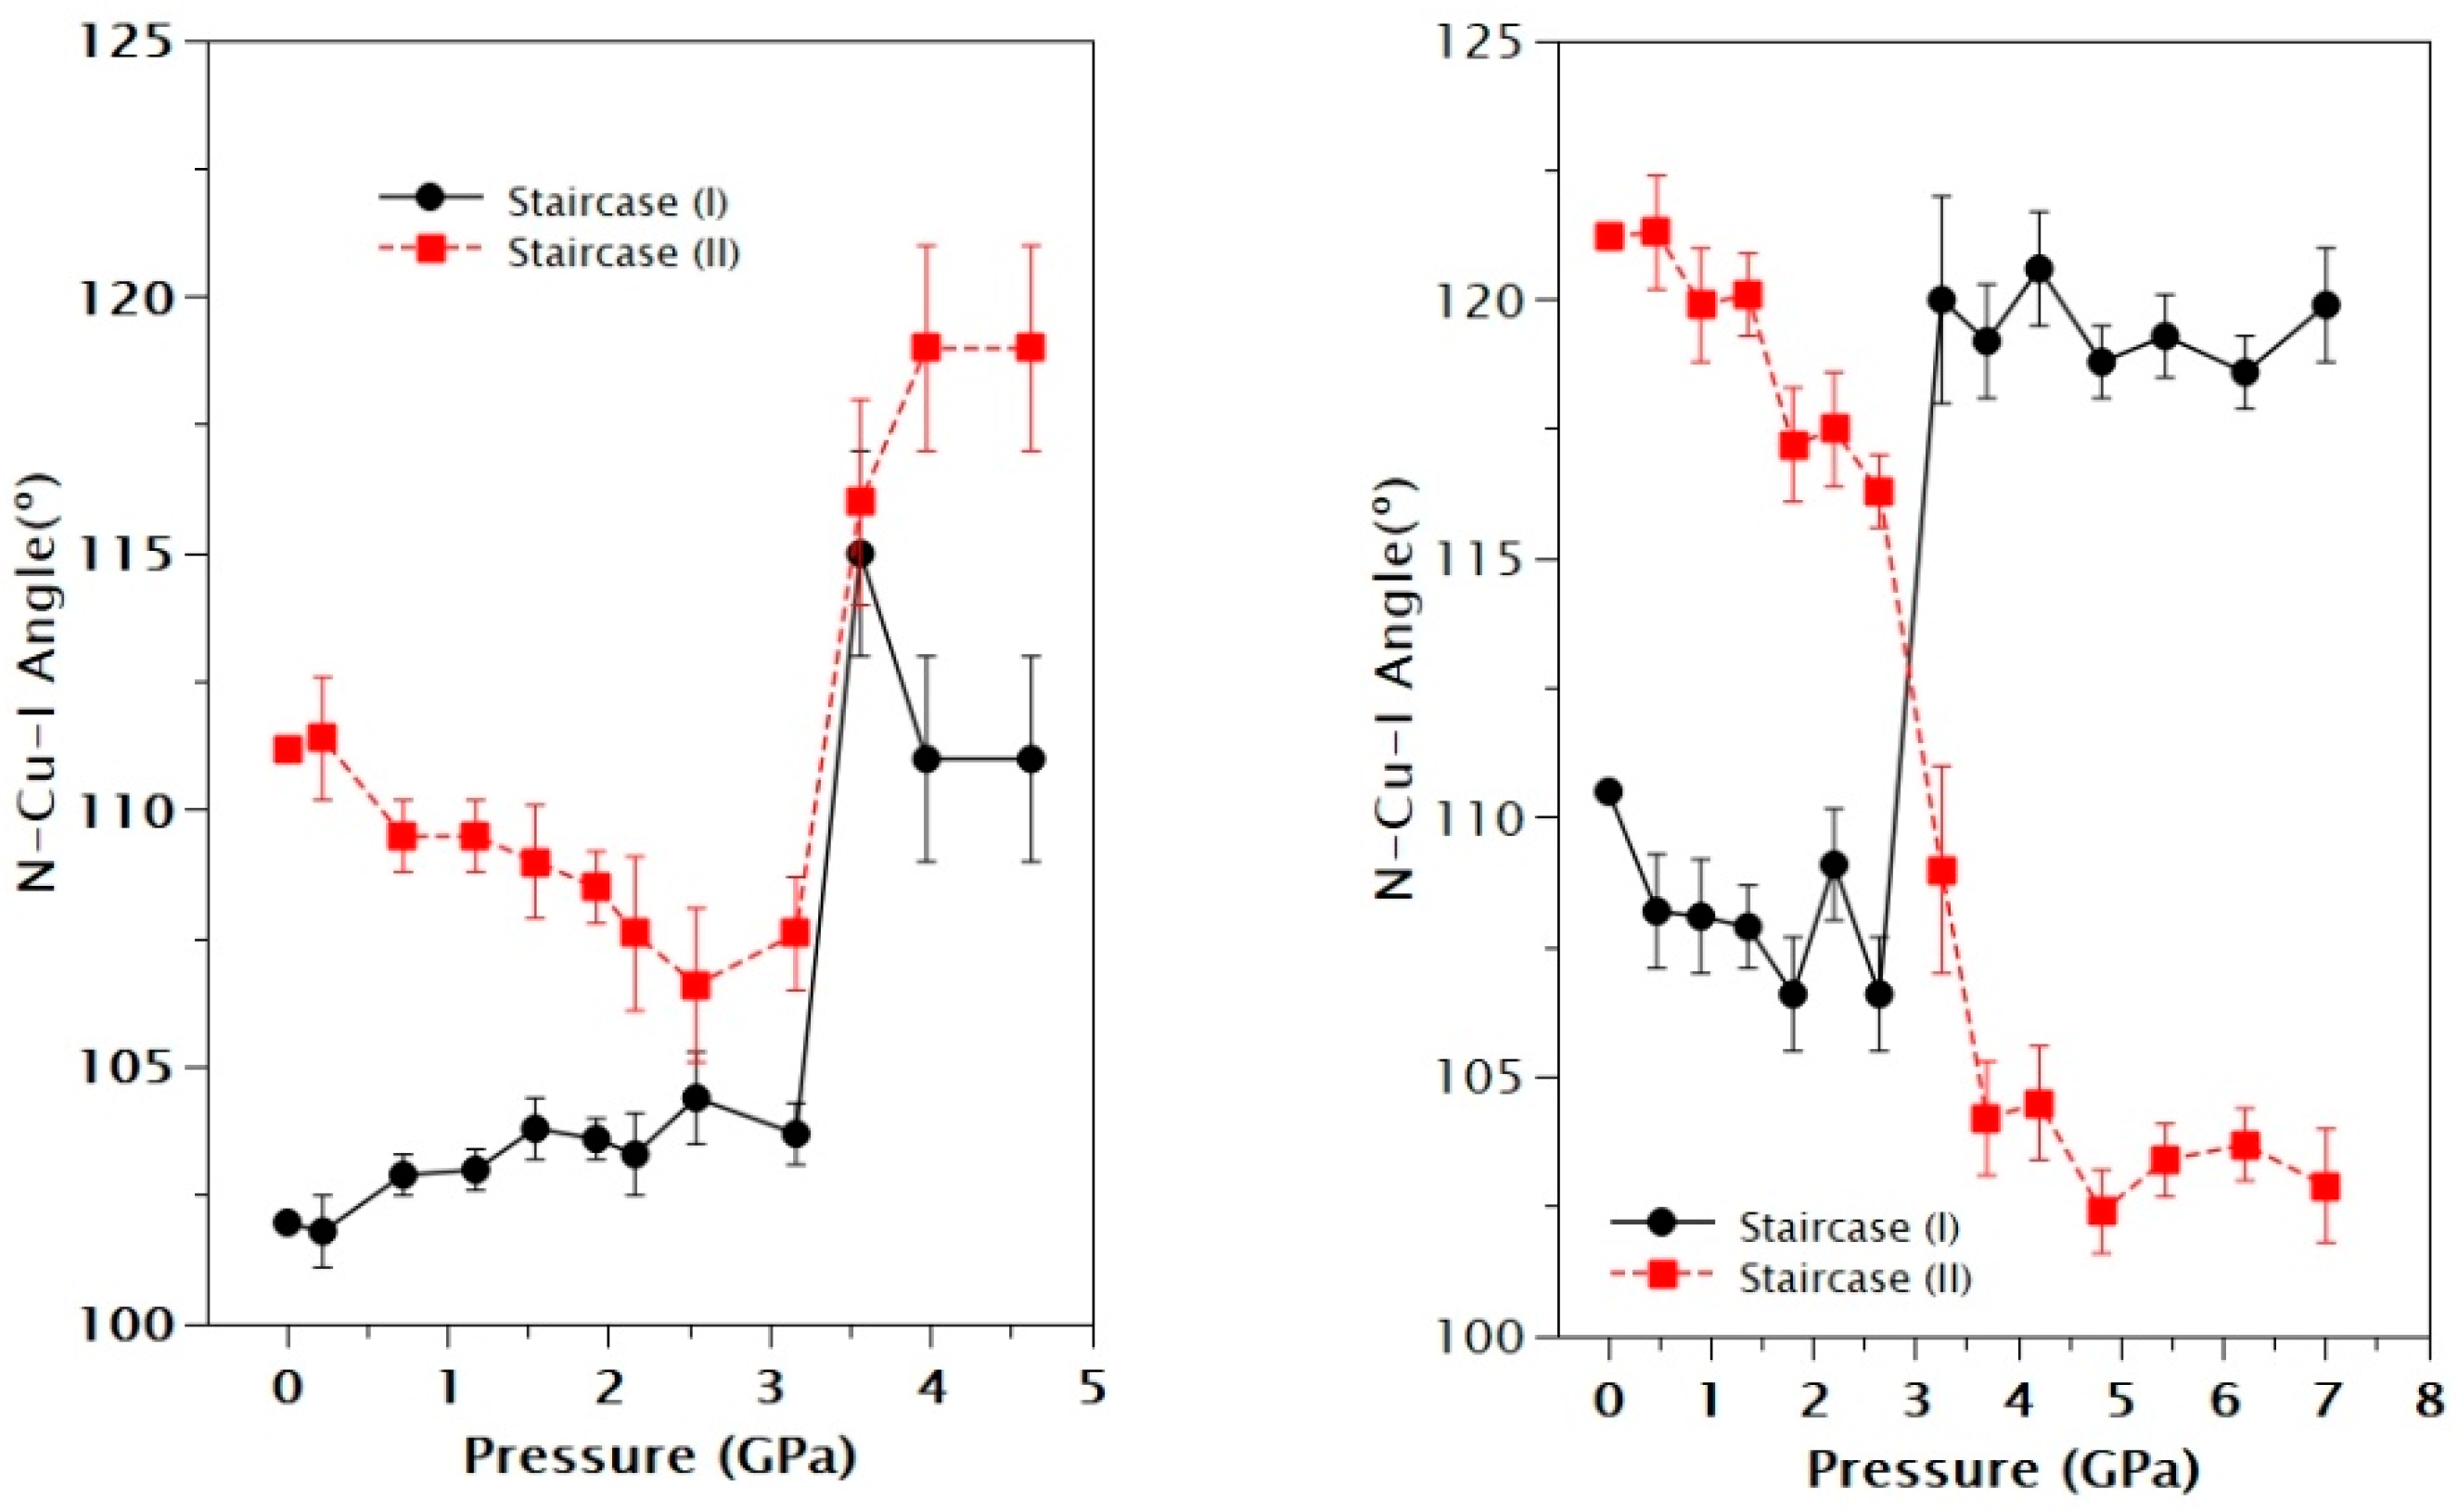
3.1. Structural Analysis

The main single-crystal X-ray diffraction data and structure refinement parameters at ambient conditions for [(CuBr)2(Quin)] and [(CuI)2(Quin)] are reported in Table 1. Only the structure of [(CuI)2(Quin)] has been previously reported [2,32]. Both compounds are mutually isomorphous and can therefore be described using the iodide compound as the reference. The asymmetric unit is shown in Figure 1. When expanded, the asymmetric unit results in polymeric 2D layers with a staircase motif as copper bromide/iodide is situated parallel to the a-axis (Figure 2).
Each CuI atom is coordinated to three adjacent halogen ions over a range of 2.4584(8) Å to 2.5942(11) Å for [(CuBr)2(Quin)] and 2.6275(10) Å to 2.7030(10) Å for [(CuI)2(Quin)]. In both cases, the CuI atom is also coordinated by one of the nitrogen donors from the quinoxaline ligand, which bridges the adjacent Cu-X staircase, resulting in the formation of 2D sheets. Typically, a single geometric index [64] called τ4 is used to describe the shape of this four-fold coordination environment, which takes a range of values from 1.0 for perfect tetrahedral configuration to 0.0 in the case of perfect square planar configuration. In this study, the τ4 values were 0.88 (for Cu1) and 0.93 (for Cu2) in [(CuBr)2(Quin)] and 0.87 (for Cu1) and 0.92 (for Cu2) in [(CuI)2(Quin)], indicating a distorted trigonal pyramidal configuration. The quinoxaline adopts an arrangement in order to maximize the π–π interactions. Neighboring 2D sheets are related by inversion symmetry and are separated by half the c-axis.
The geometric parameters for the [(CuX)2(Quin)] at ambient conditions agree with the values obtained in a search in the CSD (v5. 43) [65] for similar structures. The average values found in the CSD for Cu-Br, Cu-I, and Cu-N were 2.50(8) Å, 2.63(5) Å, and 2.06(7) Å, respectively. Similarly, the Cu–Cu distance was 2.9(3)Å when bromine atoms were involved and 2.8(3) Å when iodide atoms were involved. According to the structural analysis of the present work, all values fall within the expected ranges: 2.53 Å (Cu-Br), 2.02 Å (Cu-N), and 2.83 Å (Cu–Cu) for [(CuBr)2(Quin)], and 2.68 Å (Cu-I), 2.05 Å (Cu-N), and 2.79 Å (Cu–Cu) for [(CuI)2(Quin)].
The bond angles determined in this work are also consistent with those reported in the literature. The average value for the I-Cu-N angle calculated from the CSD was 110(7)°. In this work, it was found to be 111.3(2)° and 112.2(2)° for [(CuBr)2(Quin)] and [(CuI)2(Quin)], respectively. In the case of X-Cu-X (with X = Br, I), the range found in the CSD is between 93 and 120°, and all values for both compounds fall within this range.
With respect to the intermolecular interactions, the perpendicular stacking distance between quinoxaline layers was around 3.33 Å (4.1080(3) Å for [(CuBr)2(Quin)] and 4.3722(2) Å for [(CuI)2(Quin)] Cg–Cg distance), indicating weak π–π interactions.
High-pressure experiments were conducted at room temperature. The dependence of the unit cell parameters on pressure is shown in Figure 3. Although the behavior of the volume does not show any discontinuity, there was a significant change in the behavior of the angles in the unit cell parameters, where the α and γ angles differed from their original values of 90° at around 3.5 GPa for [(CuBr)2(Quin)] and 3.2 GPa for [(CuI)2(Quin)], with the β angle increasing smoothly with pressure. Therefore, it can be concluded that there was a phase transition of second order, since there is no discontinuity in the dependence of volume with pressure, where the sample transitioned from a monoclinic phase (P21/n) to a triclinic phase (P-1).
Cu–Cu interactions are shown in Figure 4. In the low-pressure monoclinic phase (P21/n), we observed three different Cu–Cu interactions imposed by the symmetry (red, black, and dashed blue lines). In the high-pressure triclinic phase (P-1), the number of different Cu–Cu interactions increased up to five (red, black, green, magenta, and dashed blue lines). A similar situation occurred with the other bond distances (Cu-I and Cu-N, Figures S3 and S4 in Supplementary Information). Regarding the bond angles, the N-Cu-X (X = Br, I) angles presented the most significant changes after the phase transition (Figure 5). The other parameters produced only a slight distortion (gliding movement) of the Cu-X staircases which is associated with a slight decrease in the space between the quinoxaline ligands, which maintained their planarity and orientation, with an additional small displacement of the ligands relative to one another (Figure S5 in Supplementary Information).

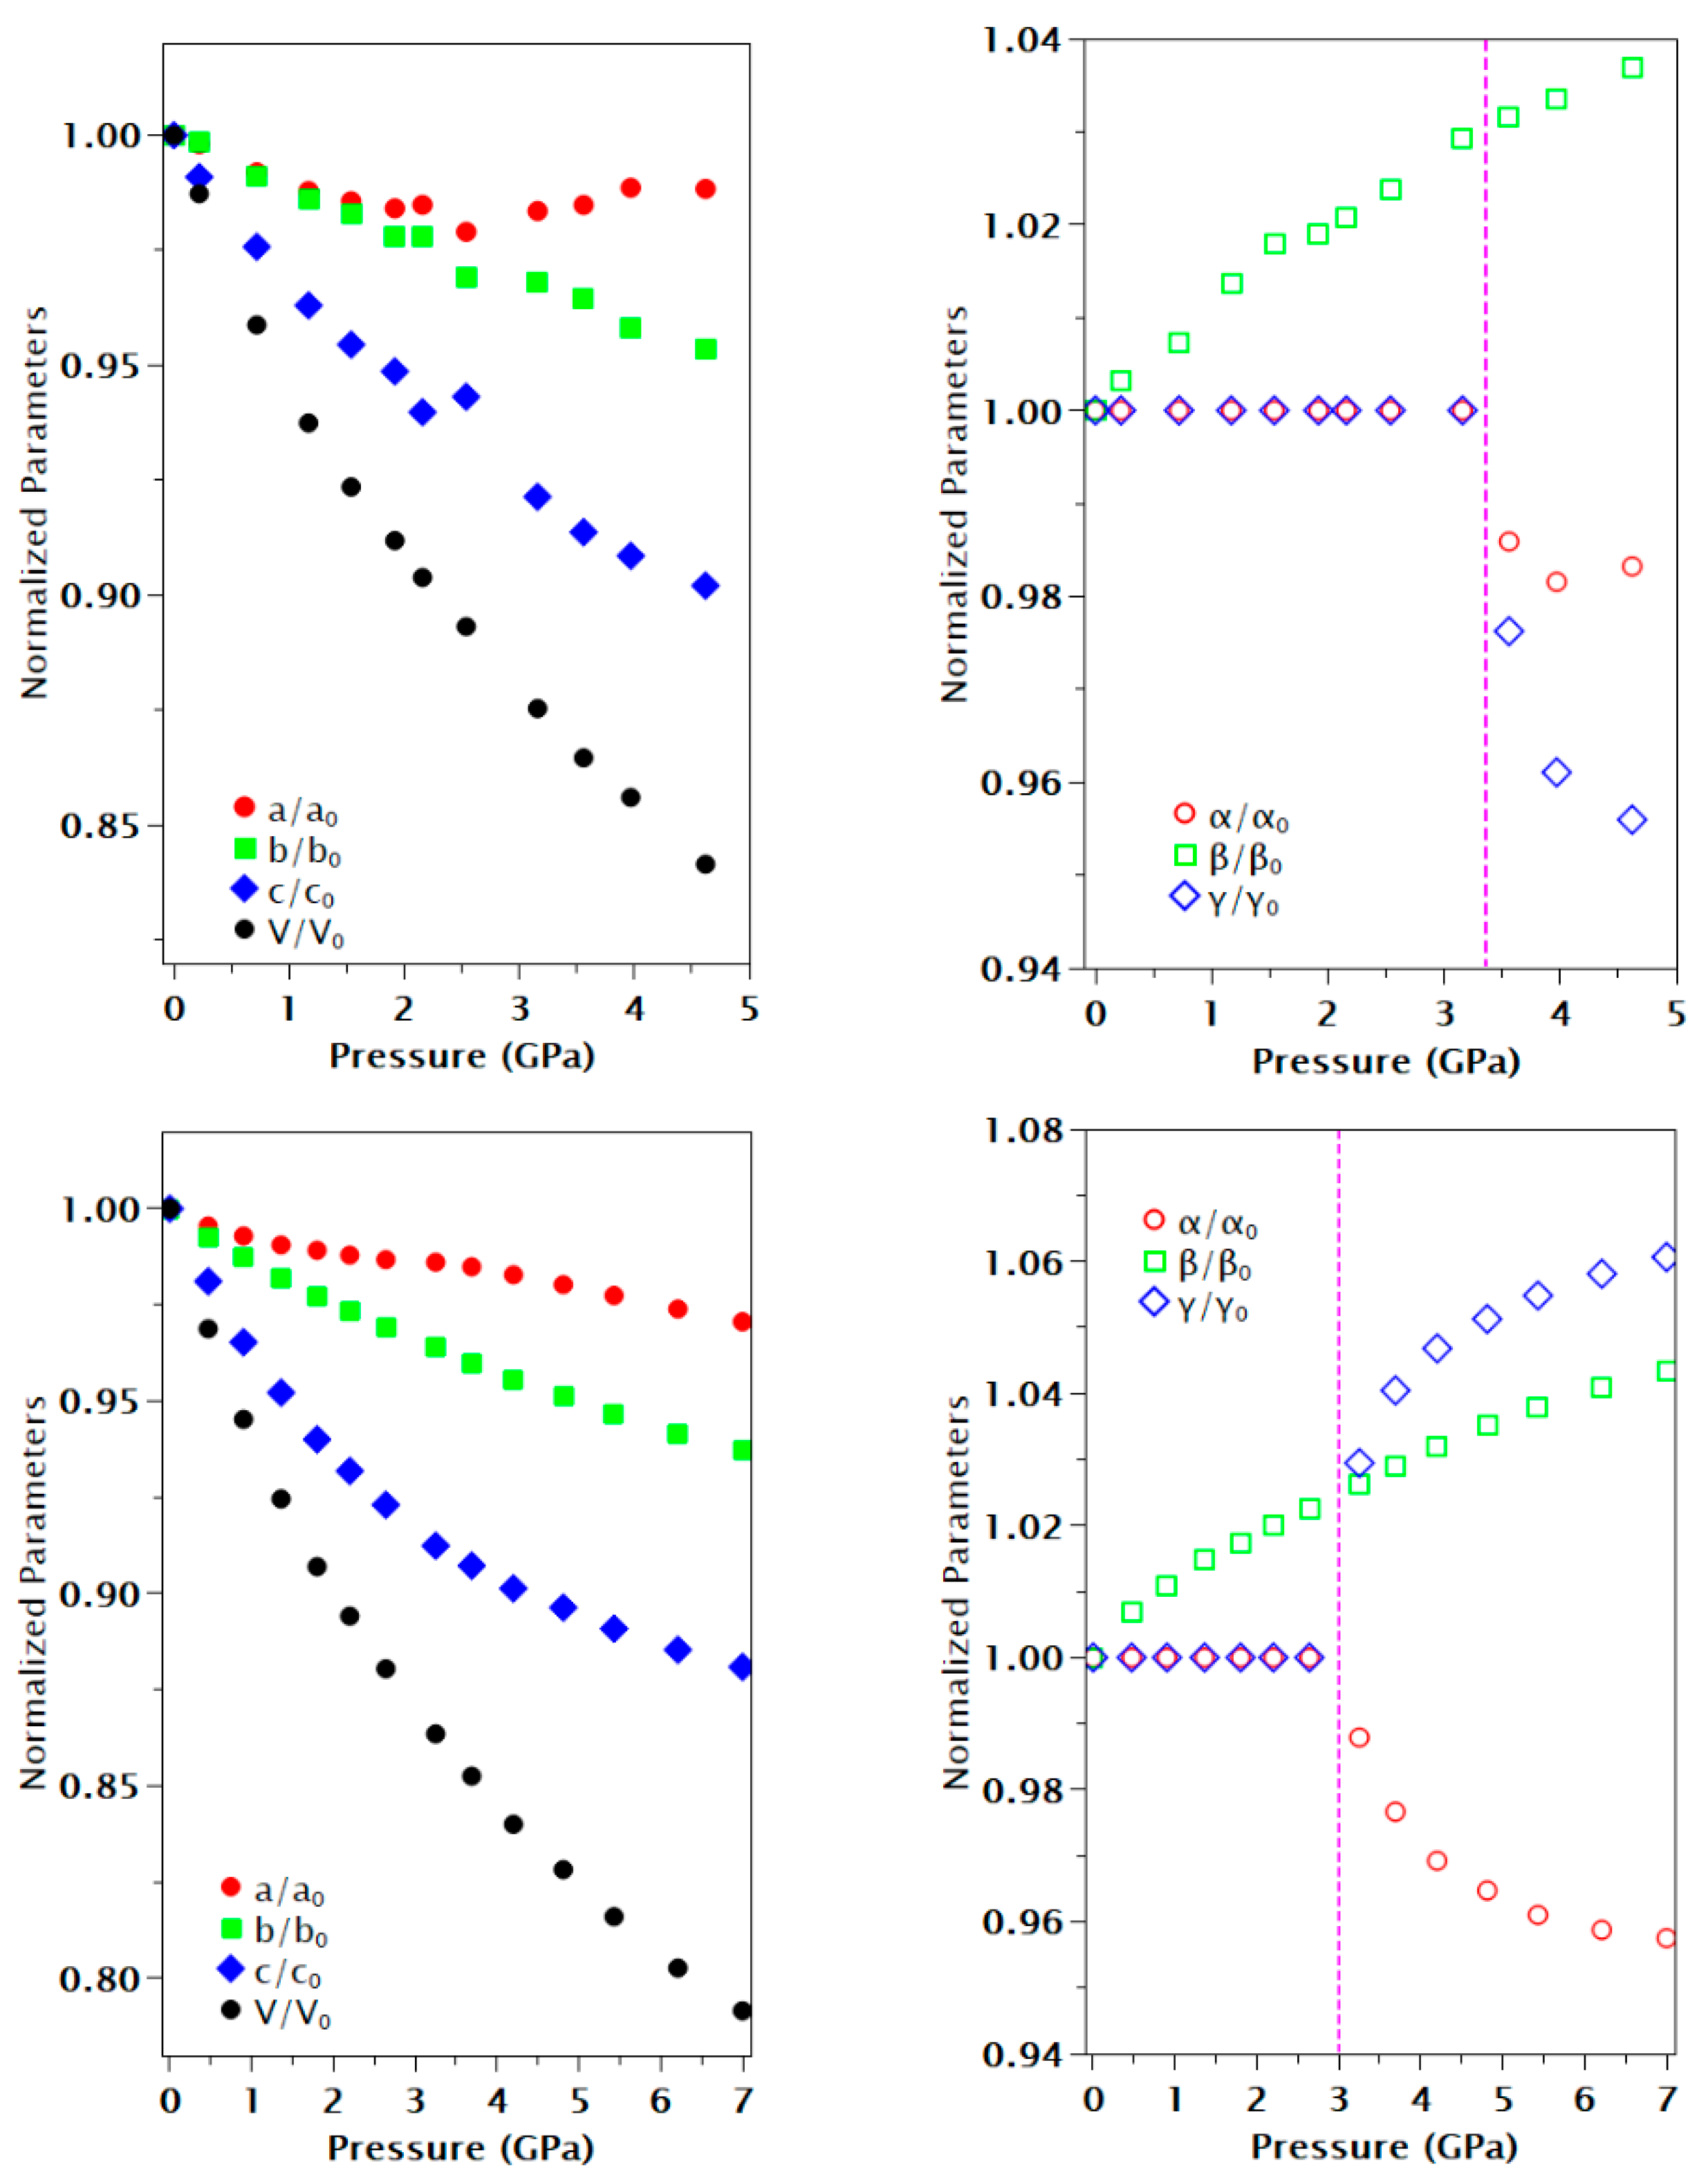
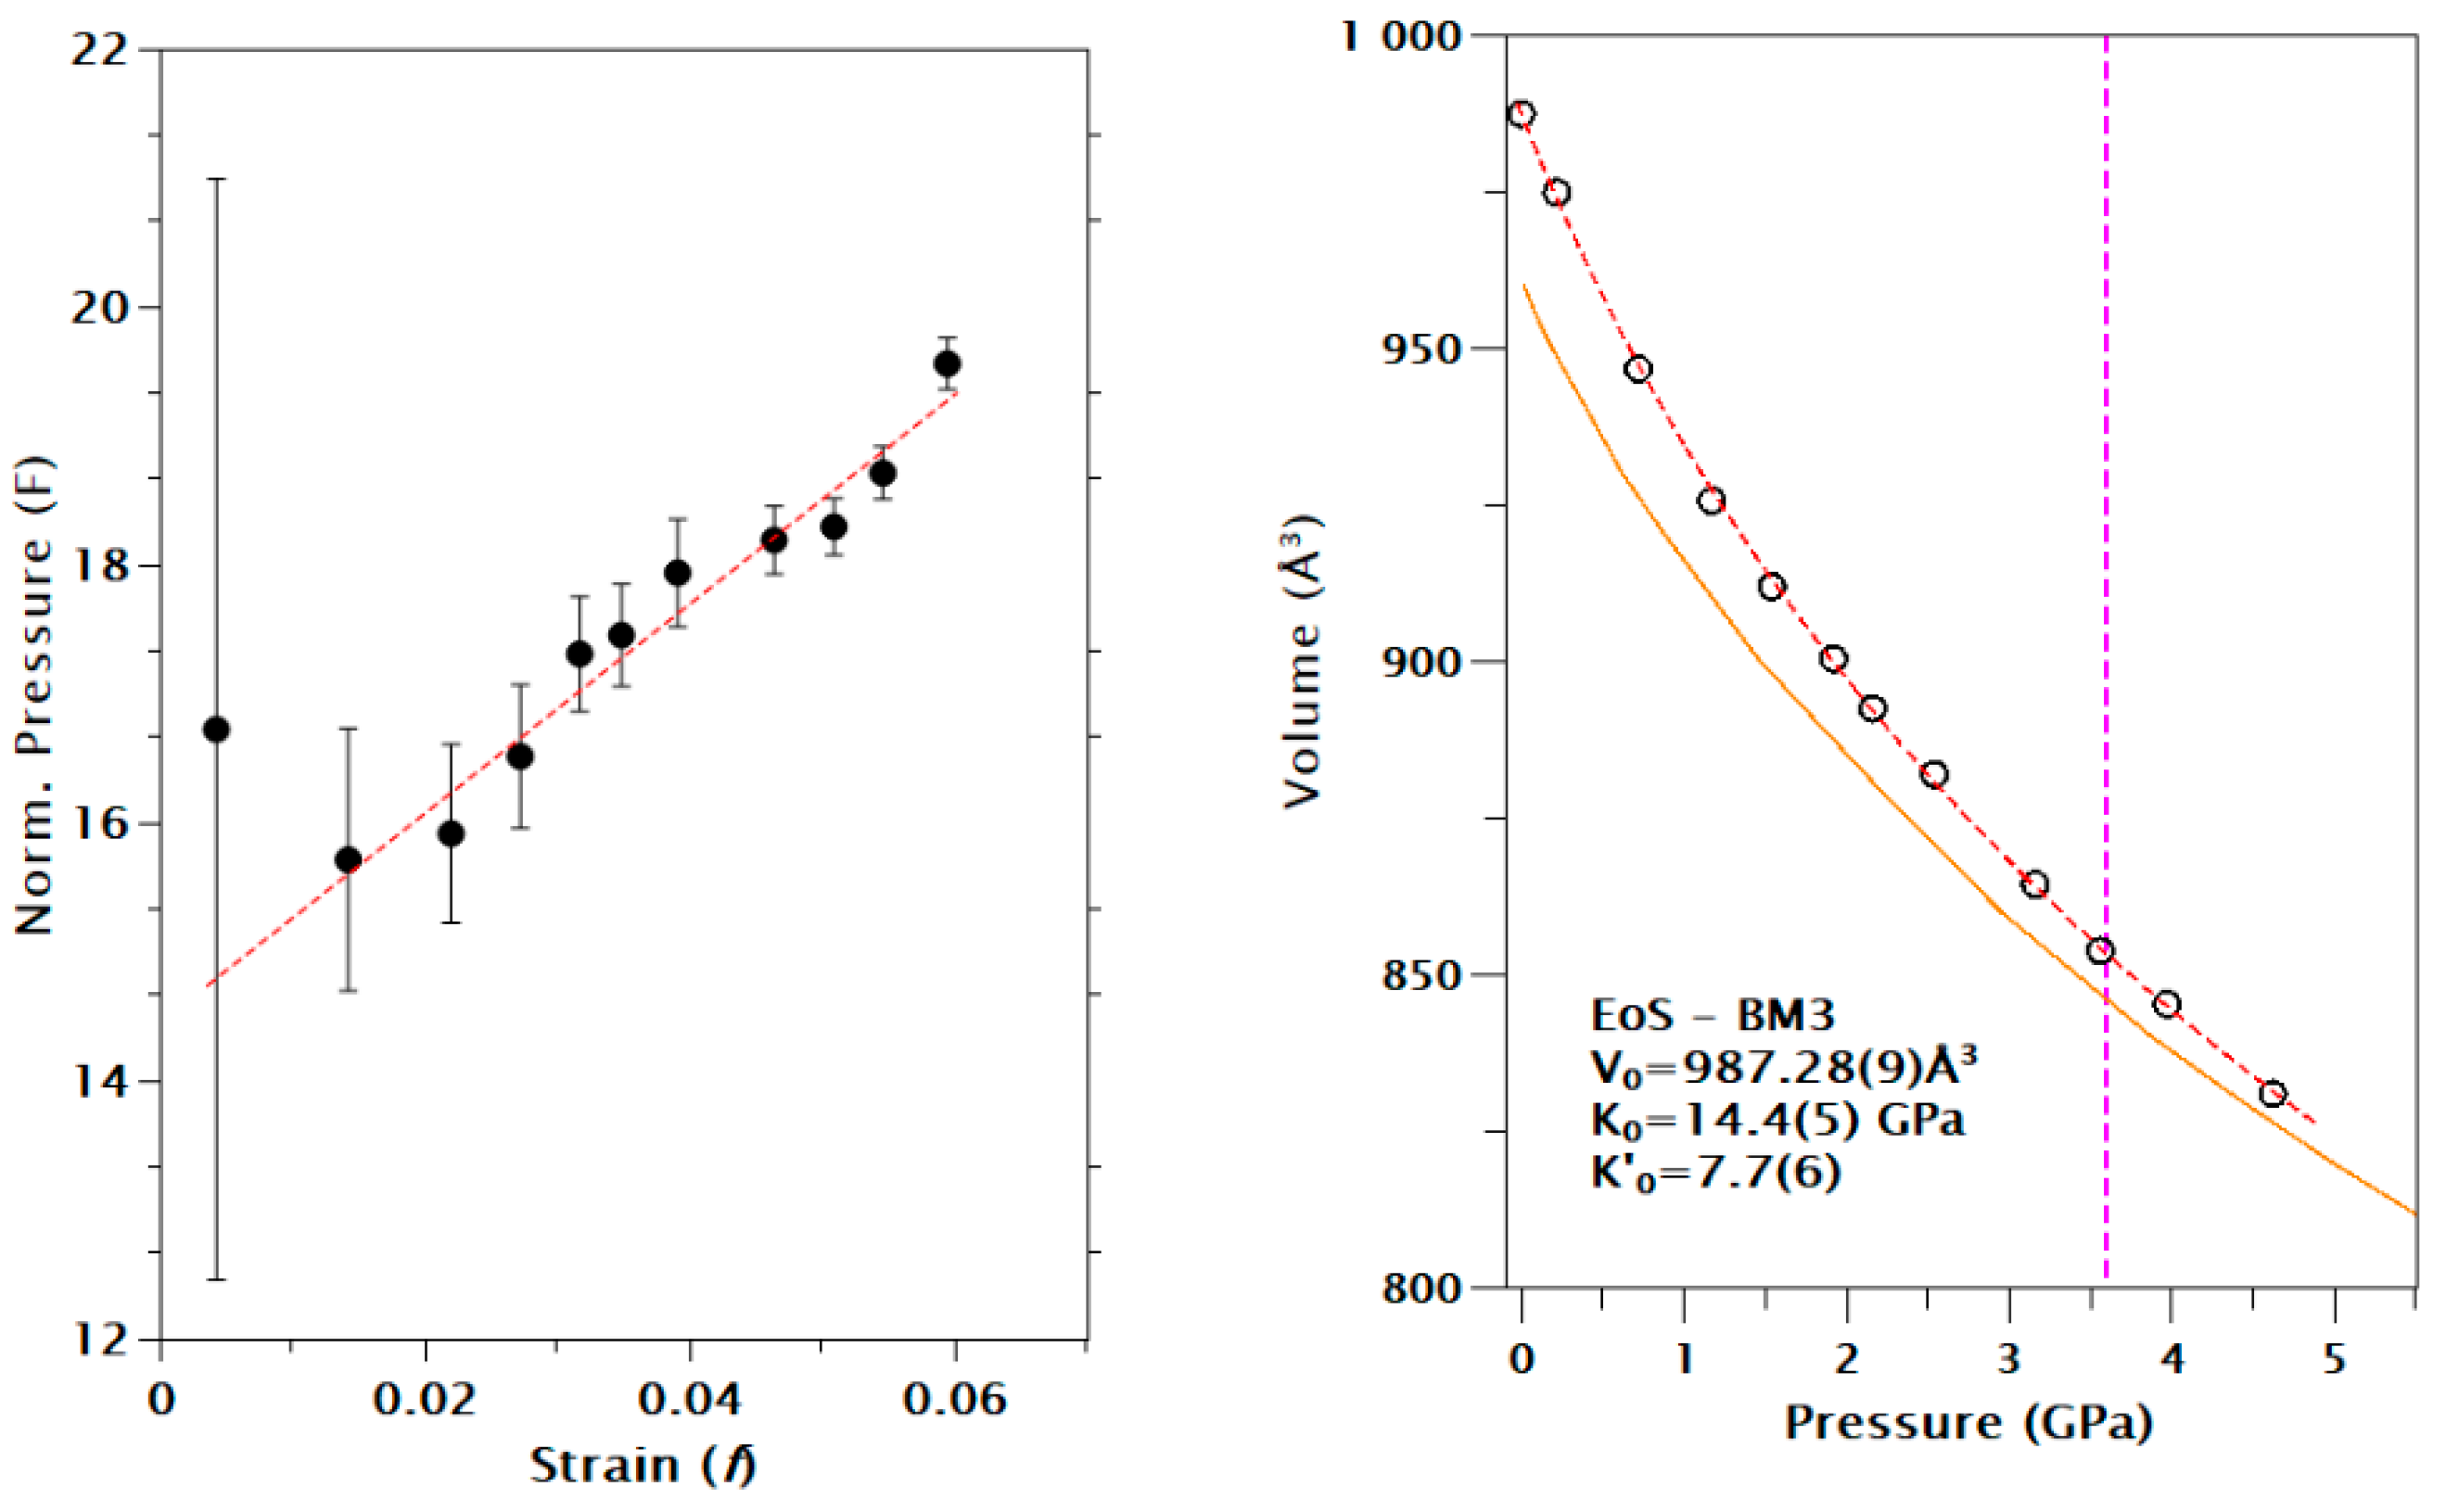
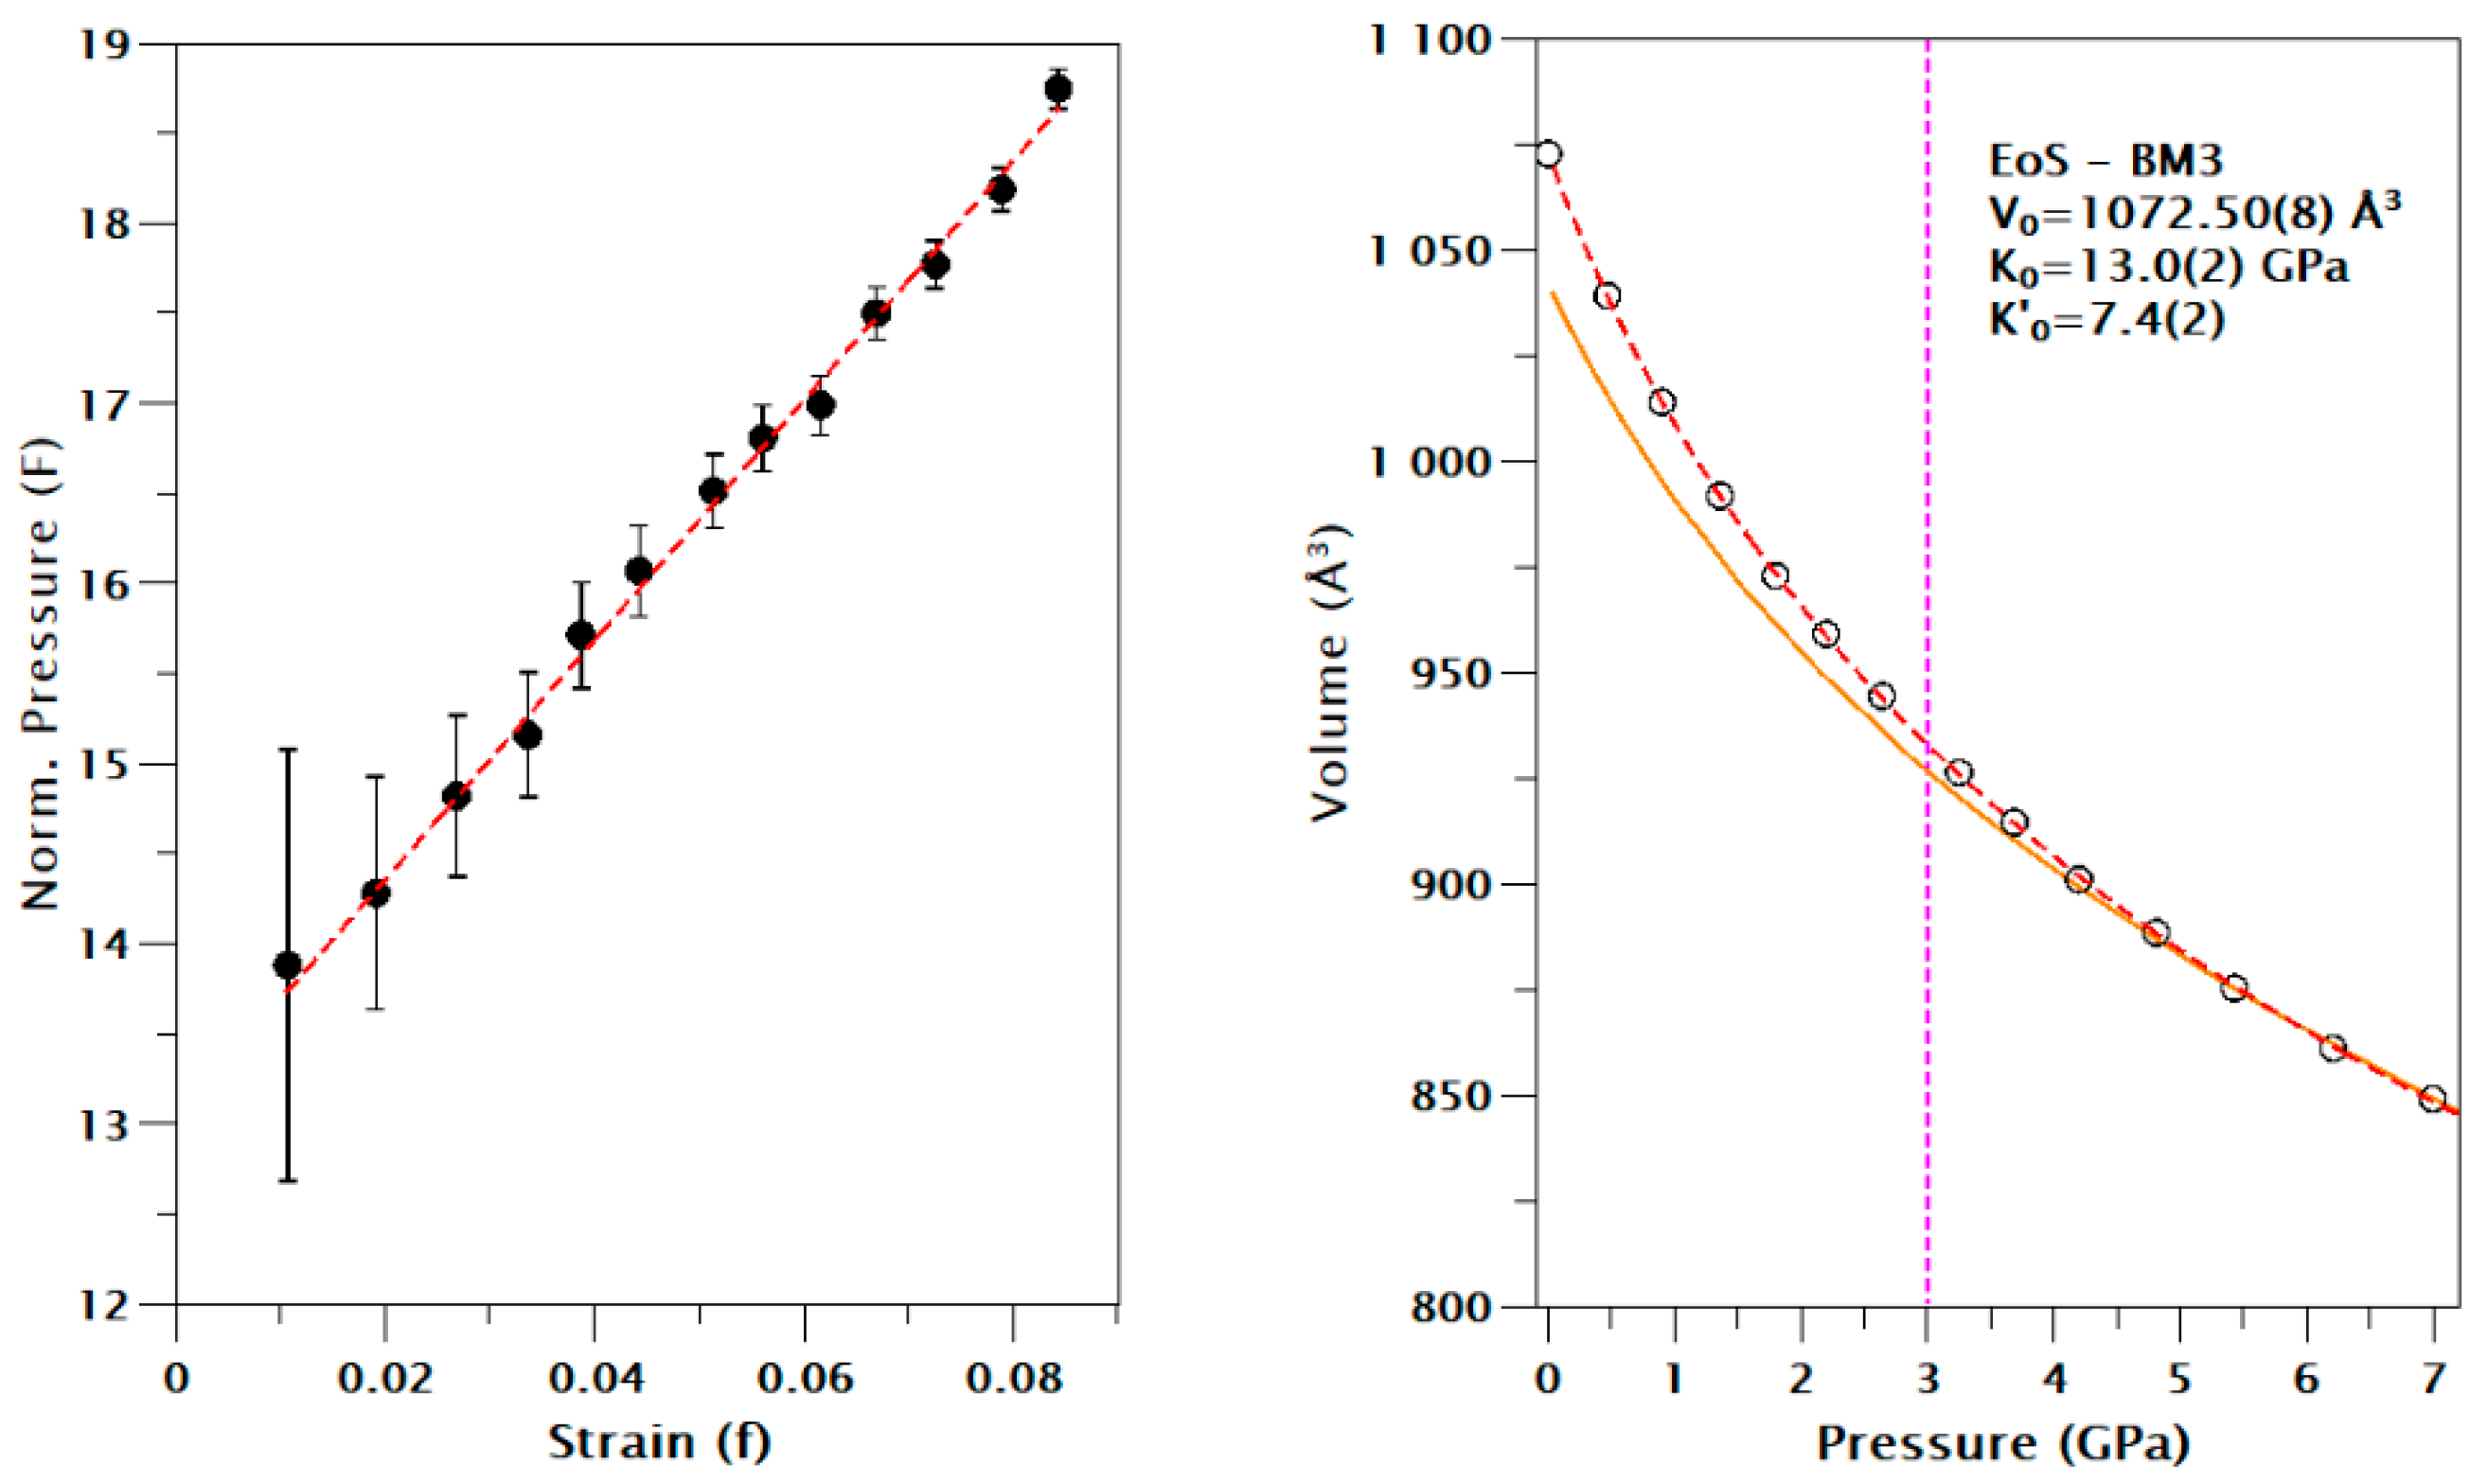
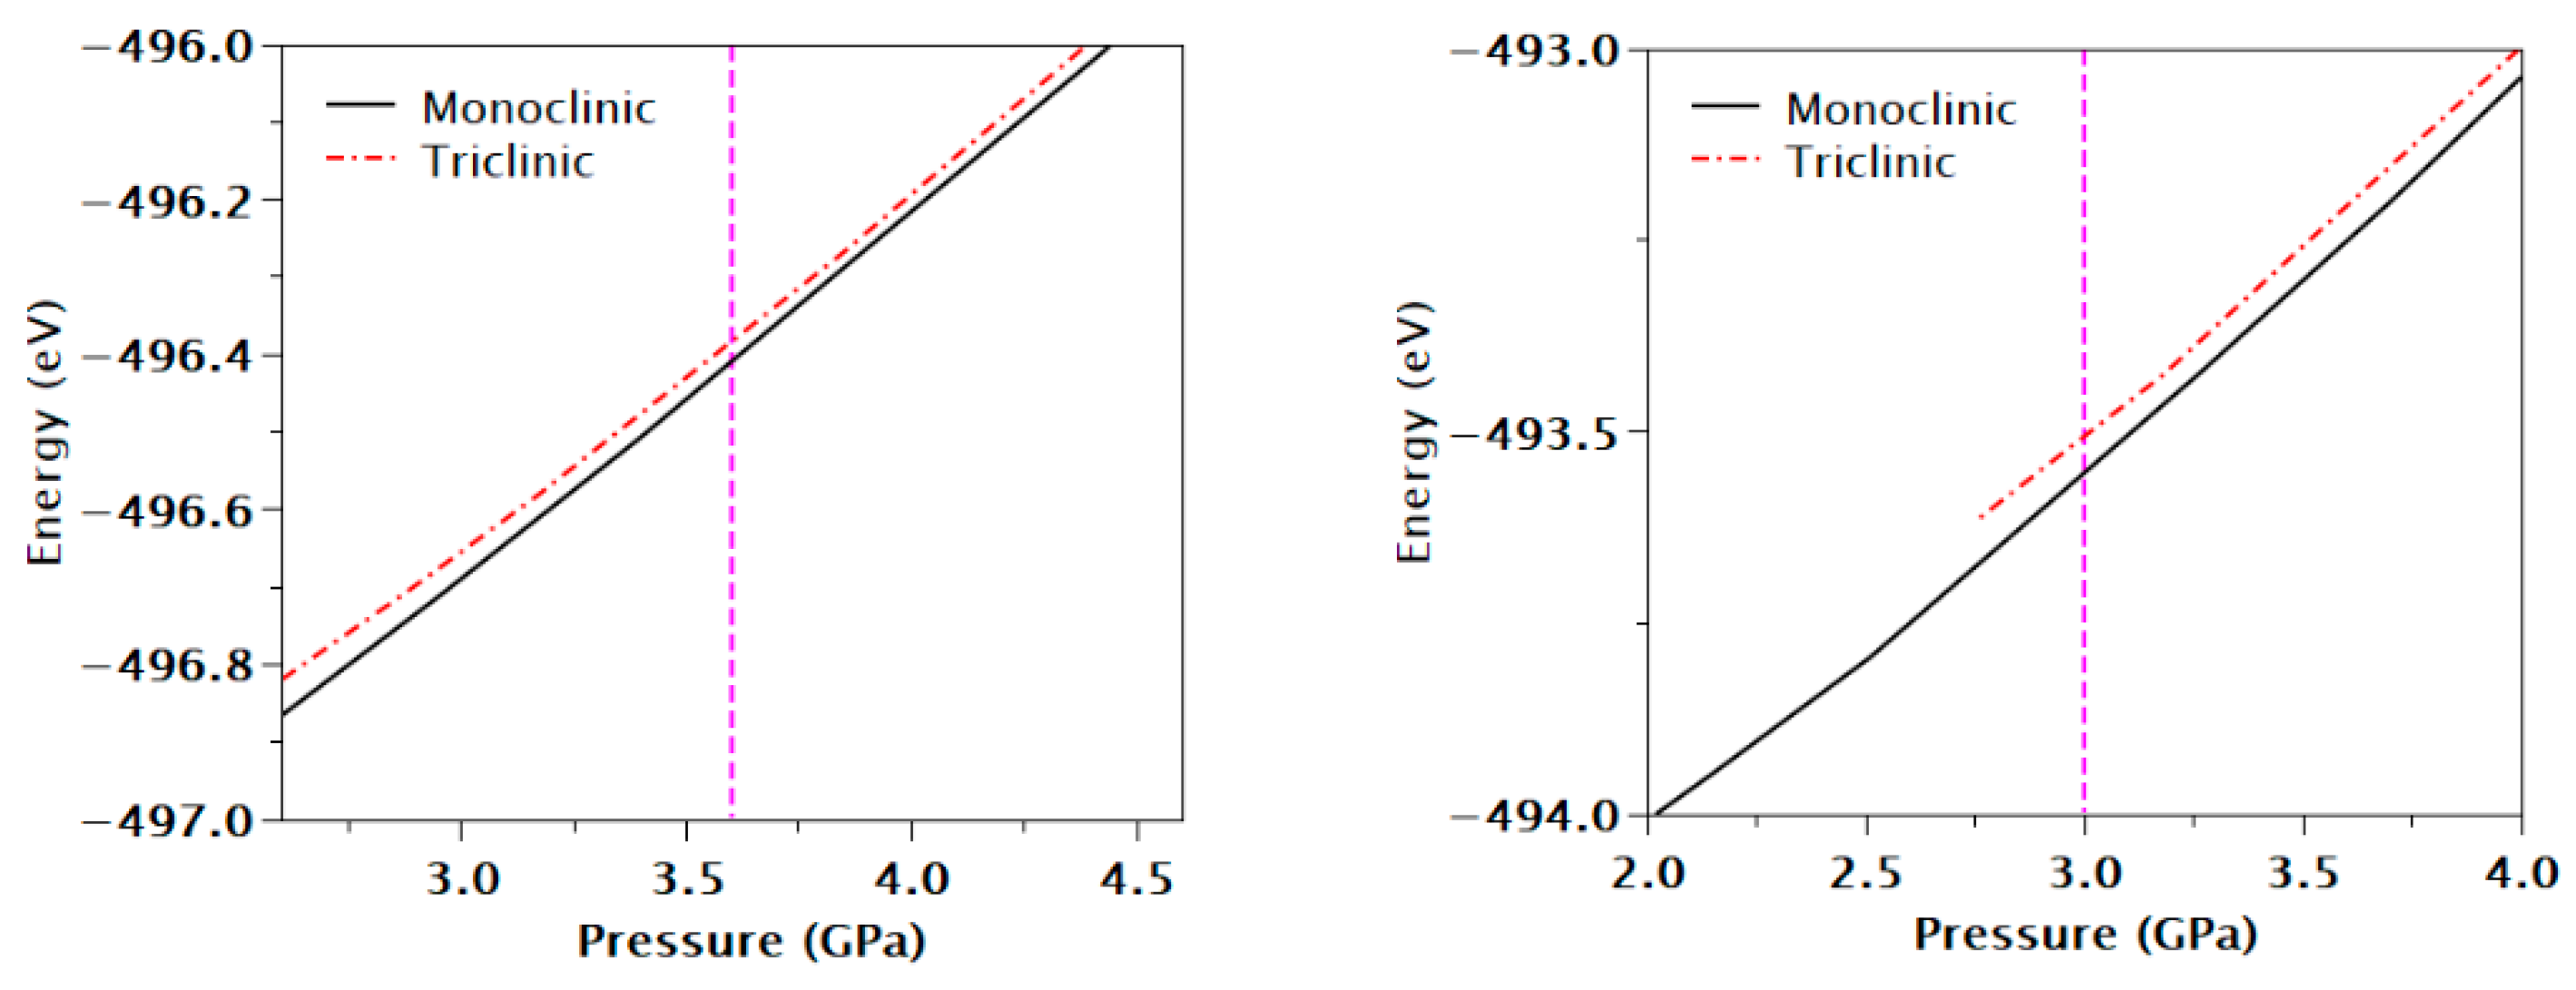
3.2. The Equation of State Analysis

The determination of the variation in volume with hydrostatic pressure at a fixed temperature is known as isothermal equation of state (EoS) analysis, whereby the volume variation is characterized by the bulk modulus (K) and its pressure derivatives (K′, K″, …). We calculated such parameters for both compounds using a Birch–Murnaghan (BM) EoS model using EoSFit7-GUI software [66,67]. In order to assign the correct order to be used in the fitting, we have to represent the normalized pressure (F) against finite strain (f) (i.e., f-F plot). In both cases, we can observe a linear behavior with a positive slope, indicating that volume can be fitted with a third-order BM EoS, as can be seen in Figure 6.
The bulk modulus (K0) and its first derivative (K0) were 14.4(5) GPa and 7.7(6) for [(CuBr)2(Quin)] and 13.0(2) GPa and 7.4(2) for [(CuI)2(Quin)], respectively.
In general, this type of compound has a very anisotropic compression, especially when the compounds crystallize in monoclinic or triclinic systems. From Figure 3, we can observe this phenomenon, whereby the c-axis is substantially softer than the b- and a-axes. The bulk modulus obtained for both compounds falls in the range of 10–20 GPa, which is typical for organometallic compounds [68]. A quite similar case is the 2D coordination polymer with the formula Cu2I2(2-aminopyrazine) [36], where the bulk modulus (K0) and its first derivative (K0) were 14.1(3) GPa and 7.4(2), respectively, using the same EoS model (BM3) in the fitting calculations. For similar staircase polymers of CuI iodides (1D), the bulk moduli were slightly smaller at around 10 GPa [37,46], and the exceptionally small bulk modulus of 7.5(4) GPa for CuI(3,5-dichloropyridine) [38] was probably due to the existence of a phase transition of the first order at 6 GPa. For 0D cases, such as a Cu4I4 cluster with different organic ligands [47], the trend is that the bulk modulus is even smaller (K0 around 9 GPa or less). Therefore, we can conclude that the coordination dimensionality in this type of compound influences the compressibility values. In cases where the compressibility is high, this can be attributed to the deformability of the intermolecular interactions.
Unfortunately, the simulations carried out in this investigation (not only with the PBE + D3 functional but also with other commonly used functionals such as PBESol) have not reproduced the phase transition that was experimentally observed in both compounds. The simulation study shows us that in both compounds, the most favorable energy configuration is the monoclinic one rather than the triclinic one, as can be seen in Figure 7.

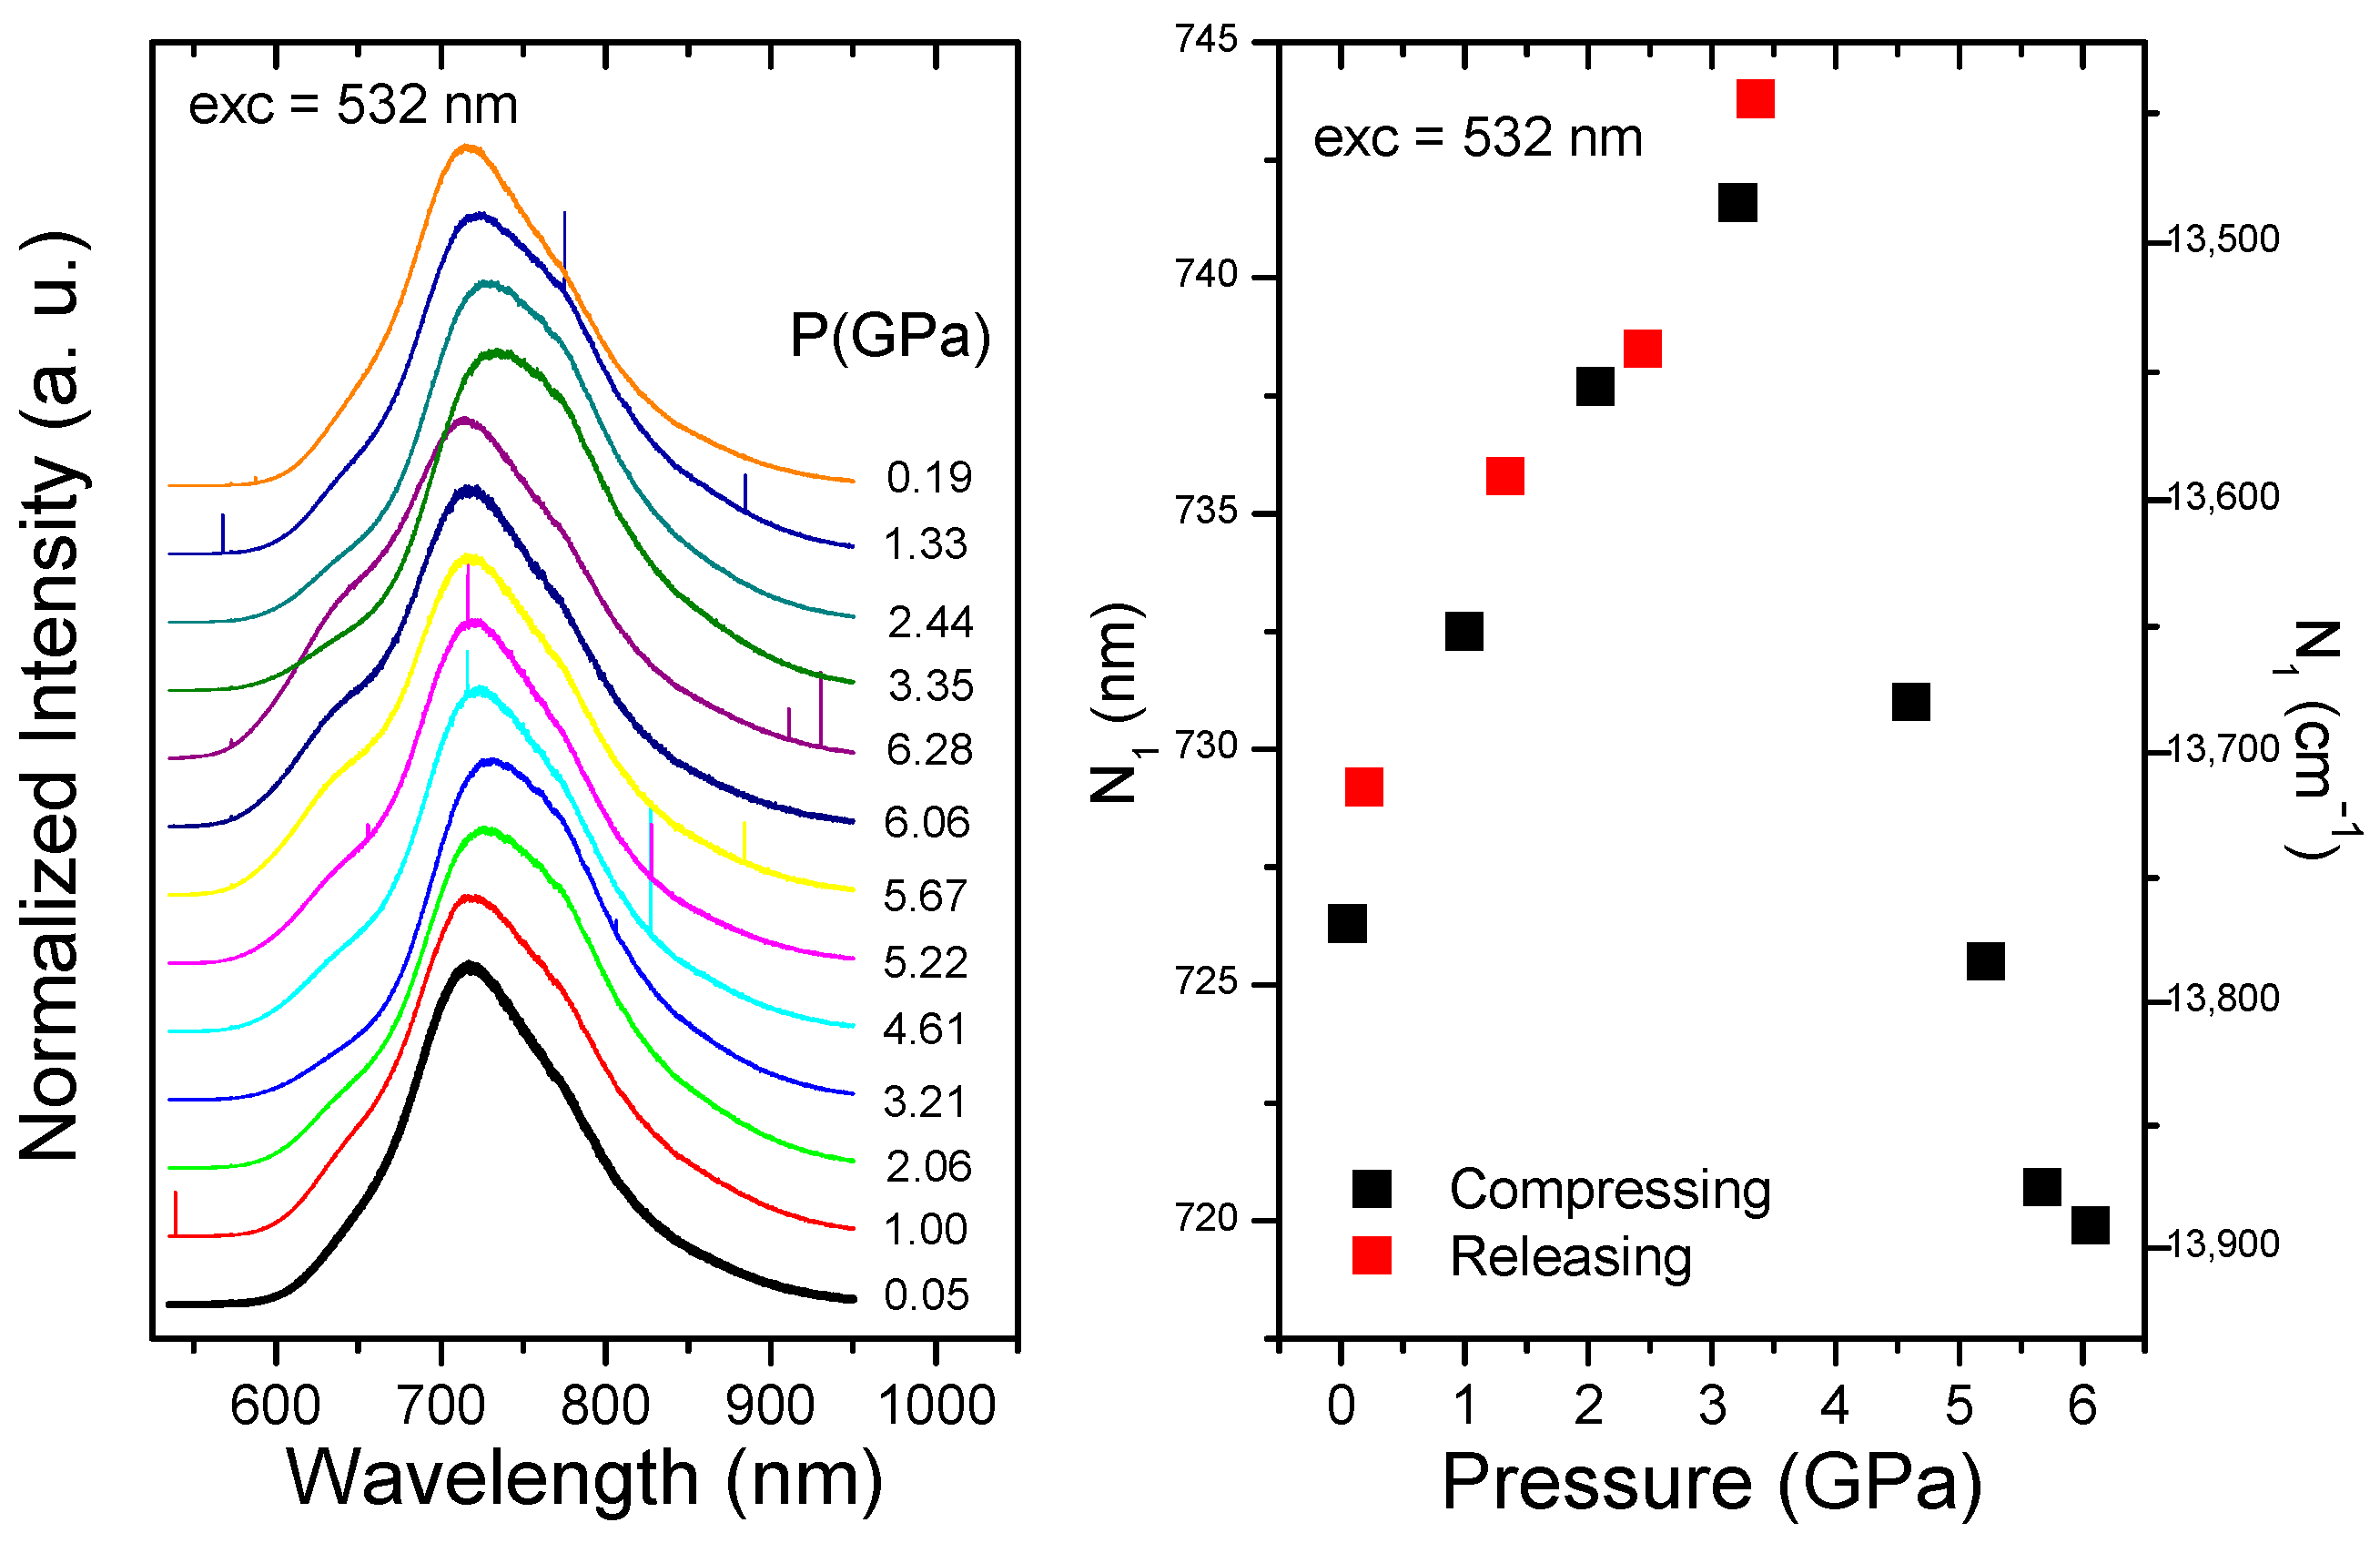
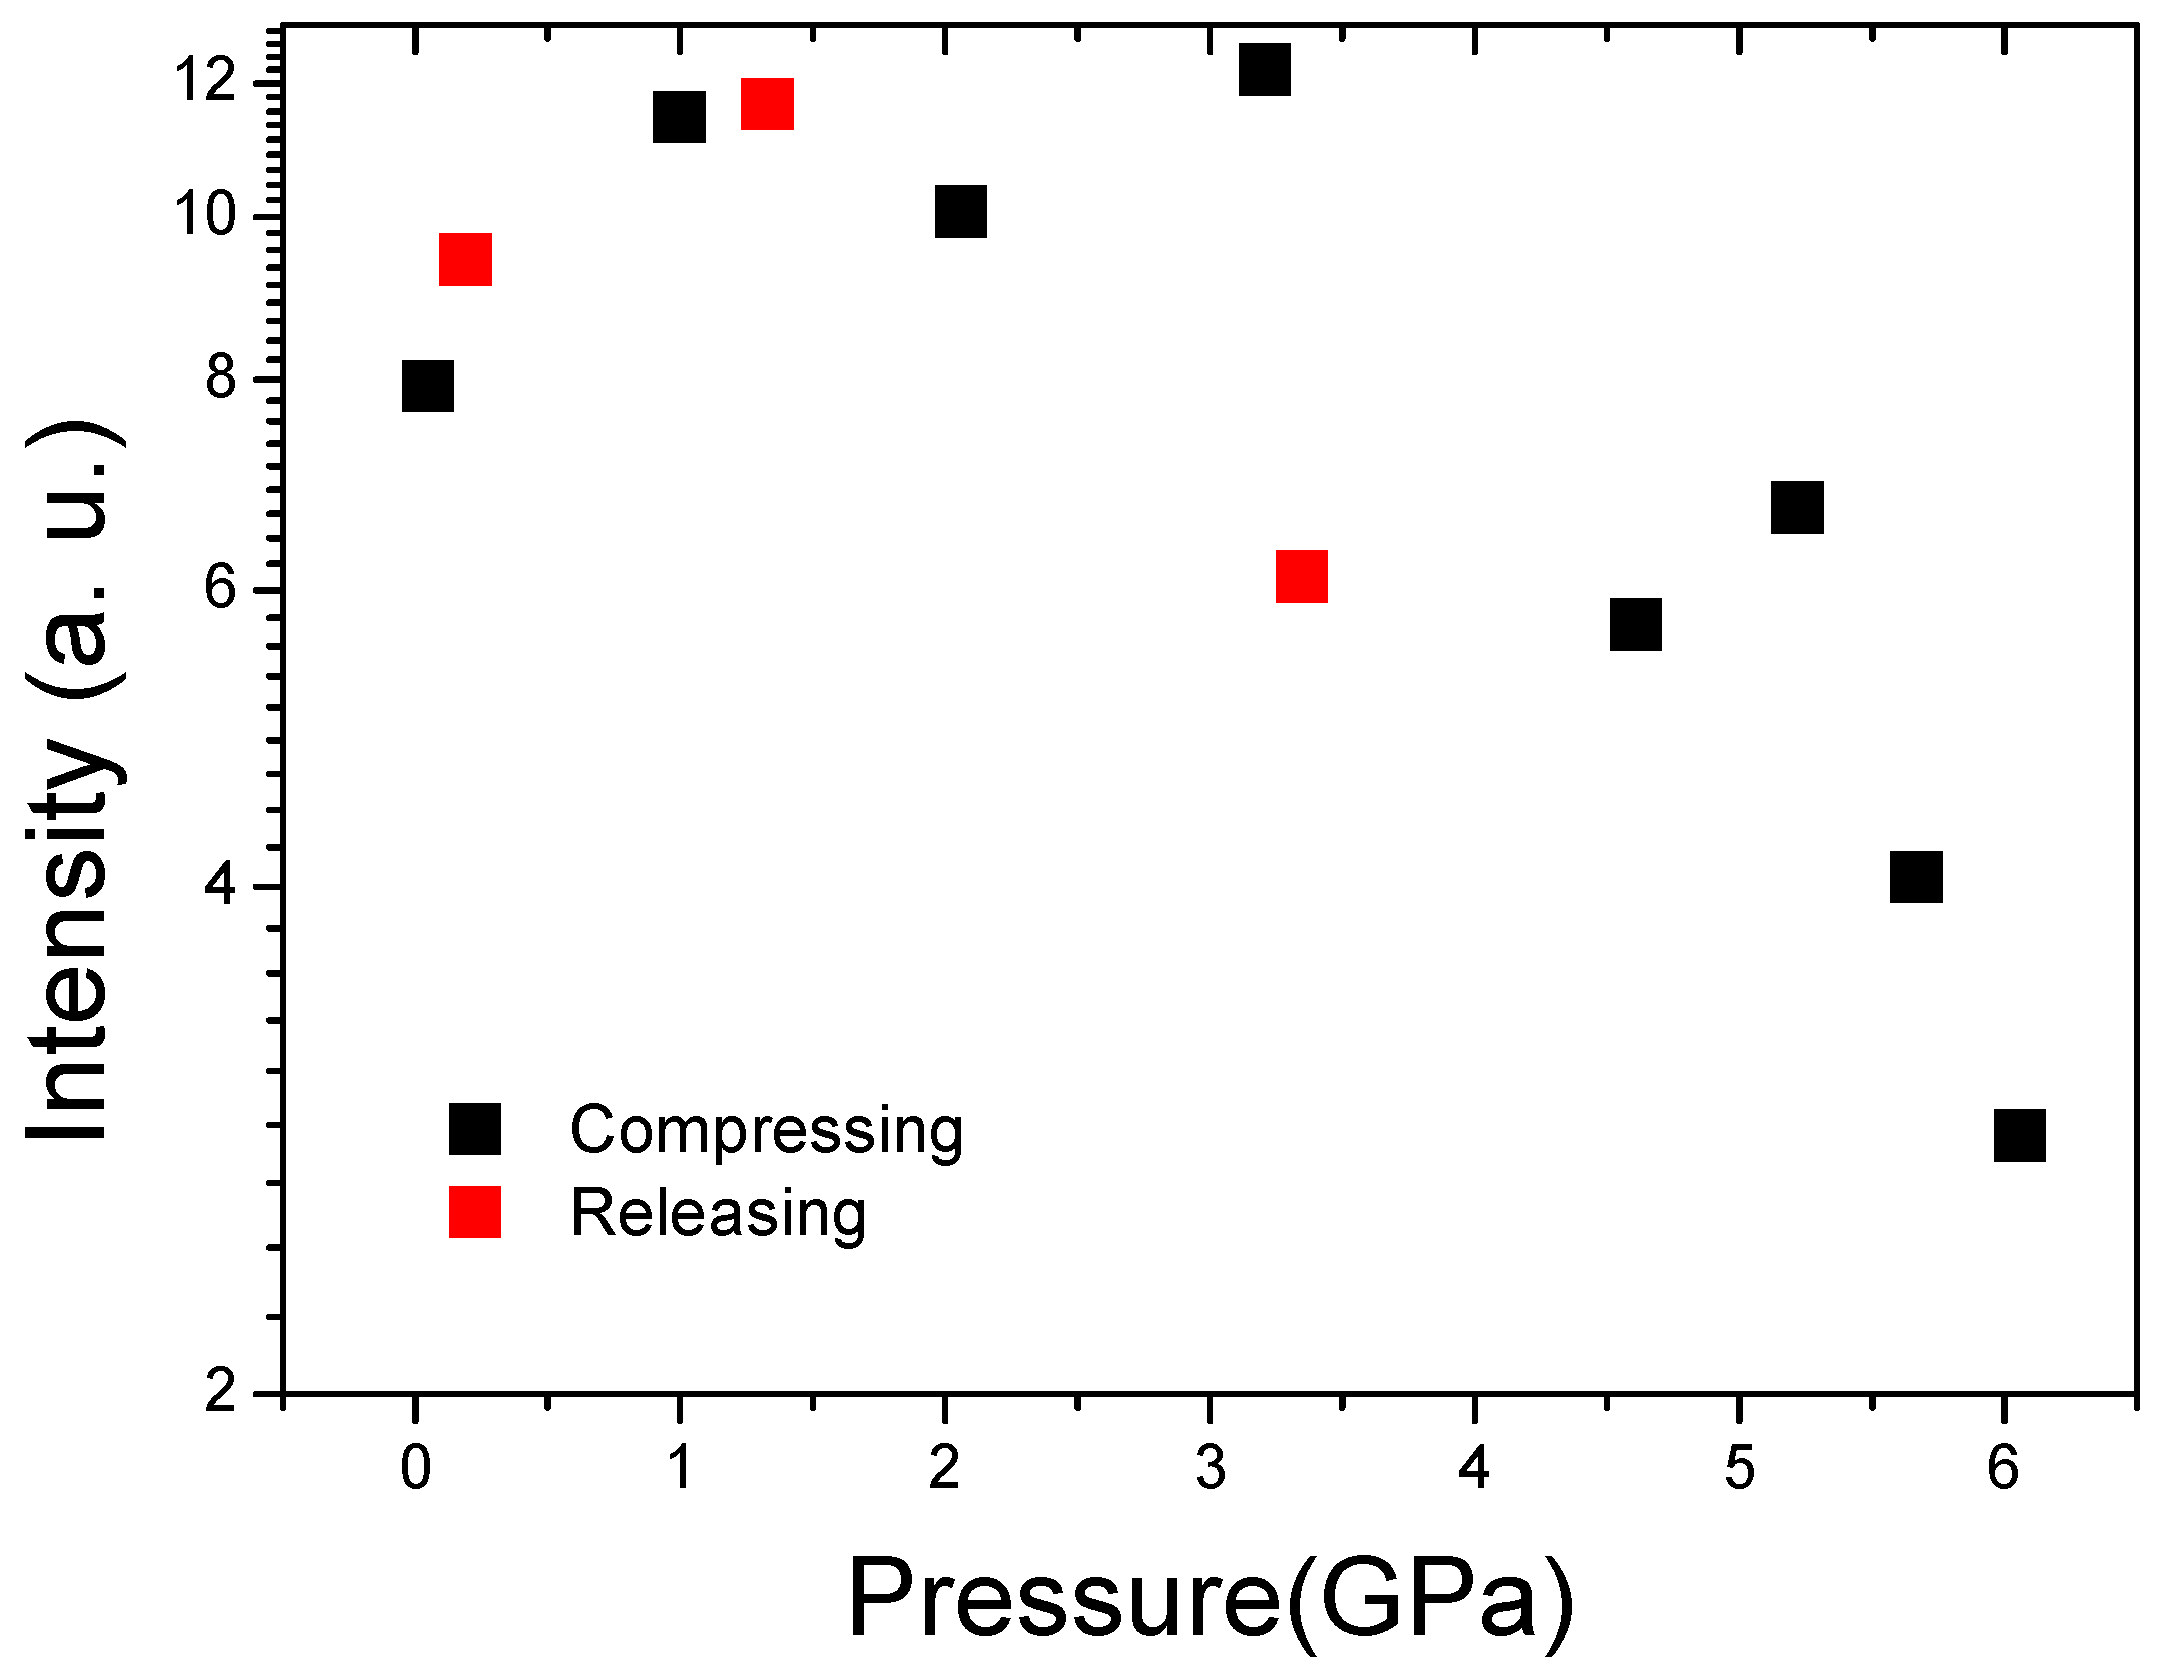
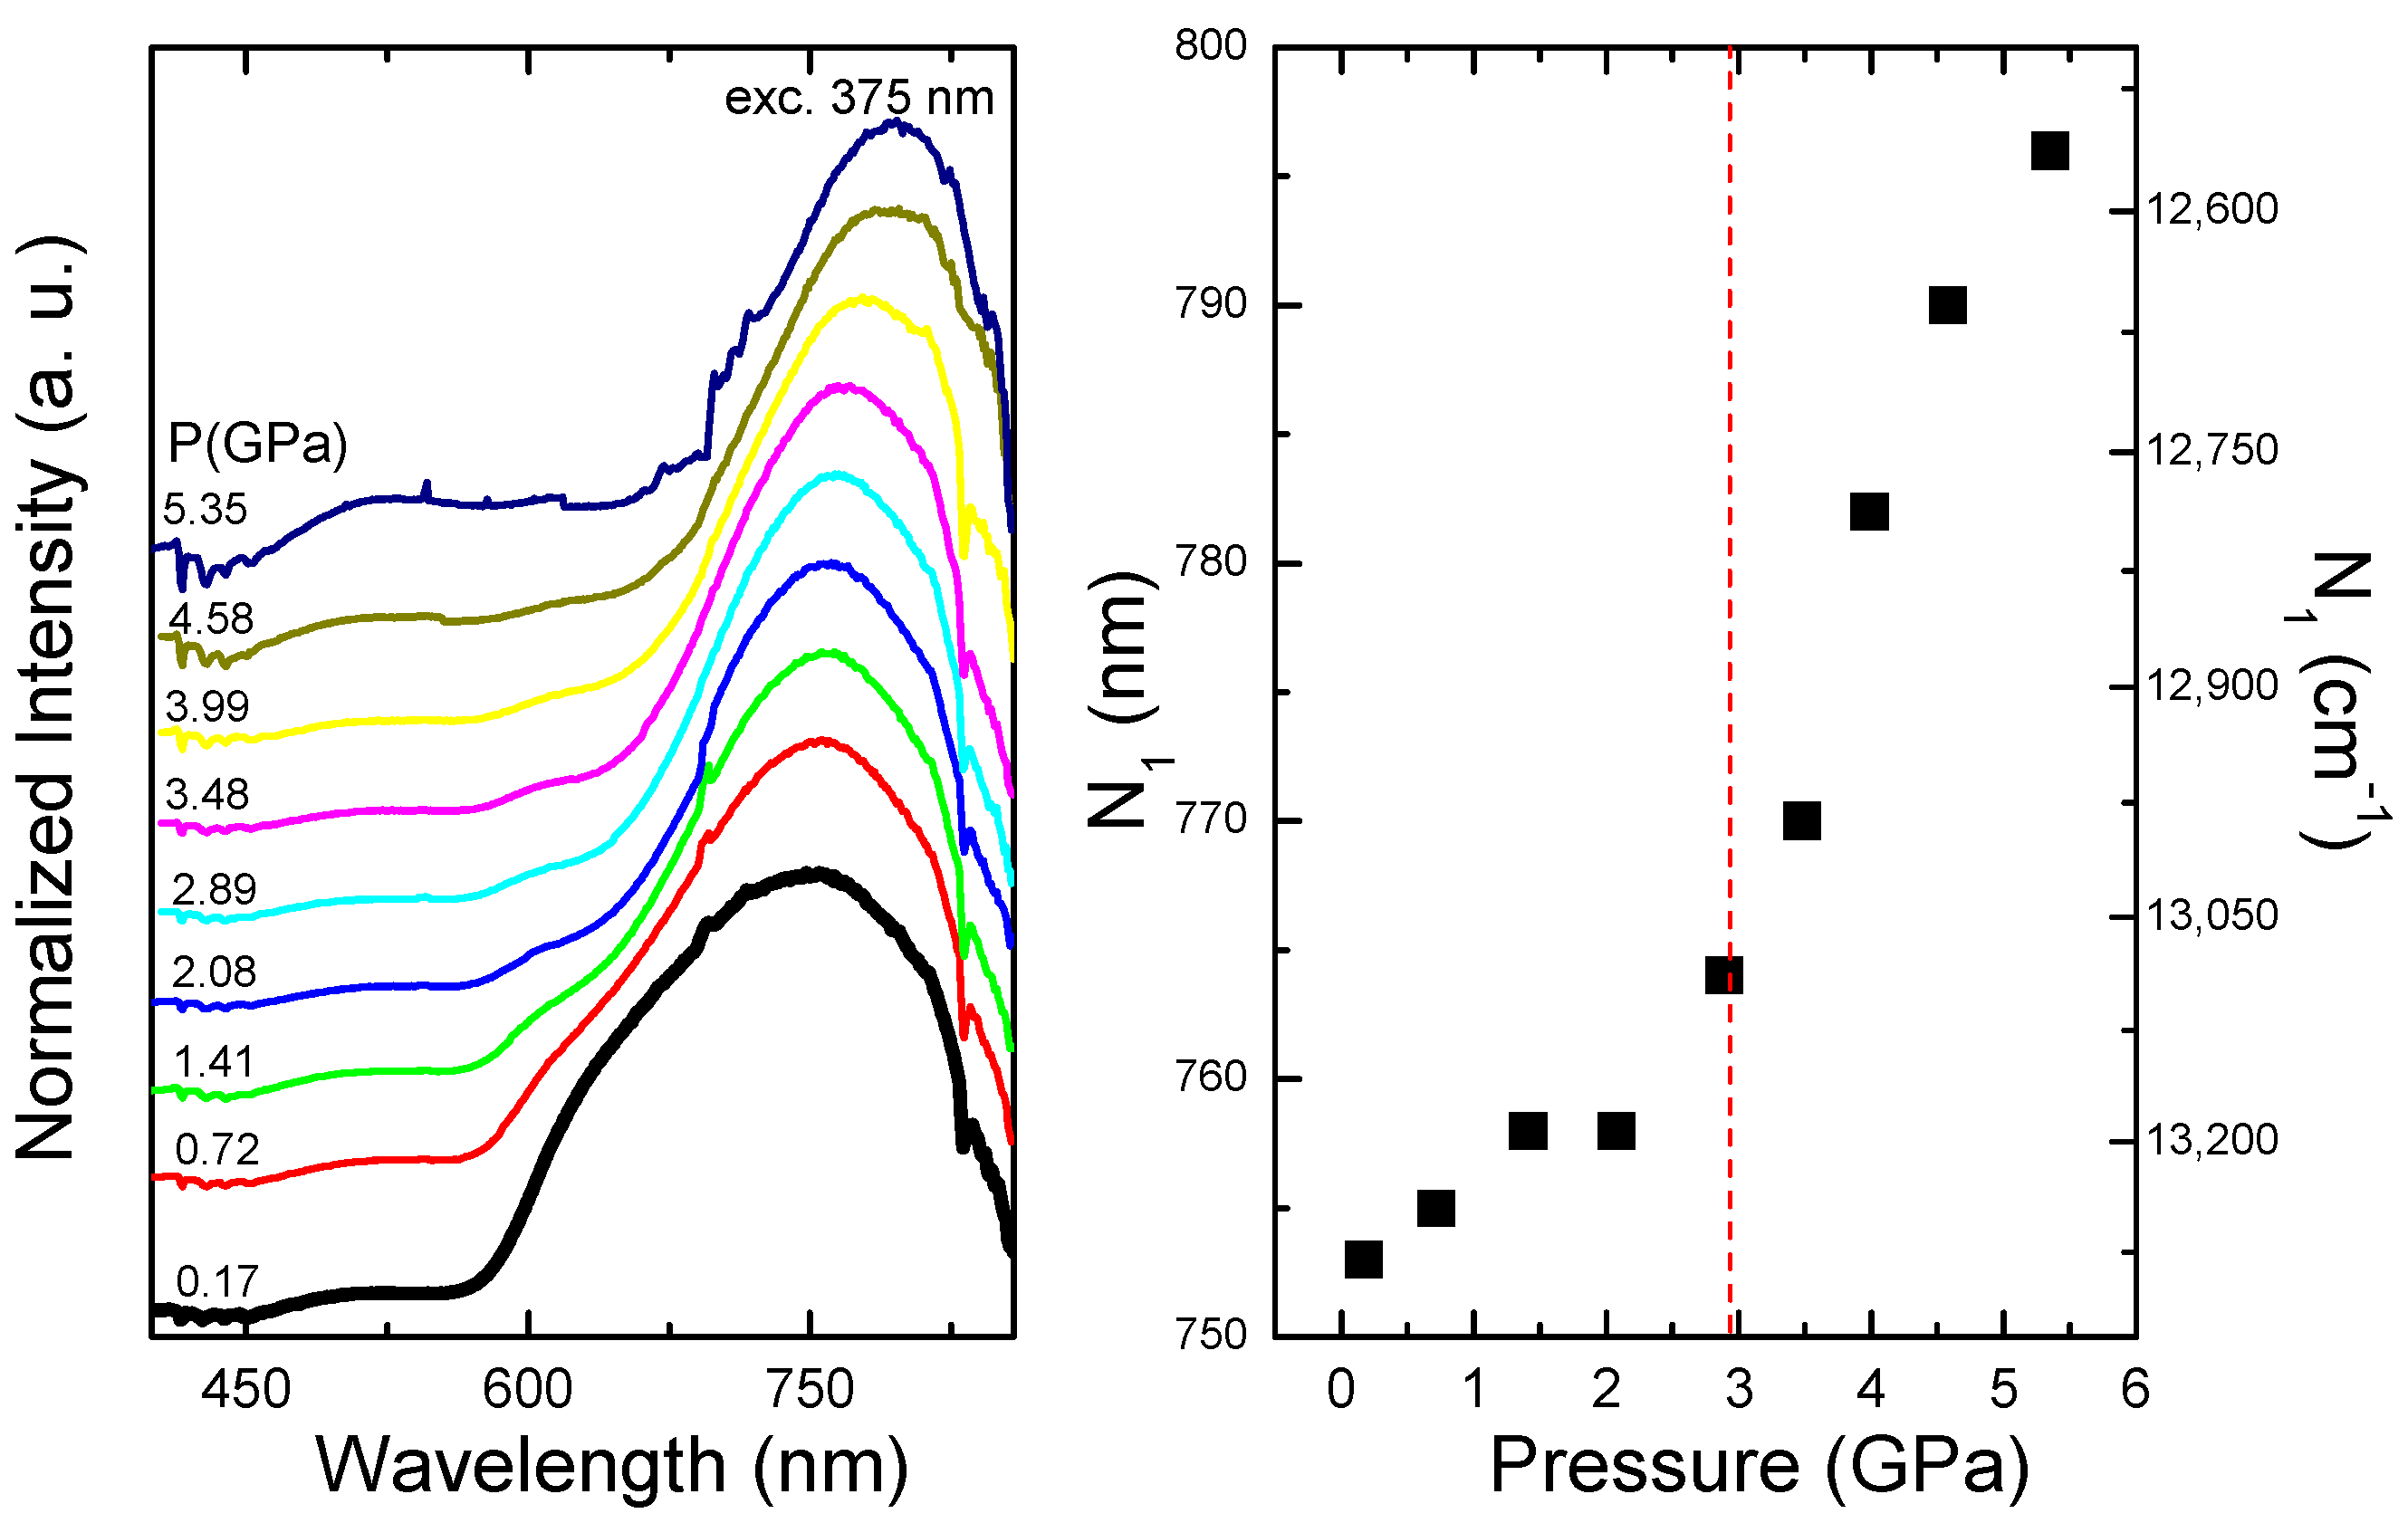
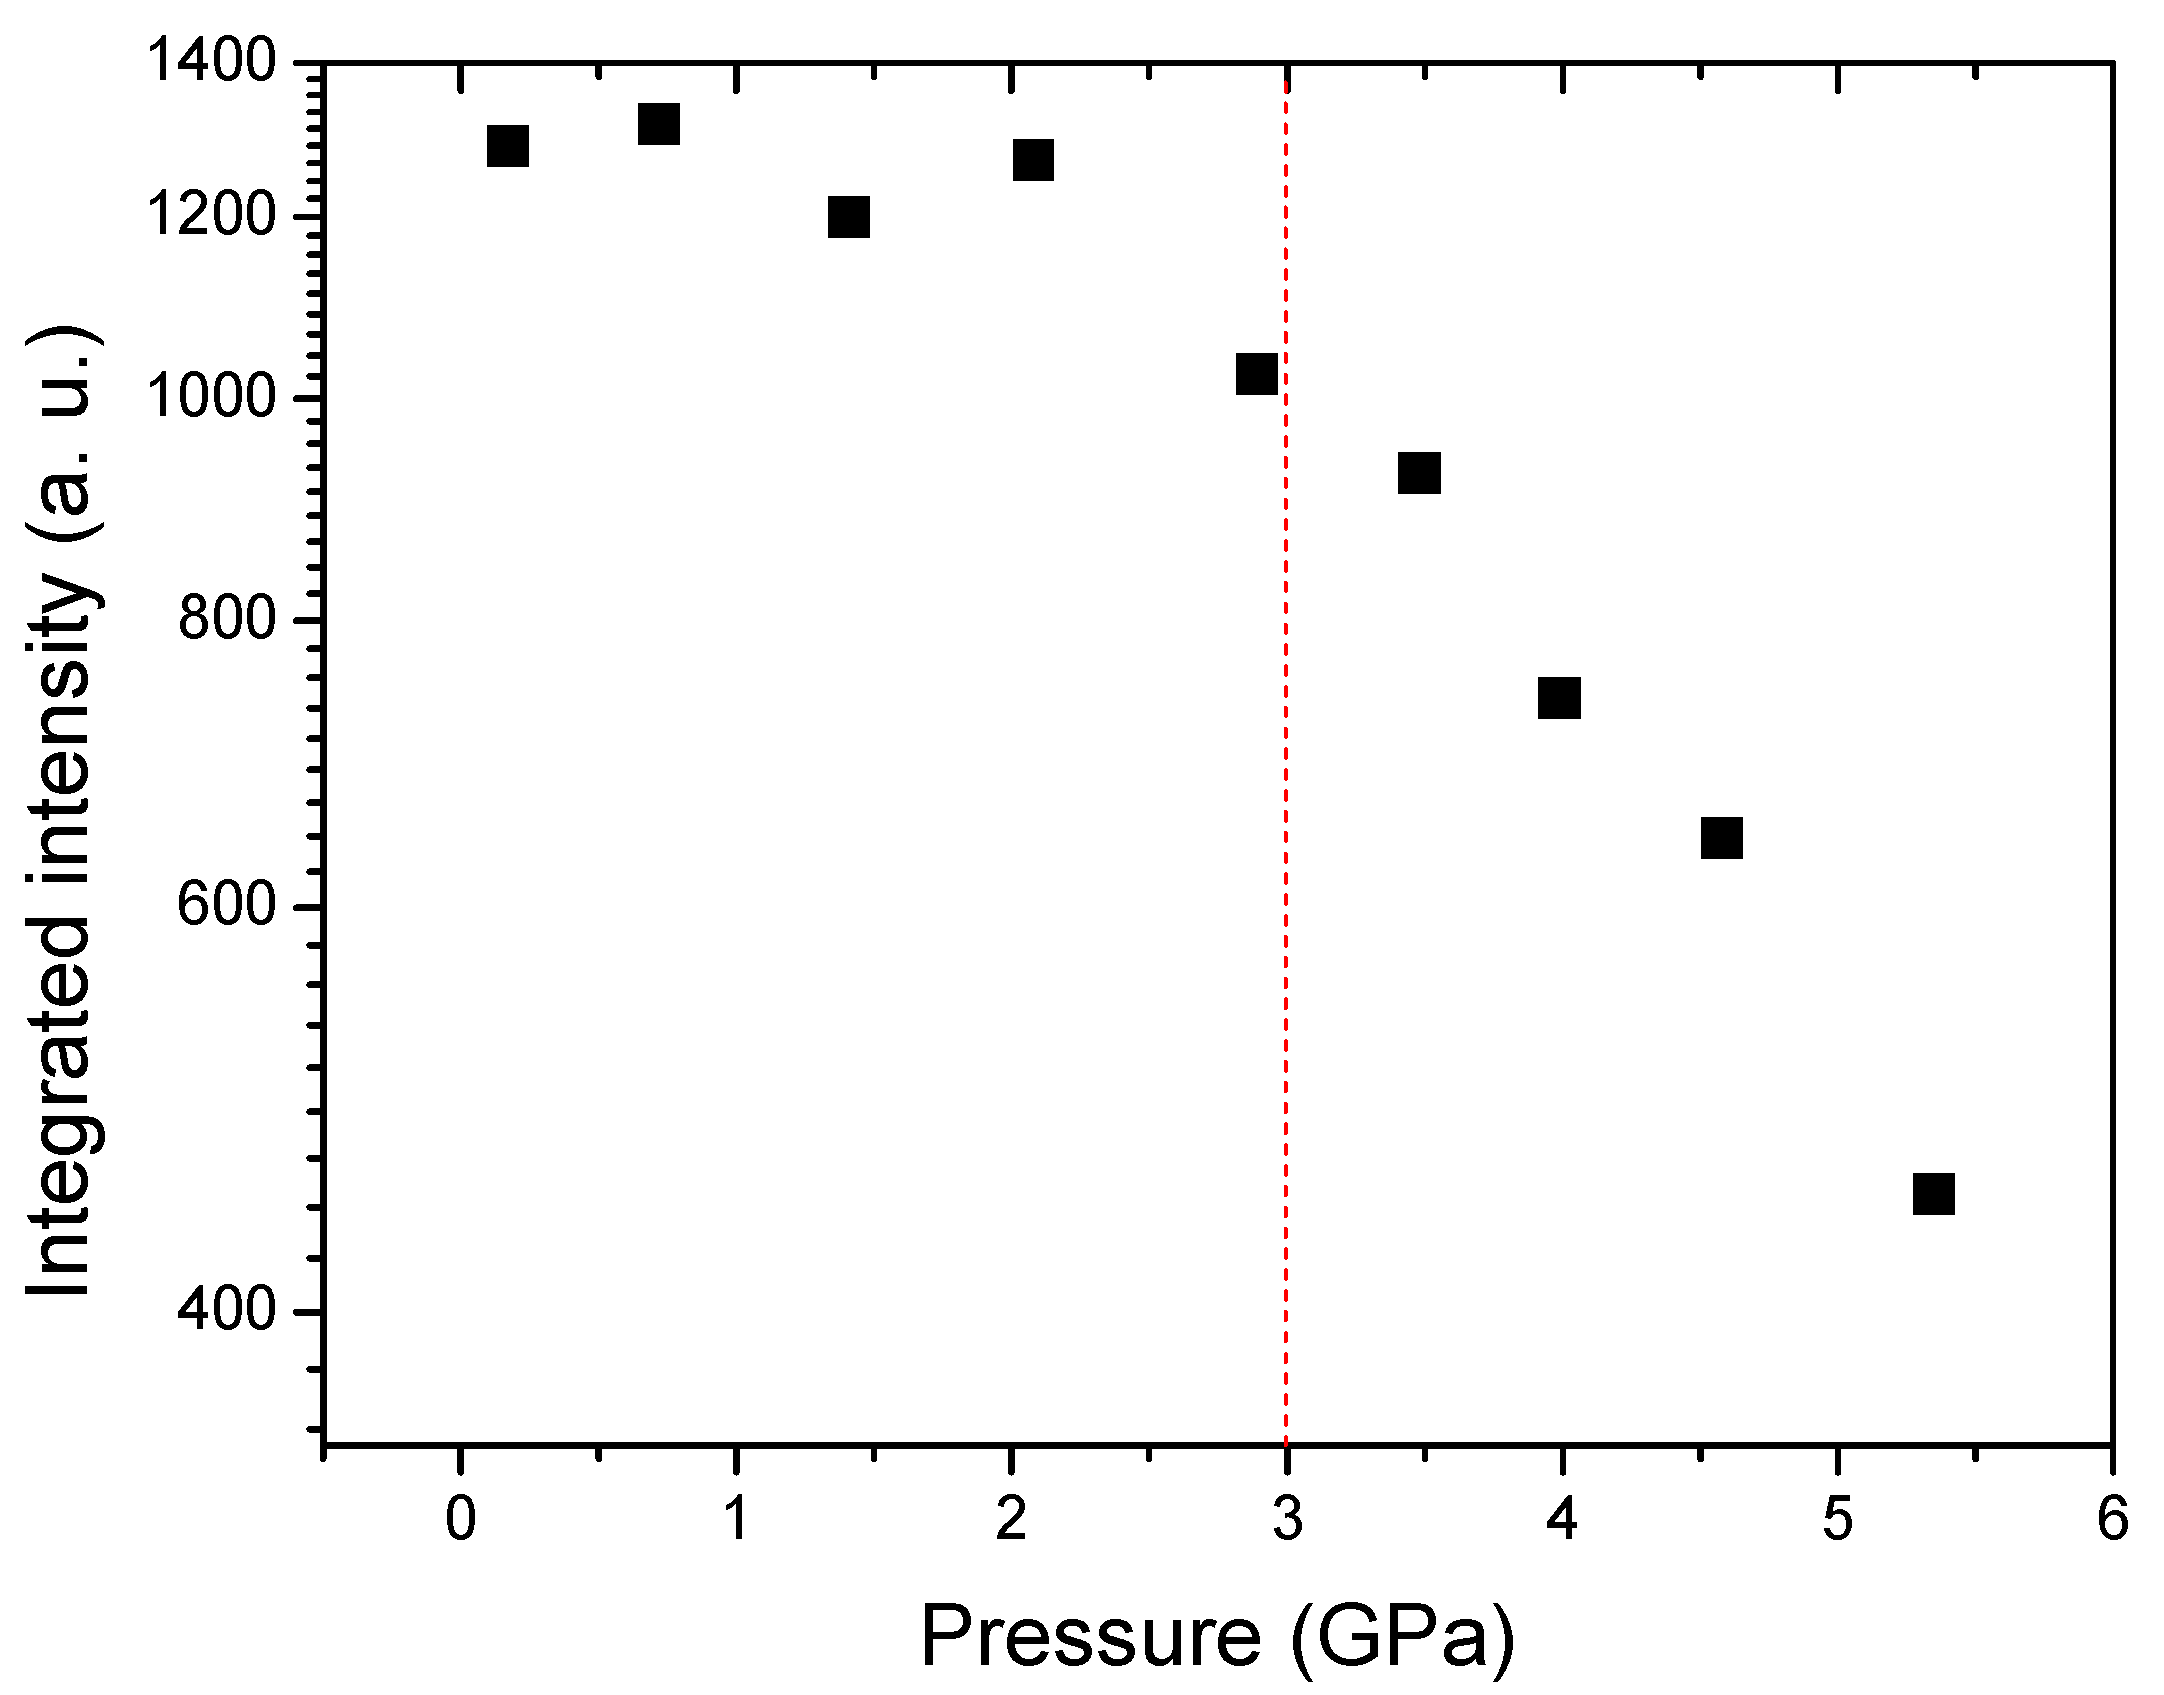
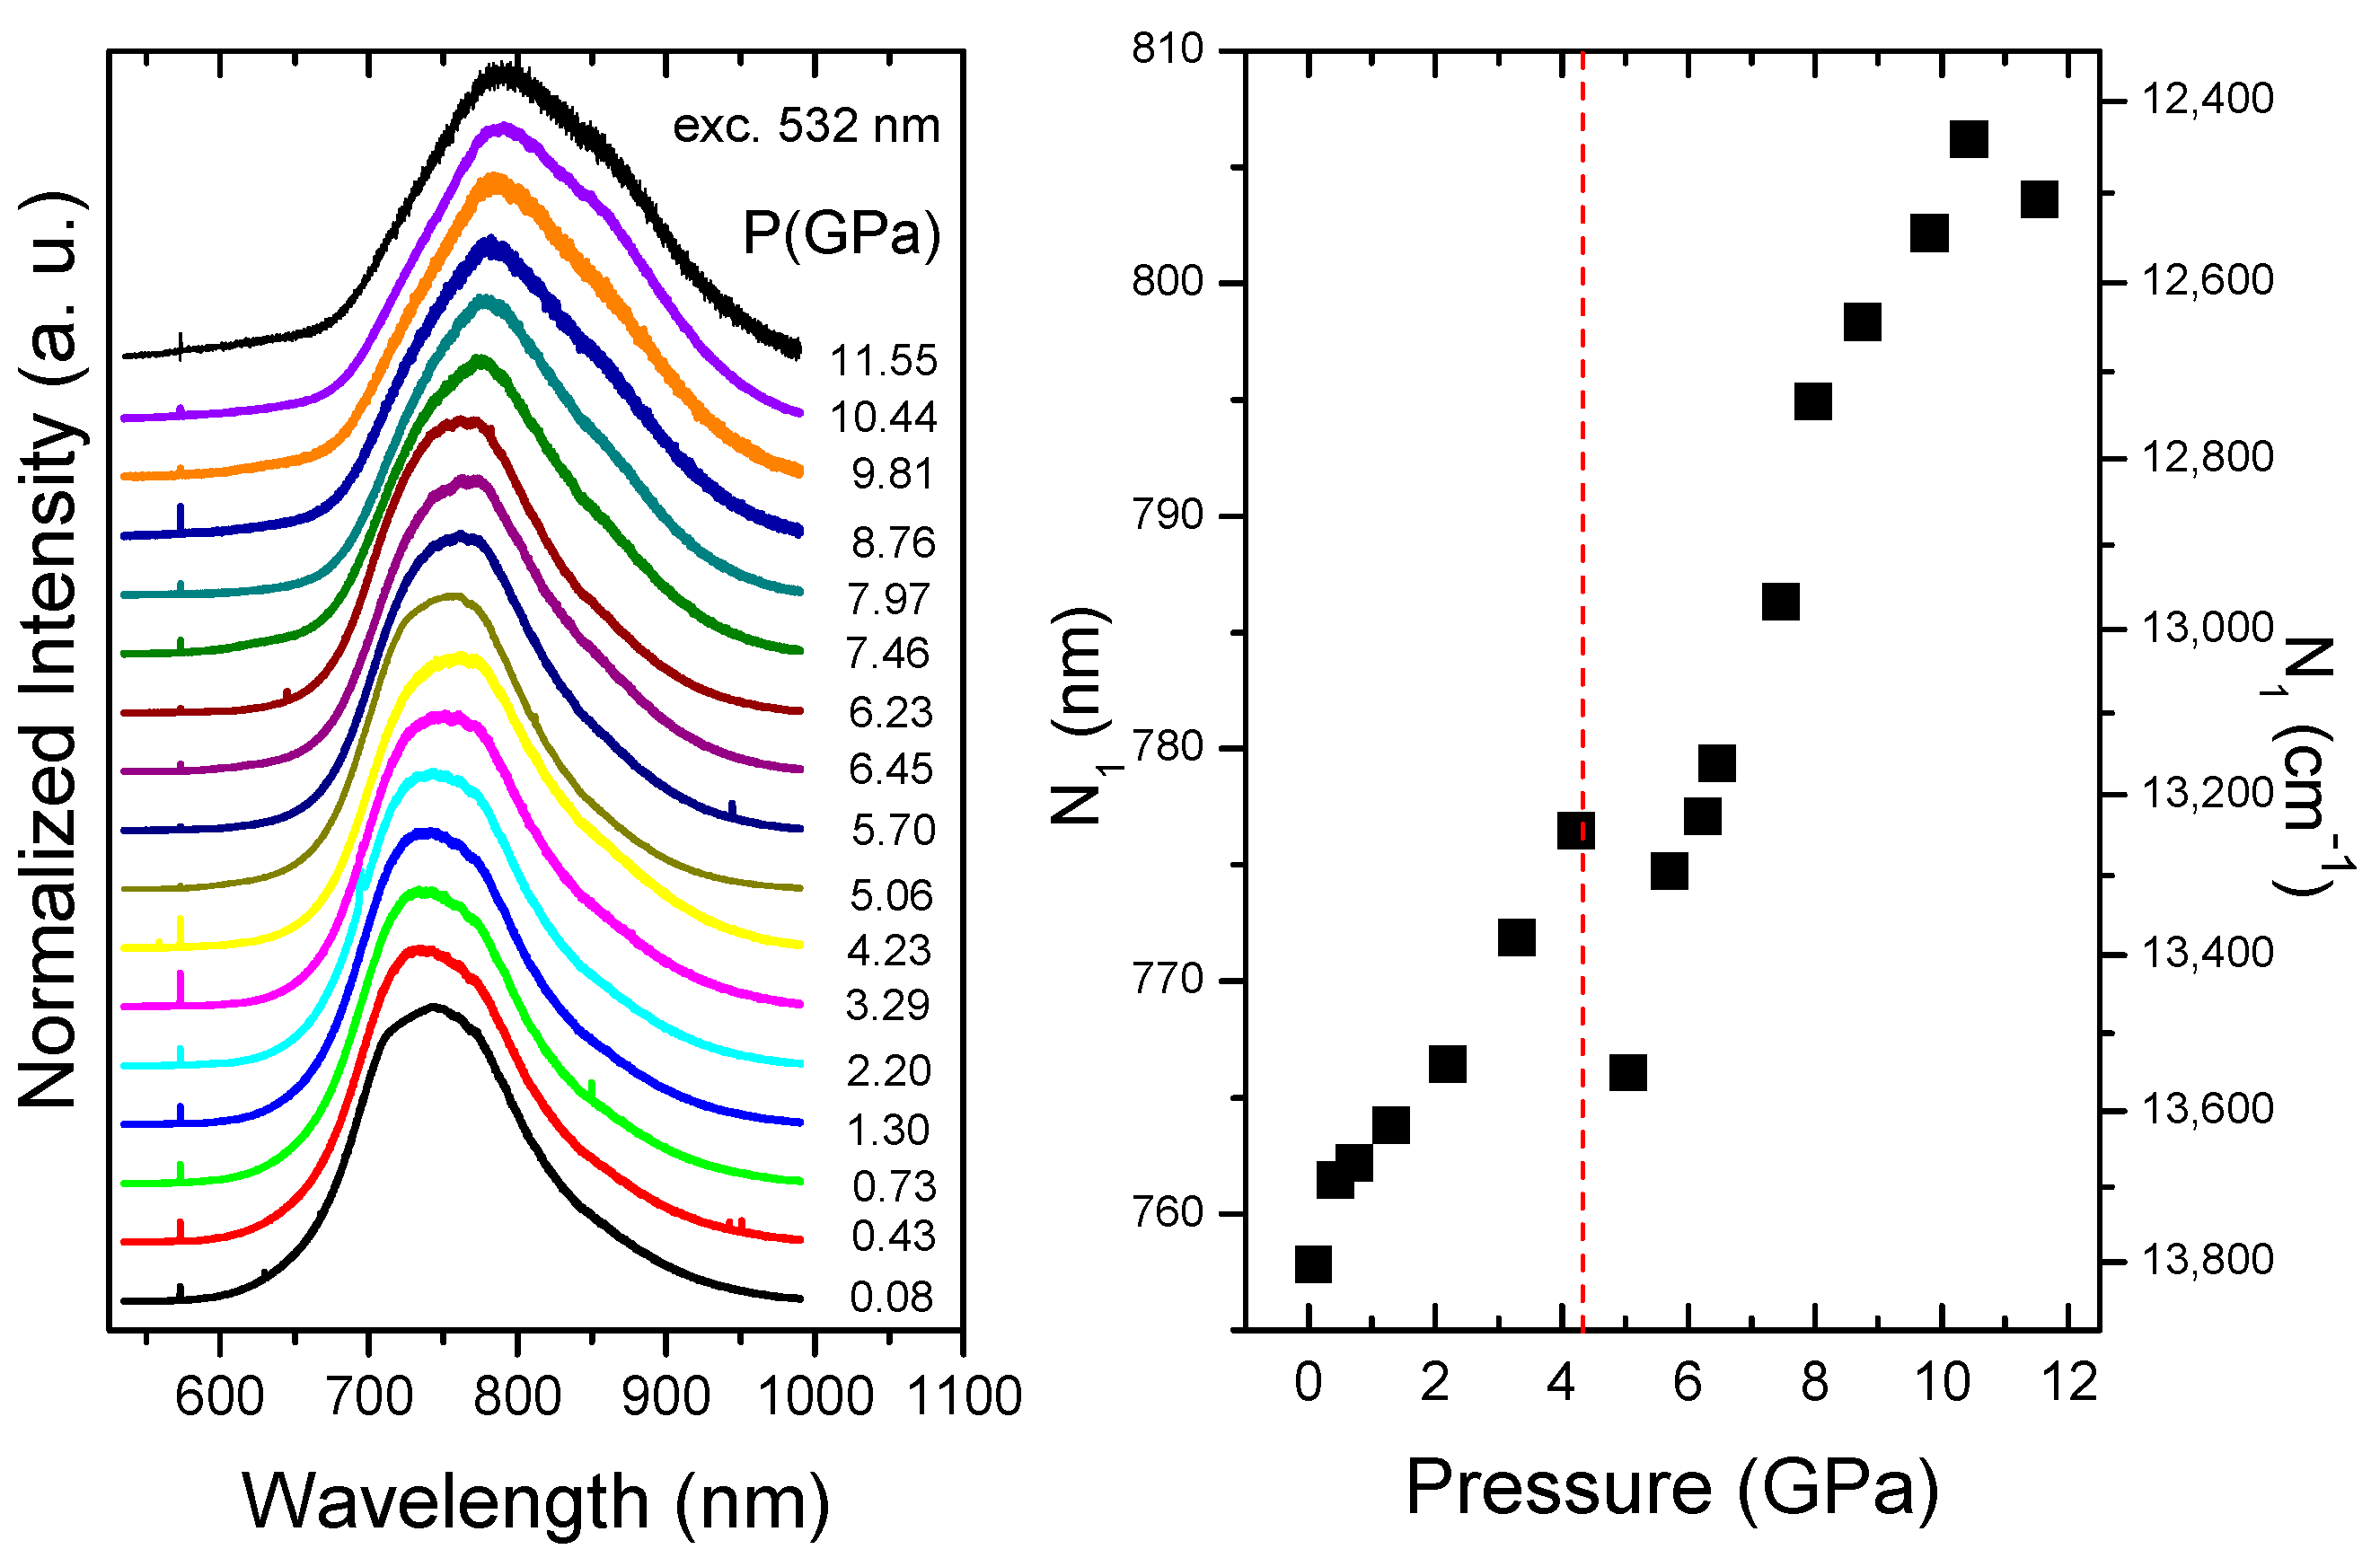
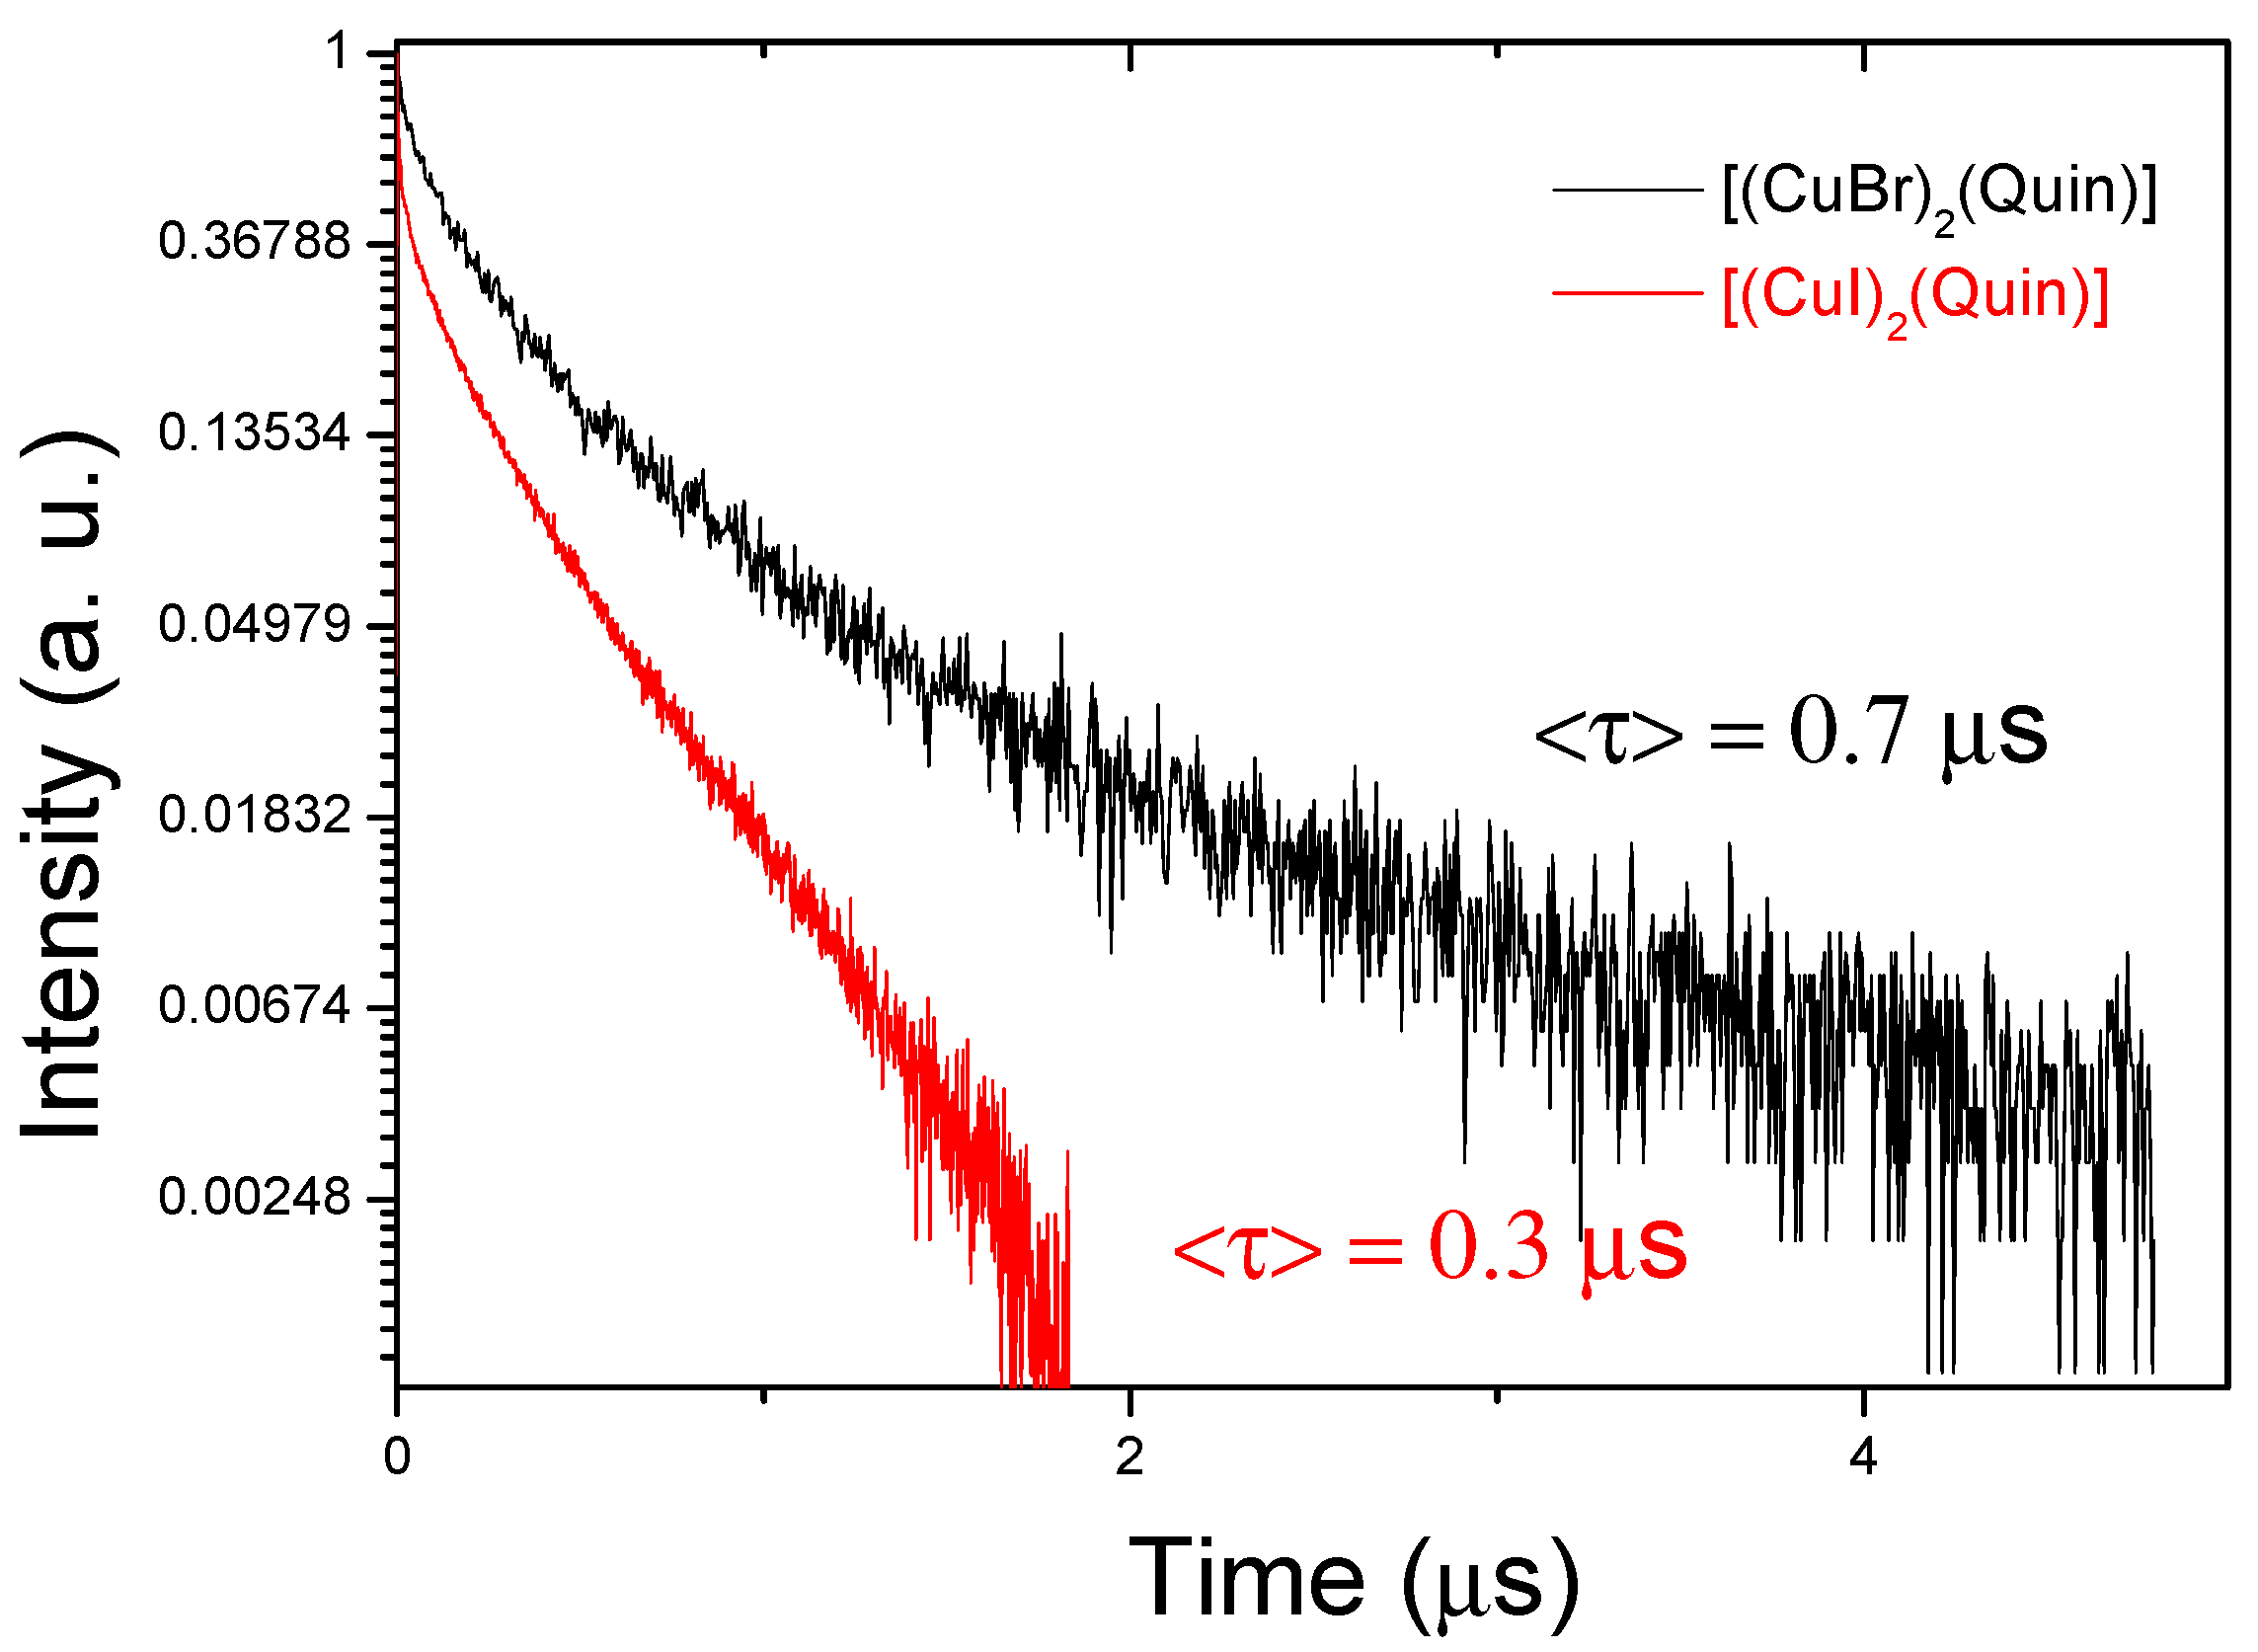
3.3. Luminescence Properties under Pressure

In both samples, asymmetric emission bands were observed, exhibiting their multicomponent character. To follow the pressure-induced evolution of the peak maxima of the emission bands, the center of gravity (centroid) (N1) was used, defined as follows:
N 1 = + λ I ( λ ) d λ + I ( λ ) d λ .
The [(CuBr)2(Quin)] emission spectra with increasing pressure were recorded up to 6.3 GPa, with an excitation source wavelength of 532 nm (Figure 8 left). The spectra consist of a single asymmetric band that can be deconvoluted into three Gaussians (see Figure S5 in Supplementary Information).
At ambient conditions, the centroid of the band was around 720 nm, and when the pressure was increased, two different behaviors were observed (Figure 8 right) in the pressure interval from ambient to 6.3 GPa. In the first interval (0–3.2 GPa), a linear redshift was obtained with a slope of around −89 cm−1/GPa. This tendency drastically changed in the interval of 3.2–6.3 GPa with an opposite behavior, giving rise to a linear blue shift around 149.2 cm−1/GPa. Upon releasing pressure, the original peak positions were almost recovered.
A similar behavior was observed in the pressure evolution of the emission intensity, with a pressure-induced decrease in intensity observed at pressures higher than 3.2 GPa up to 6.0 GPa. The initial intensity was almost recovered after releasing pressure (see Figure 9).
In the [(CuI)2(Quin)] compound, two different excitation wavelengths were used to obtain the emission spectra, resulting in similar observed behaviors.
Under 375 nm excitation, the spectra consisted of two bands: one asymmetric band centered at 750 nm, denoted as the low-energy band (LE), and another more symmetric band centered at 510 nm, denoted as the high-energy band (HE). The LE band could be deconvoluted into two Gaussian profiles (Figure S5). It is important to point out that in this setup, the limit imposed by the response of the photomultiplier was around 850 nm, which precluded measurements at higher wavelengths.
Upon compressing the copper(I) halide coordination complexes, two different regimes could be distinguished. The first regime is in the pressure interval between ambient and 2.9 GPa, where both the integrated intensity and the centroid of the band only exhibit slight changes of 20% and −49 cm−1/GPa, respectively. The second regime is in the pressure interval between 3.0 and 5.4 GPa, where a progressive decrease in the integrated intensity of the band occurs until it is no longer observable beyond 6 GPa along with an enhancement of the redshift rate up to −209 cm−1/GPa. These pressure-induced behaviors are depicted in Figure 10, where clear changes can be seen around 3.0 GPa in the slopes of the peak positions and in the integrated intensities (Figure 11). Upon decompression, the emission behavior was almost fully recovered.
Concerning the luminescence measurements obtained using an excitation wavelength of 532 nm, similar pressure behavior was found, with bands that can be deconvoluted into two Gaussian profiles (see Figure S5 in Supplementary Information). In this case, a change in tendency was observed around 4.0 GPa. Initially, a linear redshift of around −66 cm−1/GPa was found up to 4.0 GPa; then, up to 11.6 GPa, an increase in the redshift to −112 cm−1/GPa was observed (Figure 12). Due to the 532 nm excitation, it was impossible to observe the HE band appearing with 375 nm excitation.
Additionally, the decay curves of [(CuBr)2(Quin)] and [(CuI)2(Quin)] at ambient conditions with an excitation wavelength of 375 nm were also obtained, showing non-exponential behaviors, as expected (Figure 13), that can be related to the multicomponent character of the emission bands. For comparison purposes, an average lifetime (<τ>) was considered according to Equation (2), and values of 0.7 µs and 0.3 µs for [(CuBr)2(Quin)] and [(CuI)2(Quin)] were found, respectively:
τ = + t I ( t ) d t + I ( t ) d t .
The average lifetime obtained for the emission bands, around the order of microseconds, allows us to consider the luminescence process as phosphorescence, which reflects the triplet character of the emitter state [69].
In previous studies, the correlation between the structure of CuI halide complexes and their luminescent properties has been demonstrated [31,36,37,38,39,41,42,43,46,70].
As commented on in the Introduction section, the electronic configuration for CuI corresponds to d10. Therefore, since the dd electronic transitions are excluded, charge transfer transitions can be the only mechanisms responsible for the electronic transitions. On the basis of DFT calculations, the HE band observed in the CuI-based complexes is usually ascribed to a mixed triplet metal-to-ligand charge transfer and triplet iodide-to-ligand charge transfer transition 3(M + X)LCT. Moreover, the LE band is connected with transitions in the CuX cluster core, exhibiting a combination of halide-to-metal 3XMCT and metal-cluster-centered (3MCC) d10d9s1, which is independent of the nature of the ligands.
The presence of structure in the emission bands reveals their multicomponent character and clearly indicates the contribution of different excited states involved in this mechanism. From the high-pressure X-ray experiments, some important information on luminescent properties can be inferred. Firstly, at around 3.5 GPa and 3.0 GPa, a second-order phase transition from monoclinic (P21/n) to triclinic phase (P-1) took place for the [(CuBr)2(Quin)] and [(CuI)2(Quin)], respectively. In the low-pressure P21/n phase, three different Cu–Cu distances were observed, of which only one was equal to or shorter than the minimum distance required for so-called cuprophilic interactions, established as 2.8 Å for the Cu(I) ions [70]. This is depicted by solid red diamond symbols in Figure 4, with distances at ambient conditions of 2.8293 Å and 2.7869 Å for [(CuBr)2(Quin)] and [(CuI)2(Quin)], respectively. The pressure evolution of the Cu–Cu distances consisted of shortening at different rates depending on the sample and the pressure range. For [(CuBr)2(Quin)], the change in Cu–Cu distance was −0.0396 Å/GPa for the low-pressure P21/n phase (0–3.5 GPa), which then stabilized or showed a slight increase in the high-pressure P-1 phase (Figure 4, left). Unfortunately, the X-ray diffraction pressure measurements were limited to 4.5 GPa. For the [(CuI)2(Quin)] sample, the change in Cu–Cu distance in the P21/n phase (0–3.0 GPa) was around −0.0289 Å/GPa and was around −0.0134 Å/GPa in the P-1 phase (3.2–7.0 GPa), thereby revealing the same tendency over the whole pressure range studied.
The redshift of the emission bands with the shortening of the Cu–Cu distances is one of the main features of the cuprophilic interaction, since from molecular orbital theory, it is known that the Cu–Cu distances in the lowest unoccupied molecular orbital (LUMO) have a bonding character [71] which increases with the shortening of the Cu–Cu distances. In this context, some correlation with the observed experimental results can be drawn. For example, the [(CuBr)2(Quin)] complex in the low-pressure P21/n phase showed a redshift of the emission centroid concurrently with shortening of the Cu–Cu distances of around 5% in the 0–3.5 GPa pressure interval. In the high-pressure P-1 phase, the opposite tendency was observed—that is, a blueshift occurred while the Cu–Cu distances stabilized or even increased. The latter behavior can be connected with the rigidochromism effect, which is observed when the environment becomes more rigid and is connected to metal-to-ligand charge transfer (MLCT) excited states [72] and consists of a blue shift of the emission band. It seems that in the [(CuBr)2(Quin)] compound, at least two independent excited states are competing: the metal-cluster-centered (3MCC) d10d9s1 transition and the 3MLCT. Considering the fact that the emission data have been interpreted using the centroid, which is itself an average value, it can be interpreted that in the P21/n phase, the 3MCC state predominates over the 3MLCT state, and that in the P-1 phase, the roles are reversed.
For the other complex, [(CuI)2(Quin)], the same tendency was observed over the whole pressure interval (0 GPa to 11.5 GPa). In the P21/n phase, as can be seen in Figure 4, the variation in the Cu–Cu distances was less than 5% in the 0.0–3.0 GPa interval. Accordingly, small differences in the shifts of the centroids of the emission bands were observed (−49 cm−1/GPa and −70 cm−1/GPa) in this interval for excitations at 375 nm and 532 nm, respectively, that were more pronounced in the triclinic (P-1) phase (−209 cm−1/GPa and −100 cm−1/GPa) in the 4.0–7.0 GPa interval. Unfortunately, beyond 7.0 GPa, there is no information about the Cu–Cu distances since X-ray diffraction data were not acquired at these pressures, although the evolution of the emission spectra characterized by redshifts suggests a progressive shortening of the Cu–Cu distances. These distances correspond to the blue closed and open square symbols in Figure 4, which suggest that the Cu–Cu distances decrease below 2.8 Å for pressures over 7.0 GPa since decreases of around 14%, from 3.5105 Å (AC) to 3.0306 Å (7 GPa), were already observed. Therefore, in this complex, the metal-cluster-centered (3MCC) d10 → d9s1 transition is expected to be the dominant charge transfer mechanism.

4. Conclusions

We have performed a structural and luminescence study of a 2D polymeric staircase copper(I) halogen (halogen = bromine or iodine) with quinoxaline as an organic ligand. The high-pressure X-ray diffraction showed a phase transition of second order at around 3.3 GPa for both compounds whereby the cell parameters changed from the monoclinic to the triclinic crystal system. The compressibility study determined similar values in both compounds for the bulk modulus and its first derivate. The geometric changes revealed that the main structural variations occurred in the distortion of the ladder, with predominantly gliding versus folding movements affecting the Cu–Cu interactions. In general, the luminescence spectra showed asymmetric bands that reflect their multicomponent origin relating to the excited states involved in the transitions. The non-exponential decay curves confirmed this hypothesis, with averaged decay time data on the order of microseconds indicating the triplet character of the emitter states. Different behaviors of the pressure evolutions were observed for both compounds. With regard to [(CuBr)2(Quin)], a change in the tendency of the emission centroid from redshift to blueshift was observed around 3.5 GPa, which agrees with the phase transition pressure from the monoclinic P21/n phase to the triclinic P-1 phase. From this, a combination of metal-cluster-centered (3MCC) d10d9s1 (cuprophilic) and 3MLCT excited states were considered competing emitter states. In the 0–3.5 GPa interval, the former dominated, but after the phase transition, the rigidochromism effect became more important. In the [(CuI)2(Quin)] compound, the same tendency (redshift) was observed over the whole pressure range studied (0–11.5 GPa), although different rates were observed around the phase transition. In this case, metal-cluster-centered (3MCC) d10d9s1 transition seemed to be the dominant mechanism.

Supplementary Materials

The following supporting information can be downloaded at: https://0-www-mdpi-com.brum.beds.ac.uk/article/10.3390/cryst13010100/s1, Figure S1: Instrumental setup used for HP experiments. On the left, a SuperNOVA diffractometer with EoS CCD detector. On the right, HP Station in MSPD-BL04 (ALBA Synchrotron) with Rayonix SX165 CCD Detector; Figure S2: Bragg-Mini DAC (Almax EasyLab company) with 500 µm diameter in the culets of diamonds (top). Paderborn Mini DAC with 400 µm diameter in the culets of diamonds (bottom); Figure S3: Normalized distances for Cu-N for (CuX)2-Quin (X = Br, I) compounds; Figure S4: Normalized distances for Cu-X for (CuX)2-Quin (X = Br, I) compounds; Figure S5: Room temperature emission spectrum fitted to three Gaussian profiles for (CuBr)2-Quin (top) and (CuIr)2-Quin (bottom) compounds; Table S1: Crystal data and structure refinements for (CuBr)2-Quin sample at different pressures (0.00–4.67GPa) at room temperature; Table S2: Crystal data and structure refinements for (CuI)2-Quin sample at different pressures (0.00–7.00GPa) at room temperature.

Author Contributions

J.G.-P. worked on the X-ray diffraction and EoS calculations; U.R.R.-M. performed luminescence measurements; R.R.H.-M. and A.A.-C. conducted the synthesis of compounds; P.R.-H. and A.M. performed the simulations calculations; R.T. conducted the discussion and writing. All authors have read and agreed to the published version of the manuscript.

Funding

The authors acknowledge financial support from the Spanish Research Agency (AEI) and the Spanish Ministry of Science and Investigation (MCIN) under project PID2019-106383GB-C43/C44 (DOI:10.13039/5011000011033) and the MALTA Consolider Team network under project RED2018-102612-T. J.G.-P. thanks the Servicios Generales de Apoyo a la Investigación (SEGAI) at La Laguna University. U.R.R.-M. thanks the Gobierno de Canarias and EU-FEDER for grants ProID2020010067 and ProID2021010102.

Informed Consent Statement

Not applicable.

Data Availability Statement

CCDC 2226239-2226264 contains the supplementary crystallographic data for this paper. The data can be obtained free of charge from The Cambridge Crystallographic Data Centre via www.ccdc.cam.ac.uk/structures.

Acknowledgments

Some parts of the HP diffraction experiments were performed with the BL04-MSPD beamline at ALBA Synchrotron with the collaboration of ALBA staff. J.G.-P. thanks Servicio de Difracción de Rayos X (SIDIX) at La Laguna University for complementary support with the HP diffraction experiments. R.T. acknowledges funding from the Generalitat Valenciana through the APOSTD postdoctoral Fellowship No. CIAPOS/2021/20.

Conflicts of Interest

The authors declare no conflict of interest.

References

  1. Blake, A.; Brooks, N.; Champness, N.; Hanton, L.; Hubberstey, P.; Schroder, M. Copper(I) halide supramolecular networks linked by N-heterocyclic donor bridging ligands. Pure Appl. Chem. 1998, 70, 2351–2357. [Google Scholar] [CrossRef]
  2. Blake, A.J.; Brooks, N.R.; Champness, N.R.; Cooke, P.A.; Crew, M.; Deveson, A.M.; Hanton, L.R.; Hubberstey, P.; Fenske, D.; Schröder, M. Copper(I) iodide coordination networks-controlling the placement of (CuI)∞ ladders and chains within two-dimensional sheets. Cryst. Eng. 1999, 2, 181–195. [Google Scholar] [CrossRef]
  3. Li, D.; Shi, W.-J.; Hou, L. Coordination polymers of copper(I) halides and neutral heterocyclic thiones with new coordination modes. Inorg. Chem. 2005, 44, 3907–3913. [Google Scholar] [CrossRef] [PubMed]
  4. Peng, R.; Li, M.; Li, D. Copper(I) halides: A versatile family in coordination chemistry and crystal engineering. Coord. Chem. Rev. 2010, 254, 1–18. [Google Scholar] [CrossRef]
  5. Troyano, J.; Perles, J.; Amo-Ochoa, P.; Zamora, F.; Delgado, S. Strong luminescent copper(i) halide coordination polymers and dinuclear complexes with thioacetamide and N,N′-donor ligands. CrystEngComm 2016, 18, 1809–1817. [Google Scholar] [CrossRef] [Green Version]
  6. Aguirrechu-Comerón, A.; Hernández-Molina, R.; González-Platas, J. Structure of two new compounds of copper(I) iodide with N-donor and P-donor ligands. J. Struct. Chem. 2018, 59, 943–948. [Google Scholar] [CrossRef]
  7. Neshat, A.; Aghakhanpour, R.B.; Mastrorilli, P.; Todisco, S.; Molani, F.; Wojtczak, A. Dinuclear and tetranuclear copper(I) iodide complexes with P and P^N donor ligands: Structural and photoluminescence studies. Polyhedron 2018, 154, 217–228. [Google Scholar] [CrossRef]
  8. Masahara, S.; Yokoyama, H.; Suzaki, Y.; Ide, T. Convenient synthesis of copper(i) halide quasi-one-dimensional coordination polymers: Their structures and solid-state luminescent properties. Dalton Trans. 2021, 50, 8889–8898. [Google Scholar] [CrossRef] [PubMed]
  9. Cariati, E.; Roberto, D.; Ugo, R.; Ford, P.C.; Galli, S.; Sironi, A. New structural motifs, unusual quenching of the emission, and second harmonic generation of copper(I) iodide polymeric or oligomeric adducts with para-substituted pyridines or trans-stilbazoles. Inorg. Chem. 2005, 44, 4077–4085. [Google Scholar] [CrossRef]
  10. Liu, J.B.; Li, H.H.; Chen, Z.R.; Li, J.B.; Chen, X.B.; Huang, C.C. A new semi-conductive copper(I) halide coordination polymer: Synthesis, structure, and theoretical study. J. Clust. Sci. 2009, 20, 515–523. [Google Scholar] [CrossRef]
  11. Perruchas, S.; Le Goff, X.F.; Maron, S.; Maurin, I.; Guillen, F.; Garcia, A.; Gacoin, T.; Boilot, J.P. Mechanochromic and thermochromic luminescence of a copper iodide cluster. J. Am. Chem. Soc. 2010, 132, 10967–10969. [Google Scholar] [CrossRef] [PubMed]
  12. Perruchas, S.; Tard, C.; Le Goff, X.F.; Fargues, A.; Garcia, A.; Kahlal, S.; Gacoin, T.; Boilot, J.P. Thermochromic luminescence of copper iodide clusters: The case of phosphine ligands. Inorg. Chem. 2011, 50, 10682–10692. [Google Scholar] [CrossRef]
  13. Gallego, A.; Castillo, O.; Gómez-García, C.; Zamora, F.; Delgado, S. Electrical conductivity and luminescence in coordination polymers based on copper(I)-halides and sulfur-pyrimidine ligands. Inorg. Chem. 2012, 51, 718–727. [Google Scholar] [CrossRef]
  14. Hassanein, K.; Conesa-Egea, J.; Delgado, S.; Benmansour, S.; Martinez, I.; Abellan, G.; Gomez-Garcia, C.J.; Zamora, F.; Amo-Ochoa, P. Electrical conductivity and strong luminescence in copper iodide double chains with isonicotinato derivatives. Chem. Eur. J. 2015, 21, 17282–17292. [Google Scholar] [CrossRef] [PubMed]
  15. Khatri, N.M.; Pablico-Lansigan, M.H.; Boncher, W.L.; Mertzman, J.E.; Labatete, A.C.; Grande, L.M.; Wunder, D.; Prushan, M.J.; Zhang, W.; Halasyamani, P.S.; et al. Luminescence and nonlinear optical properties in copper(I) halide extended networks. Inorg. Chem. 2016, 55, 11408–11417. [Google Scholar] [CrossRef]
  16. Schlachter, A.; Harvey, P.D. Properties and applications of copper halide-chalcogenoether and -chalcogenone networks and functional materials. J. Mater. Chem. C. 2021, 9, 6648–6685. [Google Scholar] [CrossRef]
  17. Mensah, A.; Shao, J.-J.; Ni, J.-L.; Li, G.-J.; Wang, F.-M.; Chen, L.-Z. Recent progress in luminescent Cu(I) halide complexes: A mini-review. Front. Chem. 2022, 9, 816363. [Google Scholar] [CrossRef]
  18. Ma, Z.; Shi, Z.; Qin, C.; Cui, M.; Yang, D.; Wang, X.; Wang, L.; Ji, X.; Chen, X.; Sun, J.; et al. Stable yellow light-emitting devices based on ternary copper halides with broadband emissive self-trapped excitons. ACS Nano 2020, 14, 4475–4486. [Google Scholar] [CrossRef]
  19. Hashimoto, M.; Igawa, S.; Yashima, M.; Kawata, I.; Hoshino, M.; Osawa, M. Highly efficient green organic light-emitting diodes containing luminescent three-coordinate copper(I) complexes. J. Am. Chem. Soc. 2011, 133, 10348–10351. [Google Scholar] [CrossRef]
  20. Xie, M.; Han, C.; Zhang, J.; Xie, G.; Xu, H. White electroluminescent phosphine-chelated copper iodide nanoclusters. Chem. Mater. 2017, 29, 6606–6610. [Google Scholar] [CrossRef]
  21. Ravaro, L.P.; Zanoni, K.P.S.; de Camargo, A.S.S. Luminescent copper(I) complexes as promising materials for the next generation of energy-saving OLED devices. Energy Rep. 2020, 6 (Suppl. 4), 37–45. [Google Scholar] [CrossRef]
  22. Guo, B.K.; Yang, F.; Wang, Y.Q.; Wei, Q.; Liu, L.; Zhong, X.X.; Wang, L.; Gong, J.K.; Li, F.B.; Wong, W.Y.; et al. Efficient TADF-OLEDs with ultra-soluble copper(I) halide complexes containing non-symmetrically substituted bidentate phosphine and PPh3 ligands. J. Lumin. 2020, 220, 116963-1–116963-11. [Google Scholar] [CrossRef]
  23. Jia, W.L.; McCormick, T.; Tao, Y.; Lu, J.-P.; Wang, S. New phosphorescent polynuclear Cu(I) compounds based on linear and star-shaped 2-(2′-Pyridyl)benzimidazolyl derivatives:  Syntheses, structures, luminescence, and electroluminescence. Inorg. Chem. 2005, 44, 5706–5712. [Google Scholar] [CrossRef]
  24. Armaroli, N.; Accorsi, G.; Holler, M.; Moudam, O.; Nierengarten, J.-F.; Zhou, Z.; Wegh, R.T.; Welter, R. Highly luminescent Cu(I) complexes for light-emitting electrochemical cells. Adv. Mater. 2006, 18, 1313–1316. [Google Scholar] [CrossRef]
  25. Chuaysong, R.; Chooto, P.; Pakawatchai, C. Electrochemical properties of copper(I) halides and substituted thiourea complexes. ScienceAsia 2008, 34, 440–442. [Google Scholar] [CrossRef]
  26. Ezealigo, B.N.; Nwanya, A.C.; Simo, A.; Osuji, R.U.; Bucher, R.; Maaza, M.; Fabian, I.; Ezema, F.I. Optical and electrochemical capacitive properties of copper (I) iodide thin film deposited by SILAR method. Arab. J. Chem. 2019, 12, 5380–5391. [Google Scholar] [CrossRef]
  27. Yin, J.; Lei, Q.; Han, Y.; Bakr, O.M.; Mohammed, O.F. Luminescent copper(I) halides for Optoelectronic applications. Phys. Status Solidi RRL 2021, 15, 2100138. [Google Scholar] [CrossRef]
  28. Liu, G.-N.; Xu, R.-D.; Zhao, R.-Y.; Sun, Y.; Bo, Q.-B.; Duan, Z.-Y.; Li, Y.-H.; Wang, Y.; Wu, Q.; Li, C. Hybrid copper iodide cluster-based pellet sensor for highly selective optical detection of o-nitrophenol and tetracycline hydrochloride in aqueous solution. ACS Sustain. Chem. Eng. 2019, 7, 18863–18873. [Google Scholar] [CrossRef]
  29. Peng, Y.; Yaacobi-Gross, N.; Perumal, A.K.; Faber, H.A.; Vourlias, G.; Patsalas, P.A.; Bradley, D.D.C.; He, Z.; Anthopoulos, T.D. Efficient organic solar cells using copper(I) iodide (CuI) hole transport layers. Appl. Phys. Lett. 2015, 106, 243302-1–243302-4. [Google Scholar] [CrossRef] [Green Version]
  30. Sepalage, G.A.; Meyer, S.; Pascoe, A.; Scully, A.D.; Huang, F.; Bach, U.; Cheng, Y.-B.; Spiccia, L. Copper(I) iodide as hole-conductor in planar perovskite solar cells: Probing the origin of J–V hysteresis. Adv. Funct. Mater. 2015, 25, 5650–5661. [Google Scholar] [CrossRef]
  31. Lopez, J.; Gonzalez-Platas, J.; Rodriguez-Mendoza, U.R.; Martinez, J.I.; Delgado, S.; Lifante-Pedrola, G.; Cantelar, E.; Guerrero-Lemus, R.; Hernandez-Rodriguez, C.; Amo-Ochoa, P. Cu(I)–I-2,4-diaminopyrimidine coordination polymers with optoelectronic properties as a proof of concept for solar cells. Inorg. Chem. 2021, 60, 1208–1219. [Google Scholar] [CrossRef] [PubMed]
  32. Graham, P.M.; Pike, R.D.; Sabat, M.; Bailey, R.D.; Pennington, W.T. Coordination polymers of copper(I) halides. Inorg. Chem. 2000, 39, 5121–5132. [Google Scholar] [CrossRef] [PubMed]
  33. Molina, R.H.; Aguirretxu, A.; González-Platas, J. Synthesis and structure of [CuI(3-methyl-2-phenylpiridine)2] with intermolecular stacking interactions. J. Struct. Chem. 2014, 55, 1478–1483. [Google Scholar] [CrossRef]
  34. Bath, E.R.; Golz, C.; Knorr, M.; Strohmann, C. Crystal structure of di-μ-iodido-bis[bis(acetonitrile-κN)copper(I)]. Acta Cryst. E 2015, 71, m189–m190. [Google Scholar] [CrossRef] [Green Version]
  35. Yang, S.; Li, Y.; Cui, Y.; Pan, J. A new coordination tetramer of copper(I) iodide and benzyldimethylamine: Tetra-μ3-iodido-tetrakis[(benzyldimethylamine-κN)copper(I)]. Acta Cryst. E 2009, 765, m906. [Google Scholar] [CrossRef] [Green Version]
  36. Conesa-Egea, J.; Gallardo-Martínez, J.; Delgado, S.; Martínez, J.I.; Gonzalez-Platas, J.; Fernández-Moreira, V.; Rodríguez-Mendoza, U.R.; Ocón, P.; Zmora, F.; Amo-Ochoa, P. Multistimuli response micro- and nanolayers of a coordination polymer based on Cu2I2 chains linked by 2-aminopyrazine. Small 2017, 13, 1700965. [Google Scholar] [CrossRef]
  37. Conesa-Egea, J.; Nogal, N.; Martínez, J.I.; Fernández-Moreira, V.; Rodríguez-Mendoza, U.R.; Gonzalez-Platas, J.; Gómez-García, C.J.; Delgado, S.; Zamora, F.; Amo-Ochoa, P. Smart composite films of nanometric thickness based on copper–iodine coordination polymers. Toward sensors. Chem. Sci. 2018, 9, 8000–8010. [Google Scholar] [CrossRef] [Green Version]
  38. Conesa-Egea, J.; González-Platas, J.; Rodríguez-Mendoza, U.R.; Martínez, J.I.; Ocon, P.; Fernández-Moreira, V.; Costa, R.D.; Fernández-Cestau, J.; Zamora, F.; Amo-Ochoa, P. Cunning defects: Emission control by structural point defects on Cu(i)I double chain coordination polymers. J. Mater. Chem. C 2020, 8, 1448–1458. [Google Scholar] [CrossRef]
  39. López, J.; Murillo, M.; Lifante-Pedrola, G.; Cantelar, E.; Gonzalez-Platas, J.; Rodríguez-Mendoza, U.R.; Amo-Ochoa, P. Multi-stimulus semiconductor Cu(I)–I-pyrimidinecoordination polymer with thermo- and mechanochromic sensing. CrystEngComm 2022, 24, 341–349. [Google Scholar] [CrossRef]
  40. Armaroli, N.; Accorsi, G.; Cardinali, F.; Listorti, A. Photochemistry and photophysics of coordination compounds: Copper. Top. Curr. Chem. 2007, 280, 69–115. [Google Scholar] [CrossRef]
  41. Benito, Q.; Maurin, I.; Cheisson, T.; Nocton, G.; Fargues, A.; Garcia, A.; Martineau, C.; Gacoin, T.; Boilot, J.-P.; Perruchas, S. Mechanochromic luminescence of copper iodide clusters. Chem. Eur. J. 2015, 21, 5892–5897. [Google Scholar] [CrossRef]
  42. Benito, Q.; Le Goff, X.F.; Nocton, G.; Fargues, A.; Garcia, A.; Berhault, A.; Kahlal, S.; Saillard, J.Y.; Martineau, C.; Trébosc, J.; et al. Geometry flexibility of copper iodide clusters: Variability in luminescence thermochromism. Inorg. Chem. 2015, 54, 4483–4494. [Google Scholar] [CrossRef]
  43. Benito, Q.; Baptiste, B.; Polian, A.; Delbes, L.; Martinelli, L.; Gacoin, T.; Boilot, J.P.; Perruchas, S. Pressure control of cuprophilic interactions in a luminescent mechanochromic copper cluster. Inorg. Chem. 2015, 54, 9821–9825. [Google Scholar] [CrossRef]
  44. Fu, Z.; Lin, J.; Wang, L.; Li, C.; Yan, W.; Wu, T. Cuprous iodide pseudopolymorphs based on imidazole ligand and their luminescence thermochromism. Cryst. Growth Des. 2016, 16, 2322–2327. [Google Scholar] [CrossRef]
  45. Troyano, J.; Perles, J.; Amo-Ochoa, P.; Martines, J.I.; Concepcion-Gimeno, M.; Fernandez-Moreira, V.; Zamora, F.; Delgado, S. Luminescent thermochromism of 2D coordination polymers based on copper(I) halides with 4-Hydroxythiophenol. Chem. Eur. J. 2016, 22, 18027–18035. [Google Scholar] [CrossRef] [Green Version]
  46. Aguirrechu-Comerón, A.; Hernández-Molina, R.; Rodríguez-Hernández, P.; Muñoz, A.; Rodríguez-Mendoza, U.R.; Lavín, V.; Angel, R.J.; Gonzalez-Platas, J. Experimental and ab initio study of catena(bis(μ2-iodo)-6-methylquinoline-copper(I)) under pressure: Synthesis, crystal structure, electronic, and luminescence properties. Inorg. Chem. 2016, 55, 7476–7484. [Google Scholar] [CrossRef]
  47. Aguirrechu-Comerón, A.; Rodríguez-Hernández, P.; Rodríguez-Mendoza, U.R.; Vallcorba, O.; Muñoz, A.; Perruchas, S.; Gonzalez-Platas, J. Equation of state and structural characterization of Cu4I4{PPh2(CH2CH = CH2)}4 under pressure. High Press. Res. 2019, 39, 69–80. [Google Scholar] [CrossRef]
  48. Rigaku Oxford Diffraction. CrysAlisPro Software System, Version 1.171.42.71; Rigaku Corporation: Oxford, UK, 2022. [Google Scholar]
  49. Sheldrick, G.M. SHELXT—Integrated space-group and crystal-structure determination. Acta Cryst. A 2015, 71, 3–8. [Google Scholar] [CrossRef] [Green Version]
  50. Sheldrick, G.M. Crystal structure refinement with SHELXL. Acta Cryst. C 2015, 71, 3–8. [Google Scholar] [CrossRef] [Green Version]
  51. Spek, A.L. Structure validation in chemical crystallography. Acta Cryst. D 2009, 65, 148–155. [Google Scholar] [CrossRef] [Green Version]
  52. Shen, G.; Wang, Y.; Dewaele, A.; Wu, C.; Fratanduono, D.E.; Eggert, J.; Klotz, S.; Dziubek, K.F.; Loubeyre, P.; Fatyanov, O.V.; et al. Toward an international practical pressure scale: A proposal for an IPPS ruby gauge. High Pres. Res. 2020, 40, 299–314. [Google Scholar] [CrossRef]
  53. Angel, R.J.; Bujak, M.; Zhao, J.; Gatta, G.D.; Jacobsen, S.D. Effective hydrostatic limits of pressure media for high-pressure crystallographic studies. J. Appl. Cryst. 2007, 40, 26–32. [Google Scholar] [CrossRef]
  54. Klotz, S.; Chervin, J.; Munsch, P.; Le Marchand, G. Hydrostatic limits of 11 pressure transmitting media. J. Phys. D Appl. Phys. 2009, 42, 075413. [Google Scholar] [CrossRef]
  55. Errandonea, D.; Muñoz, A.; Gonzalez-Platas, J. Comment on High-pressure x-ray diffraction study of YBO3/Eu3+, GdBO3, and EuBO3: Pressure-induced amorphization in GdBO3. J. Appl. Phys. 2014, 115, 043507. [Google Scholar] [CrossRef]
  56. Mujica, A.; Rubio, A.; Muñoz, A.; Needs, R.J. High-pressure phases of group-IV, III-V, and II-VI compounds. Rev. Mod. Phys. 2003, 75, 863–912. [Google Scholar] [CrossRef] [Green Version]
  57. Kresse, G.; Hafner, J. Ab initio molecular dynamics for liquid metals. Phys. Rev. B 1993, 47, 558–561. [Google Scholar] [CrossRef]
  58. Kresse, G.; Furthmüller, J. Efficiency of ab-initio total energy calculations for metals and semiconductors using a plane-wave basis set. Comput. Mater. Sci. 1996, 6, 15–50. [Google Scholar] [CrossRef]
  59. Kresse, G.; Furthmüller, J. Efficient iterative schemes for ab initio total-energy calculations using a plane-wave basis set. Phys. Rev. B 1996, 54, 11169–11186. [Google Scholar] [CrossRef]
  60. Perdew, J.P.; Burke, K.; Ernzerhof, M. Generalized gradient approximation made simple. Phys. Rev. Lett. 1997, 77, 3865–3868. [Google Scholar] [CrossRef] [Green Version]
  61. Grimme, S.; Ehrlich, S.; Goerigk, L. Effect of the damping function in dispersion corrected density functional theory. J. Comput. Chem. 2011, 32, 1456–1465. [Google Scholar] [CrossRef]
  62. Blöchl, P.E. Projector augmented-wave method. Phys. Rev. B 1994, 50, 17953–17979. [Google Scholar] [CrossRef] [Green Version]
  63. Monkhorst, H.J.; Pack, J.D. Special points for brillouin-zone integration. Phys. Rev. B 1976, 13, 5188–5192. [Google Scholar] [CrossRef]
  64. Yang, L.; Powell, D.R.; Houser, R.P. Structural variation in copper(I) complexes with pyridylmethylamide ligands: Structural analysis with a new four-coordinate geometry index, τ4. Dalton Trans. 2007, 9, 955–964. [Google Scholar] [CrossRef]
  65. Groom, C.R.; Bruno, I.J.; Lightfoot, M.P.; Ward, S.C. The cambridge structural database. Acta Cryst. B 2016, 72, 171–179. [Google Scholar] [CrossRef]
  66. Gonzalez-Platas, J.; Alvaro, M.; Nestola, F.; Angel, R.J. EoSFit7-GUI: A new graphical user interface for equation of state calculations, analyses and teaching. J. Appl. Cryst. 2016, 49, 1377–1382. [Google Scholar] [CrossRef]
  67. Angel, R.J.; Gonzalez-Platas, J.; Alvaro, M. EosFit7c and a fortran module (library) for equation of state calculations. Z. Kristallogr. 2014, 229, 405–419. [Google Scholar] [CrossRef]
  68. Moggach, S.A.; Parsons, S. High pressure crystallography of inorganic and organometallic complexes. Spectrosc. Prop. Inorg. Organomet. Compd. 2009, 40, 324–354. [Google Scholar] [CrossRef]
  69. Zhang, Q.; Komino, T.; Matsunami, S.; Goushi, K.; Adachi, C.; Huang, S. Triplet exciton confinement in green organic light-emitting diodes containing luminescent charge-transfer Cu(I) complexes. Adv. Funct. Mater. 2012, 22, 2327–2336. [Google Scholar] [CrossRef]
  70. Ford, P.C.; Cariati, E. Bourassa, photoluminescence properties of multinuclear copper(I) compounds. J. Chem. Rev. 1999, 99, 3625–3648. [Google Scholar] [CrossRef]
  71. Kim, T.H.; Shin, Y.W.; Jung, J.H.; Kim, J.S.; Kim, J. Crystal-to-crystal transformation between three cui coordination polymers and structural evidence for luminescence thermochromism. J. Angew. Chem. 2008, 120, 697–700. [Google Scholar] [CrossRef]
  72. Lees, A.J. The luminescence rigidochromic effect exhibited by organometallic complexes: Rationale and applications. Comments Inorg. Chem. 1995, 17, 319–346. [Google Scholar] [CrossRef]
Figure 1. Thermal ellipsoids plot (50%) and labeling scheme for compound [(CuI)2(Quin)] at ambient conditions.
Crystals 13 00100 g001
Figure 2. View of the stacking 2D layers along the c-axis (upper) and view of the staircase motif parallel to the a-axis (lower) for the complex [(CuI)2(Quin)].
Crystals 13 00100 g002aCrystals 13 00100 g002b
Figure 3. Pressure dependence of the cell parameters and volume for [(CuBr)2(Quin)] (top) and [(CuI)2(Quin)] (bottom). The dashed magenta line marks the phase transition zone. Error bars are smaller than their respective symbols.
Crystals 13 00100 g003
Figure 4. Variation in Cu–Cu distances with pressure for [(CuX)2(Quin)] (X = Br, I). Upper plots correspond with the scheme of distance variation before and after the phase transition: monoclinic (left) and triclinic (right). Different colored arrows correspond to different Cu–Cu interactions. The bottom part of the figure shows the Cu–Cu distances for [(CuBr)2(Quin)] (left) and for [(CuI)2(Quin)] (right) as a function of pressure. Error bars are smaller than respective symbols. Colored lines correspond with the different Cu–Cu interactions shown in the upper part of the figure.
Crystals 13 00100 g004
Figure 5. Variation in N-Cu-X (X = Br, I) angles with pressure for [(CuBr2(Quin)] (left) and [(CuI2(Quin)] (right). In the right-hand figure, the label ‘Staircase (I)’ corresponds to the Cu1 atoms, while ‘Staircase (II)’ corresponds to the Cu2 atoms.
Crystals 13 00100 g005
Figure 6. f-F plots and EoS BM3 fit for volume variation for [(CuBr)2(Quin)] (upper) and [(CuI)2(Quin)] (lower). Dashed red curves represent the EoS fitting results. Orange curves are the DFT simulations using the PBE + D3 model.
Crystals 13 00100 g006aCrystals 13 00100 g006b
Figure 7. Energy curves of DFT simulations for [(CuBr)2(Quin)] (left) and [(CuI)2(Quin)] (right) considering monoclinic or triclinic phases.
Crystals 13 00100 g007
Figure 8. Pressure dependence of luminescence spectra of [(CuBr)2(Quin)] compound obtained at RT under 532 nm laser excitation (left), and pressure evolution of the centroid (right).
Crystals 13 00100 g008
Figure 9. Integrated intensity pressure dependence of the [(CuBr)2(Quin)] compound.
Crystals 13 00100 g009
Figure 10. Pressure dependence of luminescence spectra of [(CuI)2(Quin)] compound obtained at ambient temperature under 375 nm laser excitation.
Crystals 13 00100 g010
Figure 11. Integrated intensity pressure dependence of the [(CuI)2(Quin)] compound.
Crystals 13 00100 g011
Figure 12. Pressure dependence of luminescence spectra of [(CuI)2(Quin)] compound obtained at ambient temperature under 532 nm laser excitation.
Crystals 13 00100 g012
Figure 13. Decay curves of [(CuBr)2(Quin)] (red) and [(CuI)2(Quin)] (black) obtained at ambient conditions.
Crystals 13 00100 g013
Table 1. Summary of single-crystal X-ray diffraction crystal data and structure refinement parameters for [(CuBr)2(Quin)] and [(CuI)2(Quin)] at ambient conditions.
[(CuBr)2(Quin)] [(CuI)2(Quin)]
Formula C8H6N2Cu2Br2 C8H6Cu2I2N2
Dcalc/g cm−32.806 3.164
μ/mm−112.355 9.678
Formula weight 417.05 511.03
Color Dark orange Dark yellow
Size/mm3 0.14 × 0.05 × 0.03 0.07 × 0.03 × 0.02
T/K 293(2) 293(2)
Crystal system Monoclinic Monoclinic
Space group P21/nP21/n
a4.1080(2) 4.3722(2)
b17.6594(7) 17.7218(7)
c13.6139(9) 13.8630(5)
α90 90
β91.496(6) 92.886(4)
γ90 90
V/Å3 987.28(9) 1072.79(8)
Z4 4
Wavelength/Å 0.71073 0.71073
Radiation type Mo Kα Mo Kα
Θmin1.889 1.867
Θmax29.163 26.370
Measured refl’s. 4422 4010
Independent refl’s. 1974 2199
Refl’s I ≥ 2 σ(I) 1629 1835
Rint0.0236 0.0292
Param./Restr. 127/0 127/0
Largest peak 0.658 0.684
Deepest hole −0.798 −0.795
GooF 1.138 1.057
wR2 (all data) 0.0699 0.0638
wR20.0656 0.0598
R1 (all data) 0.0529 0.0517
R10.0386 0.0376
Disclaimer/Publisher’s Note: The statements, opinions and data contained in all publications are solely those of the individual author(s) and contributor(s) and not of MDPI and/or the editor(s). MDPI and/or the editor(s) disclaim responsibility for any injury to people or property resulting from any ideas, methods, instructions or products referred to in the content.

