
Ab Initio Theoretical Study of DyScO3 at High Pressure


Departamento de Física and Instituto de Materiales y Nanotecnología, MALTA Consolider Team, Universidad de La Laguna, E38200 San Cristóbal de La Laguna, Tenerife, Spain
*
Author to whom correspondence should be addressed.
Crystals 2023, 13(2), 165; https://0-doi-org.brum.beds.ac.uk/10.3390/cryst13020165
Submission received: 21 December 2022
/
Revised: 12 January 2023
/
Accepted: 14 January 2023
/
Published: 17 January 2023
(This article belongs to the Special Issue Pressure-Induced Phase Transformations (Volume II))
Abstract
:DyScO3 is a member of a family of compounds (the rare-earth scandates) with exceptional properties and prospective applications in key technological areas. In this paper, we study theoretically the behavior of DyScO3 perovskite under pressures up to about 65 GPa, including its structural and vibrational properties (with an analysis of the Raman and infrared activity), elastic response, and stability. We have worked within the ab initio framework of the density functional theory, using projector-augmented wave potentials and a generalized gradient approximation form to the exchange-correlation functional, including dispersive corrections. We compare our results with existing theoretical and experimental published data and extend the range of previous studies. We also propose a candidate high-pressure phase for this material.
1. Introduction
On account of their dielectric and optical properties, as well as their optimal chemical stability, the rare-earth (RE) scandates with formula REScO, and among them DyScO, have been researched for the past two decades with a view mainly to replace SiO in next-generation MOSFETs [1,2,3]. Other usages of RE-scandates include their employment as optimal substrates for the epitaxial growth and fine-tuning of high-quality perovskite-type thin films, as well as their application in the terahertz range when embedded in perovskite heterostructures [4,5,6,7,8,9,10]. The enticing properties and promising scope of applications of DyScO suggest extending the fundamental research on this material to include as broad a range of pressures as possible, and very recently Bura and co-workers have experimentally undertaken this goal in the range from ambient conditions up to 40 GPa [11]. In the present work we aim to provide an ab initio theoretical study, performed within the framework of the density functional theory (DFT), of the so far only observed phase of DyScO, in the range up to 65 GPa, with a focus on its structural, elastic, and vibrational response, to compare with the experimental results of Bura et al. [11] as well as with other previously existing works and to provide a bound to its local stability. Our results indicate the existence of local instabilities, both elastic and dynamic, above 60–65 GPa. We also provide a possible candidate high-pressure phase, a well-known post-perovskite structure. We hope that these results will stimulate future experiments which, combined with theoretical studies, may lead to a better understanding of the properties of this technologically relevant, emerging material under high pressure.
2. Theoretical Method and Details of the Calculations
All the calculations were performed within the ab initio framework of the density functional theory (DFT) [12,13], using a projector augmented wave scheme (PAW) [14,15] and the vasp computational package [16,17,18,19]. The outermost, valence electrons of each species were explicitly considered in the calculations whereas their innermost, closed-shell core electrons were treated at the PAW level. For dysprosium we have used the recommended vasp Dy_3 PAW potential, which represents Dy with partially frozen 4f electrons and formal valency 3, a standard way to cope with localized f electrons in DFT calculations. The cutoff in the kinetic energy of the basis’s plane waves was 540 eV and the required Brillouin-zone integrations were performed with a 4 × 4 × 4 grid [20]. Several levels of approximations for the exchange-correlation functional were considered in our preliminary calculations, with optimal results obtained for the PBE generalized gradient approximation form [21] including dispersive corrections within the so-called Grimme’s D3 scheme [22], which was accordingly the level of approximation adopted for the production of all the results shown in this paper. The material was structurally relaxed at different volumes, sampling the region between negative pressures just below 0 GPa to about 60 GPa. Hydrostatic conditions were assumed in all cases and the criteria for stopping the structural relaxations was set to stress anisotropies less than 0.1 GPa and residual forces on atoms less than 5 meV/Å.
Further to the total energy calculations just described, which provide information on the pressure dependence of the structural properties of DyScO, we also performed a general study of its dynamical and elastic properties and their variation with pressure, and draw conclusions on the stability of the system based on them, as described in Section 3.2 and Section 3.3. For the study of the lattice vibrations, we used the small-displacement method as implemented in the phonopy package [23], employing a 2 × 2 × 2 supercells for sampling the phonons across the whole Brillouin zone. At the zone center, the symmetry of the calculated modes was analyzed to determine their possible spectroscopical activity, Raman or infra-red (IR). For the calculation of the elastic constants, we used the Le Page stress-strain method as implemented in the vasp code [24].
3. Results and Discussion
3.1. Crystallographic Description of DyScO Perovskite and Evolution of Its Structural Properties with Pressure
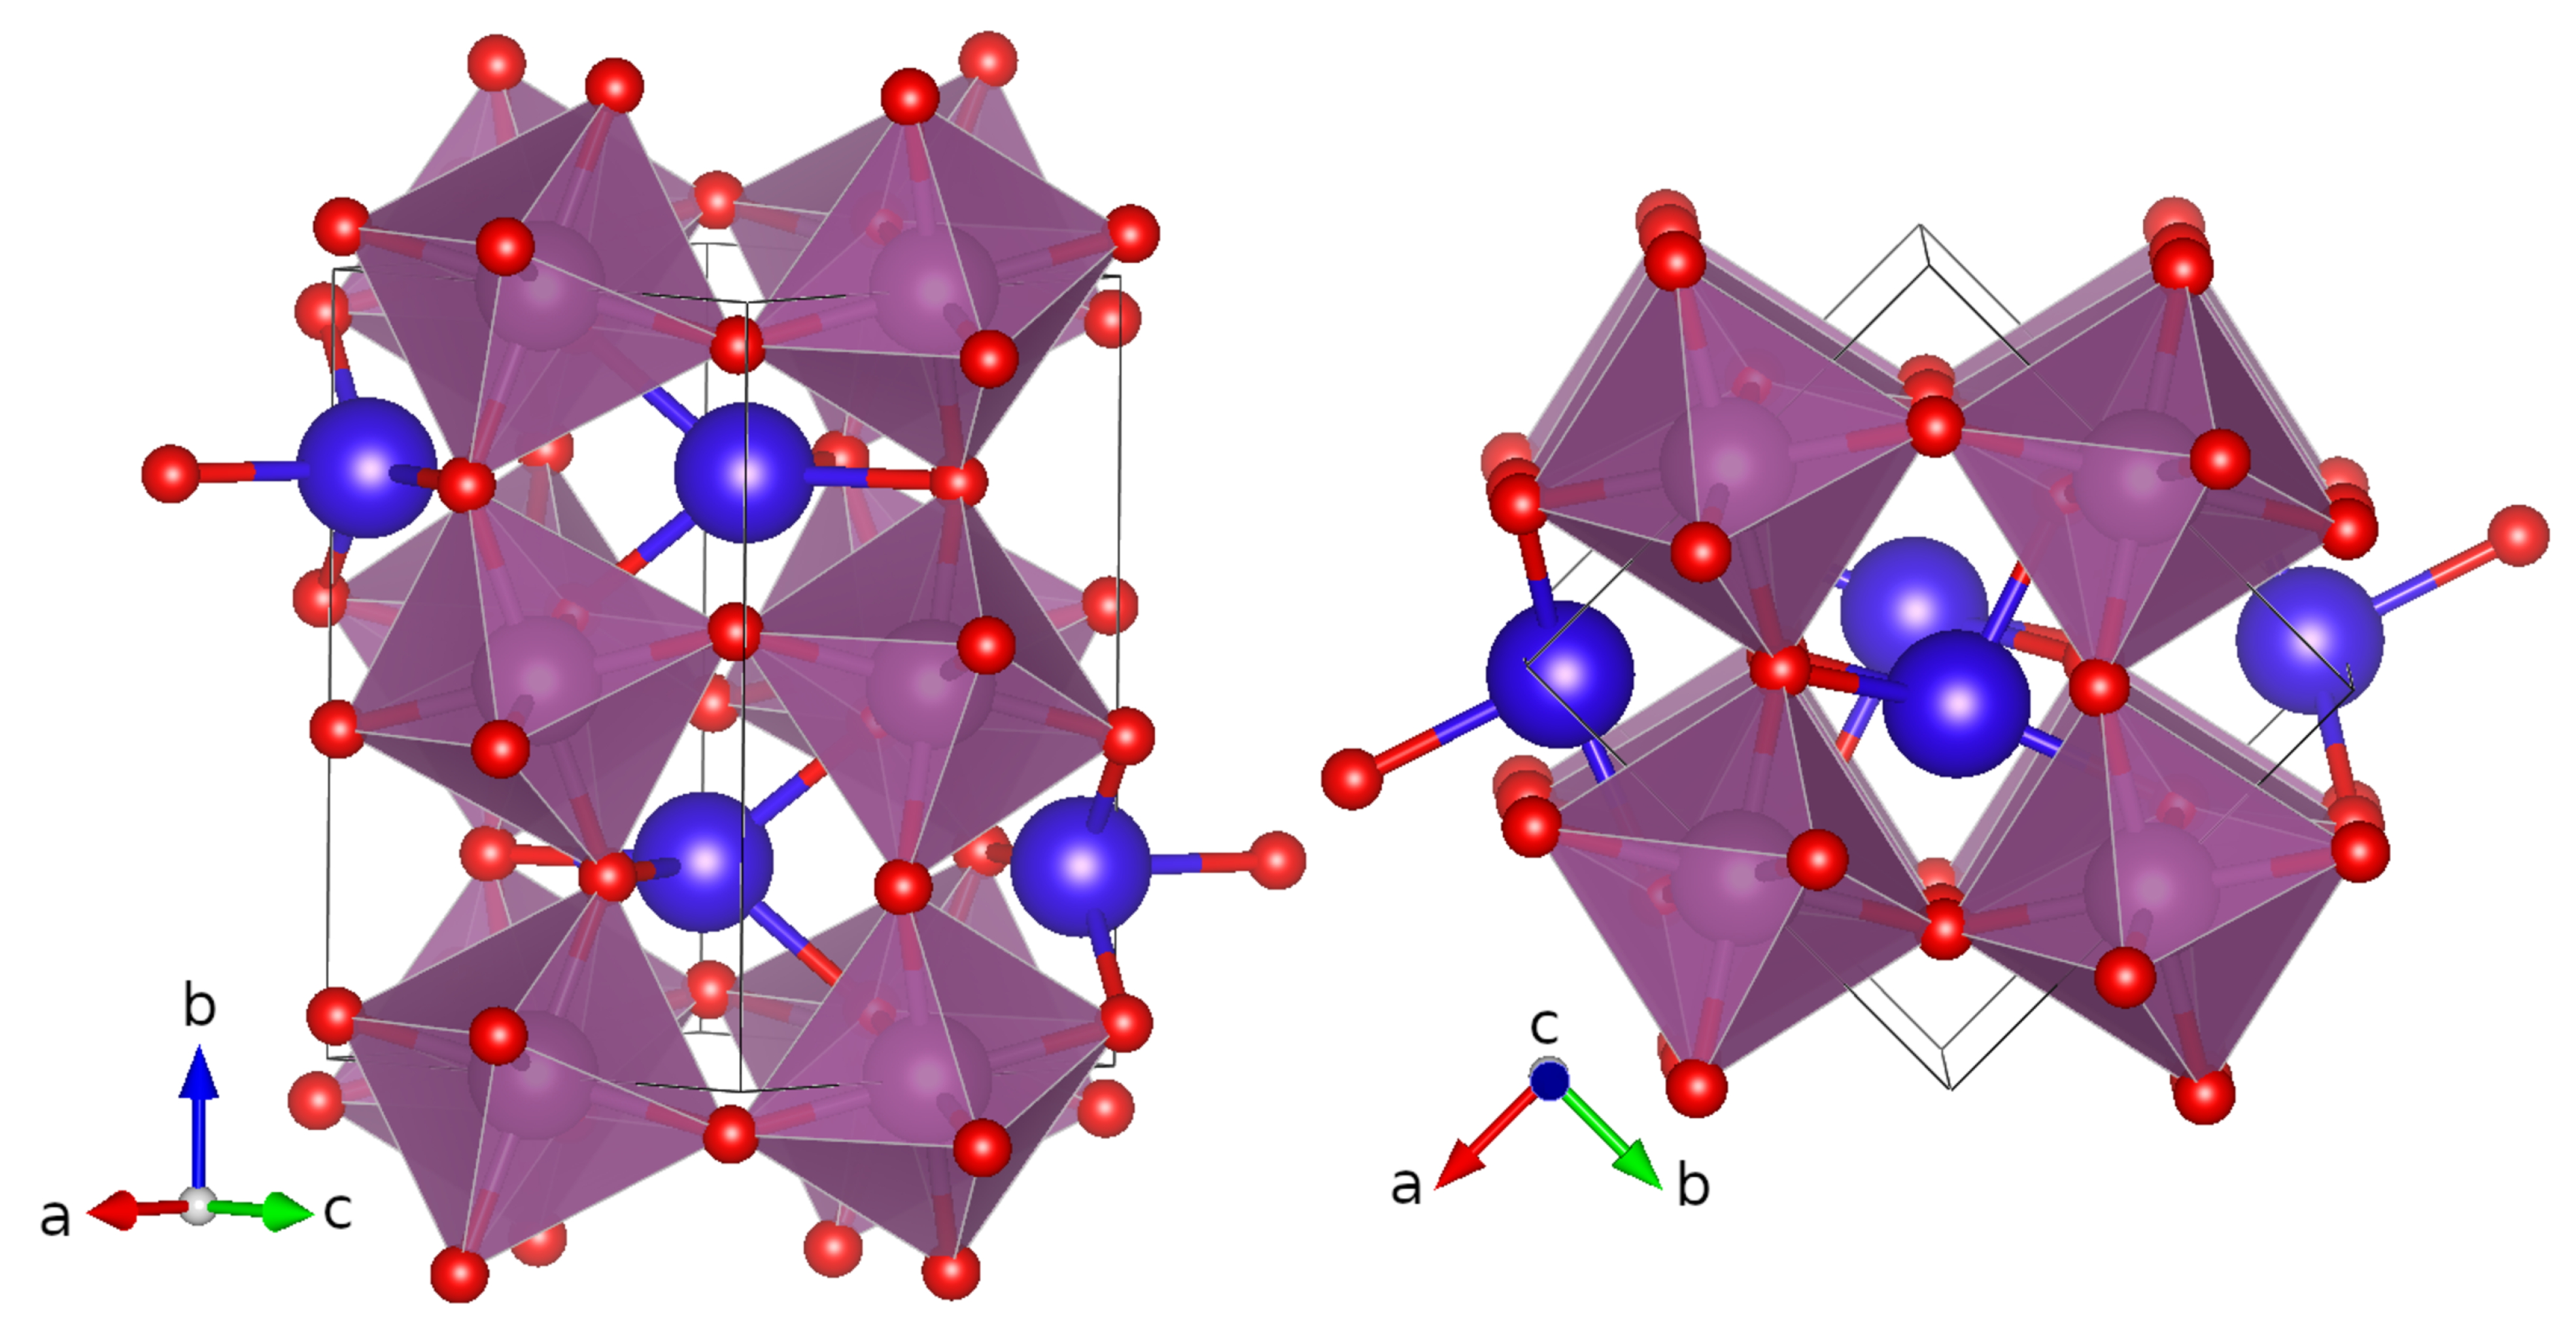
Like many other ABO oxide compounds, DyScO crystallizes in the perovskite-type structure. The ideal cubic perovskite structure, space group (SG) Pm-3m No 221, is characterized by corner-sharing BO octahedra and 12-fold coordinated A sites. For non-ideal or distorted perovskites, octahedron tilting lowers the space group symmetry of the structure [25]. For DyScO that means an orthorhombic phase with SG Pbnm No 62 and four formula units on the conventional unit cell (see Figure 1).
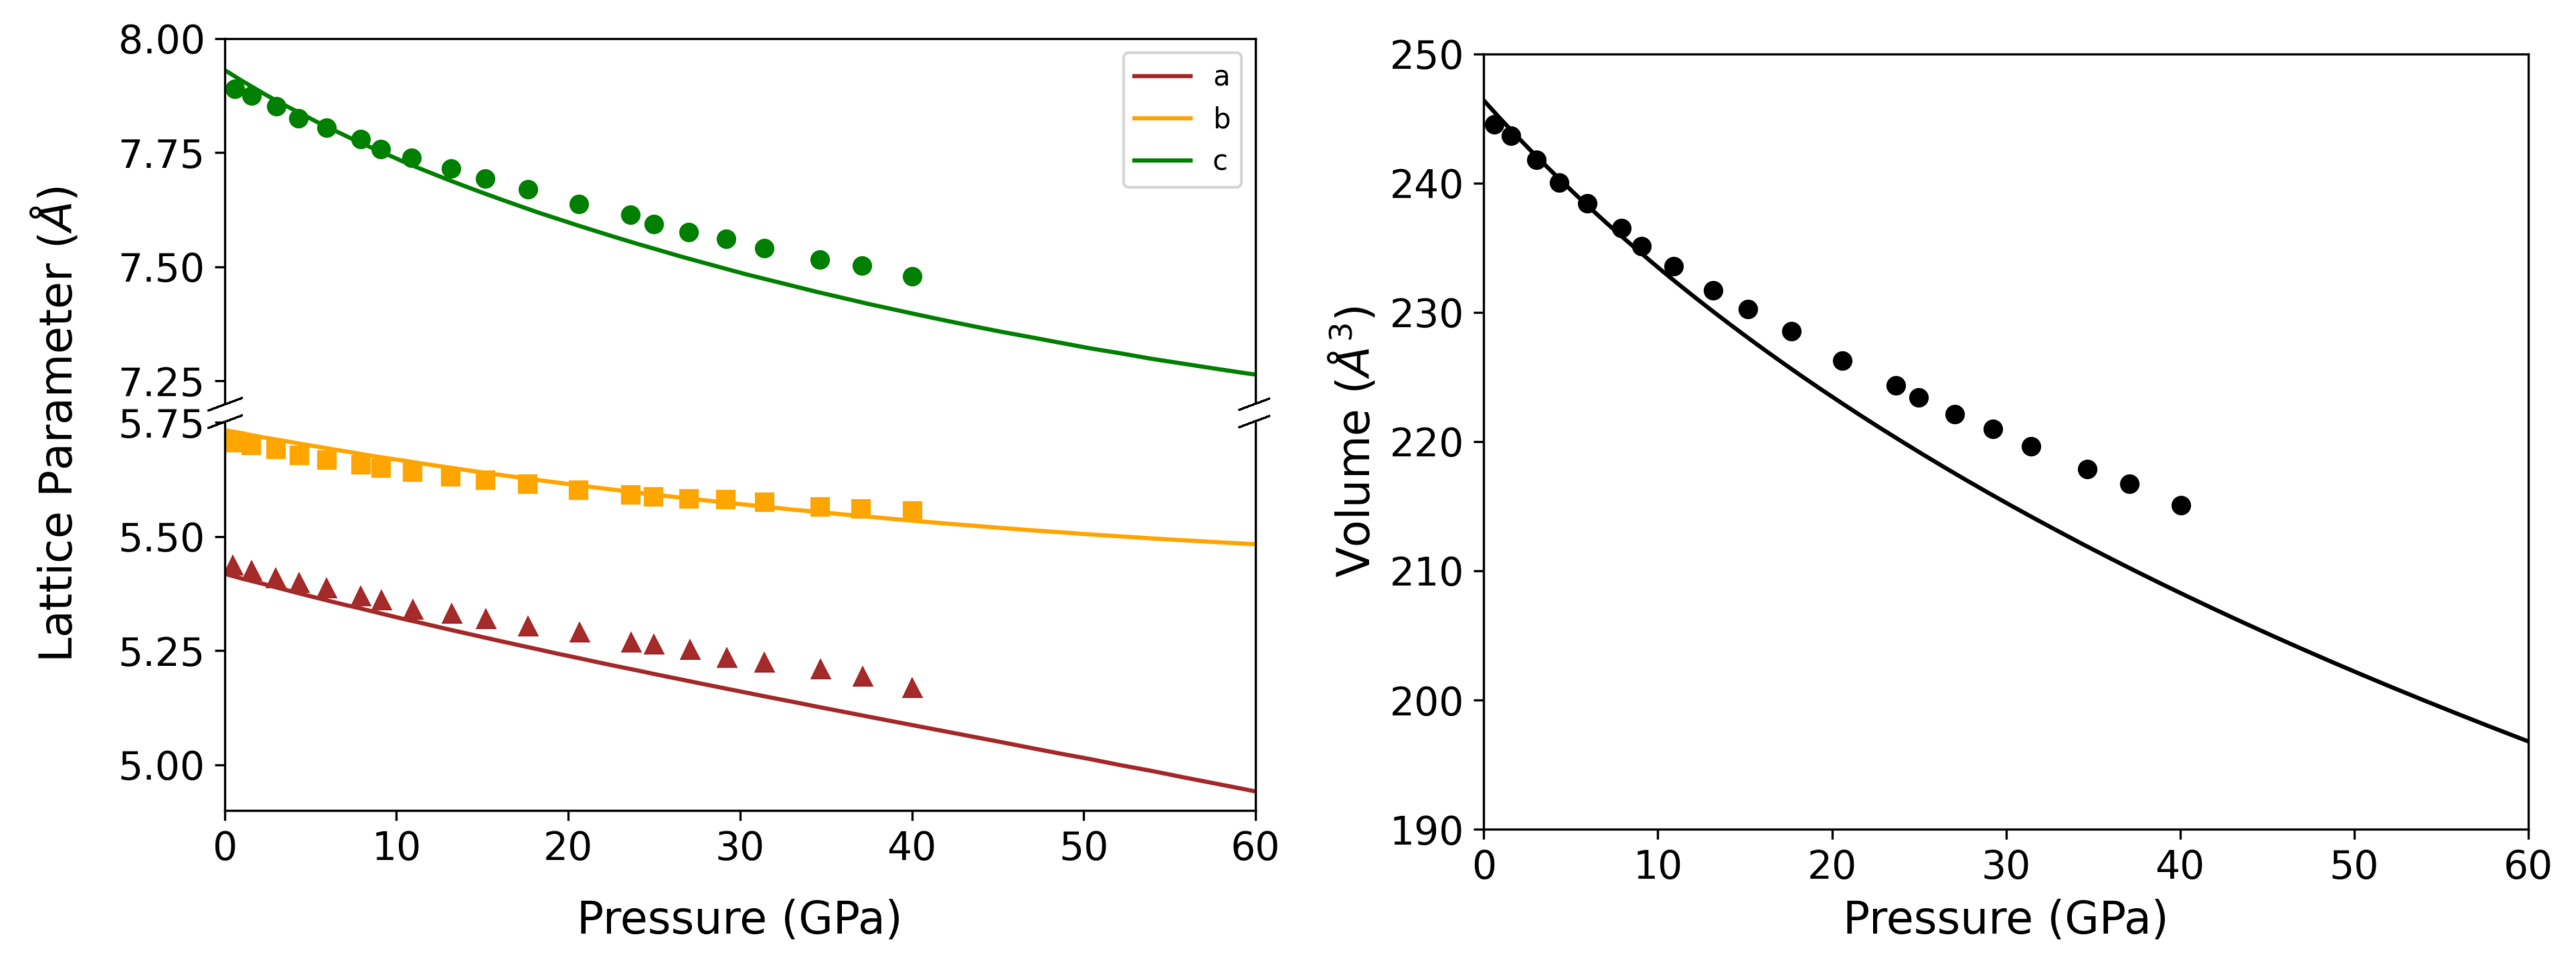
Our calculated lattice parameters a, b, c, and unit cell volume V at 0 GPa are in good agreement with the experimental results, as shown in Table 1. The calculated variation with the pressure of the lattice parameters (Figure 2) also reproduces the experimental results within a wide range of pressures up to approximately 10–12 GPa, although for larger pressures the calculated values of a and c are somewhat lower than the experimental values while b still follows the experimental trend. These deviations may be related to the loss of hydrostaticity above 10–12 GPa [26] in the methanol/ethanol pressure-transmitting medium used in the experiments [11] but more experimental and theoretical research would be needed to shed light on this point. The calculated linear axial compressibilities are 1.469 × 10 GPa for a, 0.731 × 10 GPa for b, and 1.411 × 10 GPa for c, and the value for the bulk modulus B of 164.7 GPa obtained by fitting the calculated energy-volume curve to a third-order Birch-Murnaghan equation of state [27] is a bit below the experimental one in Ref. [11] (see Table 2) whereas it is in good agreement with the calculated value of 165 GPa retrieved from the Materials Project database [28,29].
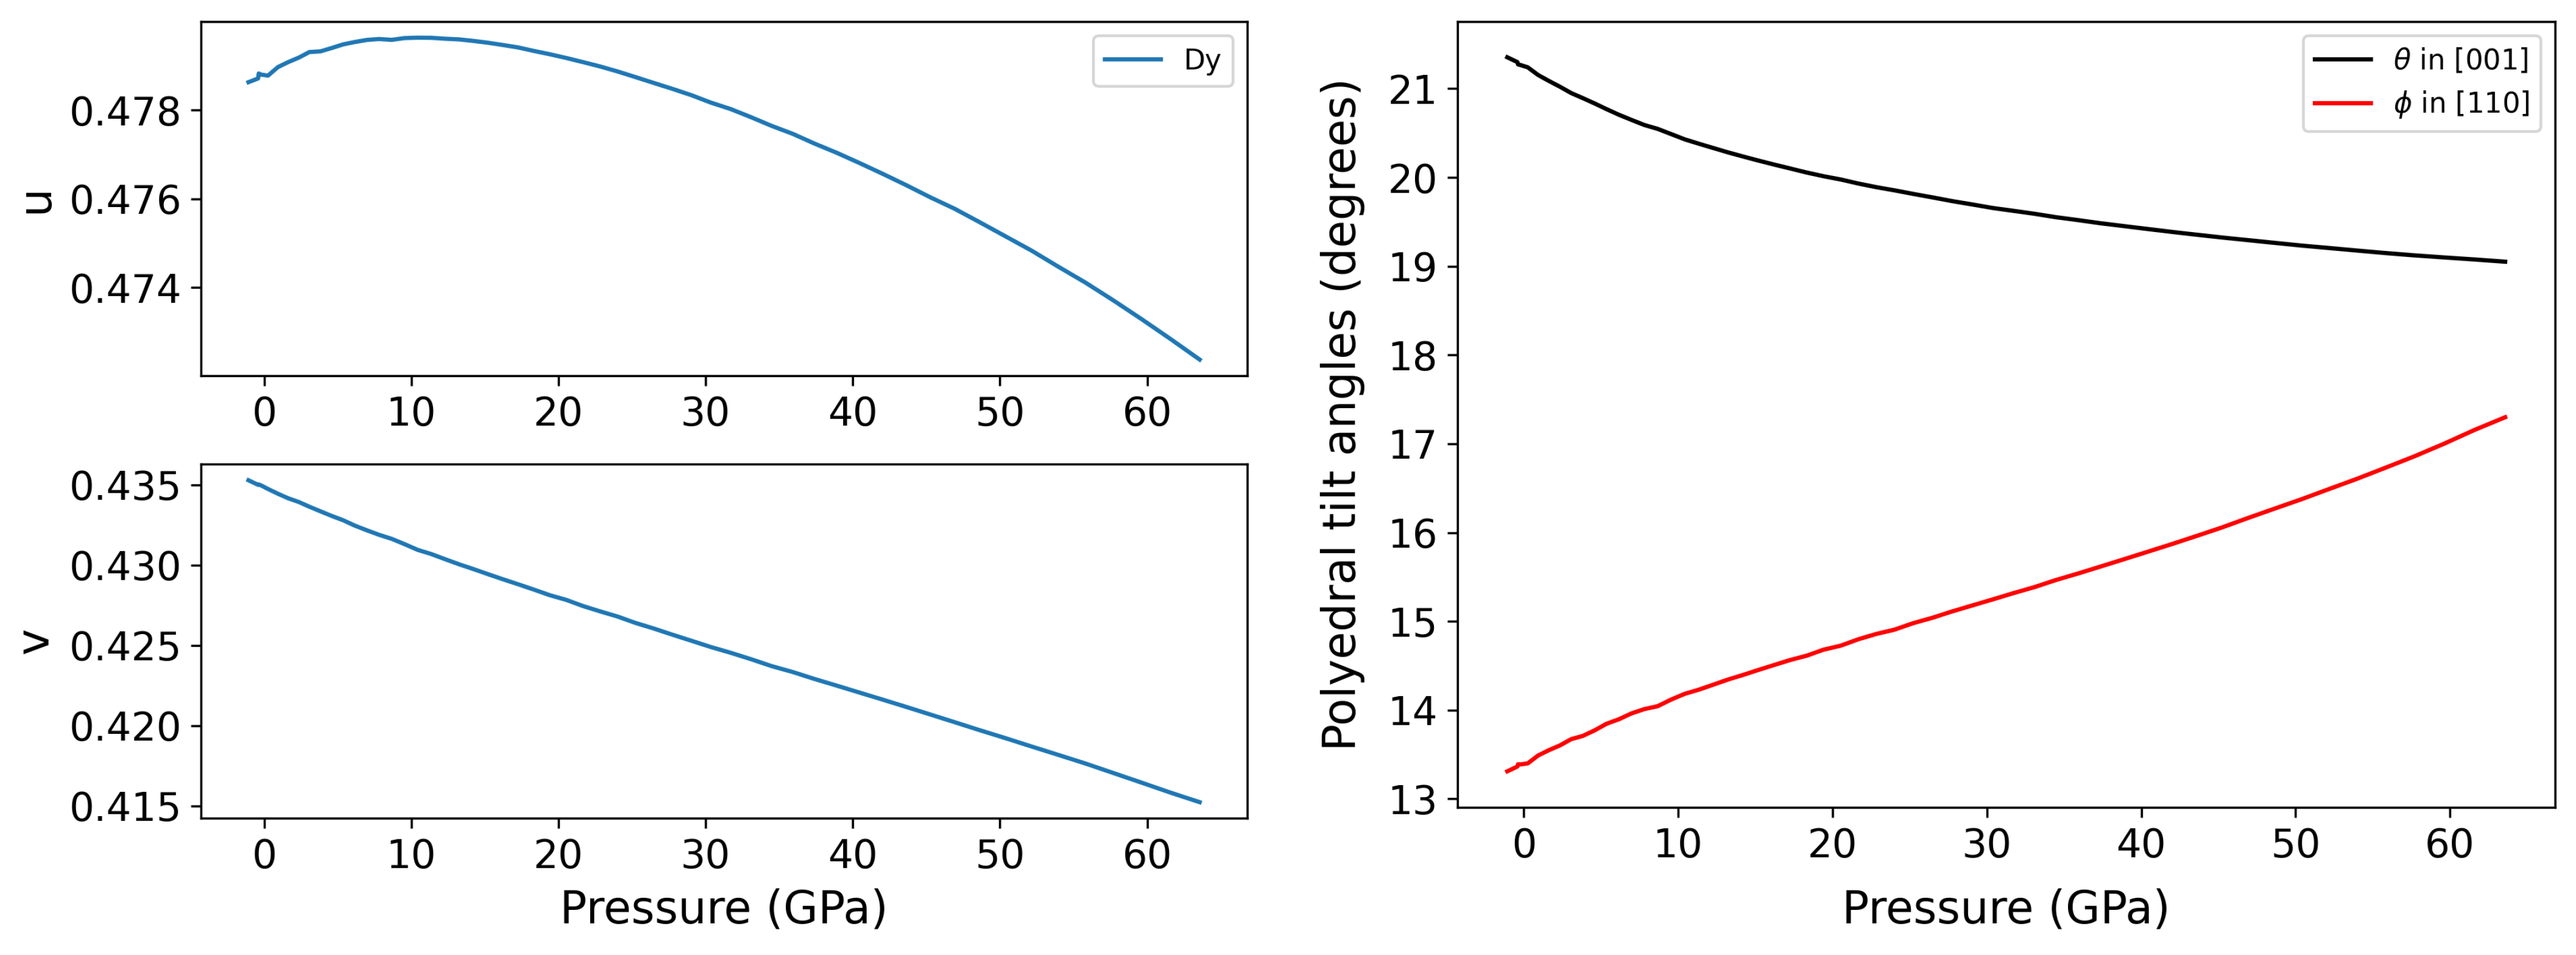
The physical properties of the ABO perovskites and the instabilities associated with soft modes found near the phase transitions are related to the distortions from the ideal cubic structure. Those distortions can be broken up into three components: two independent tilts of the BO octahedra (with tilt angles respectively and ), the distortion of those octahedra, and the displacement of the A cations [31,32,33,34]. In Table 3 we summarize the calculated values of the atomic positions in DyScO, showing, in particular, the displacement of the Dy cation, the tilt angles, and the octahedra distortion index, compared to the values of the ideal cubic perovskite structure, and the experimental values published in Ref. [25]. (The tilt angles were calculated using Equations (A1) and (A2) in Ref. [33].)
The variation of those values with pressure is shown in Figure 3. We observe that as the applied pressure increases the Dy cations move further away from the cubic perovskite positions, as the octahedra rotate further away around the [001] axes.
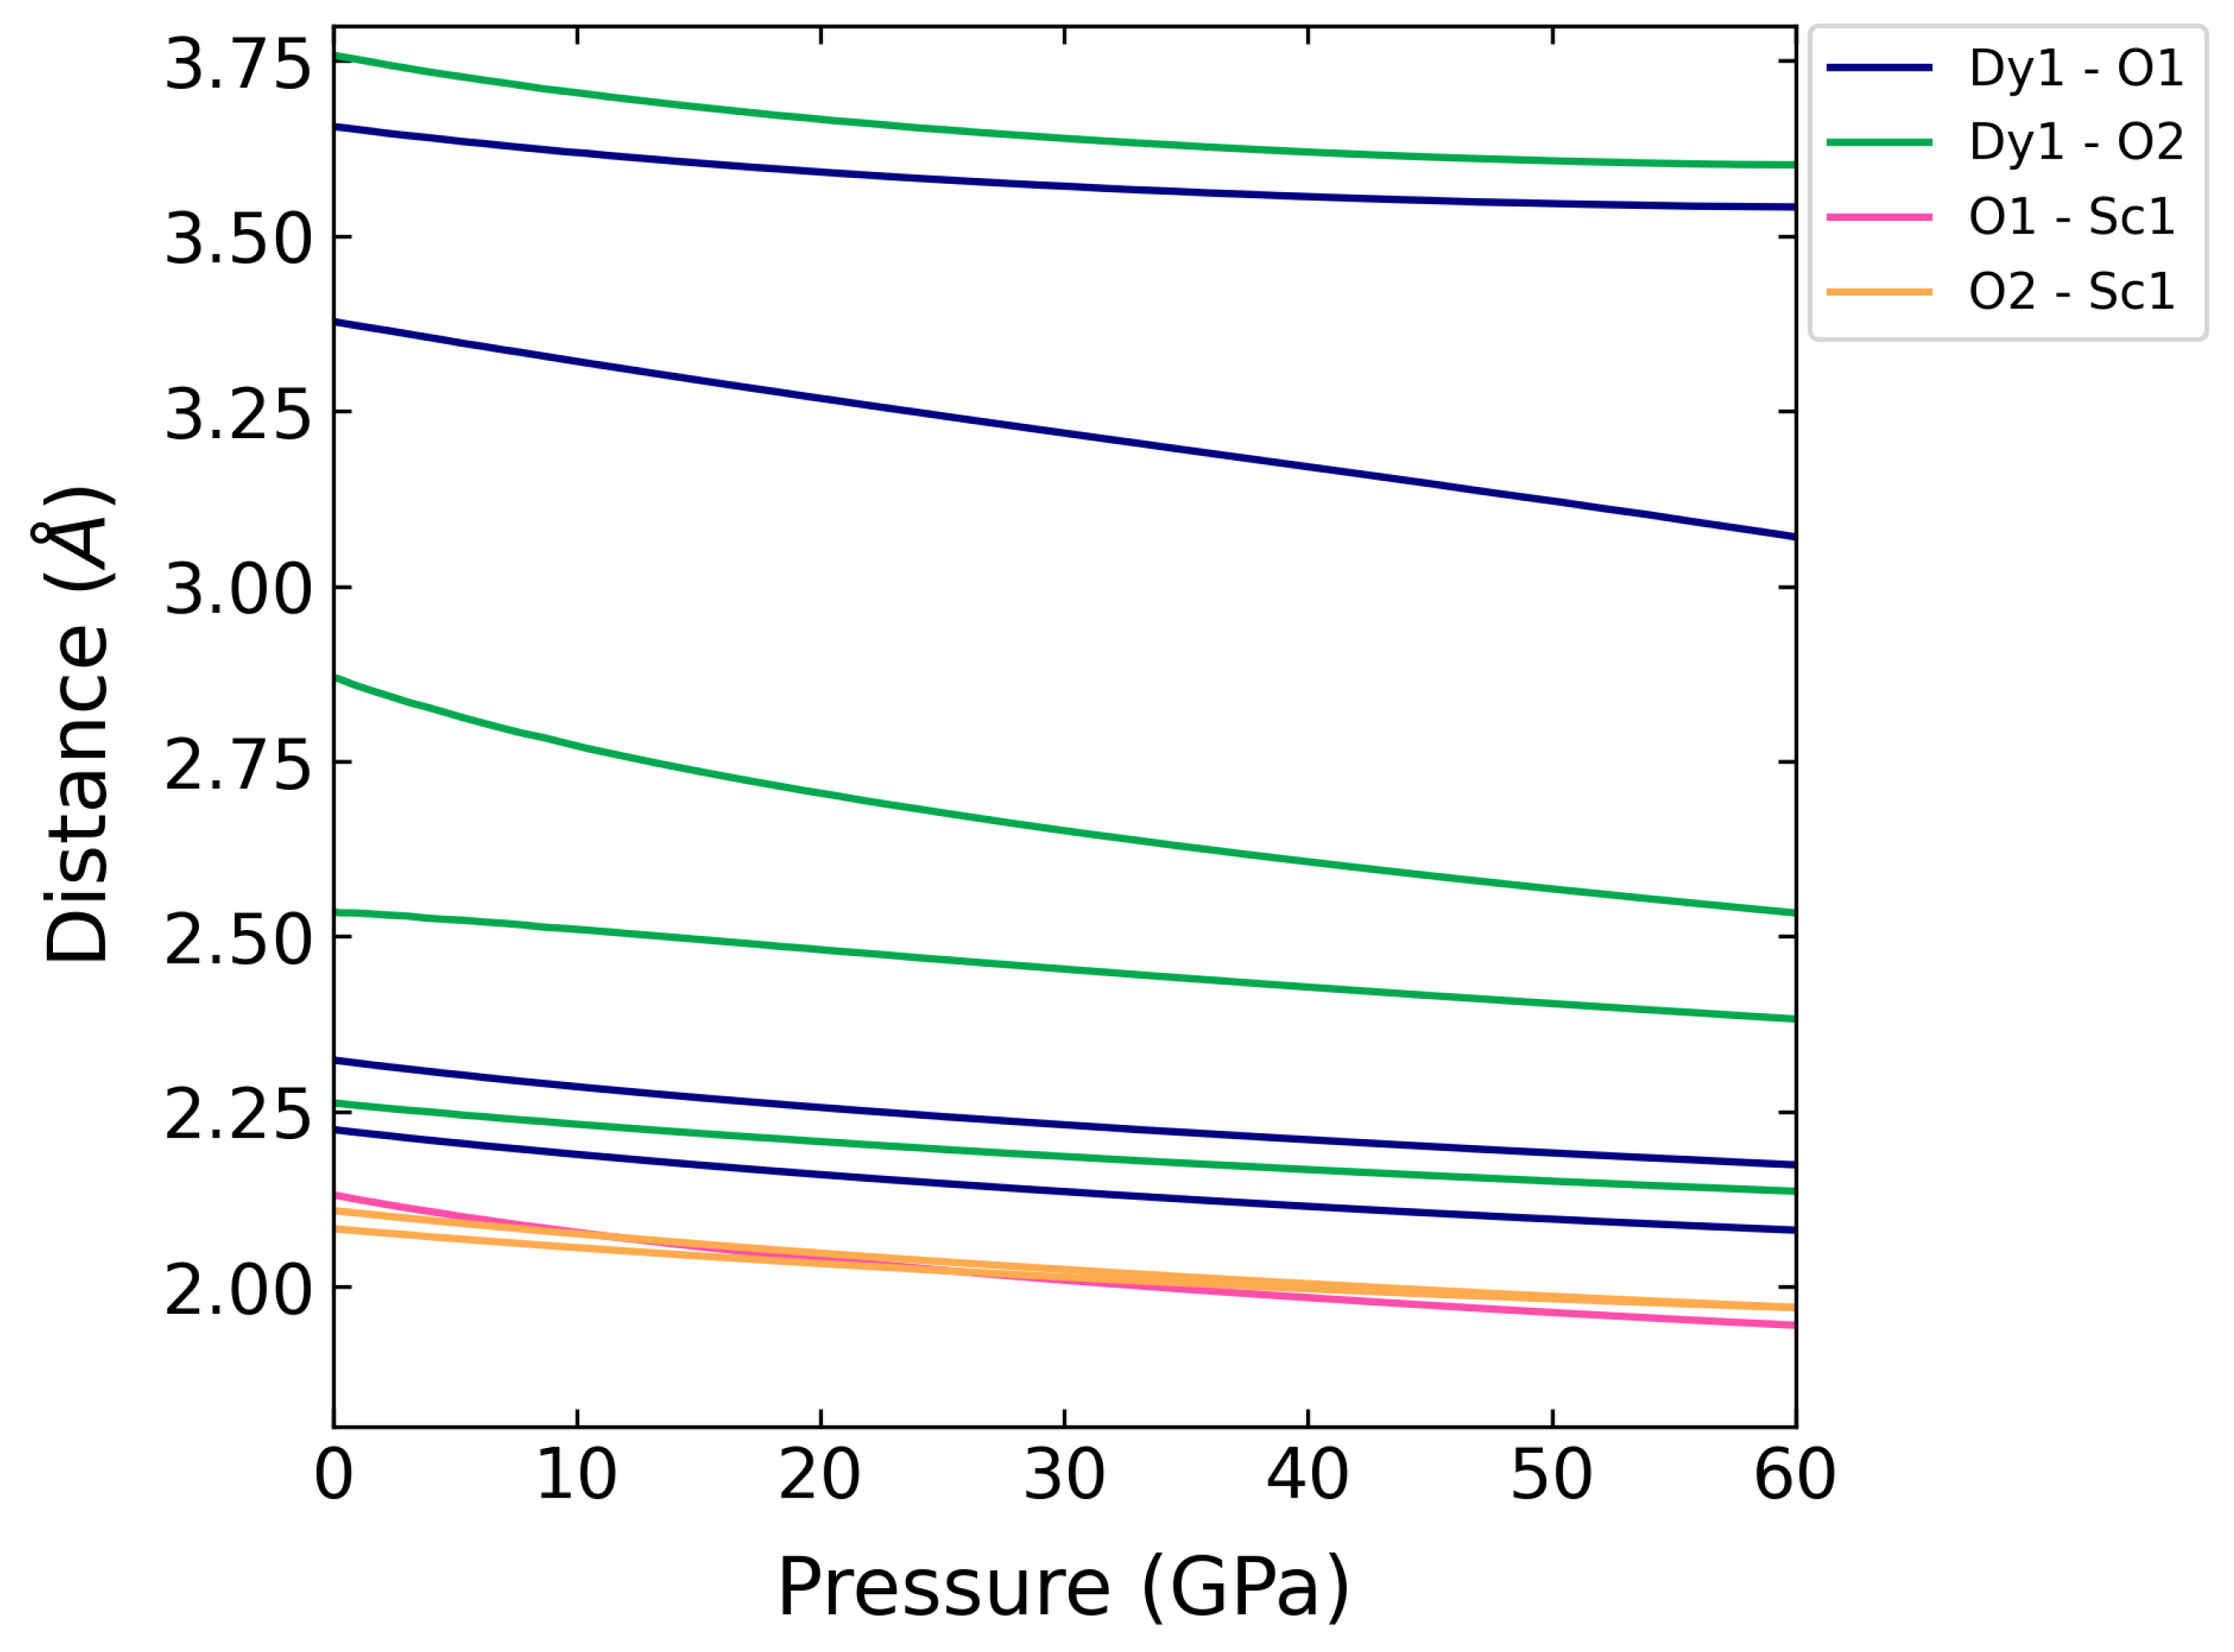
In Figure 4 we show the calculated pressure-evolution of near-neighbor distances in DyScO. Our calculated values for the Sc-O interatomic distances, which are related to the ScO octahedra, are typical for octahedrally coordinated scandium, and the octahedra show little distortion over the studied pressure range. The Dy-O distances show a larger variation and there is a gap between the first eight and the last four such distances, which makes it possible to distinguish between a first and second shell for the Dy sites and has led some authors to consider Dy as being 8-fold coordinated [25,35].
Related to the observed behavior for the cell volumes and the lattice parameters, we find that the calculated values of the polyhedra volumes stray somewhat away from the experimental ones at large pressures, but nonetheless the volume ratio of DyO to ScO stays above the value of four as suggested in Ref. [34] for a stable material. The ScO octahedra are less compressible than the DyO polyhedra, so the latter are the main contributors to the volume change of the material, see Figure 5.
3.2. Elastic Properties
As described in Section 3.1, DyScO has an orthorhombic structure with SG Pbnm No 62 and therefore there are nine independent elastic constants: , , , , , , , and [36]. The study of elastic constants is useful to understand both the mechanical properties and the structural stability of the material. Our calculated values at zero pressure of these constants for DyScO are compared with other ab initio and experimental results in Table 4.
The , , and elastic constants, which are related to unidirectional compressions along the principal crystallographic directions, are much larger than the , , and constants that are related to resistance against shear deformations. Consequently, there is a larger resistance to unidirectional compression than to shear deformation. The structure is stable at 0 GPa as it fulfills the Born stability criteria [38] given by the following expressions [39]:
When stress is applied to the crystal, the elastic properties of the material are no longer described by the elastic constants , and the elastic stiffness coefficients must be employed instead. If the external stress corresponds to a hydrostatic pressure p, the elastic stiffness coefficients for a crystal are expressed as [40,41]:
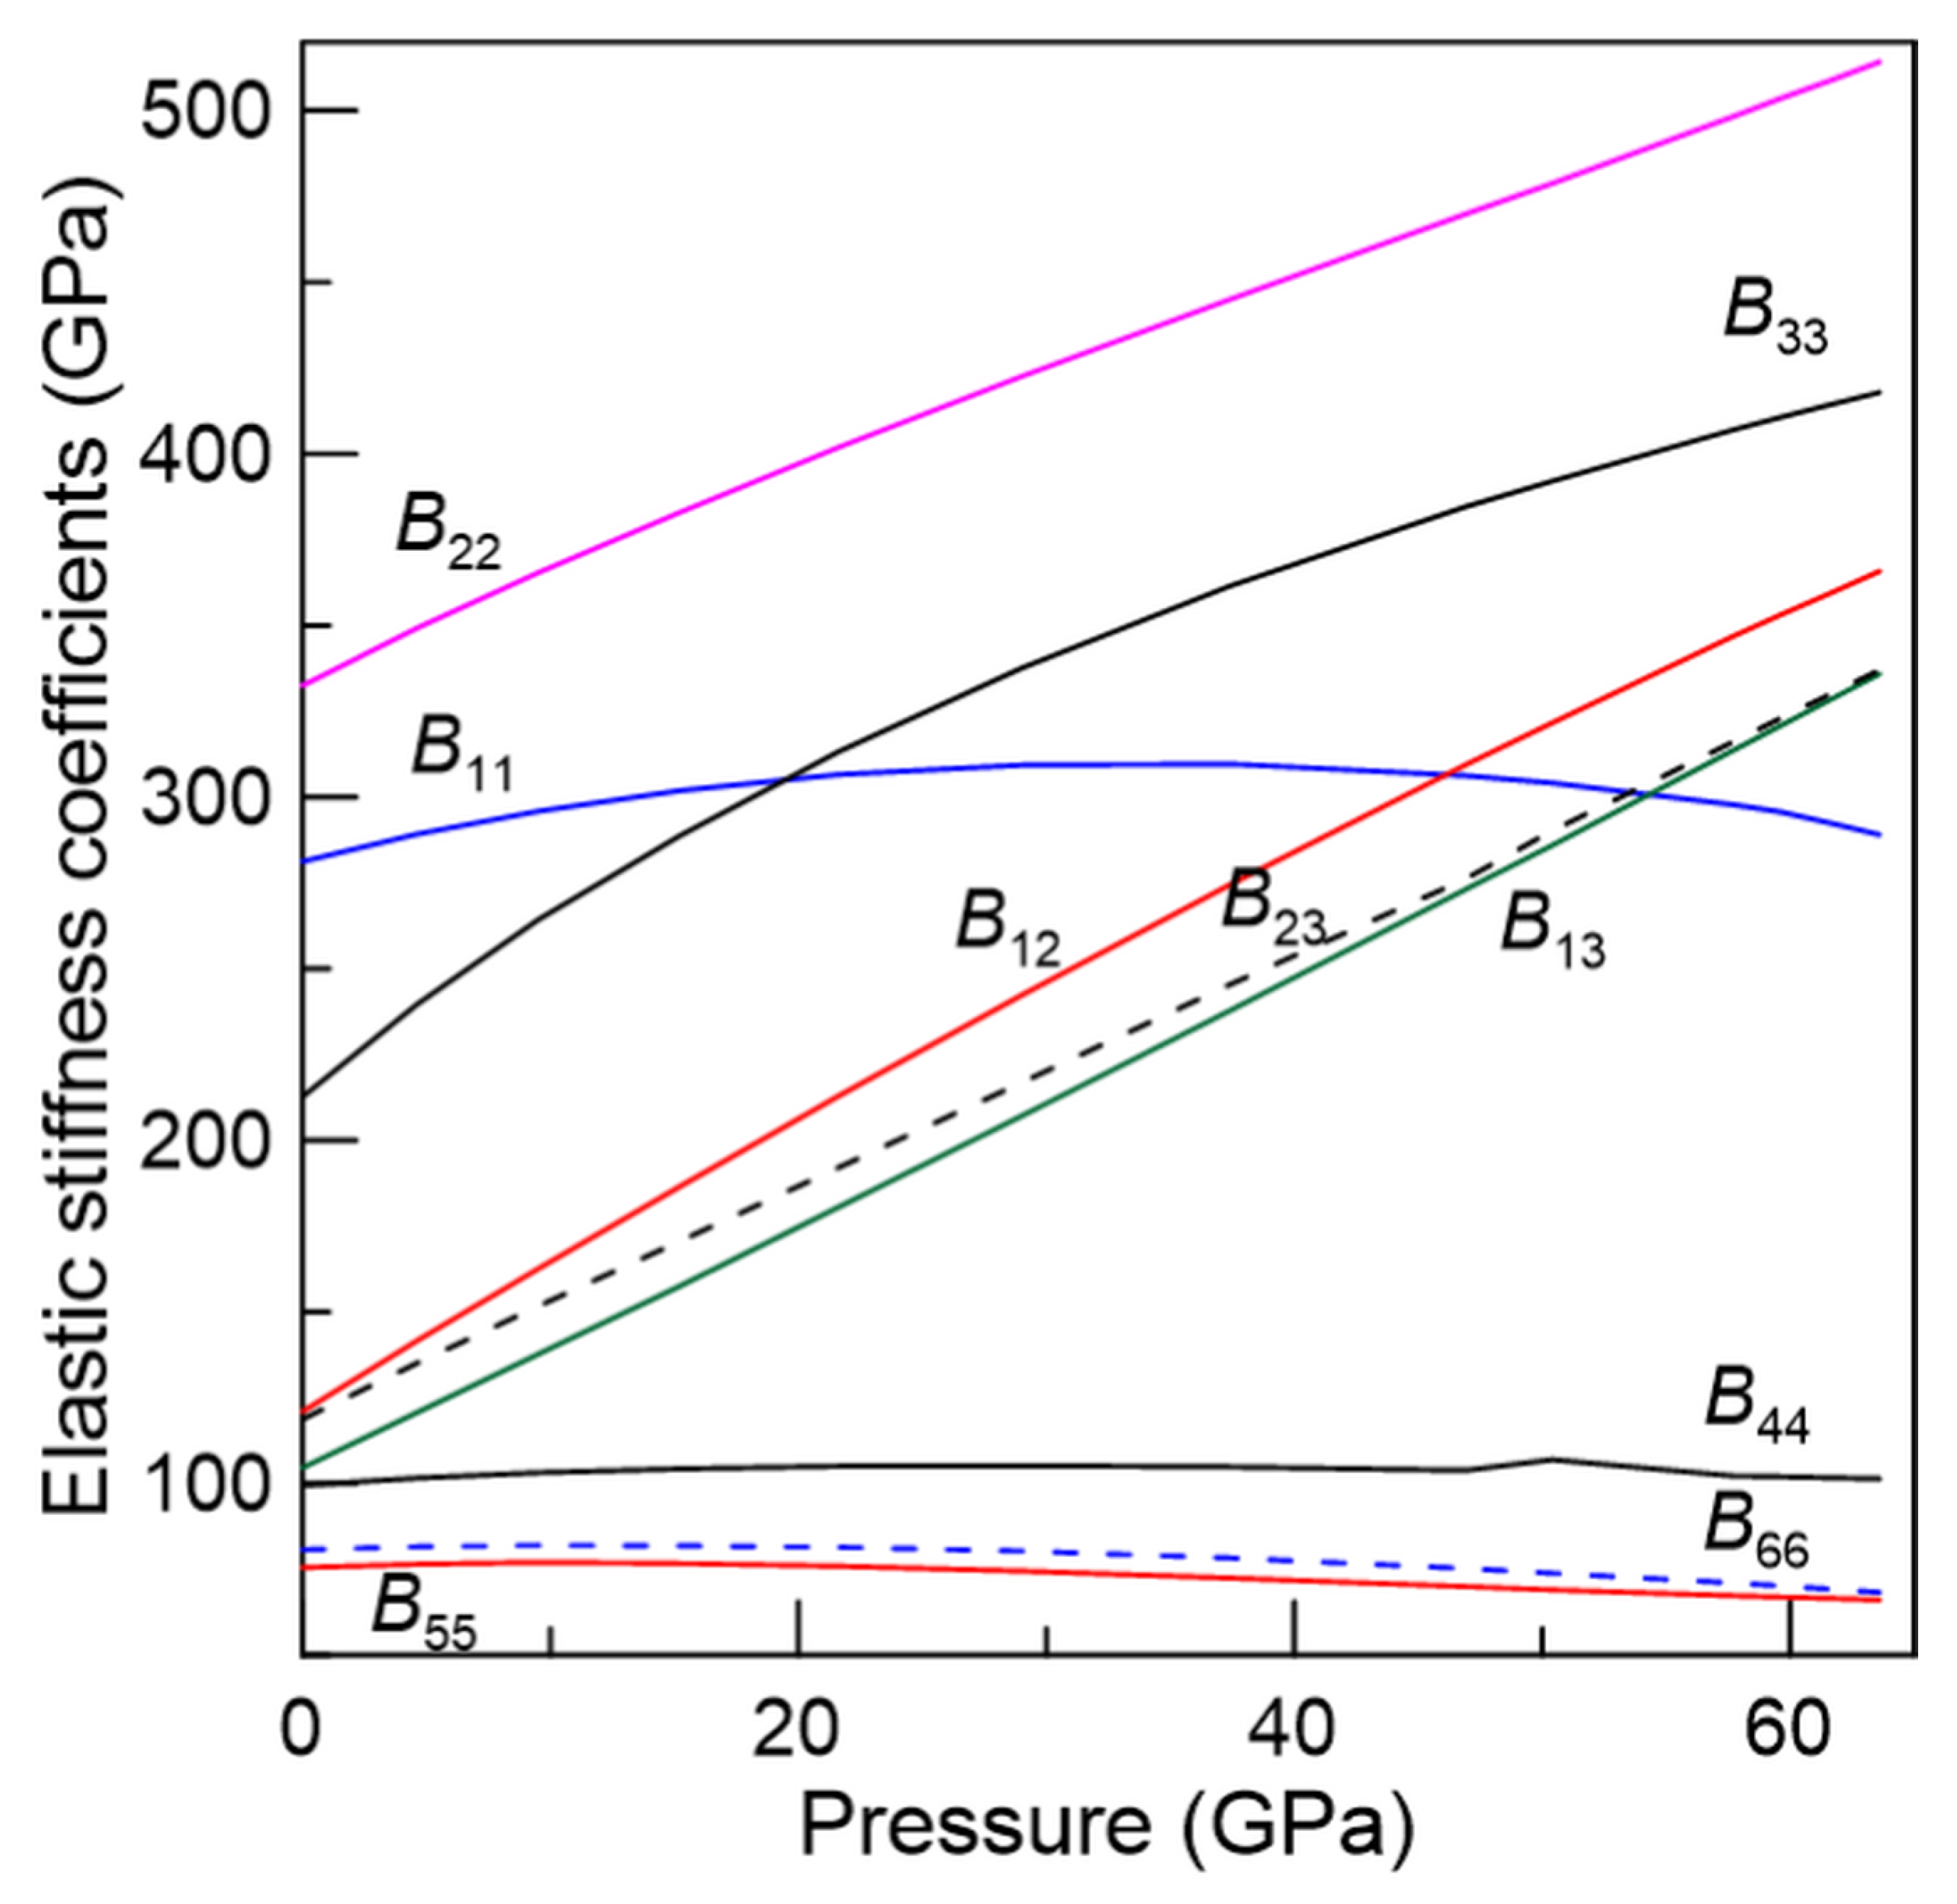
where the are the elastic constants evaluated at the current stressed state. (As can be seen, the , coefficients reduce to the when no pressure is applied.) The evolution of the elastic stiffness coefficients under pressure is depicted in Figure 6. The coefficients , , , , and increase with pressure in the whole pressure range studied. On the other hand, , , and decrease slowly. The coefficient increases slightly up to 30 GPa and then decreases smoothly.
The stiffness coefficients allow us to obtain the elastic moduli that describe the major elastic properties of the material at any hydrostatic pressure. Employing standard relations for orthorhombic crystals [42], we have obtained the bulk modulus B, the shear modulus G, the young modulus E, the Poison´s ratio , and the B/G ratio. The values of the above-mentioned elastic moduli at zero pressure as calculated within the standard schemes of Voigt, Reuss, and Hill (with the latter one defined as the arithmetic average of the other two models [43,44,45]) are displayed in Table 5.
It is worth noting that the bulk modulus, an important parameter related to the resistance of a material to compression, yields a similar value in the Hill formalism (164.9 GPa) than the one obtained from the EOS fitting (164.7 GPa), which reflects the consistency of the calculations. As the shear modulus G is associated with the resistance to plastic deformation, it is also interesting to analyze the B/G ratio. According to Pugh´s criterion, if B/G > 1.75 the material is ductile, otherwise the material is brittle [46]. In the present case, our results indicate that DyScO is a ductile material at zero pressure. The Poisson’s coefficient is related to volume changes during uniaxial deformation. Lower coefficients indicate large volume changes during deformation; if = 0.5 no volume changes occur during elastic deformation [40]. This parameter also provides information about the characteristics of the bonding forces. A value of = 0.25 is a lower limit for central forces while = 0.5 is an upper limit [40]. For DyScO, the calculated value of suggests that the forces in this material are predominantly central.
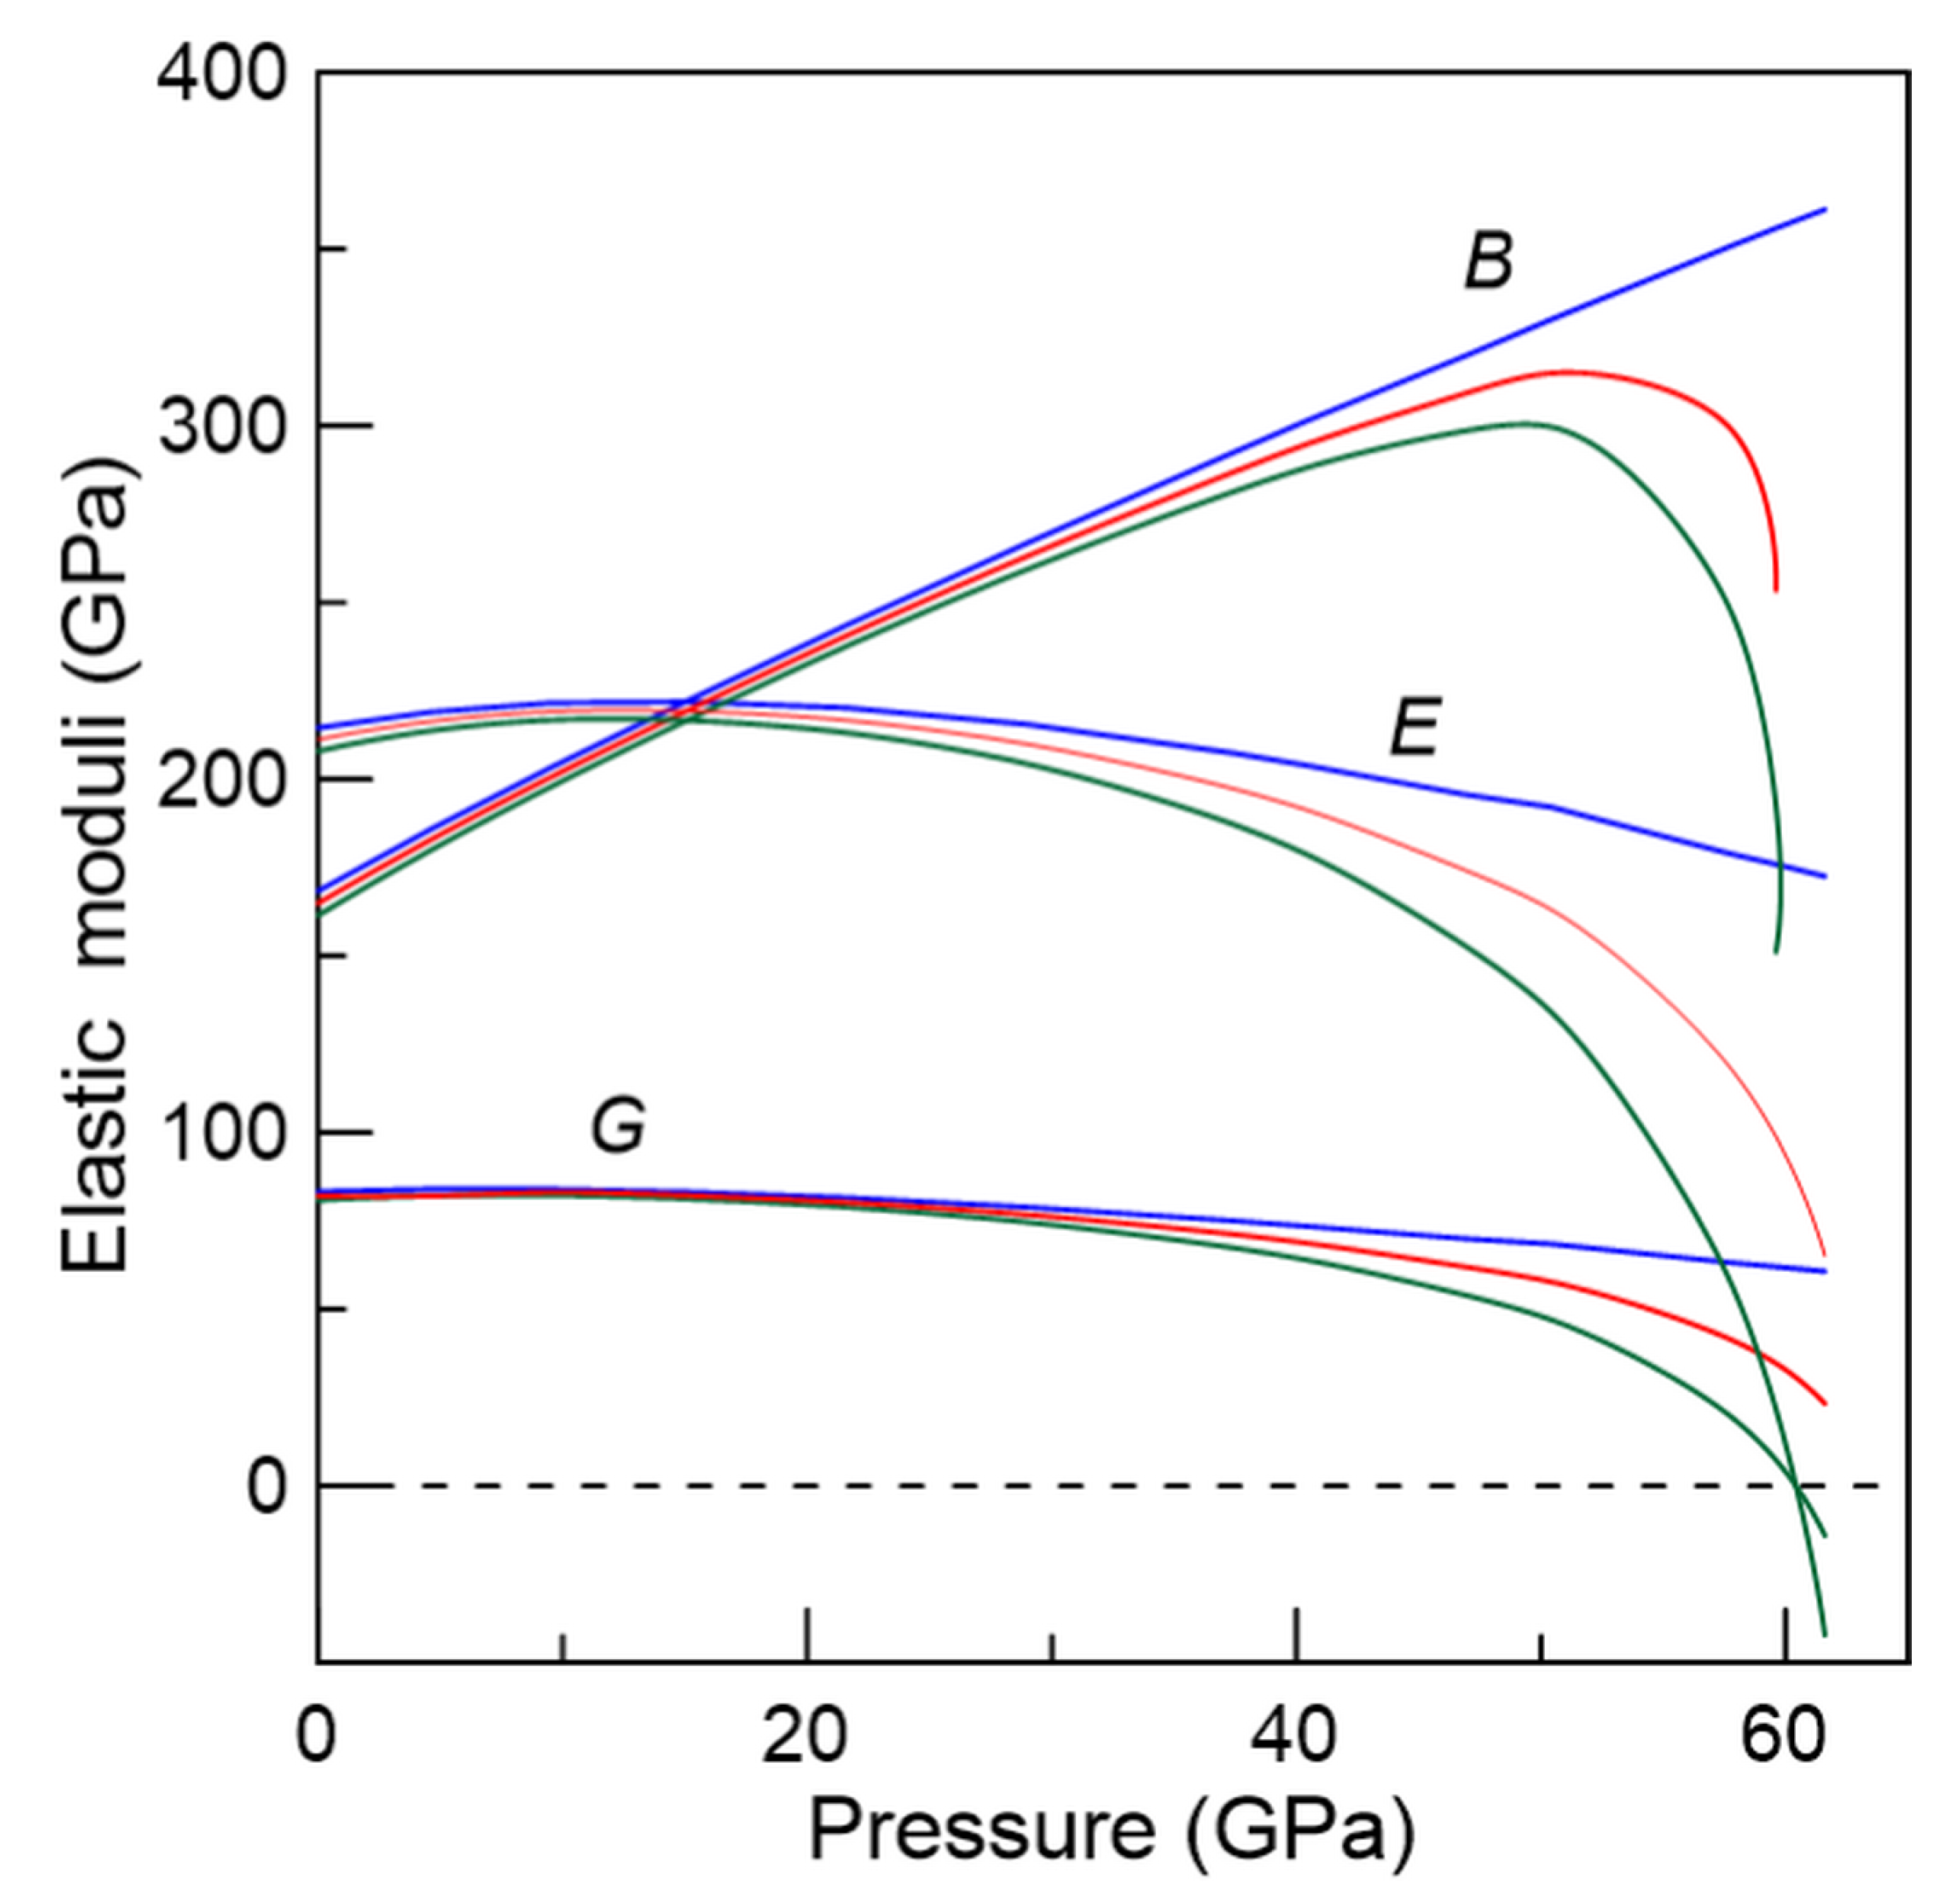
The calculated pressure evolution of the elastic moduli of DyScO is presented in Figure 7. The bulk modulus B as calculated using Voigt’s prescription increases in the whole pressure range under study. However, using Reuss’ scheme the bulk modulus decreases dramatically around 50 GPa. This could be related to mechanical instability, as we will show in the next paragraph. As for the shear and Young moduli (G and E), E reaches a shallow maximum at about 14 GPa, then both moduli decrease with pressure and tend to get closer in values.
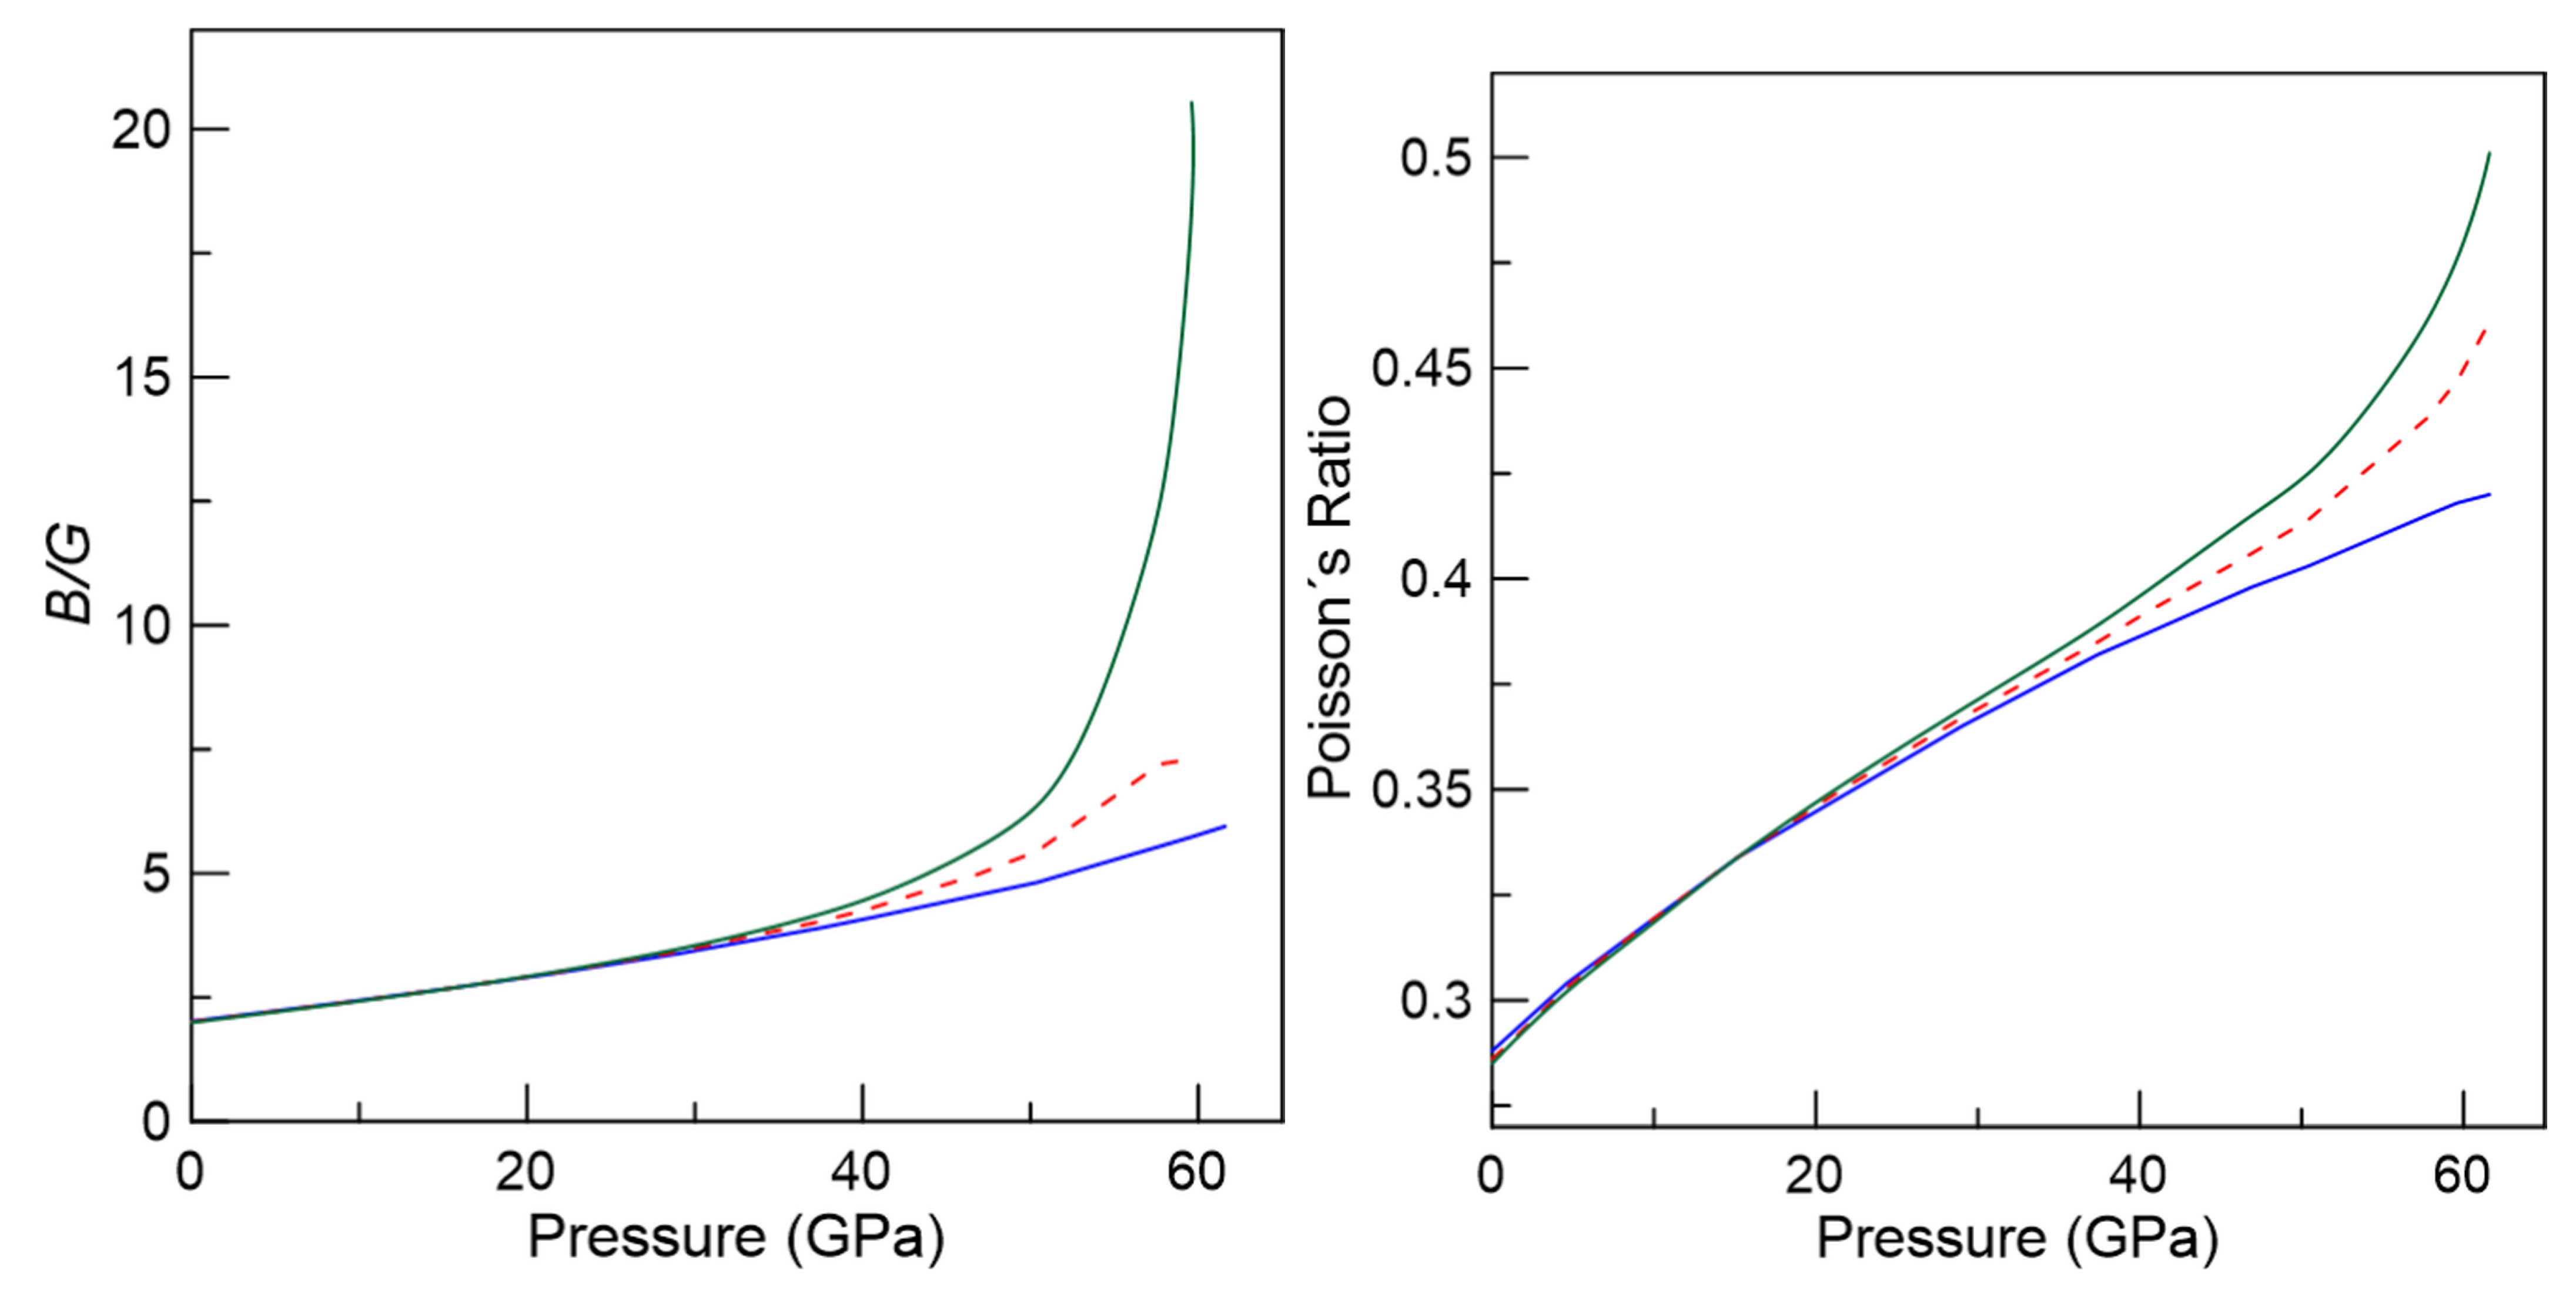
The B/G ratio becomes larger under pressure and so the material becomes more ductile under compression. The Poisson´s ratio increases rapidly with pressure, taking a value of 0.45 in the Hill expression at 60 GPa, see Figure 8.
To conclude, we analyze the mechanical stability of DyScO perovskite under pressure. As stated before, when hydrostatic pressure is applied, the elastic stiffness coefficients must be employed instead of the elastic constants [38]. Therefore, the stability conditions are modified, and one needs to use the following generalized stability conditions for an orthorhombic crystal [38,47]:
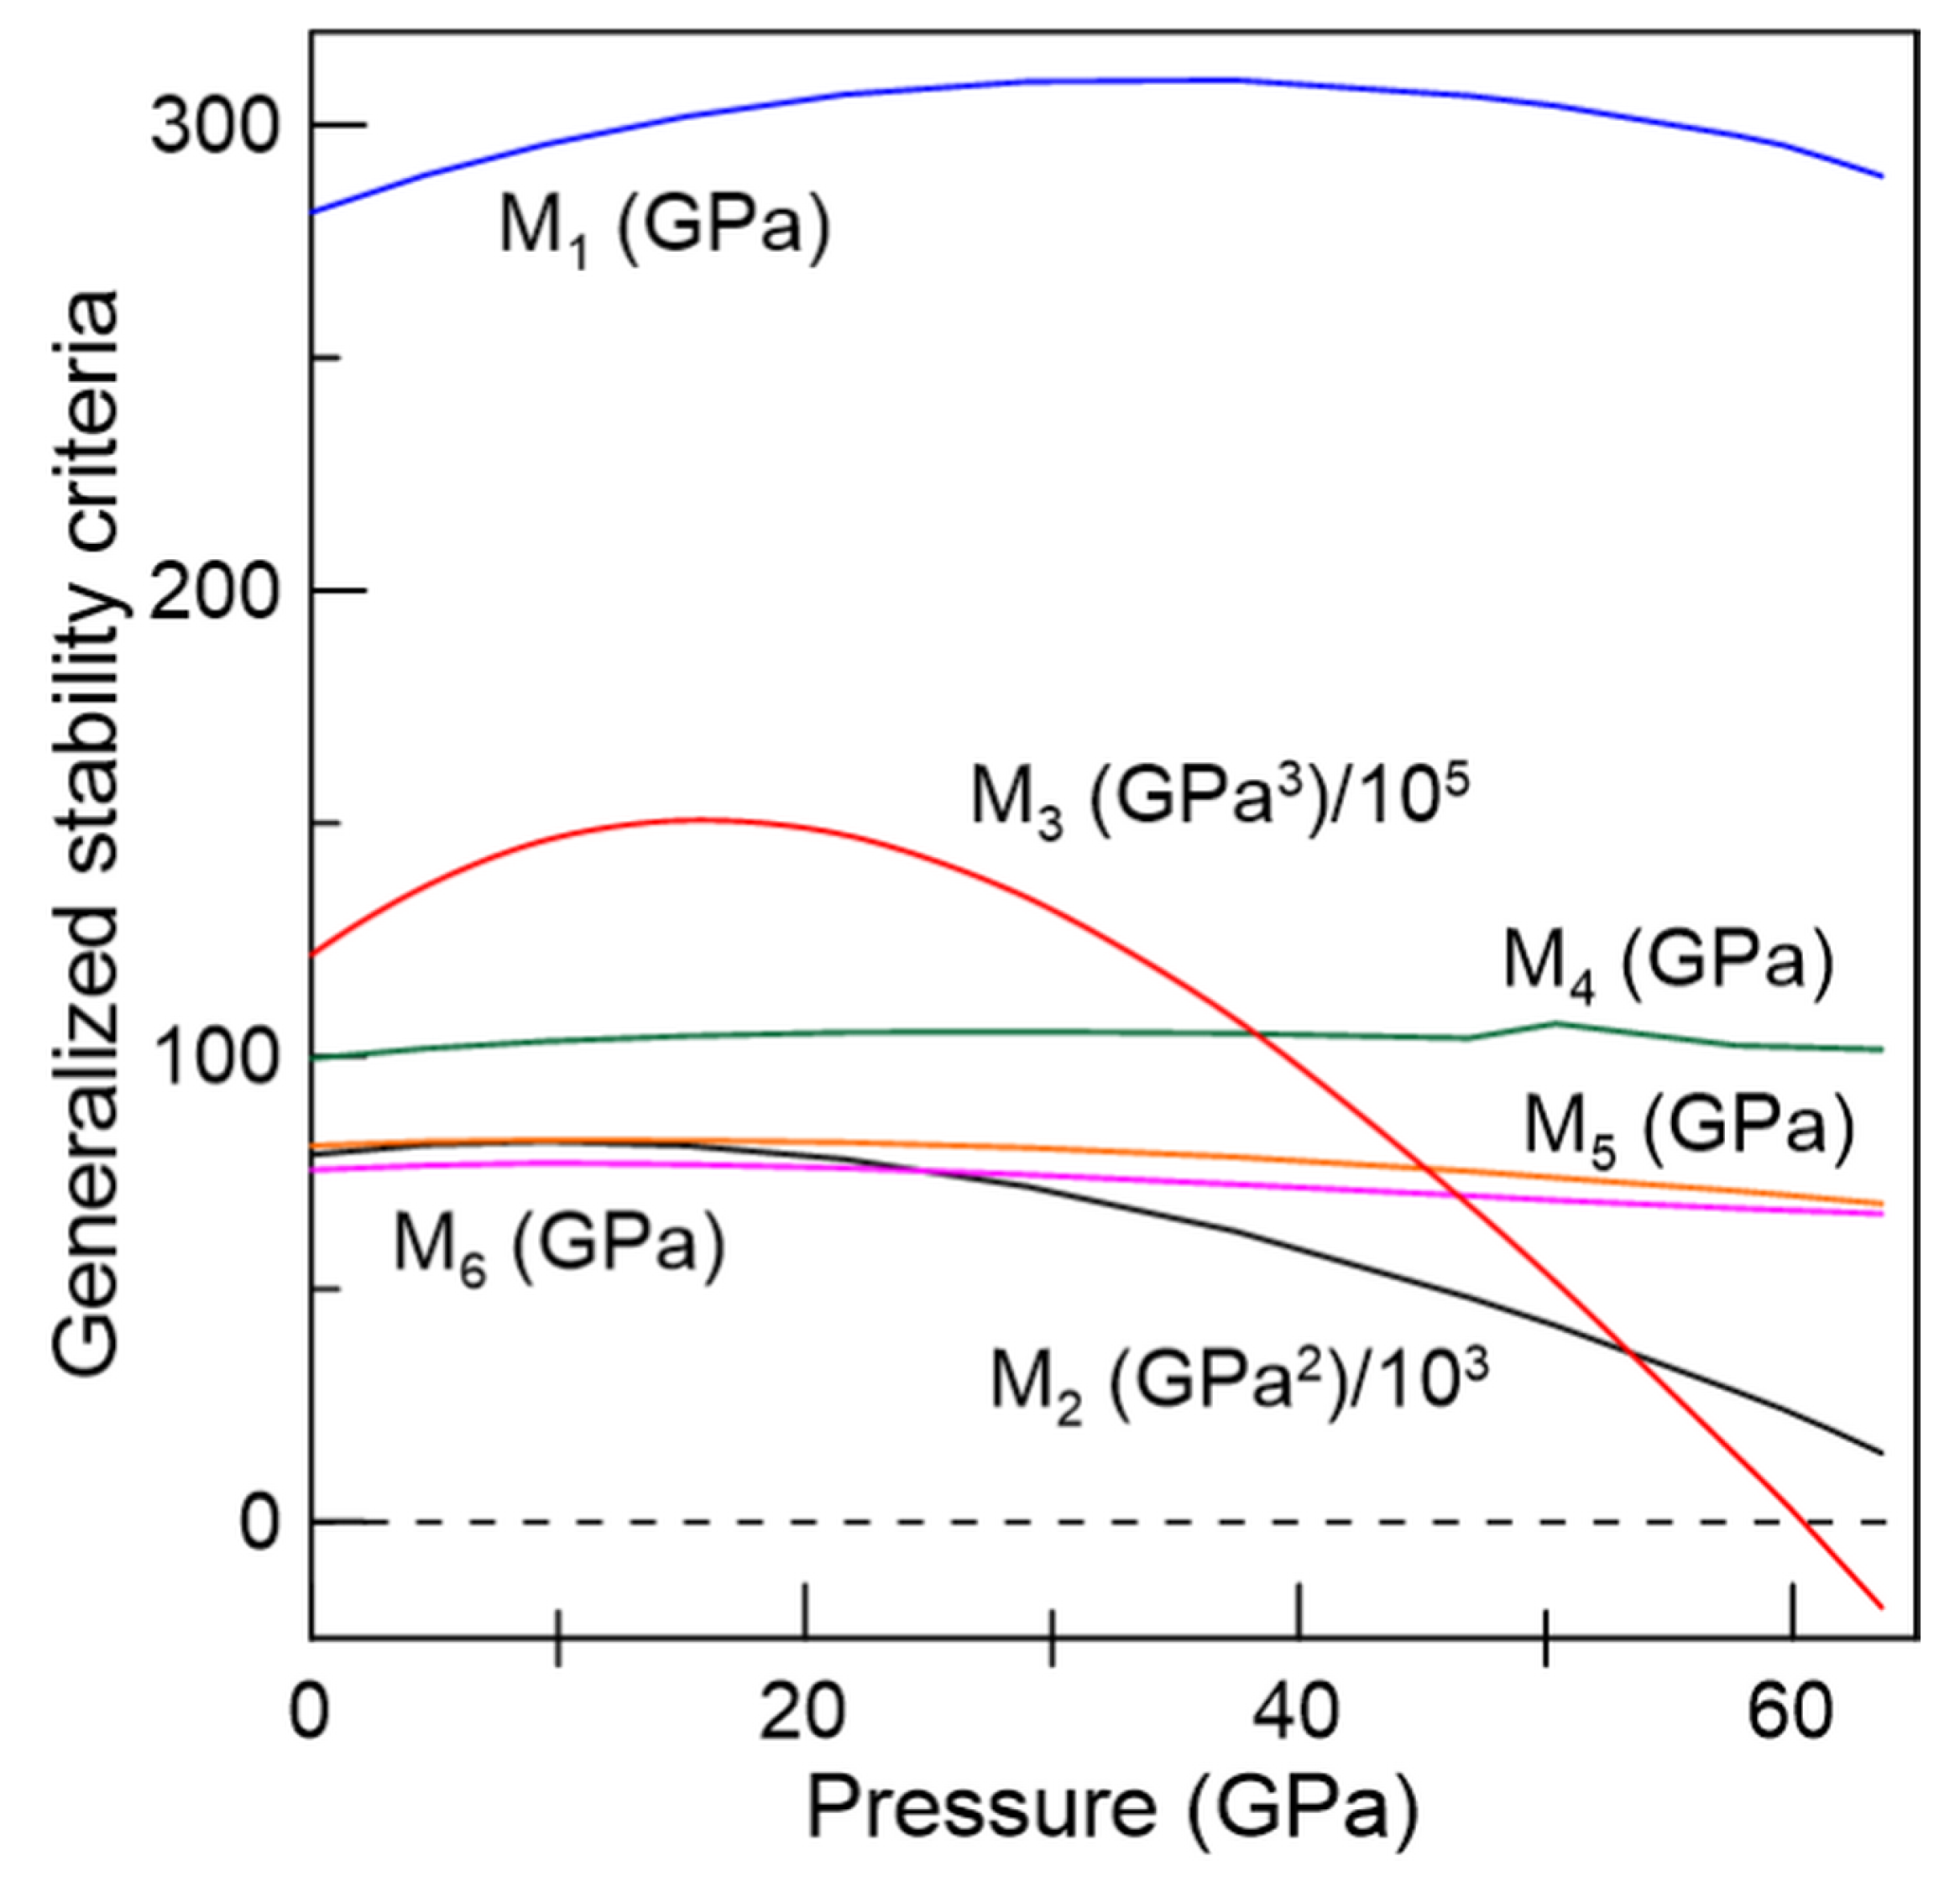
The crystalline structure is mechanically stable when all the above criteria are fulfilled. The evolution of these generalized Born stability criteria ( to 6) as functions of pressure is depicted in Figure 9 where it can be observed that the criterion is violated above 60 GPa, indicating that DyScO would become mechanically unstable at such pressure. Above this pressure an amorphization or a pressure-driven phase transition can occur, a result that may entice further experimental and theoretical research along this line.
3.3. Vibrational Properties
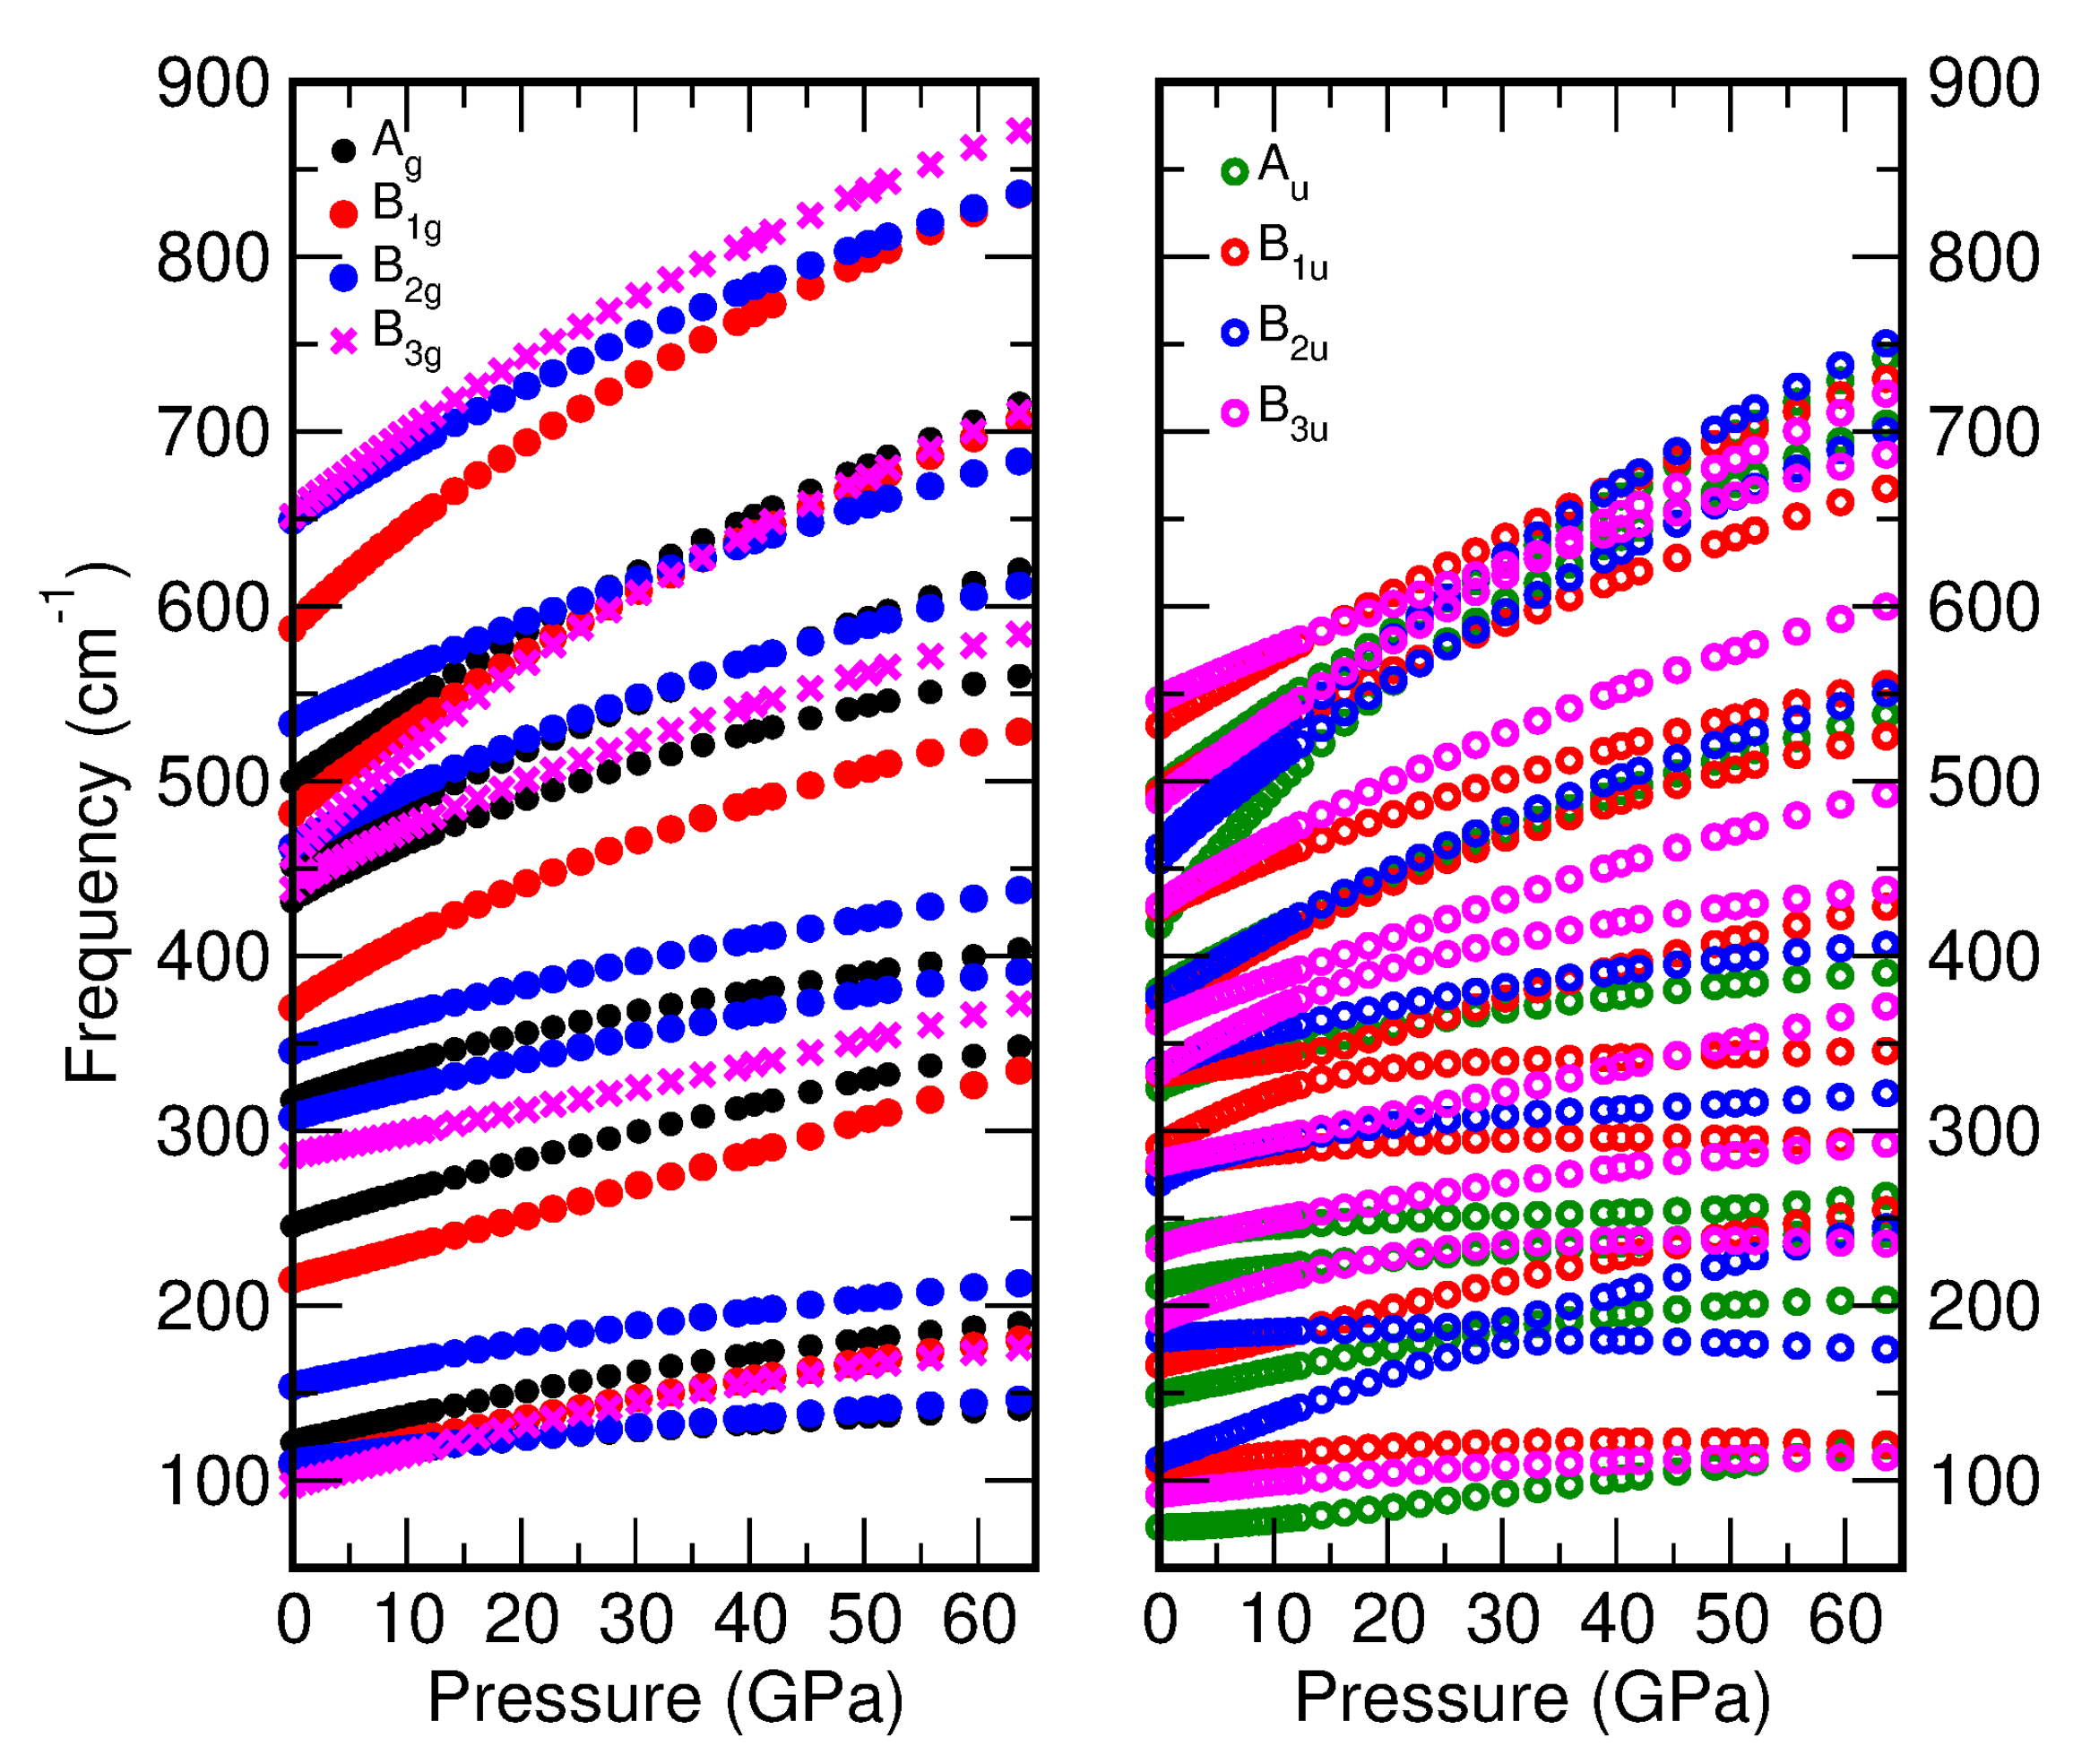
We have also explored the vibrational properties of DyScO perovskite at high pressure using the small-displacements method. The mechanical representation of DyScO yields the following multiplicities for the irreducible representations of the modes at the zone center: M = 7A (R) + 8A (S) + 5B (R) + 10B (IR) + 7B (R) + 8B (IR) + 5B (R) + 10B (IR); of which the A, B, B, and B modes are active in Raman (R); the B, B, and B modes are infrared-active (IR); and the A modes are silent (S). In Figure 10 we display the behavior of the phonon modes at the point (Raman, infrared and silent modes) under applied hydrostatic pressure.
The present calculated values of the frequencies are in overall agreement with previous theoretical values obtained by Delugas et al. [48]. The pressure behavior in the very large region investigated in our work displays some curvature as evidenced in Figure 10 but up to about 15 GPa it can be approximated fairly well by a linear relation. The corresponding fit to the theoretical data yields the values of the pressure coefficients and calculated mode Grüneisen parameters shown in Table 6. As can be seen, they are in overall agreement with the experimental data obtained by Bura et al. [11].
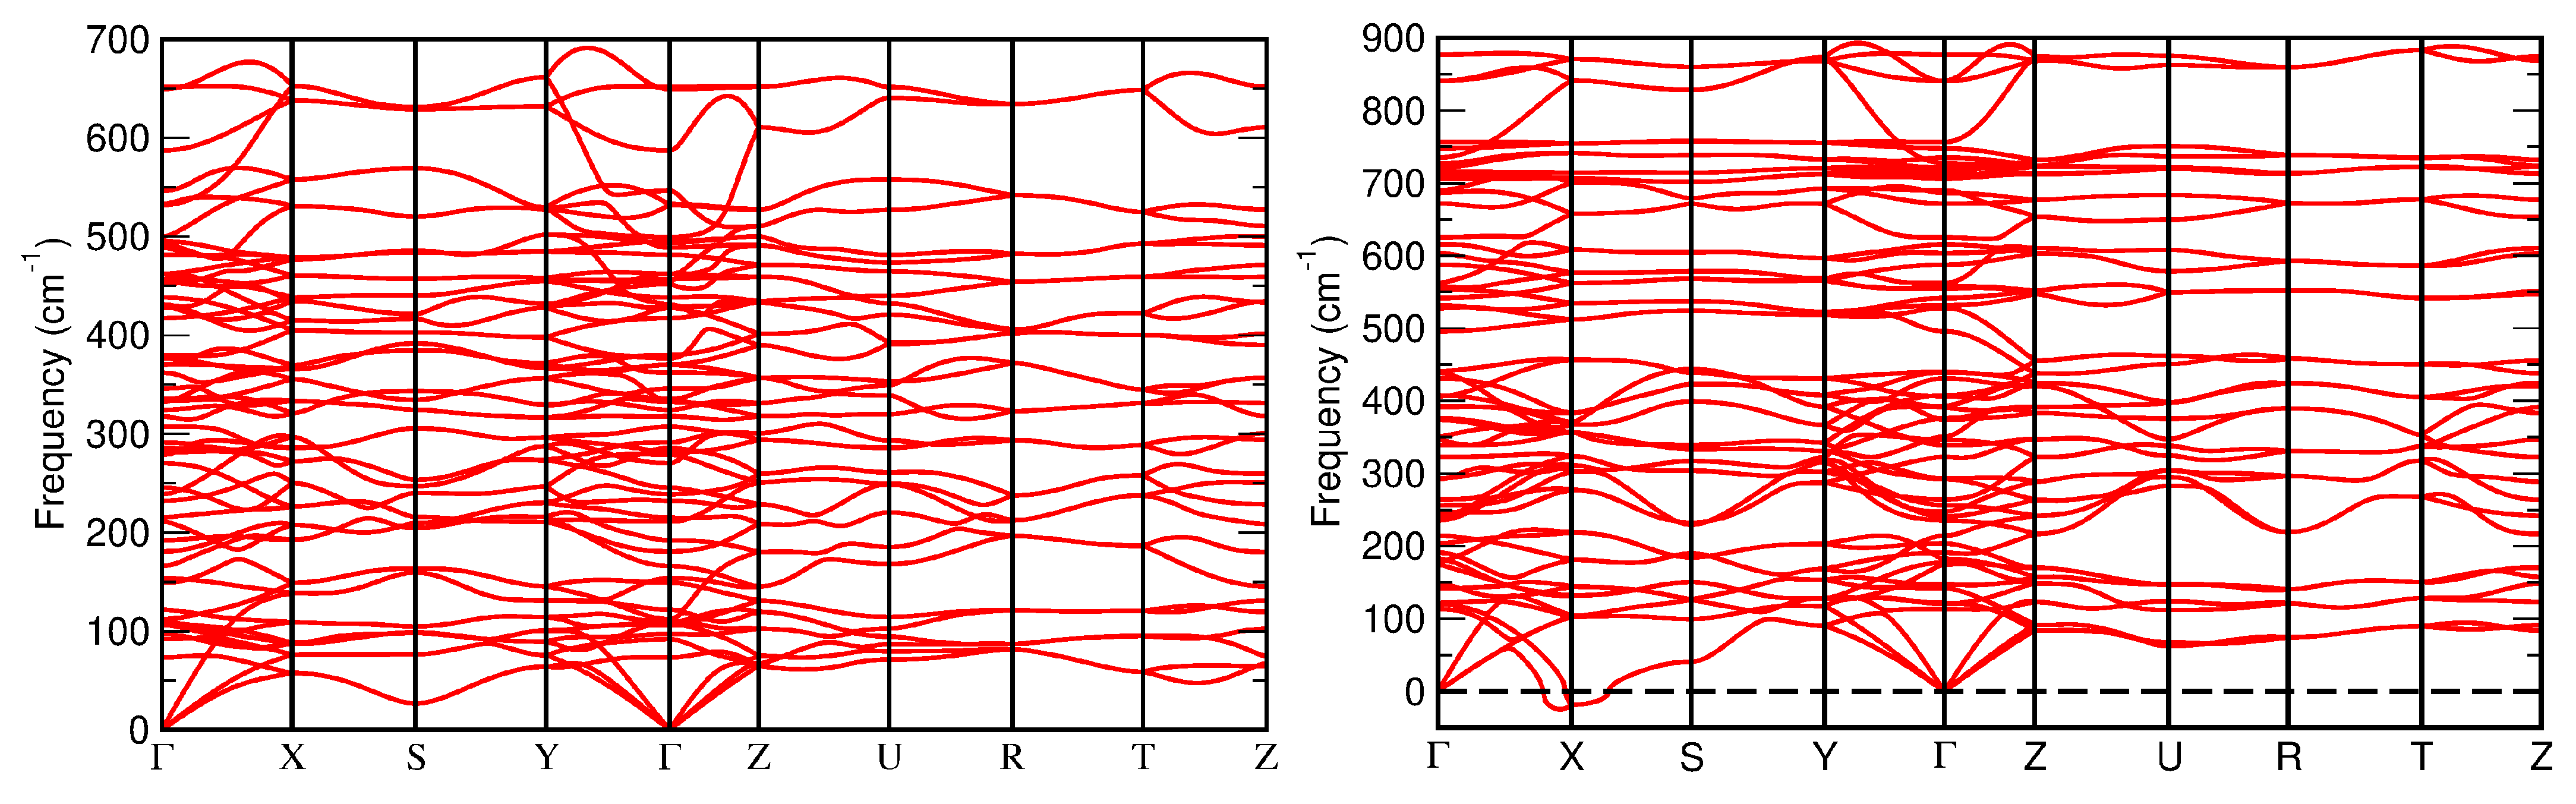
The calculated phonon-dispersion curves along selected paths within the Brillouin zone with endpoints at the high symmetry points for SG 62 are plotted in Figure 11. The phonon dispersion curves at ambient pressure in these figures correspond to a dynamically stable behavior where all the frequencies are positive whereas above around 63 GPa the structure becomes dynamically unstable, displaying phonon branches with negative (imaginary) frequencies around the zone-boundary X point. This instability becomes more accentuated as the pressure is further increased, a pressure regime that we have not considered in this paper.
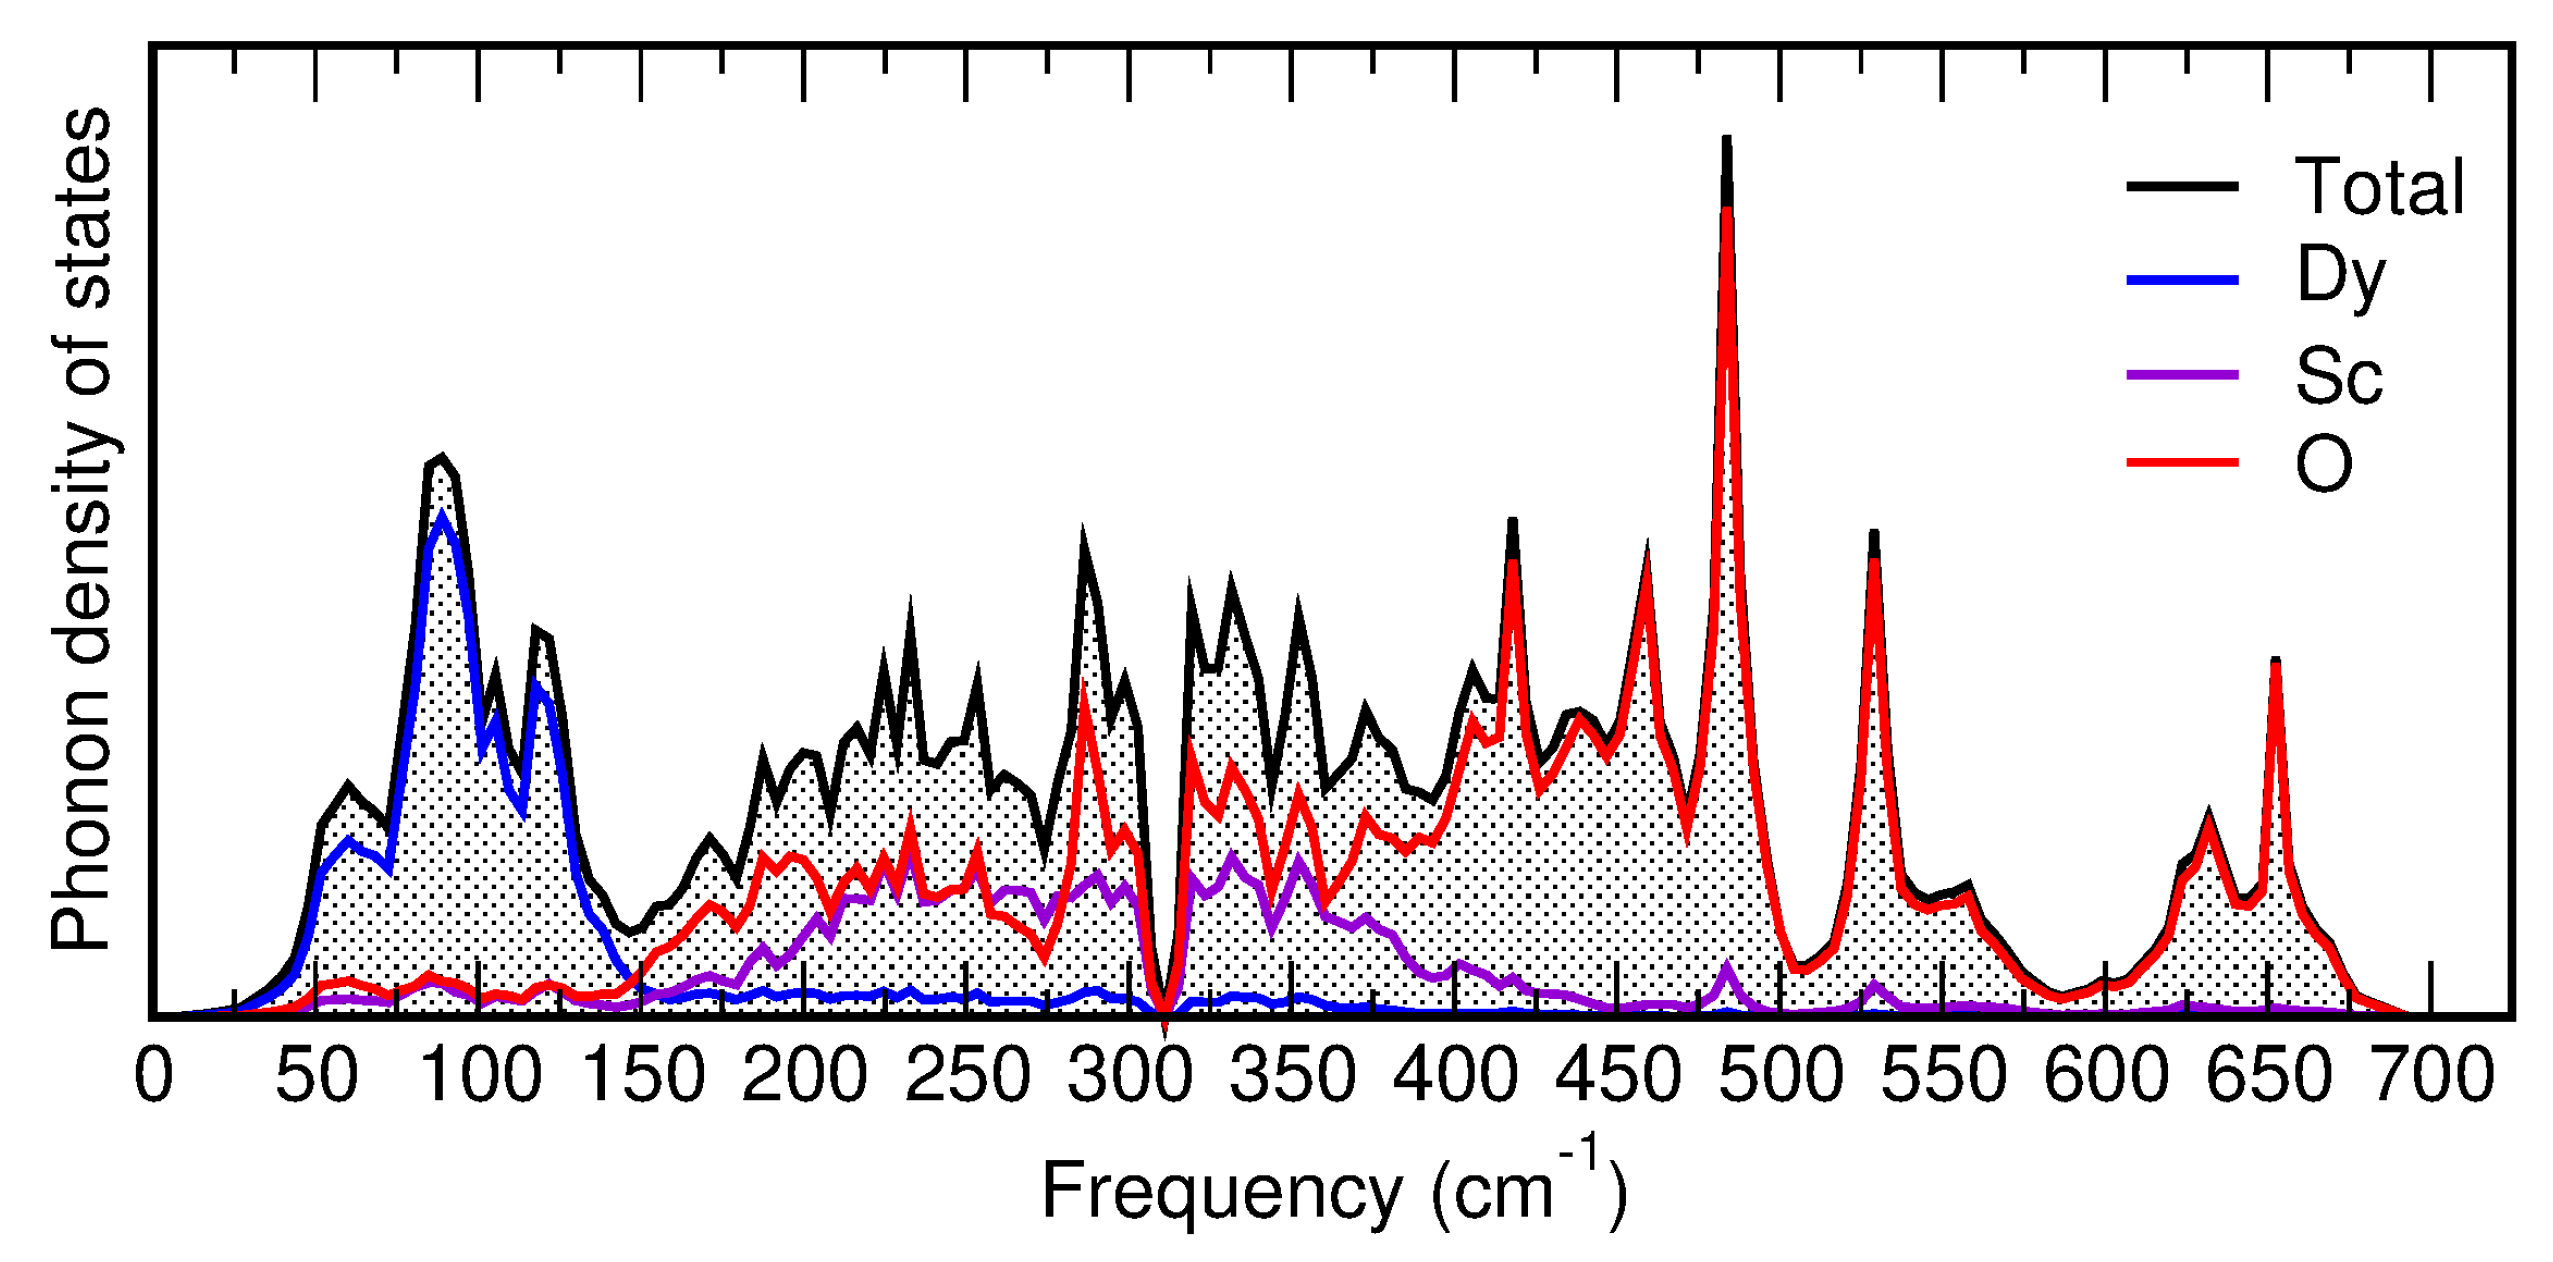
To provide more detail about the nature of the lattice vibrations, the spectral distribution of the phonon density of states (phDOS) was obtained along with the partial phonon density of states, to extract the contribution of each atomic species in the local lattice configuration. Figure 12 shows phDOS plots at ambient pressure. The shape of the phDOS curve above 150 cm is dominated by the oxygen atoms, which are present in larger numbers. At low frequencies (up to 150 cm) the phonon peaks correspond mainly to the heavy Dy atoms, whereas the contribution of these atoms is very small at higher frequencies. In the intermediate frequency region (from 150 cm to 450 cm) there are significant contributions from both the Sc and O atoms.
3.4. Prospective High-Pressure Post-Perovskite Phase
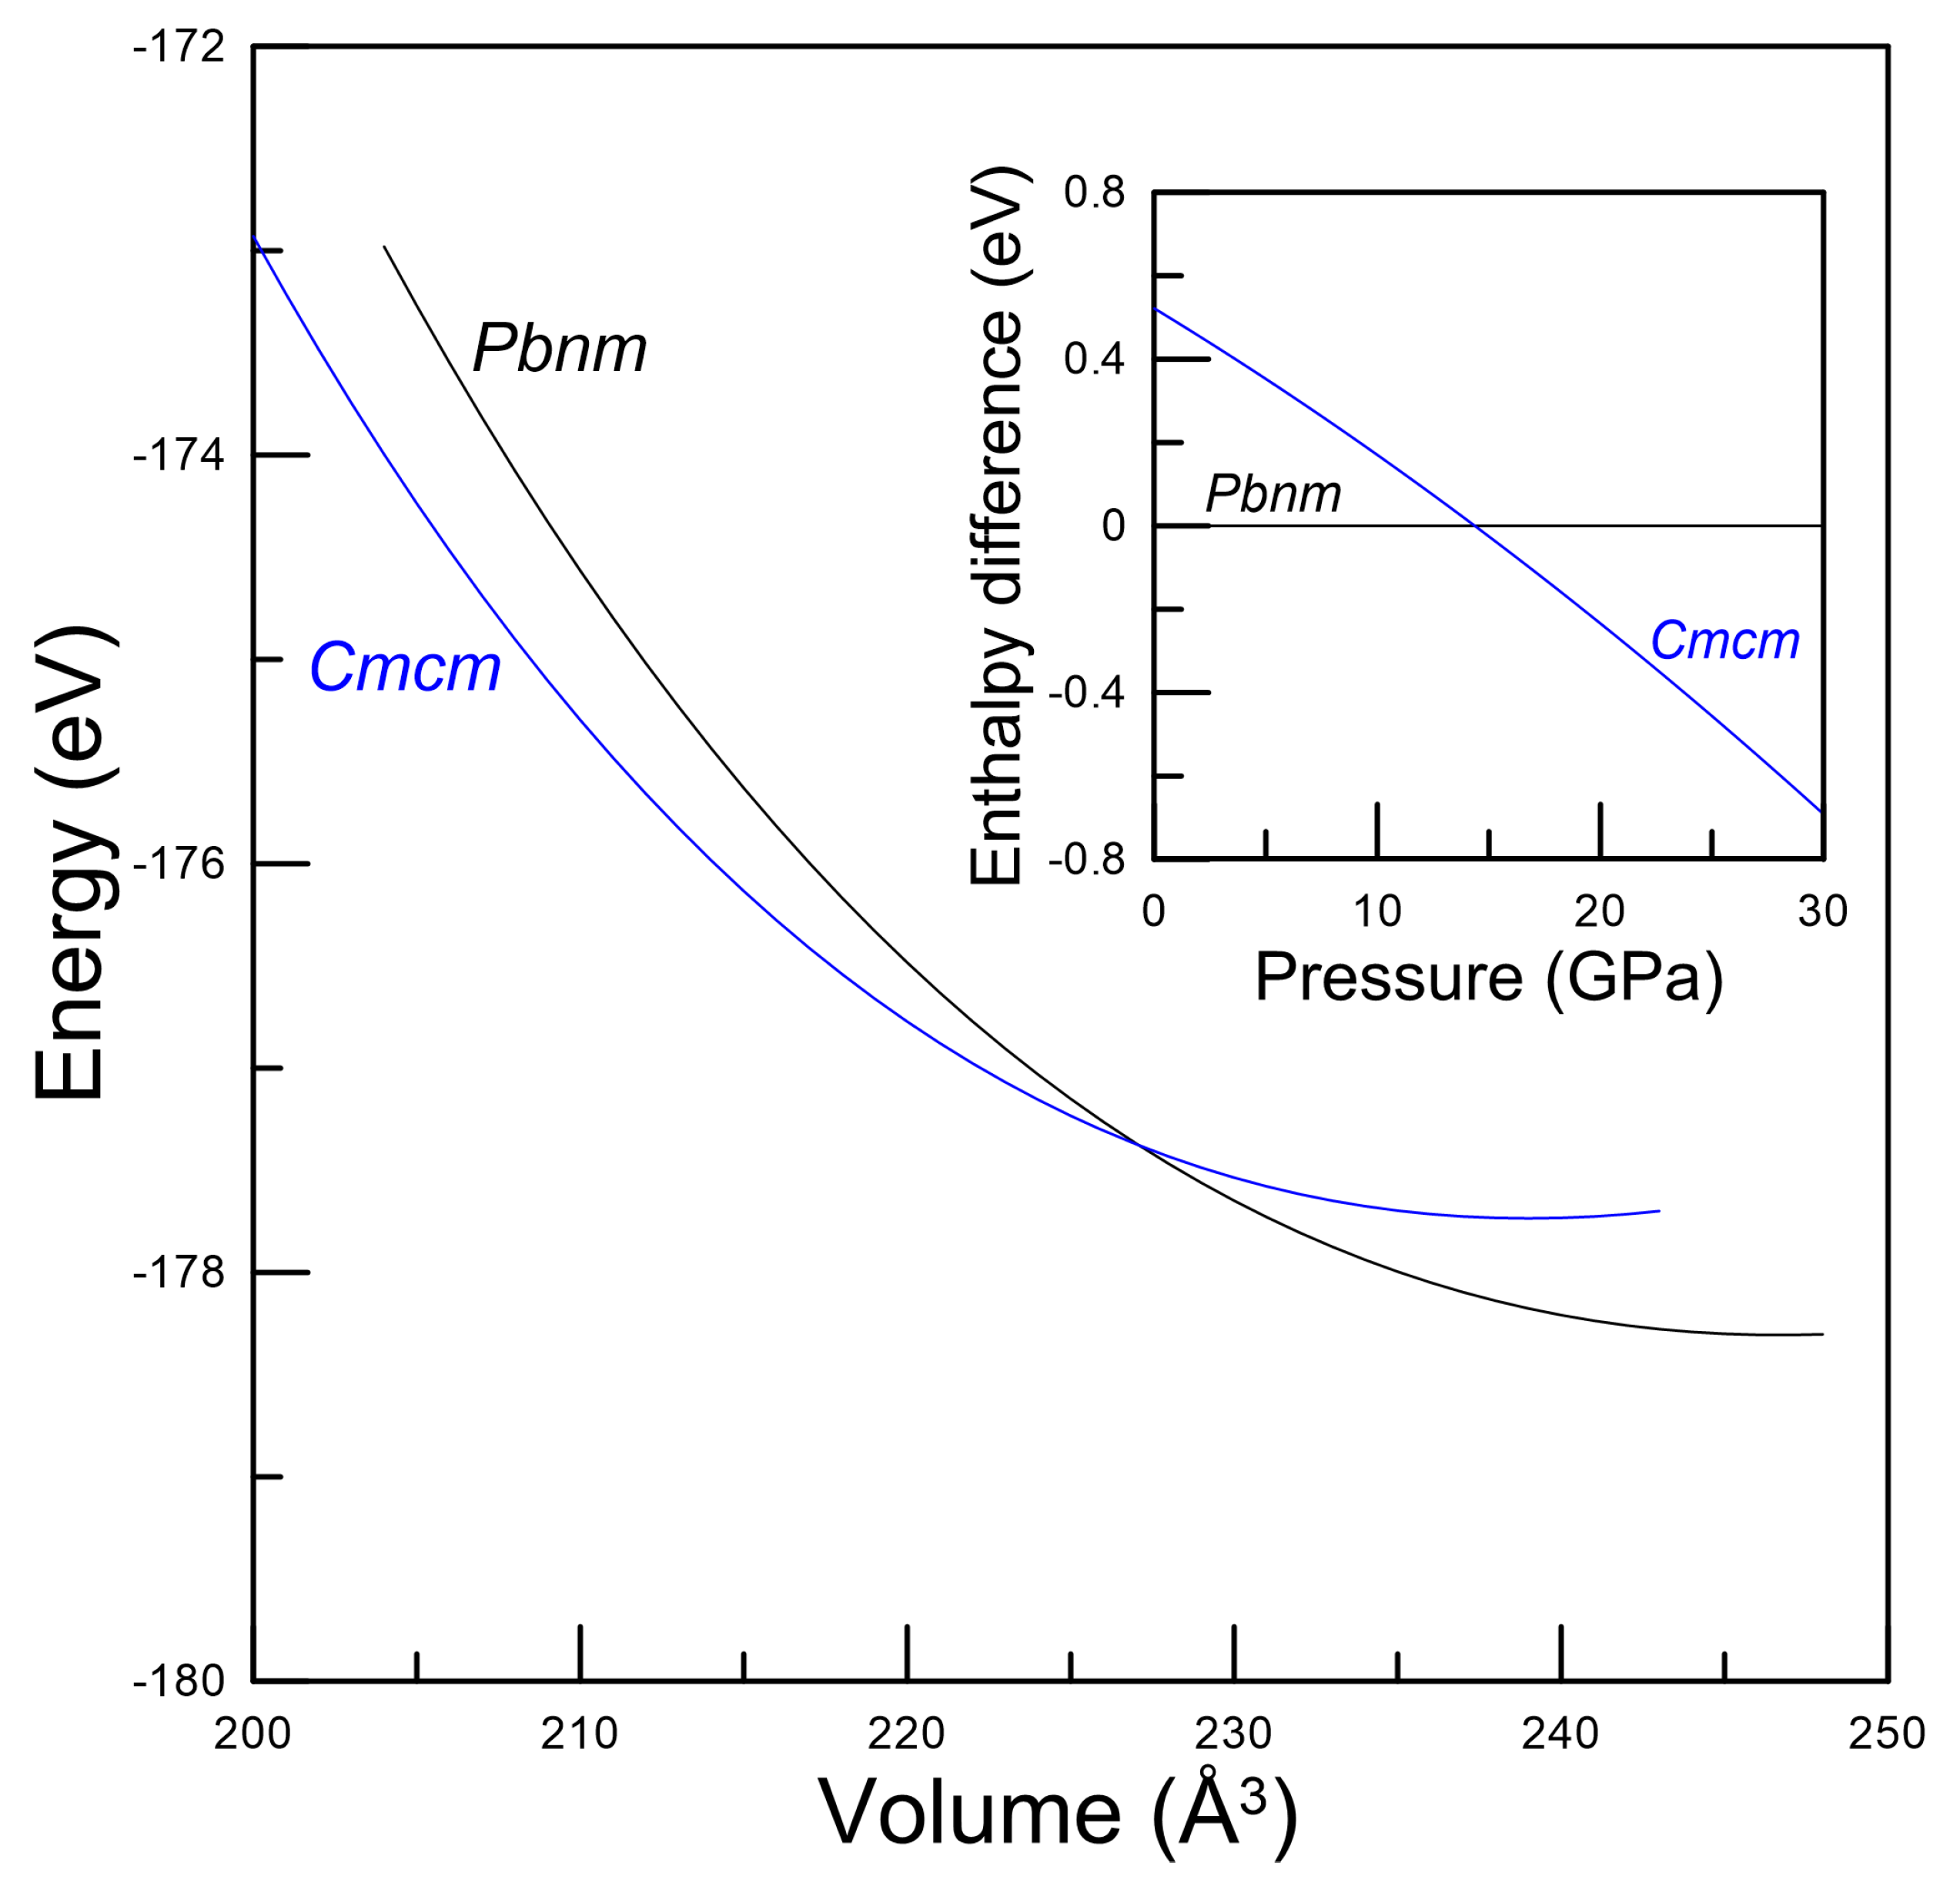
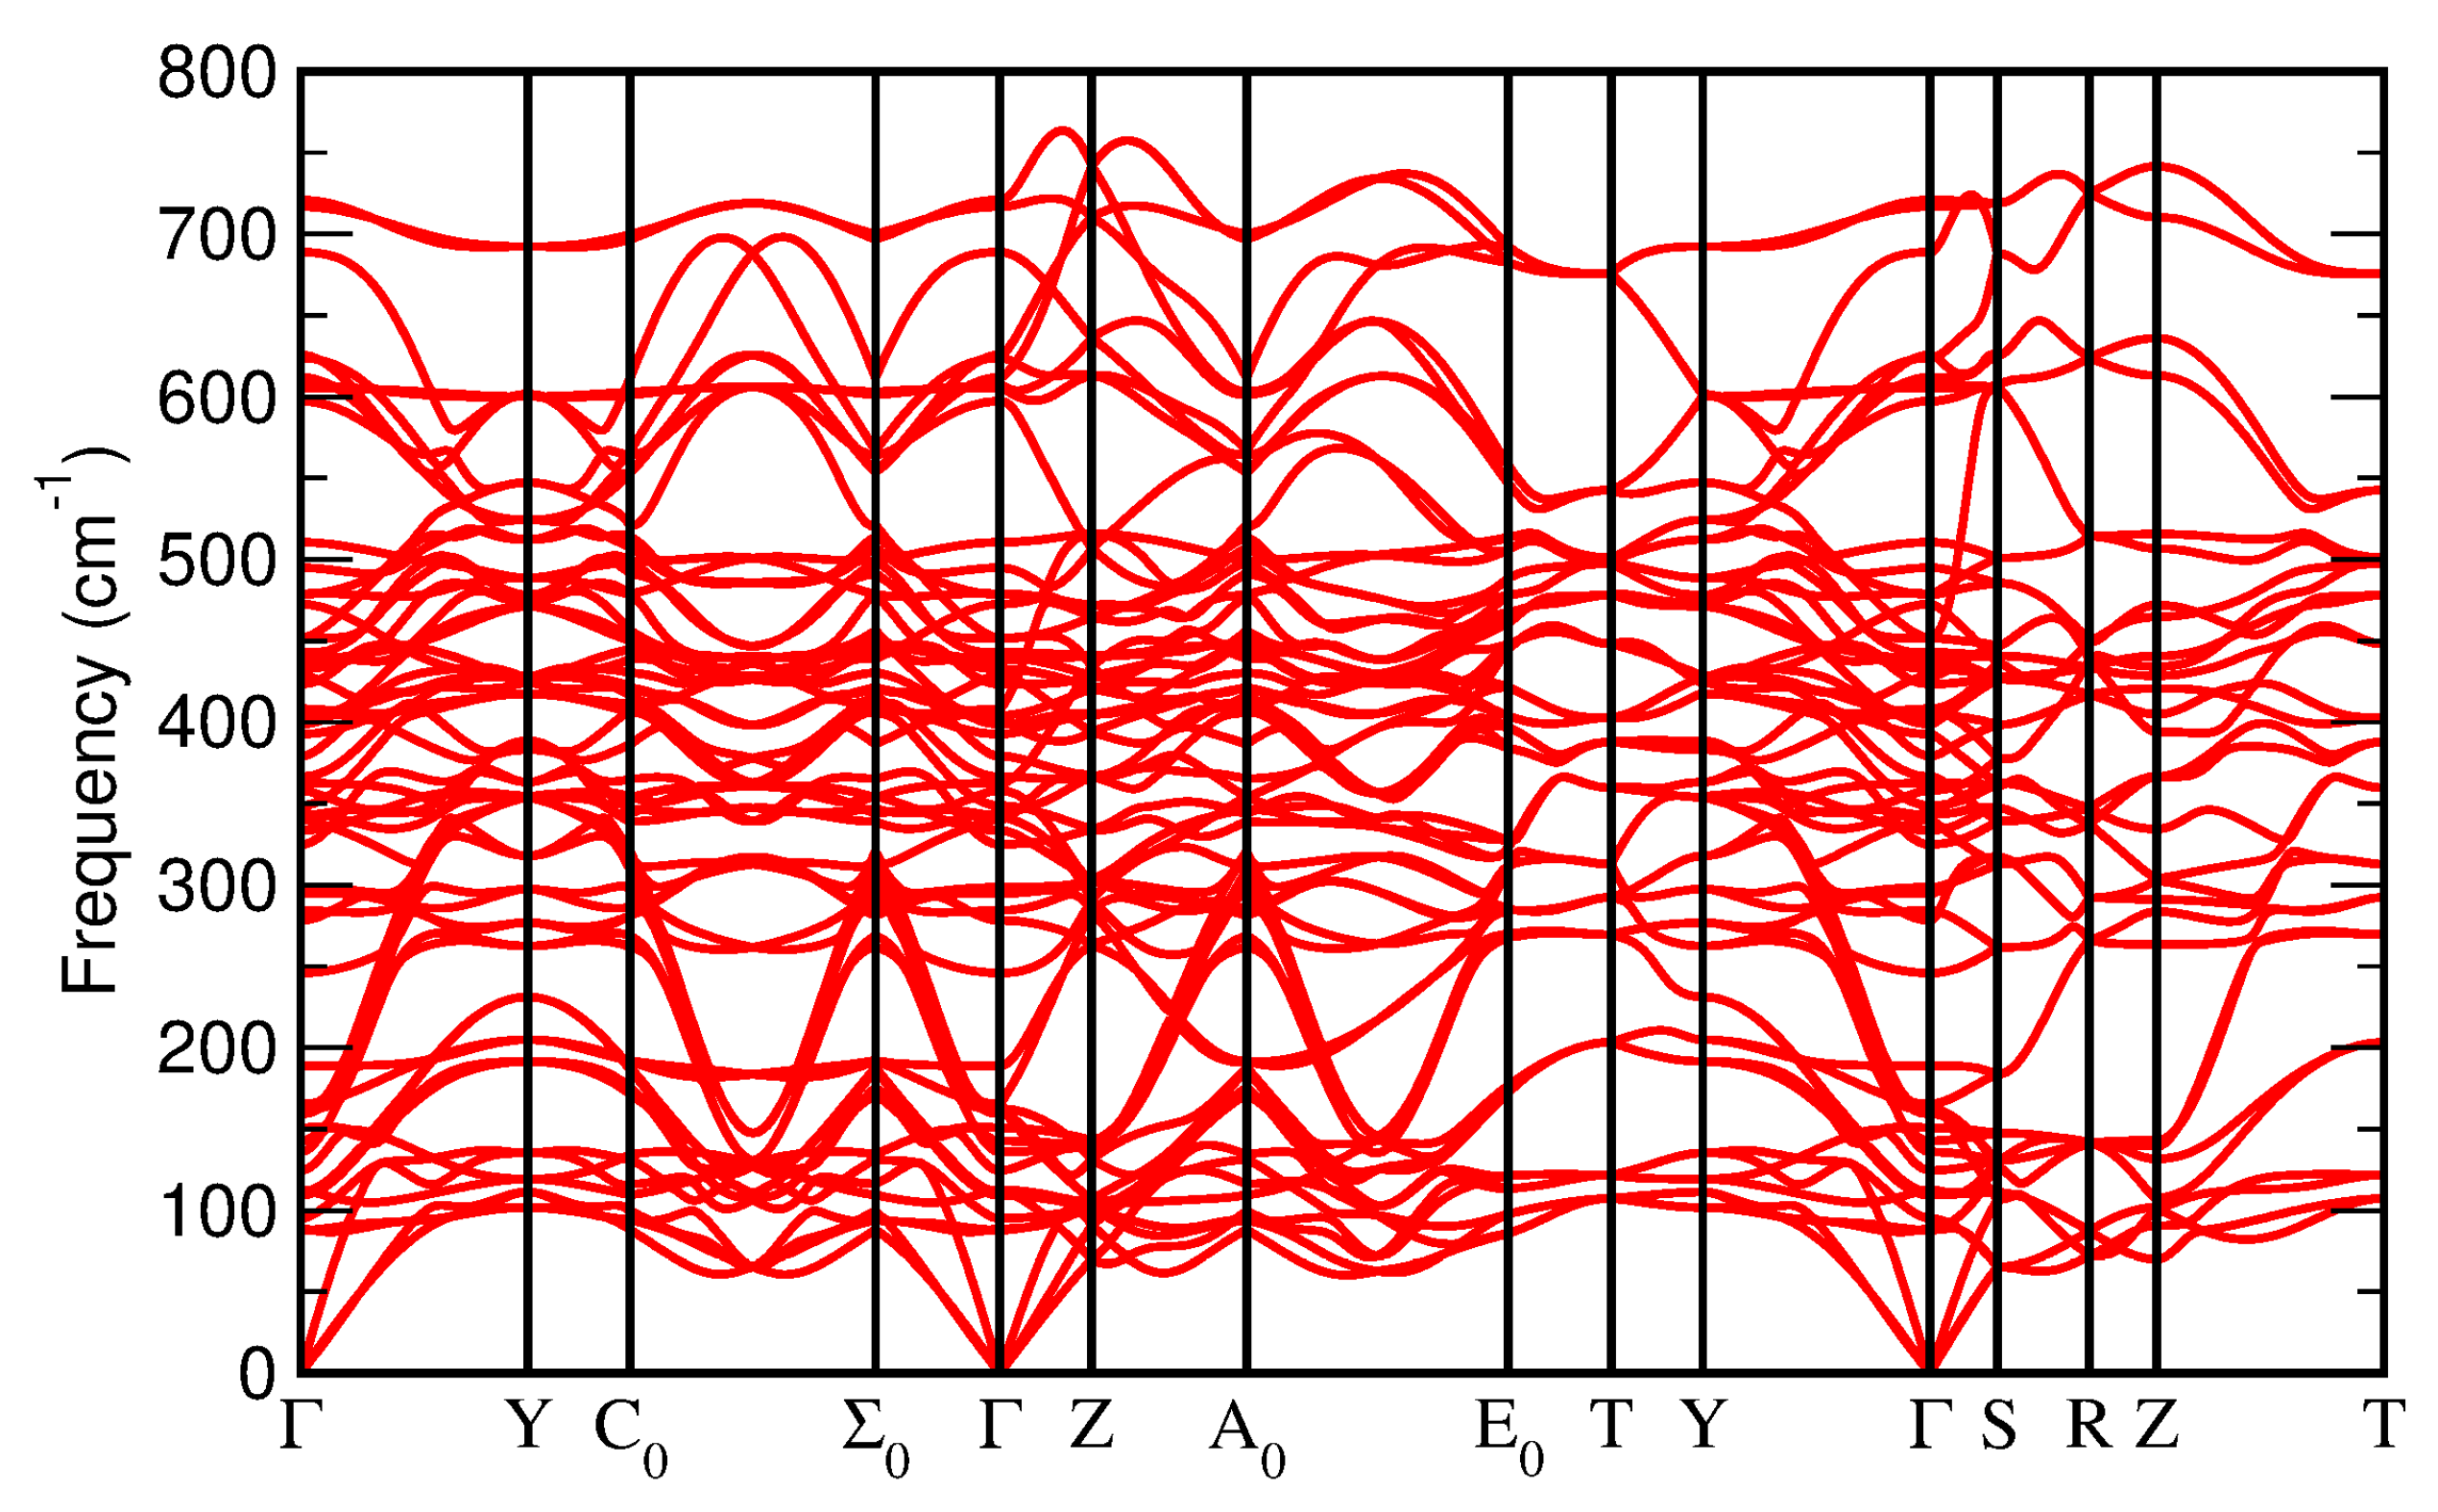
The recent experimental work of Bura et al. [11] shows that the DyScO perovskite has a large stability range, up to at least 40 GPa, which are the highest pressures for which experimental results on this compound exist. For this reason, up to now we have been concerned with the local stability of the perovskite phase of DyScO, the only one so far observed. However, other perovskites, like MgSiO, undergo a pressure-induced transition to a post-perovskite phase with a Cmcm-type structure [49,50,51]. We have performed simulations on this post-perovskite structure for DyScO (see Table 7) and our results show that this new phase has lower enthalpy above 14.4 GPa, see Figure 13. The study of the phonon dispersion curves at 15 GPa (Figure 14) shows that this phase is also dynamically stable. The existence of large kinetic barriers (and the enhanced local stability of the perovskite phase) might explain why this high-pressure phase was not observed in the experimental study of Ref. [11], but more experimental work, involving heating at high pressure to overcome barriers, would be needed to test this hypothesis. In the Supplementary Material we provide some extra results for this proposed high-pressure phase of DyScO, but its full study will not be pursued here.
3.5. Summary and Conclusions
We have performed an ab initio study of DySCO perovskite both at ambient and under hydrostatic pressure up to just above 60 GPa. We have analyzed the evolution of its structural, dynamic, and elastic properties. The calculated lattice parameters compare well with experimental values up to 10–15 GPa, above which pressures the experiments are probably affected by the loss of hydrostatic conditions of the pressure transmitting medium. The equation of state, the evolution of interatomic distances with pressure, and the compressibility were calculated. The DyO polyhedra account for most of the volume reduction under compression. The phDOS and partial phDOS were analyzed to determine the contribution of each atomic species to the vibrational spectrum. The evolution of all the Raman, infrared and silent phonon modes was obtained along with their corresponding Grüneisen parameters. At about 63 GPa, imaginary frequencies appear around the X point of the Brillouin zone and therefore the structure becomes dynamically unstable. The elastic constants and the elastic stiffness coefficients were also determined. This allowed us to study the major elastic moduli (B, G, E, ). The value of the B/G ratio points out that this material is ductile and that its ductility increases under pressure. Above 60 GPa the phase becomes mechanically unstable. We have also considered the possibility of a high-pressure post-perovskite phase with Cmcm symmetry. Our calculations suggest that it is favored over the perovskite phase above 14.4 GPa, which is a pressure within the range of observation of the perovskite phase and well below its predicted local (i.e., dynamical and elastic) instabilities. This prediction should thus entice further experimental and theoretical studies on DyScO.
Supplementary Materials
The following supporting information can be downloaded at: https://0-www-mdpi-com.brum.beds.ac.uk/article/10.3390/cryst13020165/s1, Figure S1. Variation of the lattice parameters a, b, c with pressure for the proposed Cmcm phase. Table S1. Elastic moduli B, E and G; ratio; and Poisson´s ratio for the proposed Cmcm phase., calculated using the Voigt, Reuss, and Hill approximations from the calculated elastic coefficients at 15 GPa. Figure S2. Calculated pressure evolution of the elastic stiffness coefficients for the proposed Cmcm phase. Figure S3. M generalized stability criteria as a function of pressure for the proposed Cmcm phase. Figure S4. Pressure dependence of the calculated Raman-active modes of the Cmcm phase. Figure S5. Pressure dependence of the calculated infrared modes of the Cmcm phase. Figure S6. Pressure dependence of the calculated silent modes of the Cmcm phase. Table S2. Calculated Raman (R), infrared (IR), and silent (S) mode frequencies for the proposed Cmcm phase as calculated in this work, and their respective pressure coefficients obtained by fitting in the range up to 60 GPa with a cuadratic equation . Figure S7. Phonon dispersion curves at 65.7 GPa for the proposed Cmcm phase.
Author Contributions
All authors contributed to this work doing simulations, analysis, interpretation of results, and/or manuscript writing. All authors have read and agreed to the published version of the manuscript.
Funding
This research was funded by the Spanish Research Agency (AEI) and the Spanish Ministry of Science and Investigation (MCIN) under grant PID2019-106383GB-43 (DOI: 10.13039/501100011033) and RED2018-102612-T (MALTA Consolider-Team Network).
Data Availability Statement
All relevant data that support the findings of this study are available from the corresponding author upon request.
Conflicts of Interest
The authors declare no conflict of interest. The funders had no role in the design of the study; in the collection, analyses, or interpretation of data; in the writing of the manuscript; or in the decision to publish the results.
References
- Coh, S.; Heeg, T.; Haeni, J.H.; Biegalski, M.D.; Lettieri, J.; Edge, L.F.; O’Brien, K.E.; Bernhagen, M.; Reiche, P.; Uecker, R.; et al. Si-compatible candidates for high-κ dielectrics with the Pbnm perovskite structure. Phys. Rev. B 2010, 82, 064101. [Google Scholar] [CrossRef] [Green Version]
- Schlom, D.G.; Haeni, J.H. A Thermodynamic Approach to Selecting Alternative Gate Dielectrics. MRS Bull. 2002, 27, 198–204. [Google Scholar] [CrossRef]
- Christen, H.M.; Jellison, G.E.; Ohkubo, I.; Huang, S.; Reeves, M.E.; Cicerrella, E.; Freeouf, J.L.; Jia, Y.; Schlom, D.G. Dielectric and optical properties of epitaxial rare-earth scandate films and their crystallization behavior. Appl. Phys. Lett. 2006, 88, 262906. [Google Scholar] [CrossRef]
- Haeni, J.H.; Irvin, P.; Chang, W.; Uecker, R.; Reiche, P.; Li, Y.L.; Choudhury, S.; Tian, W.; Hawley, M.E.; Craigo, B.; et al. Room-temperature ferroelectricity in strained SrTiO3. Nature 2004, 430, 4. [Google Scholar] [CrossRef] [Green Version]
- Choi, K.J.; Biegalski, M.; Li, Y.L.; Sharan, A.; Schubert, J.; Uecker, R.; Reiche, P.; Chen, Y.B.; Pan, X.Q.; Gopalan, V.; et al. Enhancement of Ferroelectricity in Strained BaTiO3 Thin Films. Science 2004, 306, 1005–1009. [Google Scholar] [CrossRef] [PubMed] [Green Version]
- Biegalski, M.D.; Haeni, J.H.; Trolier-McKinstry, S.; Schlom, D.G.; Brandle, C.D.; Graitis, A.J.V. Thermal expansion of the new perovskite substrates DyScO3 and GdScO3. J. Mater. Res. 2005, 20, 952–958. [Google Scholar] [CrossRef]
- Vasudevarao, A.; Kumar, A.; Tian, L.; Haeni, J.H.; Li, Y.L.; Eklund, C.J.; Jia, Q.X.; Uecker, R.; Reiche, P.; Rabe, K.M.; et al. Multiferroic Domain Dynamics in Strained Strontium Titanate. Phys. Rev. Lett. 2006, 97, 257602. [Google Scholar] [CrossRef] [Green Version]
- Catalan, G.; Janssens, A.; Rispens, G.; Csiszar, S.; Seeck, O.; Rijnders, G.; Blank, D.H.A.; Noheda, B. Polar Domains in Lead Titanate Films under Tensile Strain. Phys. Rev. Lett. 2006, 96, 127602. [Google Scholar] [CrossRef] [Green Version]
- Wördenweber, R.; Hollmann, E.; Kutzner, R.; Schubert, J. Induced ferroelectricity in strained epitaxial SrTiO3 films on various substrates. J. Appl. Phys. 2007, 102, 044119. [Google Scholar] [CrossRef] [Green Version]
- Kužel, P.; Kadlec, F.; Petzelt, J.; Schubert, J.; Panaitov, G. Highly tunable SrTiO3/DyScO3 heterostructures for applications in the terahertz range. Appl. Phys. Lett. 2007, 91, 232911. [Google Scholar] [CrossRef]
- Bura, N.; Srihari, V.; Bhoriya, A.; Yadav, D.; Singh, J.; Poswal, H.K.; Dilawar Sharma, N. Structural stability of orthorhombic DyScO3 under extreme conditions of pressure and temperature. Phys. Rev. B 2022, 106, 024113. [Google Scholar] [CrossRef]
- Hohenberg, P.; Kohn, W. Inhomogeneous Electron Gas. Phys. Rev. 1964, 136, B864–B871. [Google Scholar] [CrossRef] [Green Version]
- Kohn, W.; Sham, L.J. Self-Consistent Equations Including Exchange and Correlation Effects. Phys. Rev. 1965, 140, A1133–A1138. [Google Scholar] [CrossRef] [Green Version]
- Blöchl, P.E. Projector augmented-wave method. Phys. Rev. B 1994, 50, 17953–17979. [Google Scholar] [CrossRef] [PubMed] [Green Version]
- Kresse, G.; Joubert, D. From ultrasoft pseudopotentials to the projector augmented-wave method. Phys. Rev. B 1999, 59, 1758–1775. [Google Scholar] [CrossRef]
- Kresse, G.; Hafner, J. Ab Initio molecular dynamics for liquid metals. Phys. Rev. B 1993, 47, 558–561. [Google Scholar] [CrossRef] [PubMed]
- Kresse, G.; Hafner, J. Ab Initio molecular-dynamics simulation of the liquid-metal–amorphous-semiconductor transition in germanium. Phys. Rev. B 1994, 49, 14251–14269. [Google Scholar] [CrossRef] [PubMed]
- Kresse, G.; Furthmüller, J. Efficiency of ab-initio total energy calculations for metals and semiconductors using a plane-wave basis set. Comput. Mater. Sci. 1996, 6, 15–50. [Google Scholar] [CrossRef]
- Kresse, G.; Furthmüller, J. Efficient iterative schemes for Ab Initio Total-Energy Calc. Using A Plane-Wave Basis Set. Phys. Rev. B 1996, 54, 11169–11186. [Google Scholar] [CrossRef] [PubMed]
- Monkhorst, H.J.; Pack, J.D. Special points for Brillouin-zone integrations. Phys. Rev. B 1976, 13, 5188–5192. [Google Scholar] [CrossRef]
- Perdew, J.P.; Burke, K.; Ernzerhof, M. Generalized Gradient Approximation Made Simple. Phys. Rev. Lett. 1996, 77, 3865–3868. [Google Scholar] [CrossRef] [Green Version]
- Grimme, S.; Antony, J.; Ehrlich, S.; Krieg, H. A consistent and accurate Ab Initio Parametr. Density Funct. Dispers. Correct. (DFT-D) 94 Elem. H-Pu. J. Chem. Phys. 2010, 132, 154104. [Google Scholar] [CrossRef] [PubMed] [Green Version]
- Togo, A.; Tanaka, I. First principles phonon calculations in materials science. Scr. Mater. 2015, 108, 1–5. [Google Scholar] [CrossRef] [Green Version]
- Le Page, Y.; Saxe, P. Symmetry-general least-squares extraction of elastic data for strained materials from Ab Initio Calc. Stress. Phys. Rev. B 2002, 65, 104104. [Google Scholar] [CrossRef]
- Veličkov, B.; Kahlenberg, V.; Bertram, R.; Bernhagen, M. Crystal chemistry of GdScO3, DyScO3, SmScO3 and NdScO3. Z. Für Krist. 2007, 222, 466–473. [Google Scholar] [CrossRef]
- Celeste, A.; Borondics, F.; Capitani, F. Hydrostaticity of pressure-transmitting media for high pressure infrared spectroscopy. High Press. Res. 2019, 39, 608–618. [Google Scholar] [CrossRef]
- Birch, F. Finite Elastic Strain of Cubic Crystals. Phys. Rev. 1947, 71, 809–824. [Google Scholar] [CrossRef]
- Jain, A.; Ong, S.P.; Hautier, G.; Chen, W.; Richards, W.D.; Dacek, S.; Cholia, S.; Gunter, D.; Skinner, D.; Ceder, G.; et al. Commentary: The Materials Project: A materials genome approach to accelerating materials innovation. APL Mater. 2013, 1, 011002. [Google Scholar] [CrossRef] [Green Version]
- Materials Data on DyScO3 by Materials Project. Type: Dataset. 2020. Available online: https://materialsproject.org/materials/mp-31120 (accessed on 15 December 2022).
- Schmidbauer, M.; Kwasniewski, A.; Schwarzkopf, J. High-precision absolute lattice parameter determination of SrTiO3, DyScO3 and NdGaO3 single crystals. Acta Crystallogr. B Struct. Sci. 2012, 68, 8–14. [Google Scholar] [CrossRef]
- Glazer, A.M. Simple ways of determining perovskite structures. Acta Cryst. A 1975, 31, 756–762. [Google Scholar] [CrossRef]
- Zhao, Y.; Weidner, D.J.; Parise, J.B.; Cox, D.E. Thermal expansion and structural distortion of perovskite—Data for NaMgF3 perovskite. Part I. Phys. Earth Planet. Inter. 1993, 76, 1–16. [Google Scholar] [CrossRef]
- Zhao, Y.; Weidner, D.J.; Parise, J.B.; Cox, D.E. Critical phenomena and phase transition of perovskite—Data for NaMgF3 perovskite. Part II. Phys. Earth Planet. Inter. 1993, 76, 17–34. [Google Scholar] [CrossRef]
- Martin, C.D.; Parise, J.B. Structure constraints and instability leading to the post-perovskite phase transition of MgSiO3. Earth Planet. Sci. Lett. 2008, 265, 630–640. [Google Scholar] [CrossRef]
- Liferovich, R.P.; Mitchell, R.H. A structural study of ternary lanthanide orthoscandate perovskites. J. Solid State Chem. 2004, 177, 2188–2197. [Google Scholar] [CrossRef]
- Nye, J.F. Physical Properties of Crystals: Their Representation by Tensors and Matrices; Clarendon Press: Oxford, NY, USA; Oxford University Press: Oxford, NY, USA, 1984. [Google Scholar]
- Janovská, M.; Sedlák, P.; Seiner, H.; Landa, M.; Marton, P.; Ondrejkovič, P.; Hlinka, J. Anisotropic elasticity of DyScO3 substrates. J. Phys. Condens. Matter 2012, 24, 385404. [Google Scholar] [CrossRef] [PubMed]
- Born, M.; Huang, K. Dynamical Theory of Crystal Lattices; Oxford Classic Texts in the Physical Sciences; Clarendon Press: Oxford, NY, USA; Oxford University Press: Oxford, NY, USA, 1954. [Google Scholar]
- Mouhat, F.; Coudert, F.X. Necessary and sufficient elastic stability conditions in various crystal systems. Phys. Rev. B 2014, 90, 224104. [Google Scholar] [CrossRef] [Green Version]
- Wallace, D.C. Pressure-Volume Variables, Stress-Strain Variables & Wave Propagation. In Thermodynamics of Crystals; Dover Publications: Mineola, NY, USA, 1998. [Google Scholar]
- Grimvall, G.; Magyari-Köpe, B.; Ozoliņš, V.; Persson, K.A. Lattice instabilities in metallic elements. Rev. Mod. Phys. 2012, 84, 945–986. [Google Scholar] [CrossRef] [Green Version]
- Ravindran, P.; Fast, L.; Korzhavyi, P.A.; Johansson, B.; Wills, J.; Eriksson, O. Density functional theory for calculation of elastic properties of orthorhombic crystals: Application to TiSi2. J. Appl. Phys. 1998, 84, 4891–4904. [Google Scholar] [CrossRef]
- Voigt, W. Lehrbuch der Kristallphysik (mit Ausschluss der Kristalloptik); B.G. Teubner: Leipzig/Berlin, Germany, 1928. [Google Scholar]
- Reuss, A. Berechnung der Fließgrenze von Mischkristallen auf Grund der Plastizitätsbedingung für Einkristalle. Z. Angew. Math. Mech. 1929, 9, 49–58. [Google Scholar] [CrossRef]
- Hill, R. The Elastic Behaviour of a Crystalline Aggregate. Proc. Phys. Soc. A 1952, 65, 349–354. [Google Scholar] [CrossRef]
- Pugh, S. XCII. Relations between the elastic moduli and the plastic properties of polycrystalline pure metals. Lond. Edinb. Dublin Philos. Mag. J. Sci. 1954, 45, 823–843. [Google Scholar] [CrossRef]
- Wallace, D.C. Thermoelasticity of Stressed Materials and Comparison of Various Elastic Constants. Phys. Rev. 1967, 162, 776–789. [Google Scholar] [CrossRef]
- Delugas, P.; Fiorentini, V.; Filippetti, A.; Pourtois, G. Cation charge anomalies and high-κ dielectric behavior in DyScO3: Ab Initio Density-Functional and self-interaction-corrected calculations. Phys. Rev. B 2007, 75, 115126. [Google Scholar] [CrossRef]
- Murakami, M.; Hirose, K.; Kawamura, K.; Sata, N.; Ohishi, Y. Post-Perovskite Phase Transition in MgSiO3. Science 2004, 304, 855–858. [Google Scholar] [CrossRef] [PubMed] [Green Version]
- Oganov, A.R.; Ono, S. Theoretical and experimental evidence for a post-perovskite phase of MgSiO3 in Earth’s Dїayer. Nature 2004, 430, 445–448. [Google Scholar] [CrossRef] [Green Version]
- Tsuchiya, T.; Tsuchiya, J.; Umemoto, K.; Wentzcovitch, R.M. Phase transition in MgSiO3 perovskite in the earth’s lower mantle. Earth Planet. Sci. Lett. 2004, 224, 241–248. [Google Scholar] [CrossRef]
Figure 1.
The structure of DyScO is of the orthorhombic perovskite type. In this plot the ScO6 octahedra of the structure are shown in magenta, with oxygen sites (in red) at their corners and Sc sites at the centers. The Dy cation sites are shown in blue.
Figure 1.
The structure of DyScO is of the orthorhombic perovskite type. In this plot the ScO6 octahedra of the structure are shown in magenta, with oxygen sites (in red) at their corners and Sc sites at the centers. The Dy cation sites are shown in blue.

Figure 2.
(left) Variation of the lattice parameters a, b, c of DyScO perovskite with pressure. (right) Variation of the unit cell volume with pressure. In both panels, the curves represent our calculated values and the symbols represent the experimental values from Ref. [11].
Figure 2.
(left) Variation of the lattice parameters a, b, c of DyScO perovskite with pressure. (right) Variation of the unit cell volume with pressure. In both panels, the curves represent our calculated values and the symbols represent the experimental values from Ref. [11].

Figure 3.
(left) Evolution of the internal parameters of the 4c Wickoff positions of Dy with pressure. (The values for the ideal cubic perovskite are ½, ½) (right) Tilt angles change with pressure.
Figure 3.
(left) Evolution of the internal parameters of the 4c Wickoff positions of Dy with pressure. (The values for the ideal cubic perovskite are ½, ½) (right) Tilt angles change with pressure.

Figure 4.
Evolution of interatomic distances with pressure in DyScO perovskite. The O1-Sc1, O2-Sc1, and Dy1-O2 distances have all a multiplicity of two (each represented curve corresponds to two symmetrically equivalent but different bonds).
Figure 4.
Evolution of interatomic distances with pressure in DyScO perovskite. The O1-Sc1, O2-Sc1, and Dy1-O2 distances have all a multiplicity of two (each represented curve corresponds to two symmetrically equivalent but different bonds).

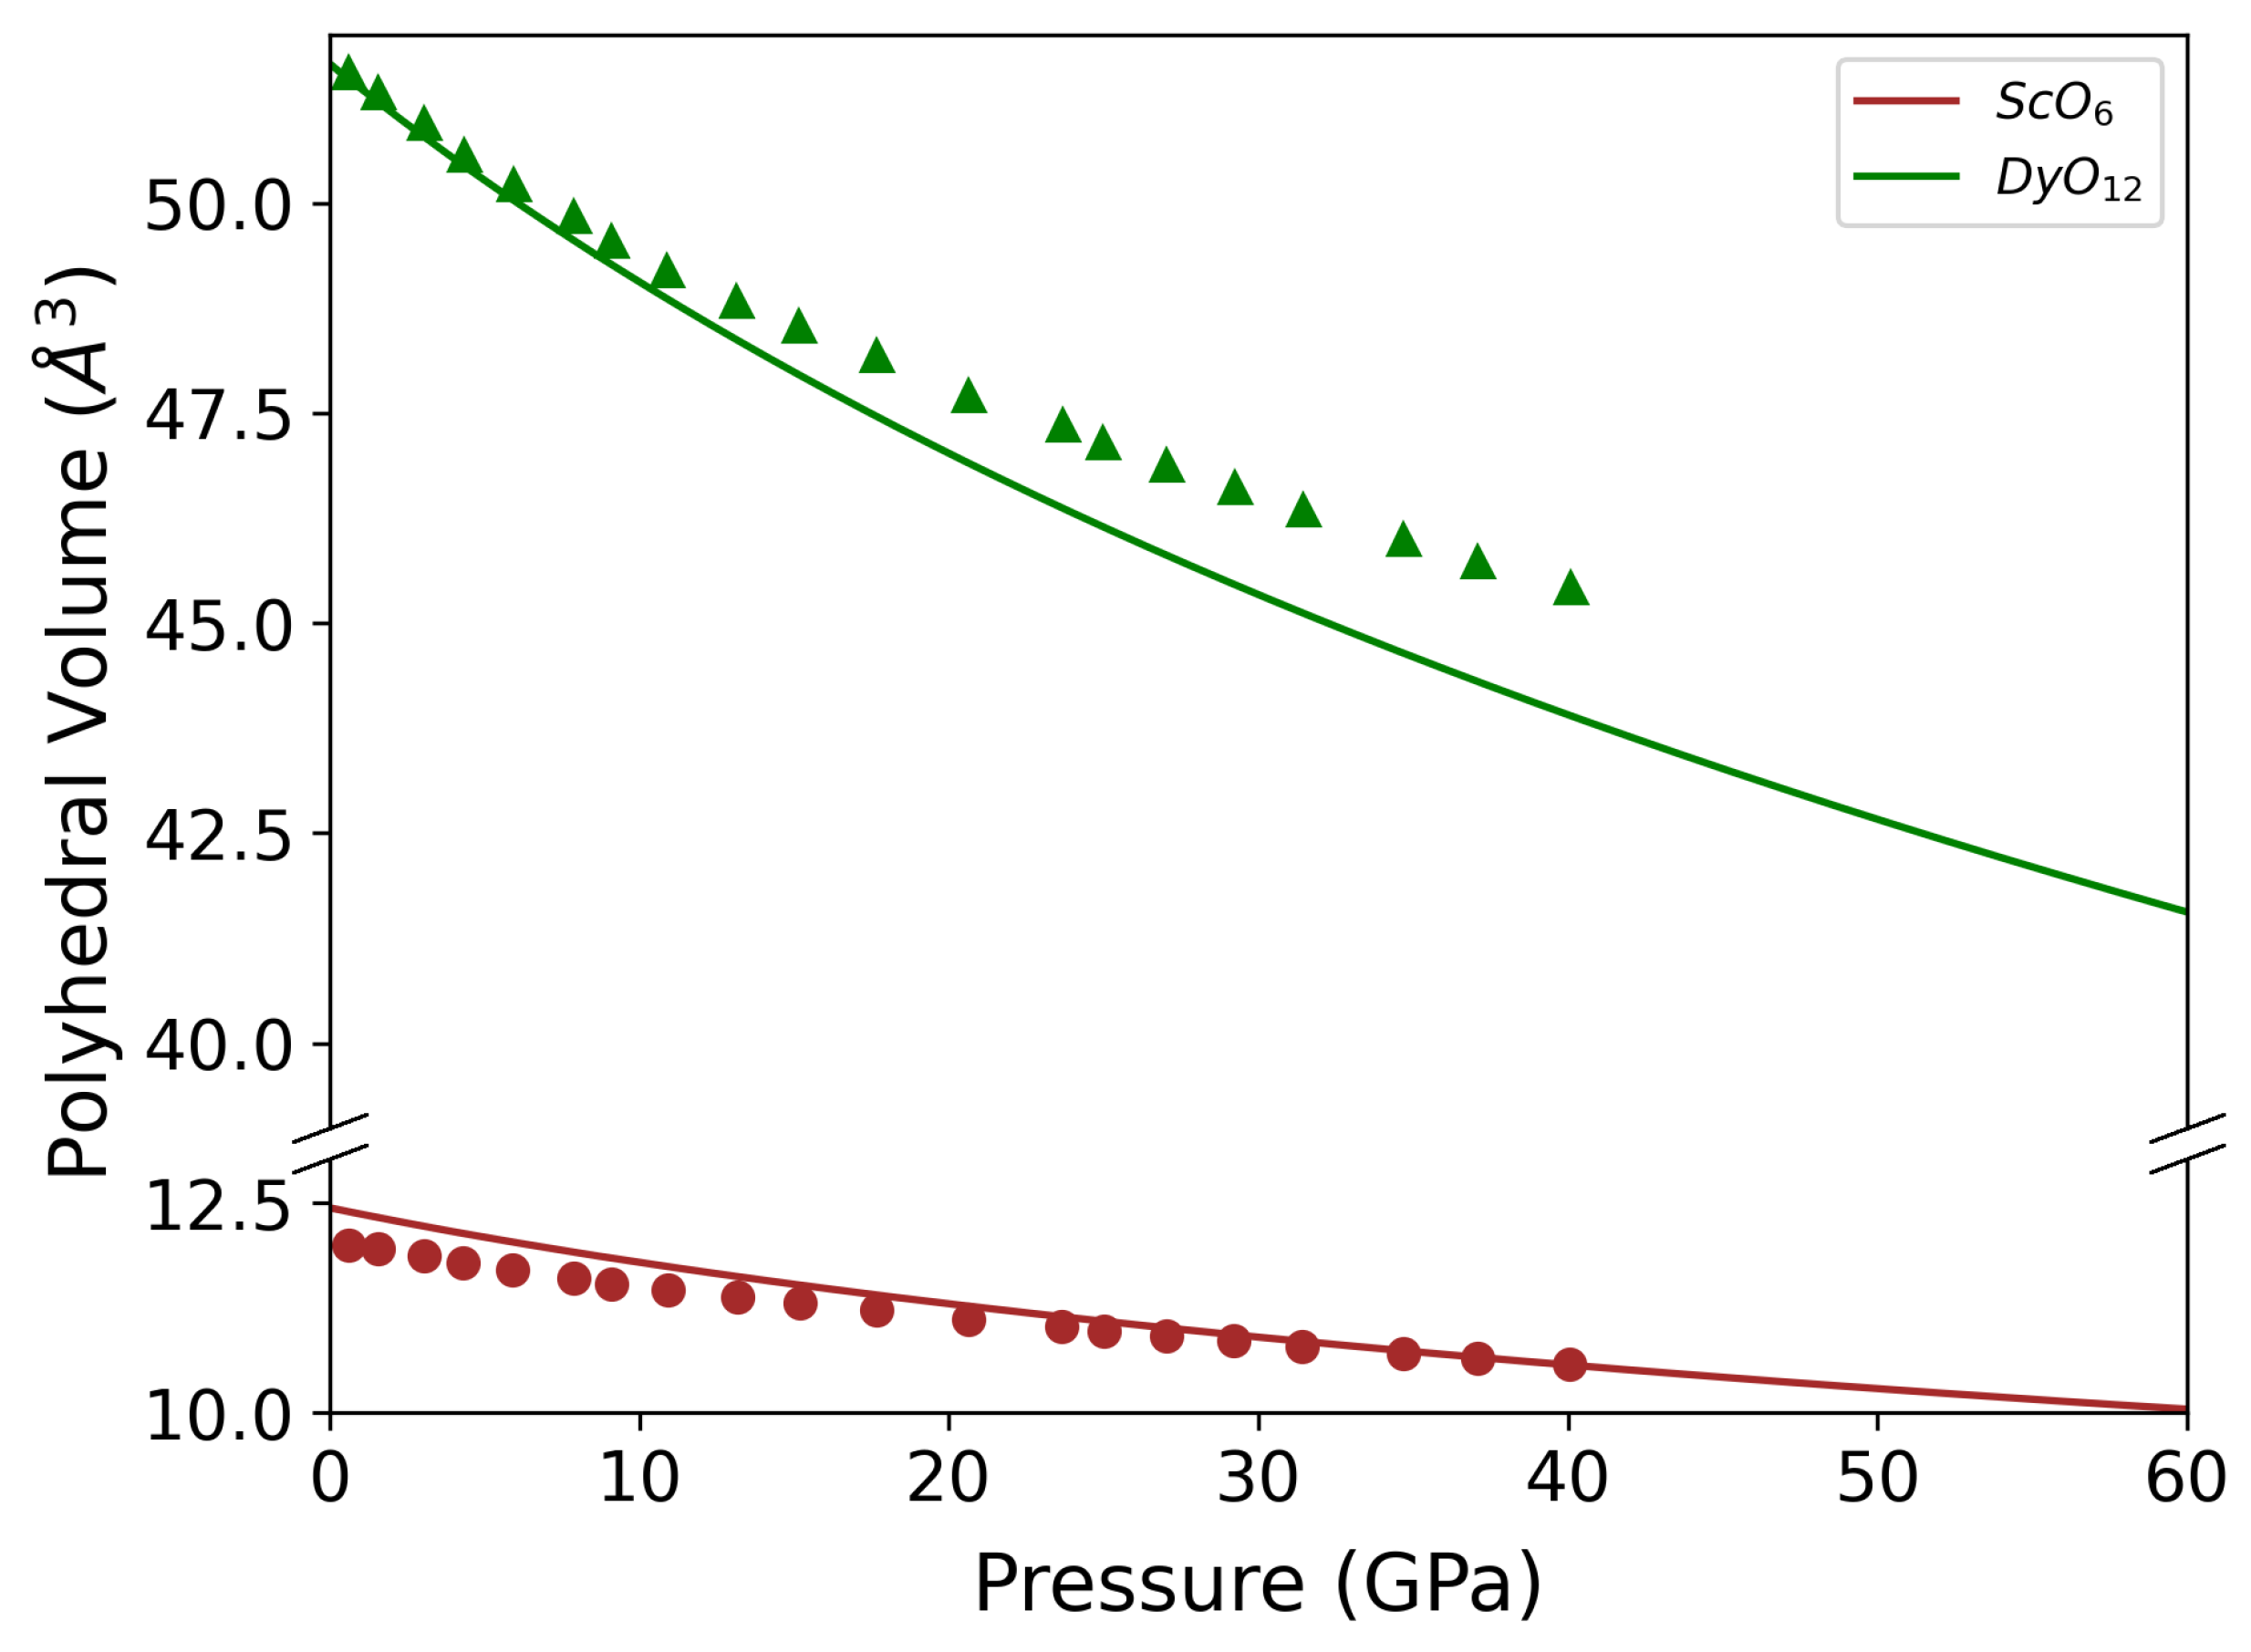
Figure 5.
Variation of the polyhedral volumes of DyScO perovskite with pressure. Solid curves represent the calculated values and symbols represent the experimental values from Ref. [11].
Figure 5.
Variation of the polyhedral volumes of DyScO perovskite with pressure. Solid curves represent the calculated values and symbols represent the experimental values from Ref. [11].

Figure 6.
Calculated pressure evolution of the elastic stiffness coefficients of DyScO perovskite.

Figure 7.
Pressure evolution of the elastic moduli: bulk modulus B, Young modulus E, and Shear modulus G of DyScO perovskite. The blue line represents the moduli in the Voigt approximation, the green line in the Reuss approximation, and the red one in the Hill approximation.
Figure 7.
Pressure evolution of the elastic moduli: bulk modulus B, Young modulus E, and Shear modulus G of DyScO perovskite. The blue line represents the moduli in the Voigt approximation, the green line in the Reuss approximation, and the red one in the Hill approximation.

Figure 8.
(left) Pressure evolution of the B/G ratio of DyScO perovskite. (right) Pressure evolution of the Poisson´s ratio. The blue line represents the moduli in the Voigt approximation, the green line in the Reuss approximation, and the red one in the Hill approximation.
Figure 8.
(left) Pressure evolution of the B/G ratio of DyScO perovskite. (right) Pressure evolution of the Poisson´s ratio. The blue line represents the moduli in the Voigt approximation, the green line in the Reuss approximation, and the red one in the Hill approximation.

Figure 9.
Generalized stability criteria as a function of pressure for DyScO perovskite.

Figure 10.
(left) Pressure dependence of the calculated Raman-active modes of DyScO perovskite; (right) idem for the infrared and silent modes.
Figure 10.
(left) Pressure dependence of the calculated Raman-active modes of DyScO perovskite; (right) idem for the infrared and silent modes.

Figure 11.
(left) Phonon dispersion curves of DyScO perovskite at ambient pressure and (right) at 66 GPa.
Figure 11.
(left) Phonon dispersion curves of DyScO perovskite at ambient pressure and (right) at 66 GPa.

Figure 12.
Total phonon density of states and contribution per species, as calculated at ambient pressure for DyScO perovskite.
Figure 12.
Total phonon density of states and contribution per species, as calculated at ambient pressure for DyScO perovskite.

Figure 13.
Energy-volume curves and (inset) enthalpy-presssure curves for the Pbnm (perovskite) and Cmcm (post-perovskite) phases of DyScO (black and blue curves, respectively). The enthalpies are given with respect to that of the perovskite phase.
Figure 13.
Energy-volume curves and (inset) enthalpy-presssure curves for the Pbnm (perovskite) and Cmcm (post-perovskite) phases of DyScO (black and blue curves, respectively). The enthalpies are given with respect to that of the perovskite phase.

Figure 14.
Calculated phonon dispersion curves of the Cmcm phase at 15 GPa.


Table 1.
Calculated and experimental lattice parameters and unit cell volume at 0 GPa. Also provided are the calculated values at 60 GPa, for reference.
Table 1.
Calculated and experimental lattice parameters and unit cell volume at 0 GPa. Also provided are the calculated values at 60 GPa, for reference.
| This Work 0 GPa | Experiment Ref. [25] | Experiment Ref. [30] | This Work 60 GPa | |
|---|---|---|---|---|
| a (Å) | 5.421 | 5.443 (2) | 5.442417 (54) | 4.944 |
| b (Å) | 5.735 | 5.717 (2) | 5.719357 (52) | 5.484 |
| c (Å) | 7.935 | 7.901 (2) | 7.904326 (98) | 7.266 |
| V (Å) | 246.68 | 245.9 (1) | 246.04 | 197.00 |
Table 2.
Comparison of the calculated and experimental unit cell volume, bulk modulus, and pressure derivative of the bulk modulus at zero pressure.
Table 2.
Comparison of the calculated and experimental unit cell volume, bulk modulus, and pressure derivative of the bulk modulus at zero pressure.
| This work | 246.7 | 164.7 | 4.42 |
| Experiment Ref. [11] | 245.3 | 189.4 | 7.68 |
Table 3.
Summary of the atomic sites of DyScO perovskite, showing the values of the internal parameters and tilt angles. The values for the ideal cubic perovskite structure are also provided, for reference.
Table 3.
Summary of the atomic sites of DyScO perovskite, showing the values of the internal parameters and tilt angles. The values for the ideal cubic perovskite structure are also provided, for reference.
| Ideal Cubic Perovskite | This Work 0 GPa | This Work 60 GPa | Exp. Ref. [25] | ||
|---|---|---|---|---|---|
| Wyckoff positions | |||||
| Dy: 4c (u, v, ¼) | u | ½ | 0.4788 | 0.4733 | 0.48262(5) |
| v | ½ | 0.4350 | 0.4165 | 0.43844(5) | |
| Sc: 4b (½, 0, 0) | |||||
| O1: 4c (u, v, ¼) | u | ½ | 0.6313 | 0.6312 | 0.6261(1) |
| v | 0 | 0.0562 | 0.0464 | 0.0560(2) | |
| O2: 8d (u, v, w) | u | ¼ | 0.1906 | 0.1717 | 0.1885(5) |
| v | ¼ | 0.1936 | 0.1863 | 0.1937(6) | |
| w | 0 | 0.0684 | 0.0622 | 0.0658(6) | |
| Tilt angles | |||||
| in [110] | 0 | 21.26 | 19.10 | 21.00 | |
| in [001] | 0 | 13.39 | 17.00 | 13.23 |
Table 4.
Elastic constants (in GPa) of DyScO perovskite at 0 GPa. (The Pbnm setting is used.)
| This Work | Experiment Ref. [37] | Theory Ref. [37] | |
|---|---|---|---|
| 281 | 302.4 | 310 | |
| 332 | 345.3 | 339 | |
| 213 | 254.6 | 236 | |
| 100 | 103.9 | 96 | |
| 76 | 86.0 | 73 | |
| 81 | 84.4 | 77 | |
| 121 | 124.4 | 96 | |
| 105 | 130.0 | 132 | |
| 119 | 132.5 | 106 |
Table 5.
Elastic moduli , and ; ratio; and Poisson´s ratio , calculated using the Voigt, Reuss, and Hill approximations from the calculated elastic coefficients at 0 GPa of DyScO perovskite.
Table 5.
Elastic moduli , and ; ratio; and Poisson´s ratio , calculated using the Voigt, Reuss, and Hill approximations from the calculated elastic coefficients at 0 GPa of DyScO perovskite.
| Voigt | Reuss | Hill | |
|---|---|---|---|
| Bulk modulus (GPa) | 168.4 | 161.5 | 164.9 |
| Shear modulus (GPa) | 83.3 | 80.9 | 82.1 |
| Young modulus (GPa) | 214.5 | 207.9 | 211.2 |
| Poisson´s ratio | 0.288 | 0.285 | 0.286 |
| Bulk/Shear ratio | 2.02 | 2.00 | 2.01 |
Table 6.
Raman (R), infrared (IR), and silent (S) mode frequencies as calculated in this work for DyScO perovskite, and their respective pressure coefficients obtained by fitting in the range up to 15 GPa with a linear equation . Mode Grüneisen parameters () are also provided using the calculated bulk modulus (164.7 GPa). Experimental values from Ref. [11], where available, are given in parenthesis.
| Mode (R) | (cm) | (cm GPa) | |
|---|---|---|---|
| A | 107.6 | 0.91 | 1.39 |
| 122.3 | 1.46 | 1.96 | |
| 246.6 (253.2) | 1.92 (1.48) | 1.28 (1.11) | |
| 319.2 (327.7) | 2.02 (1.59) | 1.04 (0.92) | |
| 433.6 | 3.05 | 1.16 | |
| 452.9 (458.3) | 3.28 (2.74) | 1.19 (1.13) | |
| 501.3 | 4.32 | 1.42 | |
| B | 108.7 | 1.34 | 2.03 |
| 215.4 (226.4) | 1.75 (1.62) | 1.34 (1.36) | |
| 373.3 (380.1) | 3.65 (2.90) | 1.61 (1.45) | |
| 484.2 (476) | 4.61 (2.50) | 1.57 (1.00) | |
| 590.8 | 5.42 | 1.51 | |
| B | 110.7 | 0.75 | 1.12 |
| 154.7 (157.4) | 1.30 (1.15) | 1.38 (1.38) | |
| 308.3 (308.7) | 1.65 (1.80) | 0.88 (1.10) | |
| 347.2 | 1.89 | 0.90 | |
| 464.1 | 3.11 | 1.10 | |
| 534.4 | 2.92 | 0.90 | |
| 651.2 | 3.83 | 0.97 | |
| B | 97.8 | 1.74 | 2.93 |
| 286.0 | 1.29 | 0.74 | |
| 441.5 (458.3) | 3.15 (2.74) | 1.17 (1.13) | |
| 459.8 | 5.66 | 2.03 | |
| 654.0 | 4.57 | 1.15 | |
| Mode (IR) | (cm) | (cm GPa) | |
| B | 107.2 | 0.73 | 1.12 |
| 166.2 | 1.58 | 1.56 | |
| 280.6 | 0.76 | 0.45 | |
| 294.0 | 2.68 | 1.50 | |
| 332.1 | 0.89 | 0.44 | |
| 372.2 | 3.71 | 1.64 | |
| 429.2 | 2.69 | 1.03 | |
| 495.7 | 3.49 | 1.16 | |
| 533.1 | 3.73 | 1.15 | |
| B | 112.2 | 2.41 | 3.53 |
| 181.6 | 0.33 | 0.30 | |
| 274.7 | 1.81 | 1.08 | |
| 337.7 | 1.89 | 0.92 | |
| 377.6 | 3.69 | 1.61 | |
| 457.9 | 5.19 | 1.87 | |
| 464.0 | 6.03 | 2.14 | |
| B | 92.3 | 0.66 | 1.18 |
| 193.4 | 2.02 | 1.72 | |
| 234.0 | 1.49 | 1.05 | |
| 281.7 | 1.37 | 0.80 | |
| 336.0 | 3.27 | 1.60 | |
| 363.5 | 2.39 | 1.08 | |
| 430.7 | 3.64 | 1.39 | |
| 490.2 | 4.58 | 1.54 | |
| 547.7 | 2.76 | 0.83 | |
| Mode (S) | (cm) | (cm GPa) | |
| A | 72.6 | 0.48 | 1.09 |
| 149.3 | 1.34 | 1.48 | |
| 212.5 | 0.91 | 0.70 | |
| 239.7 | 0.58 | 0.40 | |
| 326.5 | 1.90 | 0.96 | |
| 381.7 | 3.37 | 1.45 | |
| 421.7 | 7.31 | 2.85 | |
| 496.8 | 4.51 | 1.49 |
Table 7.
Crystallographic description of Cmcm at 15 GPa.
| Space Group and Lattice Parameters | Wyckoff Positions |
|---|---|
| No 63 - C 2/m 2/c 2/m (Cmcm) Å; Å; Å Å | Dy 4c (0.000, 0.756, 0.250) Sc 4b (0.000, 0.500, 0.000) O1 4c (0.000, 0.414, 0.250) O2 8f (0.000, 0.139, 0.063) |
Disclaimer/Publisher’s Note: The statements, opinions and data contained in all publications are solely those of the individual author(s) and contributor(s) and not of MDPI and/or the editor(s). MDPI and/or the editor(s) disclaim responsibility for any injury to people or property resulting from any ideas, methods, instructions or products referred to in the content. |
© 2023 by the authors. Licensee MDPI, Basel, Switzerland. This article is an open access article distributed under the terms and conditions of the Creative Commons Attribution (CC BY) license (https://creativecommons.org/licenses/by/4.0/).
Share and Cite
MDPI and ACS Style
Zanardi, E.; Radescu, S.; Mujica, A.; Rodríguez-Hernández, P.; Muñoz, A. Ab Initio Theoretical Study of DyScO3 at High Pressure. Crystals 2023, 13, 165. https://0-doi-org.brum.beds.ac.uk/10.3390/cryst13020165
AMA Style
Zanardi E, Radescu S, Mujica A, Rodríguez-Hernández P, Muñoz A. Ab Initio Theoretical Study of DyScO3 at High Pressure. Crystals. 2023; 13(2):165. https://0-doi-org.brum.beds.ac.uk/10.3390/cryst13020165
Chicago/Turabian StyleZanardi, Enrique, Silvana Radescu, Andrés Mujica, Plácida Rodríguez-Hernández, and Alfonso Muñoz. 2023. "Ab Initio Theoretical Study of DyScO3 at High Pressure" Crystals 13, no. 2: 165. https://0-doi-org.brum.beds.ac.uk/10.3390/cryst13020165
Note that from the first issue of 2016, this journal uses article numbers instead of page numbers. See further details here.