
Pressure-Induced Structural Phase Transition of Co-Doped SnO2 Nanocrystals
by
 and
and
Vinod Panchal
1,
Laura Pampillo
2,
Sergio Ferrari
2,
Vitaliy Bilovol
2,3,
Catalin Popescu
4 and
Daniel Errandonea
5,* 1
Department of Physics, Royal College, Mumbai 401107, India
2
Consejo Nacional de lnvestigaciones Científicas y Técnicas, Instituto de Tecnología y Ciencias de la Ingeniería “Hilario Fernández Long” (INTECIN), Universidad de Buenos Aires, Av. Paseo Colón 850, Ciudad Autónoma de Buenos Aires C1063ACV, Argentina
3
Academic Centre for Materials and Nanotechnology, AGH University of Science and Technology, Al. Mickiewicza 30, 30-059 Krakow, Poland
4
CELLS-ALBA Synchrotron Light Facility, Cerdanyola del Vallés, 08290 Barcelona, Spain
5
Departamento de Física Aplicada, Instituto de Ciencias de Materiales, MALTA Consolider Team, Universitat de Valencia, 46100 Valencia, Spain
*
Author to whom correspondence should be addressed.
Crystals 2023, 13(6), 900; https://0-doi-org.brum.beds.ac.uk/10.3390/cryst13060900
Submission received: 13 May 2023
/
Revised: 25 May 2023
/
Accepted: 30 May 2023
/
Published: 31 May 2023
(This article belongs to the Special Issue Pressure-Induced Phase Transformations (Volume II))
Abstract
:Co-doped SnO2 nanocrystals (with a particle size of 10 nm) with a tetragonal rutile-type (space group P42/mnm) structure have been investigated for their use in in situ high-pressure synchrotron angle dispersive powder X-ray diffraction up to 20.9 GPa and at an ambient temperature. An analysis of experimental results based on Rietveld refinements suggests that rutile-type Co-doped SnO2 undergoes a structural phase transition at 14.2 GPa to an orthorhombic CaCl2-type phase (space group Pnnm), with no phase coexistence during the phase transition. No further phase transition is observed until 20.9 GPa, which is the highest pressure covered by the experiments. The low-pressure and high-pressure phases are related via a group/subgroup relationship. However, a discontinuous change in the unit-cell volume is detected at the phase transition; thus, the phase transition can be classified as a first-order type. Upon decompression, the transition has been found to be reversible. The results are compared with previous high-pressure studies on doped and un-doped SnO2. The compressibility of different phases will be discussed.
1. Introduction
At present, nano-scale materials are having a great impact on human life. They are changing dental medicine, healthcare, and human life more profoundly than several scientific developments of the past decades. Research on nanomaterials has also become a striking area for applied and fundamental research due to the intriguing chemical and physical properties of nanomaterials. Nanomaterials are preferred for many technological applications over their bulk counterparts due to enhancements in their catalytic, optical, magnetic, and electrical properties [1,2,3]. In addition, the nature of pressure-induced structural phase transitions, pressure effects on elastic properties, and transition pressures in nanomaterials could be quite different when compared to bulk materials [4,5,6,7,8,9]. Tin dioxide (SnO2) is a very technologically important material, and it is widely used as a wide bandgap semiconductor. It finds applications in the field of solar cells [10], in ultraviolet photodetectors [11], in short wavelength light-emitting diodes [12], in spintronic applications [13], as a gas sensor [14], and in lithium-ion batteries [15], among other applications. Recently, SnO2 has also attracted substantial attention due to its wide bandgap energy, large exciton binding energy, and outstanding electrical properties and optoelectronic features. Due to these characteristics, SnO2 has been employed for building ultraviolet light-emitting and light-detecting devices based on a SnO2/GaN heterojunction [16].
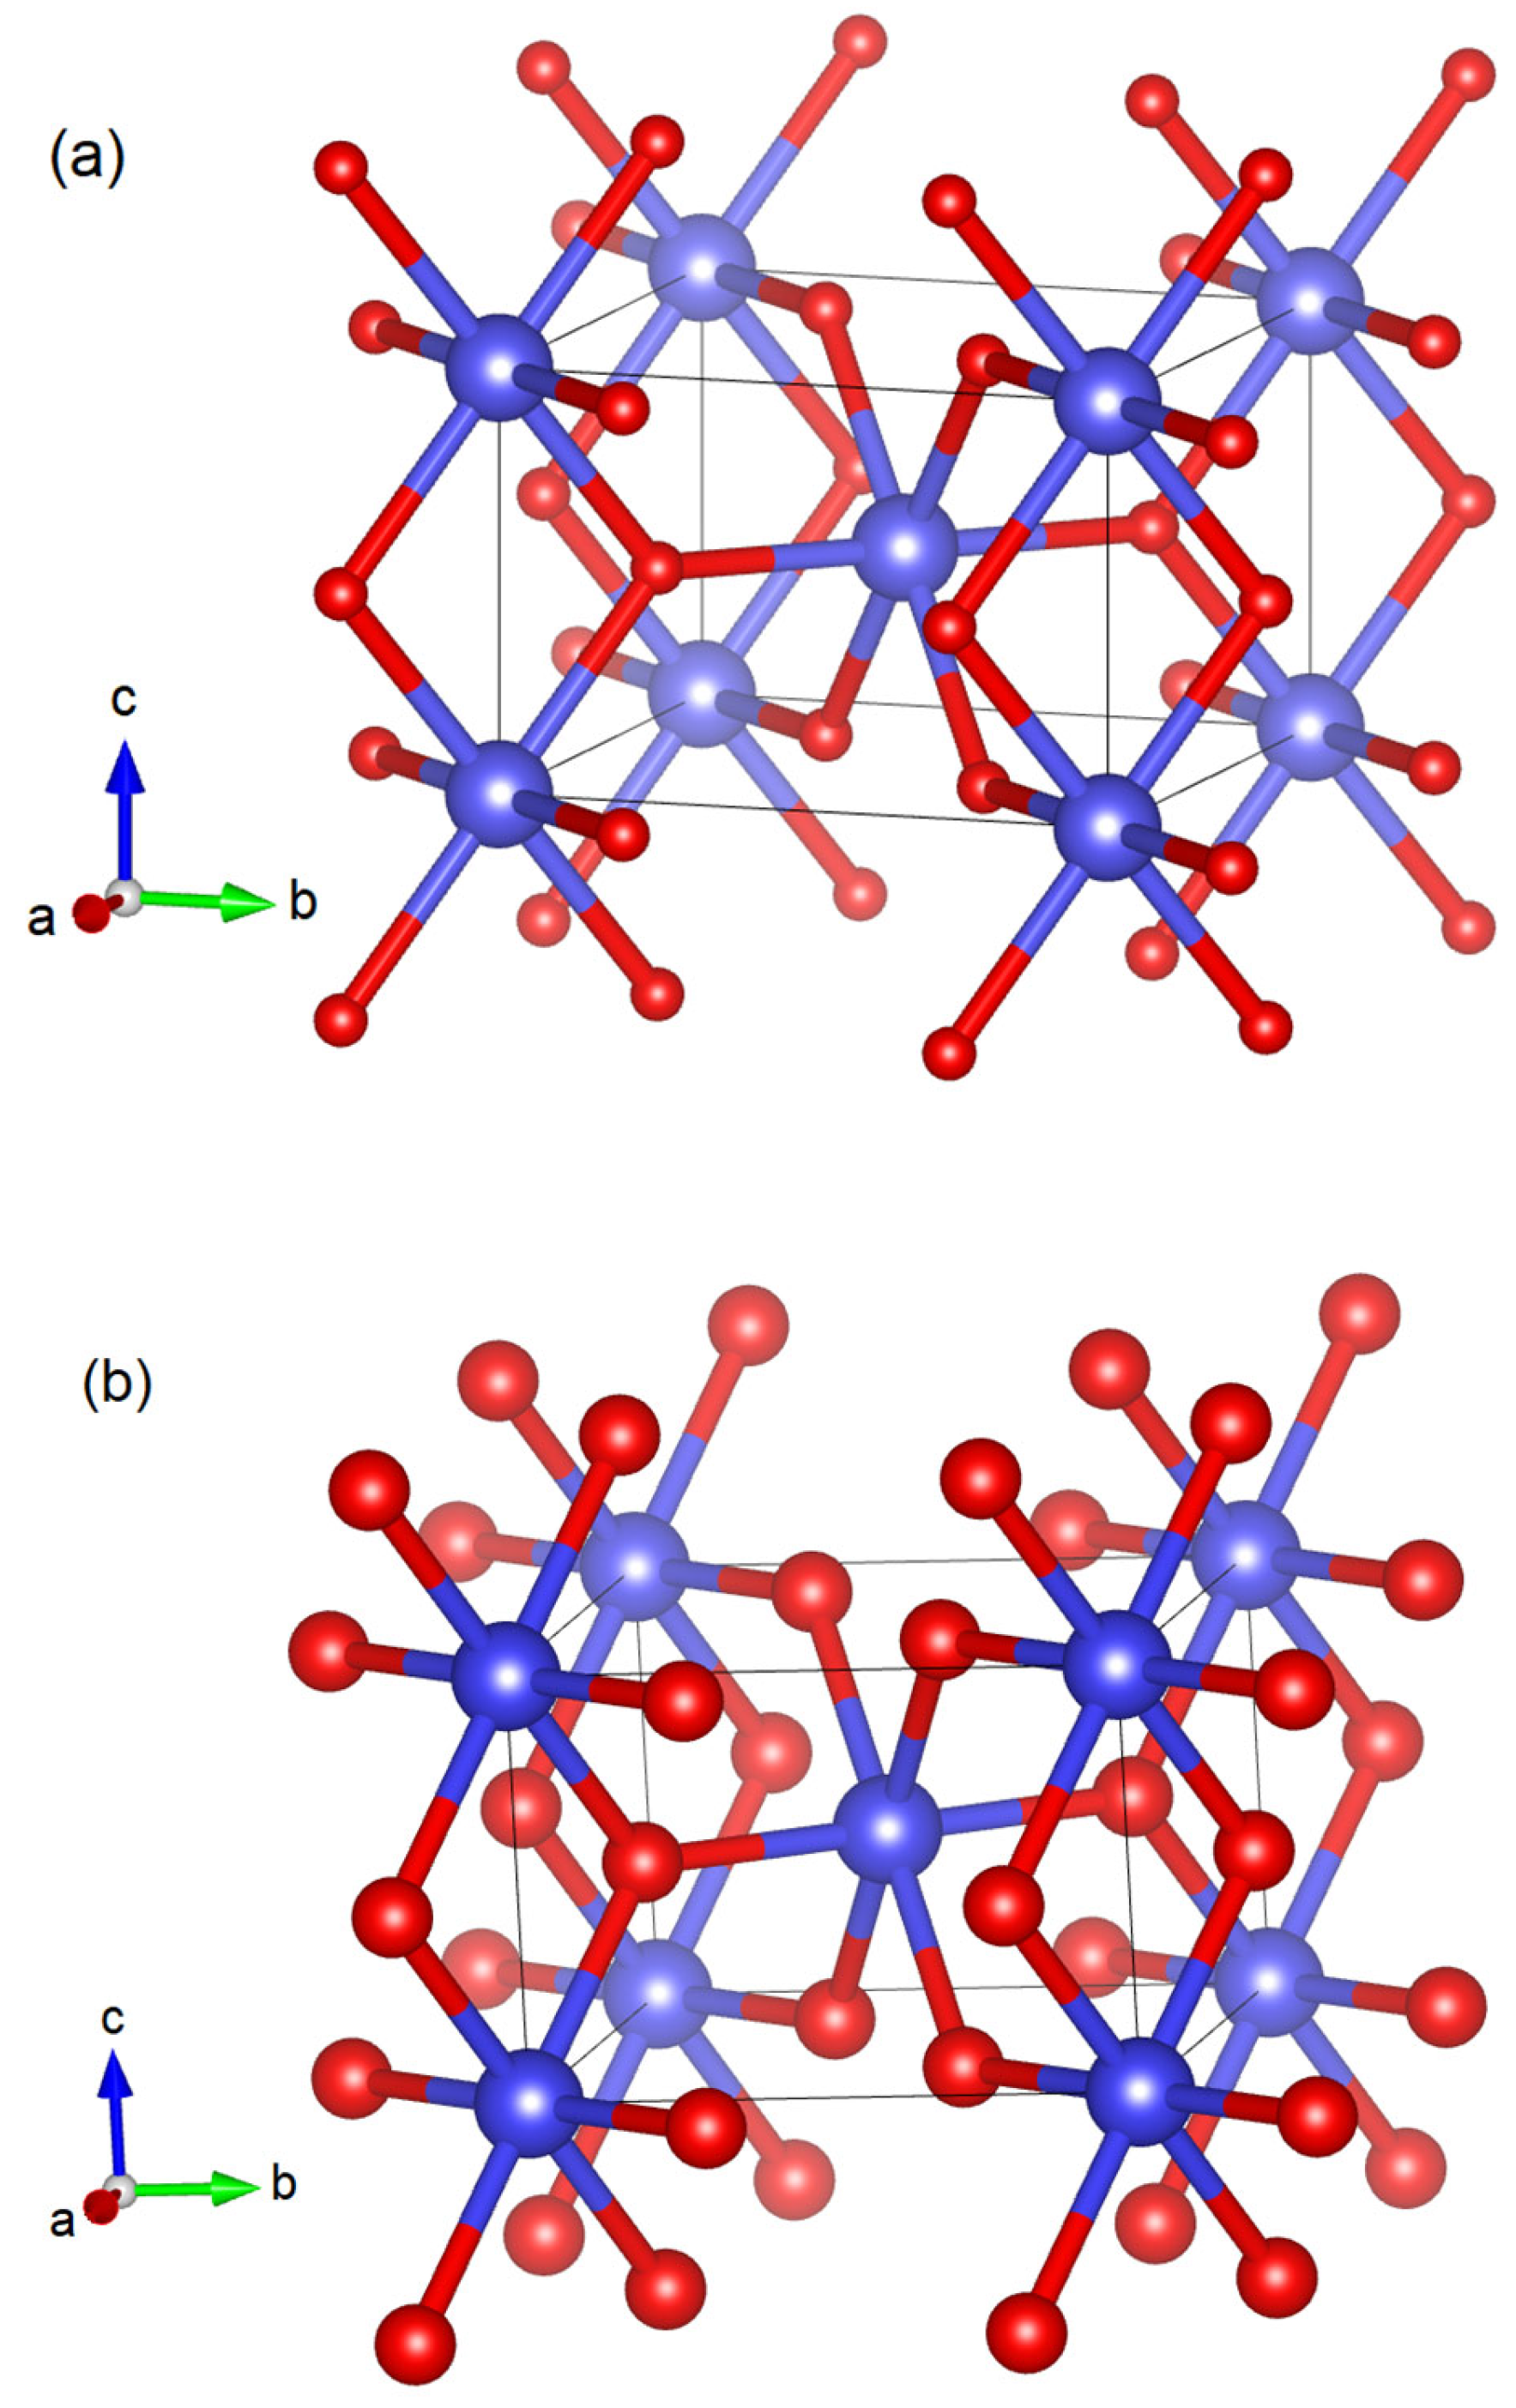
Under ambient conditions, SnO2, which is also known as stannic oxide or by the mineralogical name Cassiterite, crystallizes into a crystal structure isomorphic to that of tetragonal rutile (space group P42/mnm, Z = 2). In this structure, the Sn atoms are in the corners and center of the tetragonal unit cell (see Figure 1a). They are six-fold coordinated by oxygen atoms, which are shared with the adjacent SnO6 octahedral units, as shown in Figure 1a. The structure is also commonly described as a distorted hcp oxide array, with half of the octahedral sites occupied by Sn atoms. The oxygen atoms have a coordination number of three, resulting in a trigonal planar coordination.
In the past, it was reported that SnO2 undergoes the following sequence of pressure-induced structural phase transitions: rutile-type phase → CaCl2-type phase → PbO2-type phase → fluorite-type phase [17]. Earlier high-pressure (HP) powder X-ray diffraction (XRD) measurements [18,19], theoretical ab initio calculations [19,20,21,22,23], and HP Raman scattering measurements [24] on bulk as well as in nanocrystalline samples provided evidence of the occurrence of a second order-structural phase transition at pressures that vary from 7 GPa to 14 GPa. The structural phase transition is from the tetragonal rutile-type to the orthorhombic CaCl2-type structure (space group Pnnm), which is schematically represented in Figure 1b. In the CaCl2-type structure, the Sn atoms form a body-centered orthorhombic structure, and they are also octahedrally coordinated by oxygen atoms, as in the low-pressure phase. The SnO6 octahedral units form chains of edge-sharing octahedra running along the c-axis of the crystal structure, while perpendicular to the c-axis, the SnO6 octahedra are linked by sharing one corner with each neighboring SnO6 octahedron. However, there are a few exceptions for the rutile to CaCl2-type phase transition. For example, high-pressure powder XRD measurements carried out on nanocrystalline 5 nm sized samples [25] and 8 nm sized samples [26,27] have indicated the occurrence of a direct tetragonal rutile to cubic fluorite first-order structural phase transition beyond 18 GPa. The transition pressure has been also found to increase when decreasing the particle size [27]. On the other hand, the doping of SnO2 has been shown to cause alterations in the high-pressure behavior, elastic properties, and optical properties of the material. For instance, in Fe-doped nanoparticles (size 18 nm and 10 at % doping) of SnO2, increases in the transition pressure and bulk modulus have been reported [28]. On the contrary, in V-doped nanoparticles (size 10–30 nm and 5–12.5 at % doping) of SnO2, a decrease in the bulk modulus with an increasing concentration of the dopant has been found [29]. Hence, it is very interesting to know how the particle size, doping concentration, and the type of doping ion alter the high-pressure behavior and elastic properties of SnO2, and further systematic investigations are required in this direction. In the current contribution, we report HP synchrotron powder XRD studies up to a pressure of 20.9 GPa on Co-doped nanocrystalline SnO2 (crystallite size 15 nm and 10 at % doping) to contribute to the understanding of the effect of doping on the transition pressure and elastic properties. Such a study has not been reported yet.
2. Experiments
Cobalt-doped SnO2 nanoparticles were prepared at Universidad de Buenos Aires via the wet chemical co-precipitation method, following the procedure described previously by Ferrari et al. [30]. To implement the cobalt doping, we used anhydrous cobalt chloride (CoCl2) with a purity of 99.99%, which was obtained from Sigma-Aldrich (St. Louis, MI, USA). The synthesized nanoparticles were characterized at ambient conditions via powder XRD using Cu Ka radiation. The XRD measurements confirmed the formation of single-phase rutile-type nanoparticles with unit-cell parameters of a = 4.732(1) Å and c = 3.185(1) Å. These parameters are consistent with the parameters determined from single-crystal X-ray diffraction studies on bulk SnO2 [31,32]. An average particle size of 15 nm was determined from the full-width-at-half-maximum of the XRD peaks, using the well-known Scherrer equation [33]. The cobalt concentration (10 at %) in our samples was determined via energy-dispersive X-ray spectroscopy (EDXS).
Angle-dispersive HP powder XRD measurements were carried out at the MSPD-BL04 beamline of the ALBA synchrotron, using a monochromatic beam with a wavelength of 0.4642 Å. Wavelength selection was achieved using a silicon (111) double-crystal monochromator with a resolution of 2 × 10⁻⁴ [34]. The X-ray beam was focused down to a 20 μm full-width-at-half-maximum spot using Kirkpatrick–Baez mirrors. A Rayonix charge-coupled device (CCD) detector was used to collect the XRD patterns. The CCD detector was calibrated using LaB6 as a standard. Two-dimensional diffraction rings obtained from the detector were transformed into one-dimensional diffractograms using Dioptas. The measurements were taken at room temperature under compression with a membrane diamond anvil cell (DAC) equipped with 500 μm culet diameter diamond anvils. We used a 200 mm thick stainless-steel gasket pre-indented to a thickness of 40 μm, with a centered hole 200 μm in diameter, as a pressure chamber. As a pressure-transmitting medium we used a 16:3:1 methanol–ethanol–water mixture, which is known to remain quasi-hydrostatic up to approximately 10 GPa [35]. The pressure was determined using the equation of state (EOS) of copper (Cu), as reported by Dewaelle et al. [36], with a precision of ±0.05 GPa. During the XRD measurements, a rocking of ±3° of the DAC was used to reduce the influence of preferred orientations and to improve the homogeneity of the Debye rings. The structural analysis was carried out by employing the Rietveld technique via the Fullprof suite [37]. In the structural refinements, the background was fitted with a Chebyshev polynomial function of first kind with six coefficients, and the peak profiles were modeled using a pseudo-Voigt function. In addition to the unit-cell parameters, we also refined the atomic positions. The overall displacement factor was fixed to 0.5 Å.
3. Results and Discussion
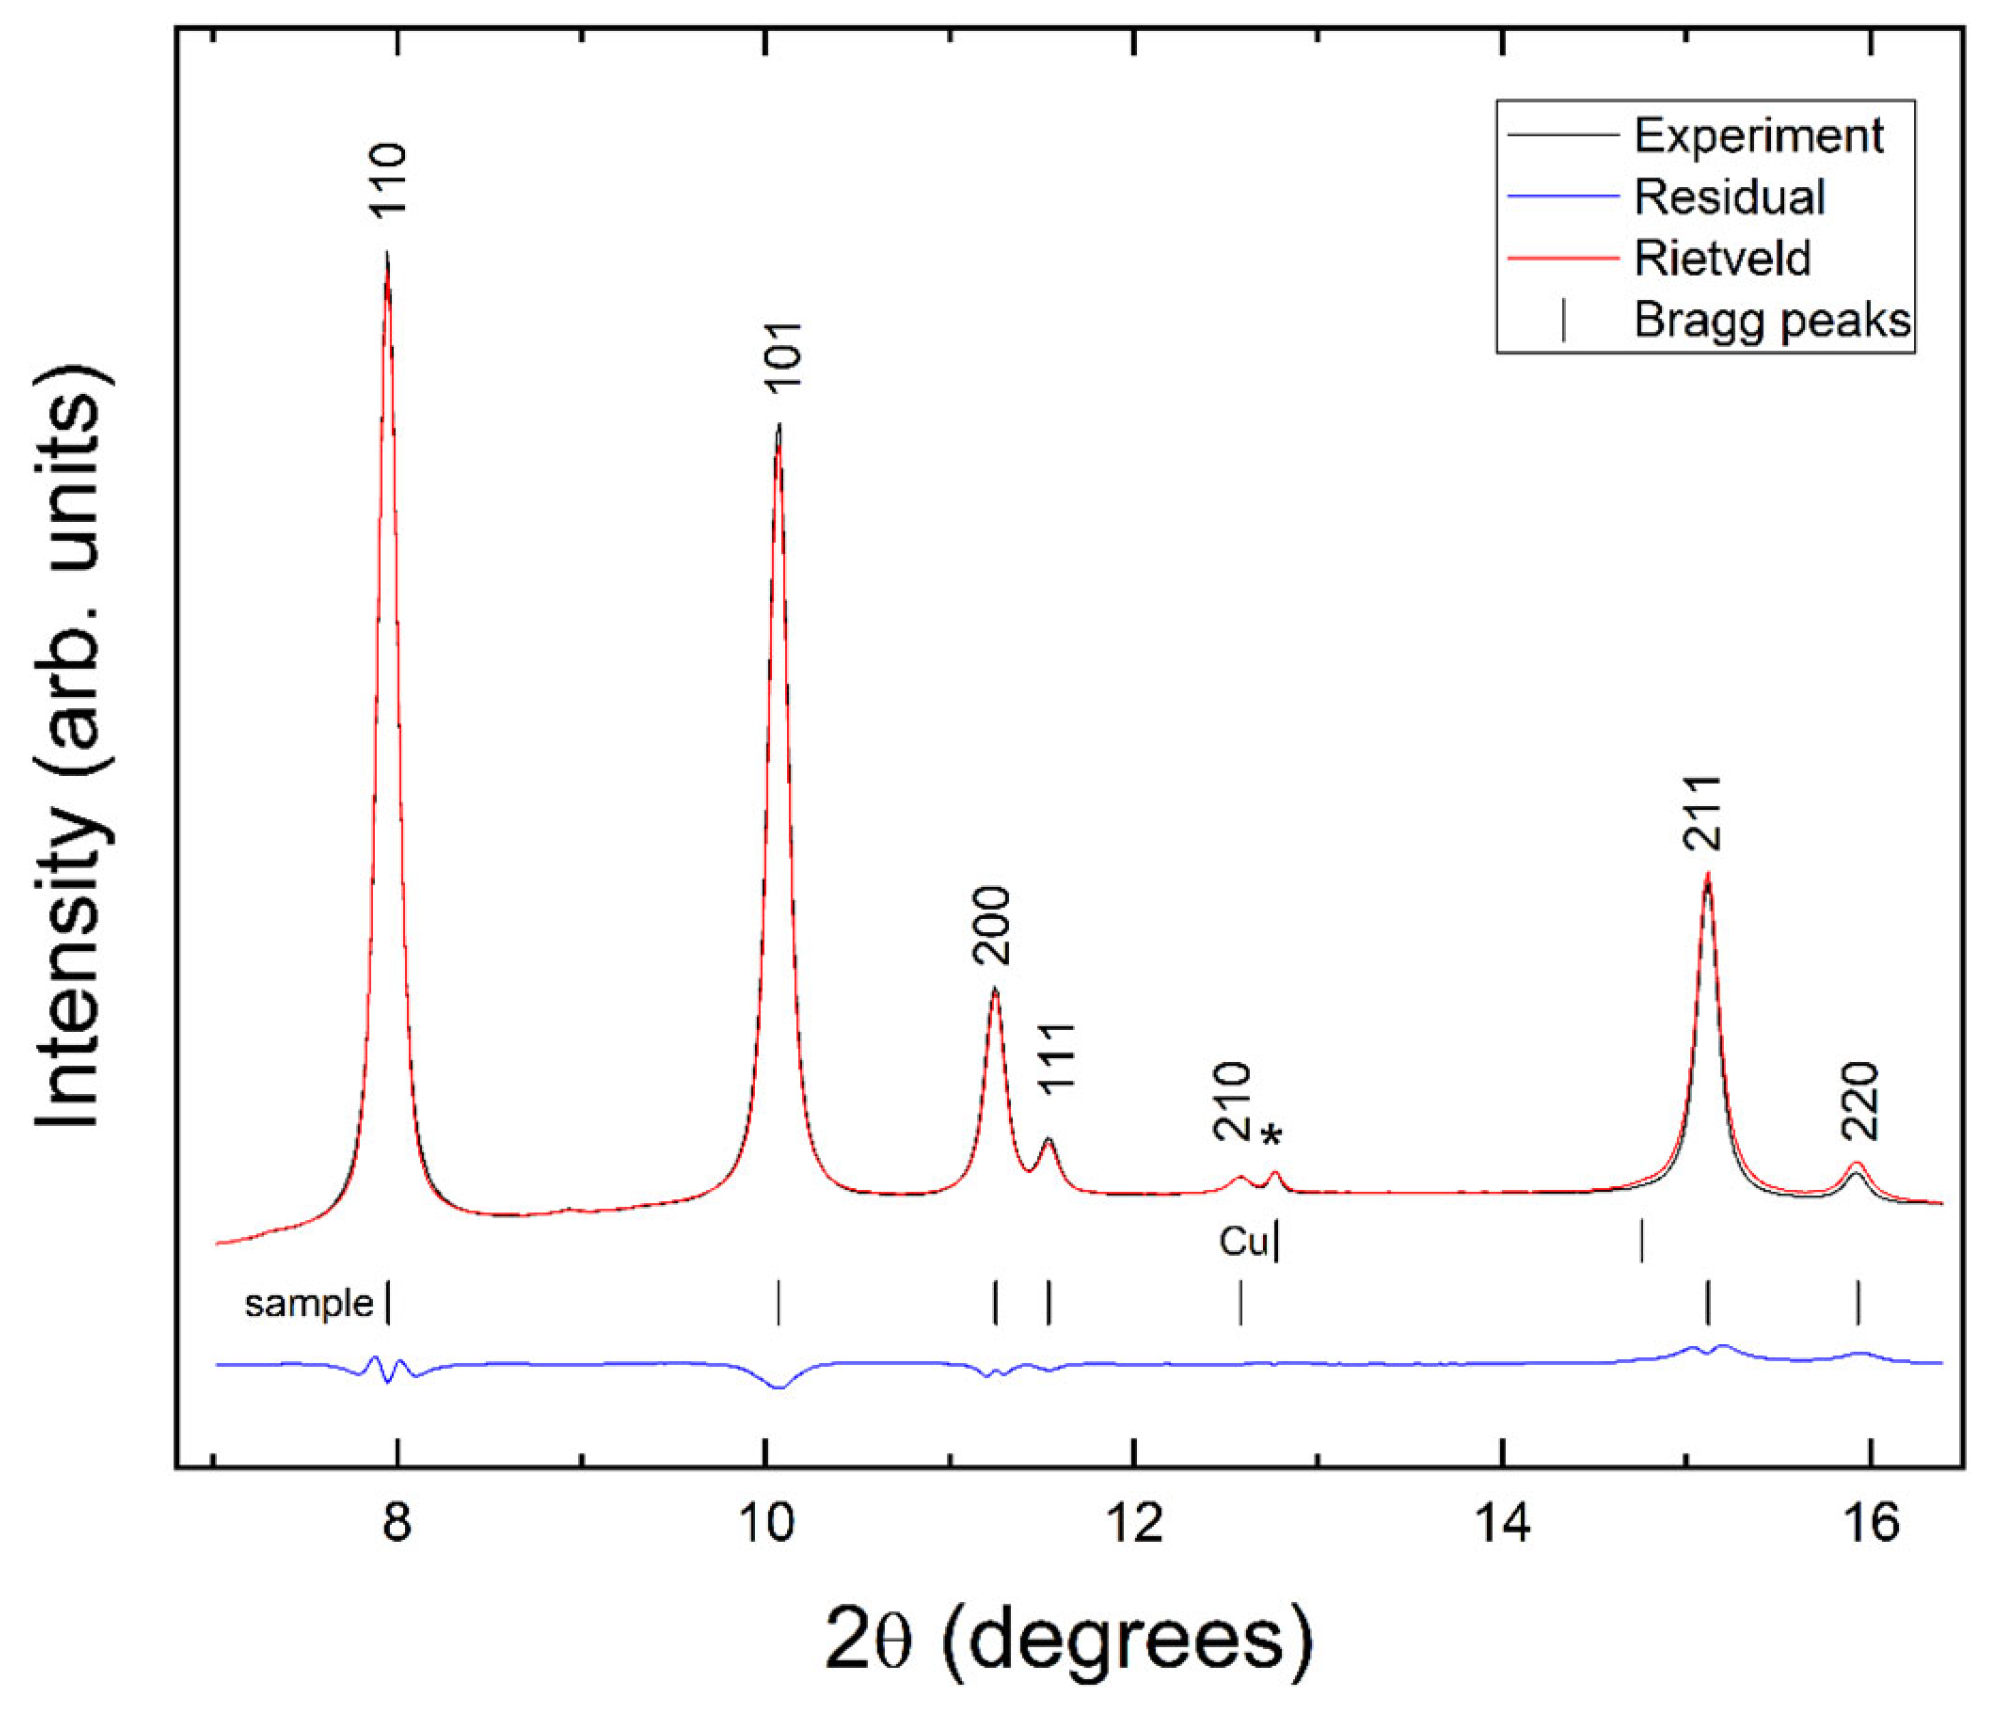
Figure 2 shows the powder XRD pattern at the lowest pressure measured for the nanocrystalline Co-doped SnO2 in the DAC (pressure = 0.6 GPa). The figure includes the results of the Rietveld refinement. As shown in the figure, the refinement is good, and the diffraction pattern can be undoubtedly assigned to the tetragonal rutile-type structure. In the XRD pattern, there is an extra weak peak, denoted by the asterisk symbol (*), which is assigned to the copper grain used as a pressure marker. It corresponds to the (111) reflection of copper. The unit-cell parameters obtained for the nanocrystalline Co-doped SnO2 at 0.6 GPa are a = 4.728(1) Å and c = 3.184(1) Å. The goodness-of-fit parameters obtained from the structural refinement are Rwp = 6.16% and Rp = 3.4%.
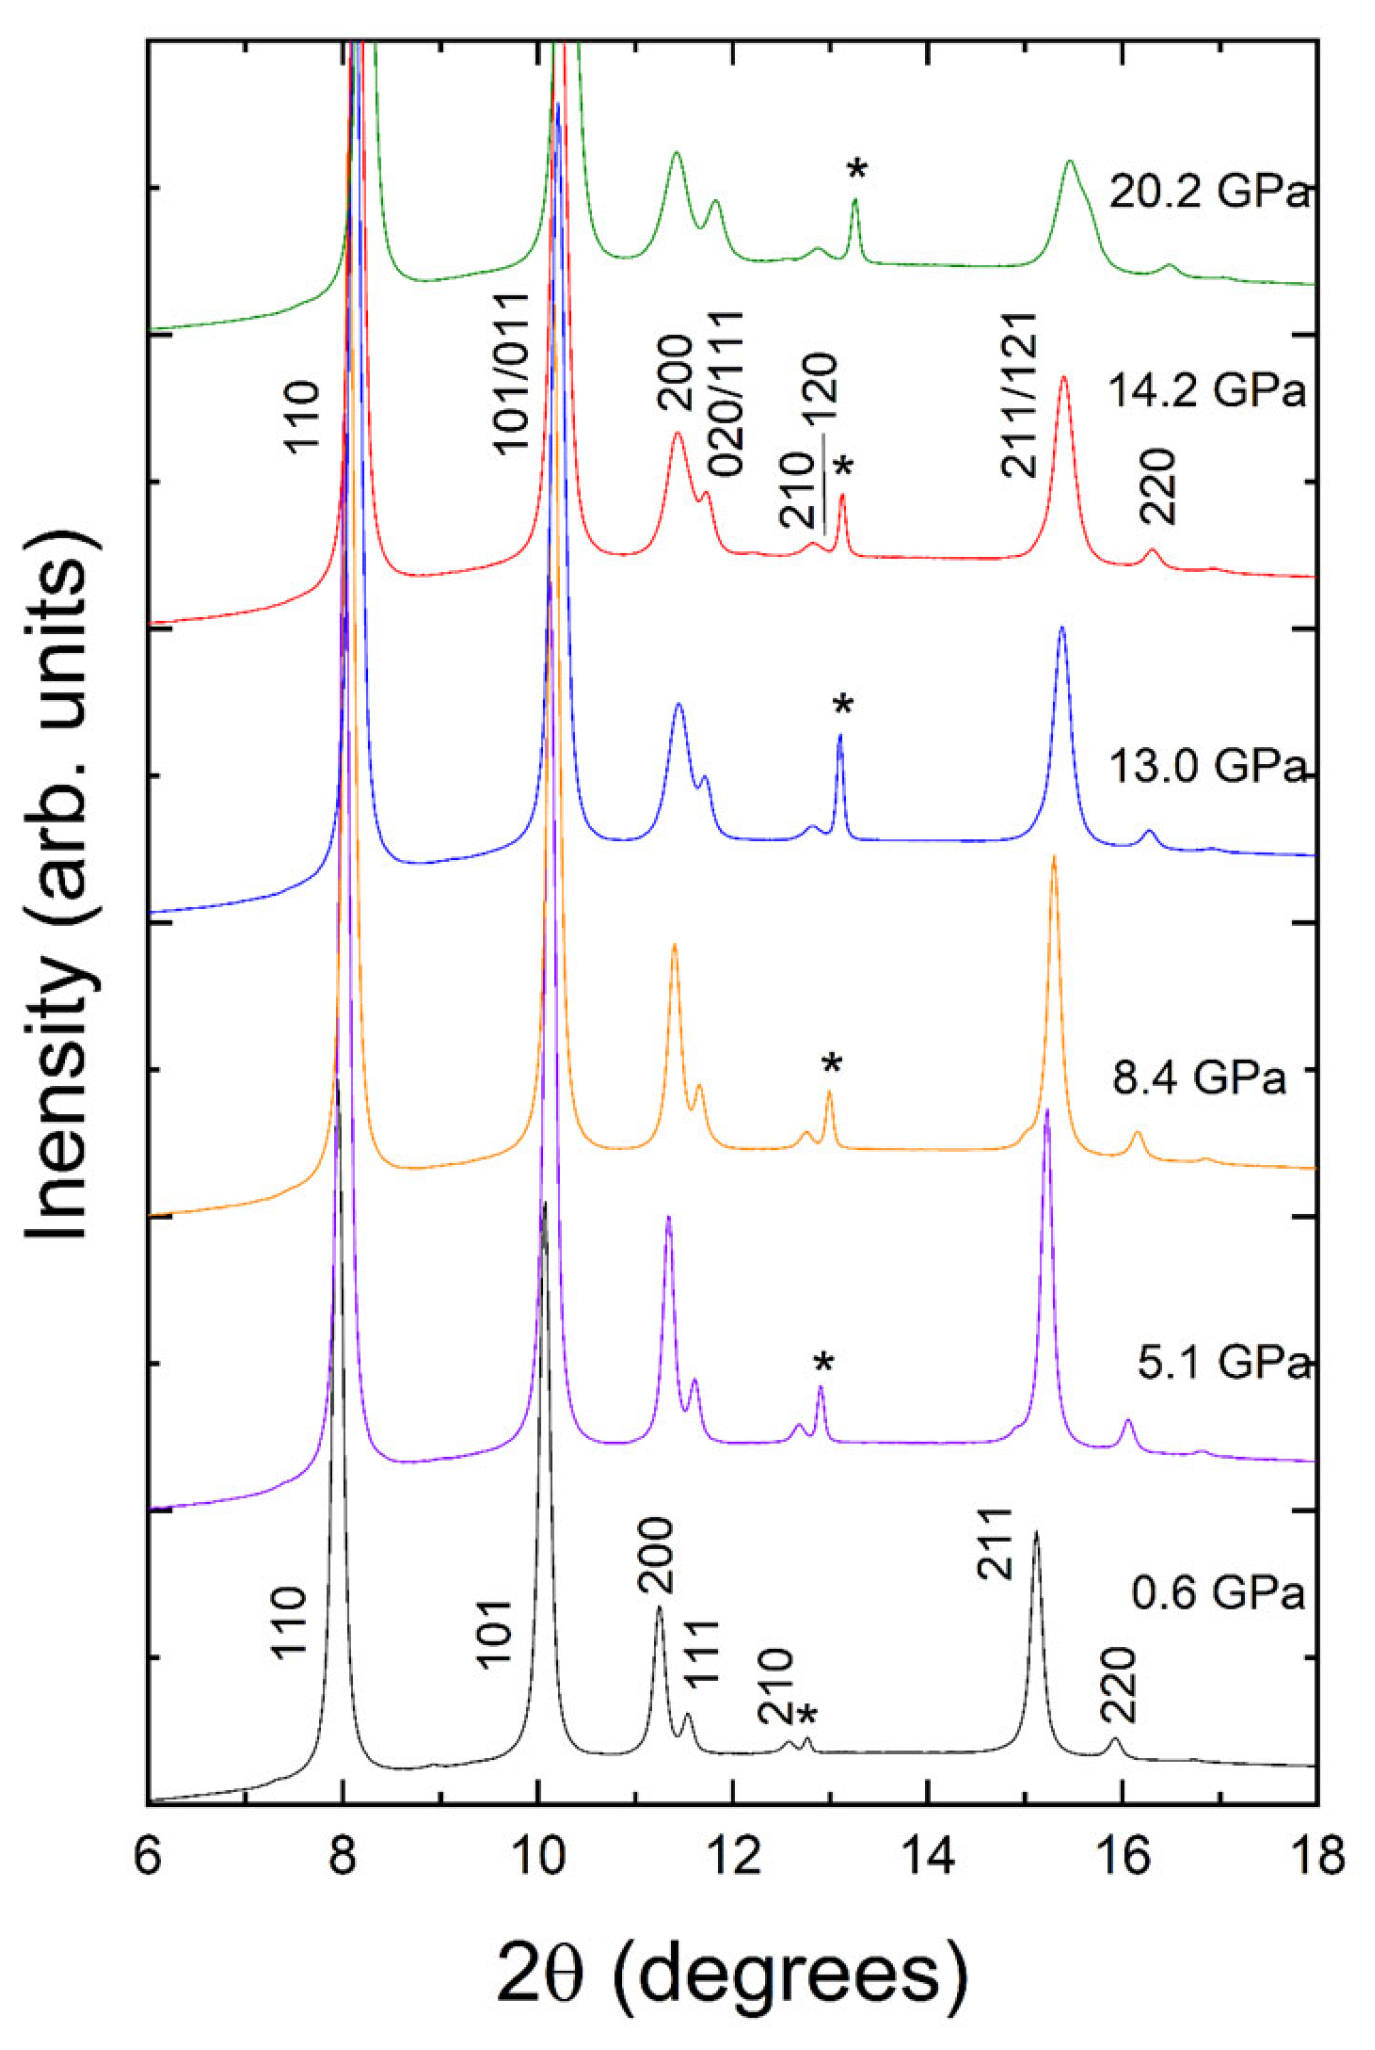
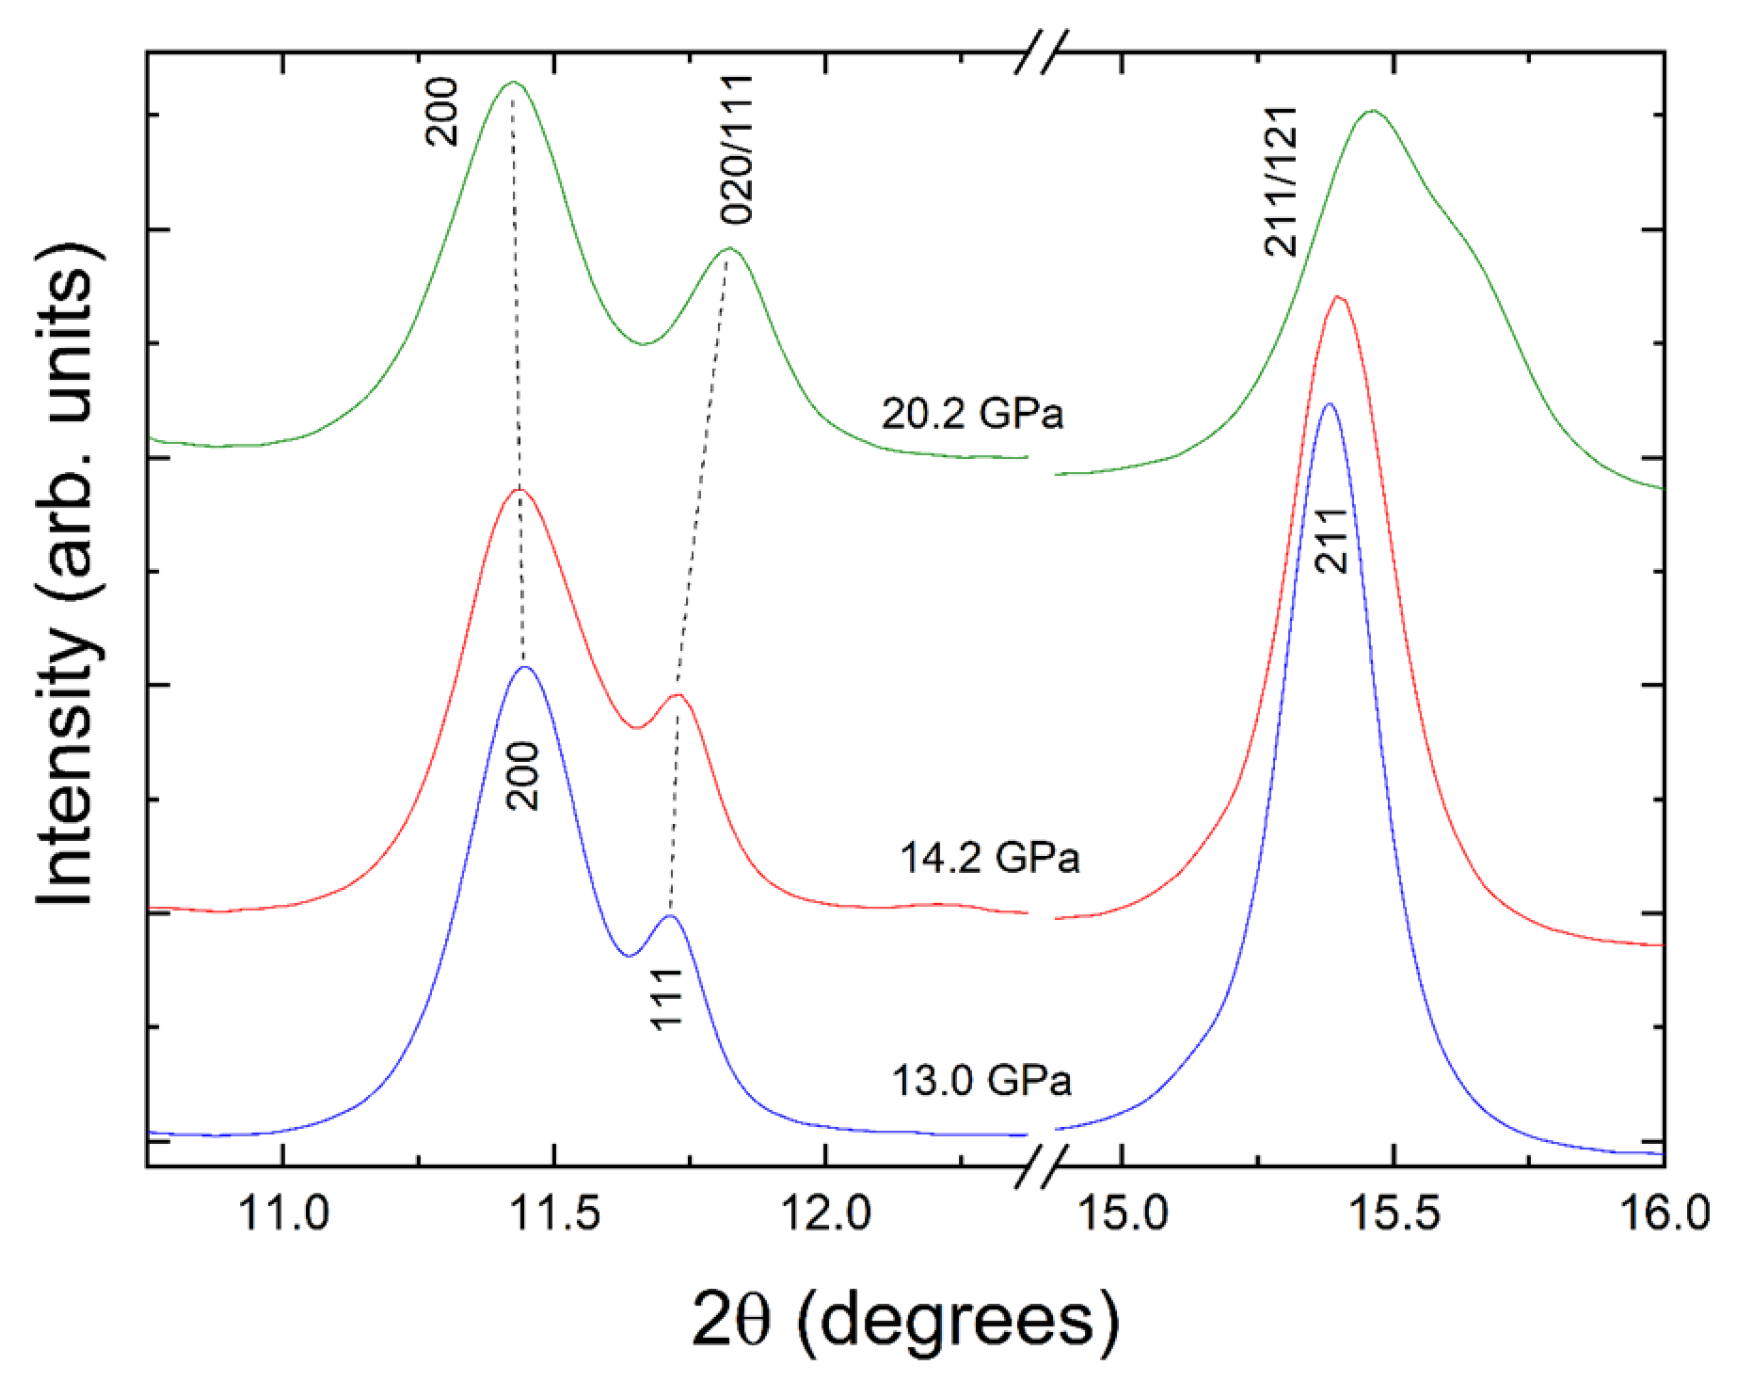
Figure 3 shows a selection of XRD patterns of nanocrystalline Co-doped SnO2 at representative pressures. There are no noticeable changes in the diffraction patterns up to 13 GPa aside from the shift of peaks to higher angles due to the typical contraction of unit-cell parameters under compression. All the XRD diffraction peaks up to 13 GPa could be successfully indexed considering only the low-pressure (LP) rutile-type phase and copper. In addition to the peaks assigned to SnO2, a peak due to copper (marked by *), which was used to determine the pressure, can be identified in all the X-ray diffraction profiles. We observed a systematic shift in all the diffraction peaks to a higher 2θ due to lattice compression. At 14.2 GPa, we observed few discernible changes in the XRD diffraction profile, which we consider to be indicative of a phase transformation. In addition, we found that at 14.2 GPa, the cell metric is no longer consistent with P42/mnm symmetry, and another crystallographic phase with Pnmm symmetry occurs, corresponding to an orthorhombic CaCl2-type structure. In particular, at the pressure of 14.2 GPa, the broadening of the (101), (200), and (111) diffraction peaks of rutile, in addition to the splitting of the (211) diffraction peak of rutile, were observed. The XRD diffraction profiles at 14.2 GPa and higher pressures could not be well indexed to tetragonal rutile-type phase. To make the changes in the XRD patterns indicating the structural phase transition more evident for the readers, we provide in Figure 4 an enhanced view of the XRD patterns measured at 13.0, 14.2, and 20.2 GPa. In Figure 4, it is clear that the (211) peak of rutile gradually splits into two different peaks. The same happens with peak (111). Another fact highlighted by Figure 4 that could not be explained by assuming the tetragonal rutile-type structure is the evolution of the (200) peak of rutile towards low angles as the pressure increased beyond 13.0 GPa. This can only be explained by assuming a decrease in the crystal symmetry from tetragonal to orthorhombic. Indeed, we found that the orthorhombic CaCl2-type structure provides the correct positions of all diffraction peaks, as indicated by unbiased Rietveld refinements. An example of this can be seen in Figure 5, where we show the Rietveld refinement we performed at 14.2 GPa. Furthermore, the proposed rutile-CaCl2 structural phase transition agrees with earlier investigations on rutile SnO2 [17,18,19,20].
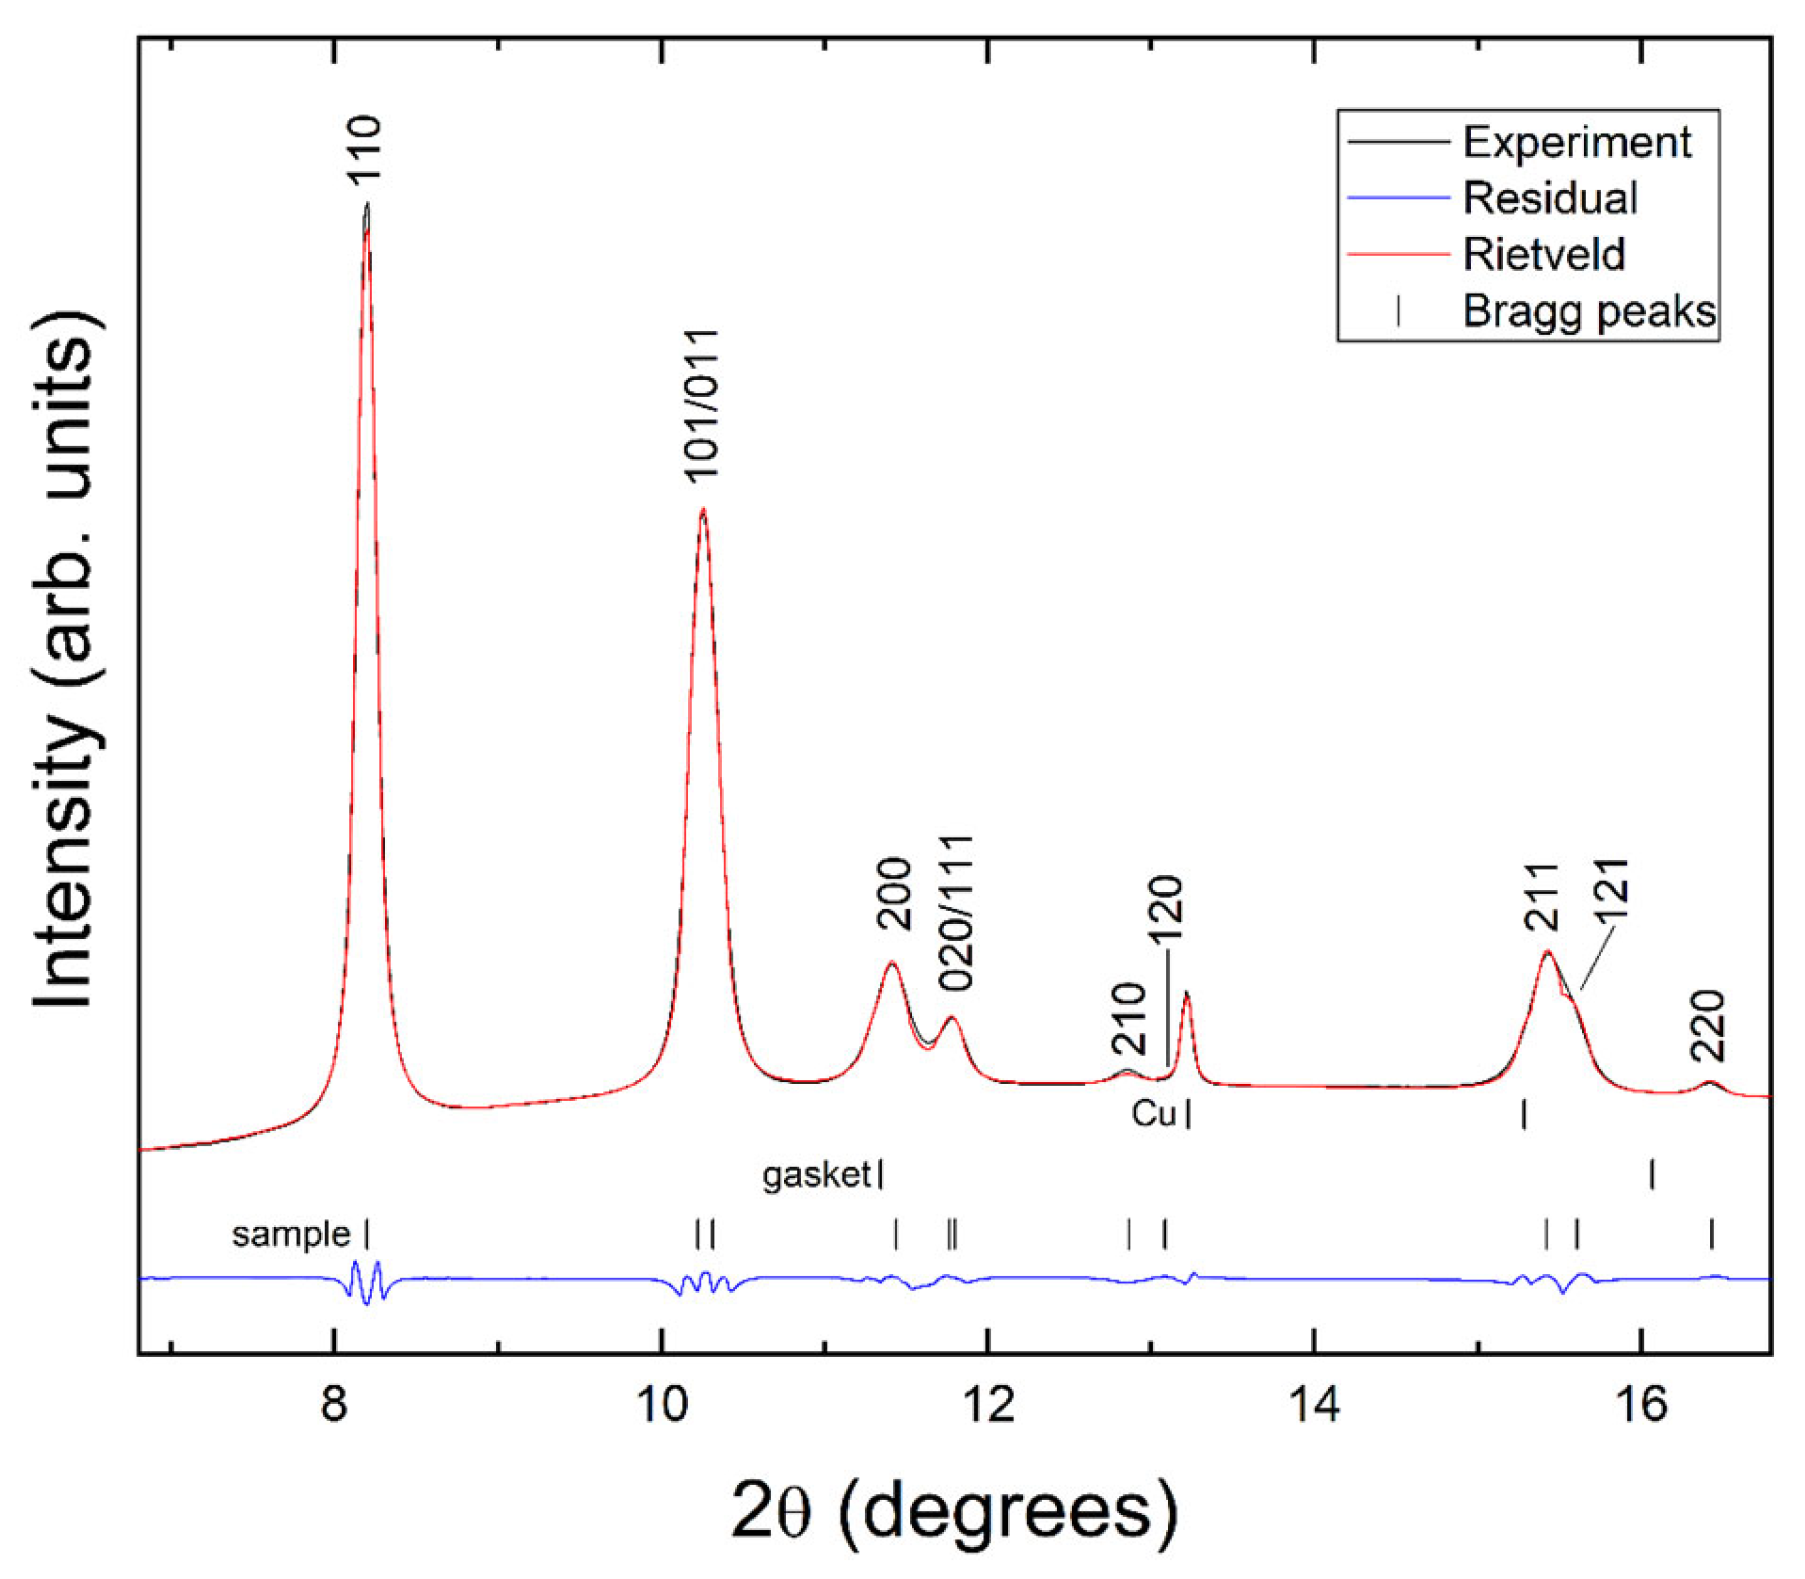
Upon a further increase in pressure, we found that the orthorhombic CaCl2-type structure continued to be stable in the nanocrystalline Co-doped SnO2 up to 20.9 GPa, which was the highest pressure measured in this investigation. Upon the release of the pressure, we found that the phase transition was fully reversible. In the experiments, we did not observe any coexistence of phases during the compression and decompression cycles. This fact, and the group–subgroup relationship existing between space groups P42/mnm and Pnnm, could be an indication that the observed phase transition is second-order in nature, which agrees with the conclusions extracted from previous powder XRD measurements on doped and un-doped nanocrystalline SnO2 [28]. However, as we will explain below, in nanocrystalline Co-doped SnO2 at the phase transition, we detected a volume discontinuity, which undoubtedly supports a first-order nature for the phase transition in Co-doped SnO2. Notice that up to now, this is the only SnO2 nanomaterial in which such a volume discontinuity, larger than experimental uncertainties, has been detected at the phase transition. We speculate that the observed volume discontinuity could be related to changes in the strong anti-ferromagnetic super-exchange interaction between the Co ions that exist in the Co-doped SnO2 [38]. Another hypothesis to explain the observed abrupt volume decrease is the influence of structural defects that are induced by Co doping [39]. Additional studies are needed to fully understand the distinctive behavior of Co-doped SnO2. The Rietveld refinement of the XRD patterns’ profile measured for the HP phase at 14.2 GPa is shown in Figure 5. In addition to the peaks from the sample and Cu, we observed a weak contribution of the gasket material, which causes the peak (200) of the HP phase of Co-doped SnO2 to become asymmetric. The unit-cell parameters determined for the HP phase of the Co-doped SnO2 at 14.2 GPa are a = 4.675(2) Å, b = 4.572(3) Å, and c = 3.151(1) Å. The goodness-of-fit parameters of the Rietveld refinement shown in Figure 5 are Rwp = 9.84% and Rp = 7.79%.
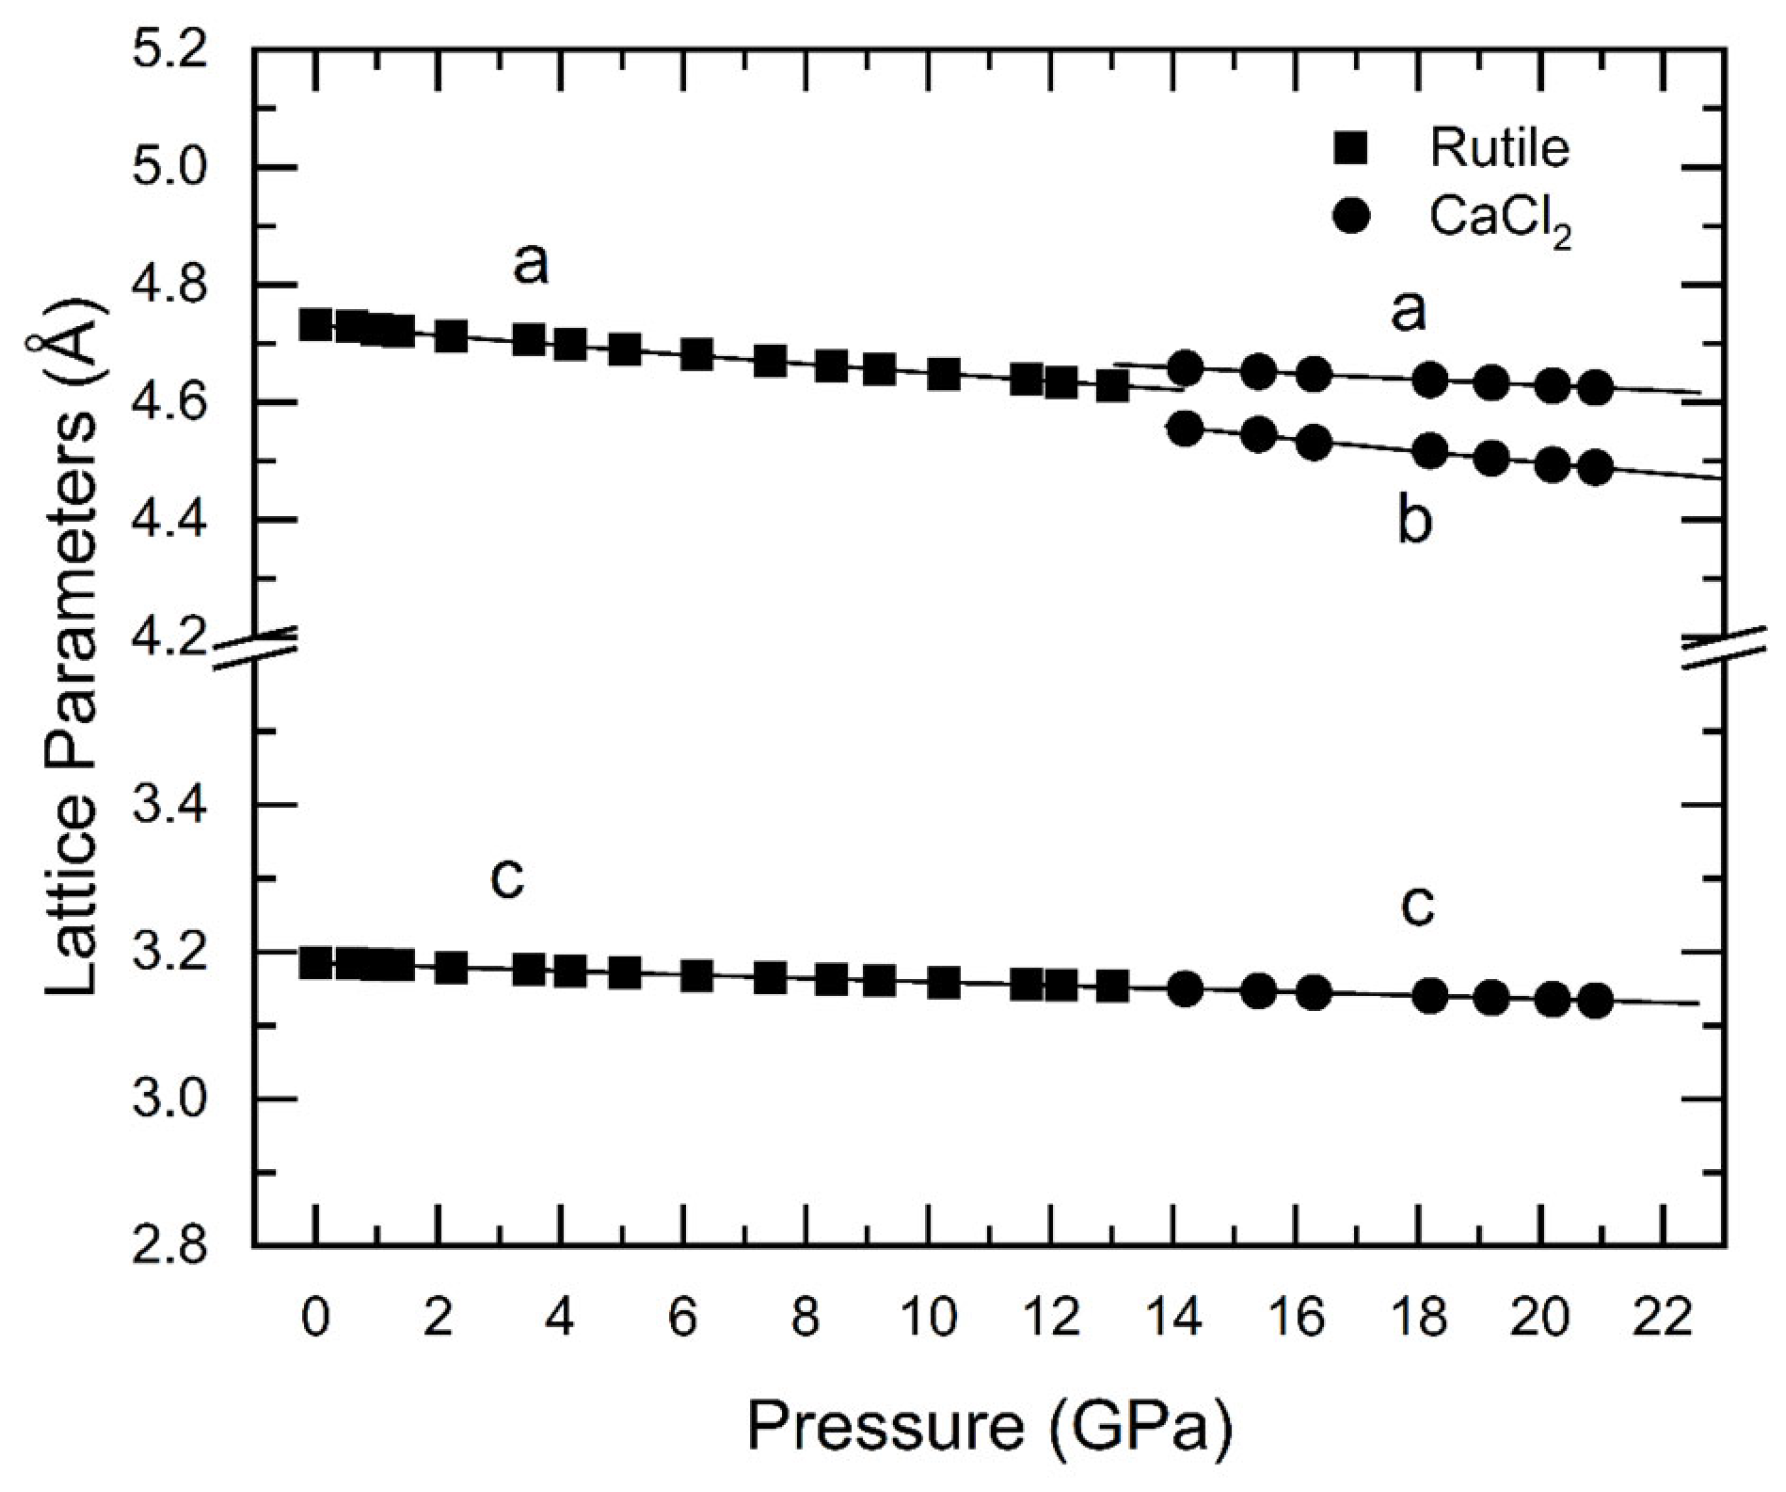
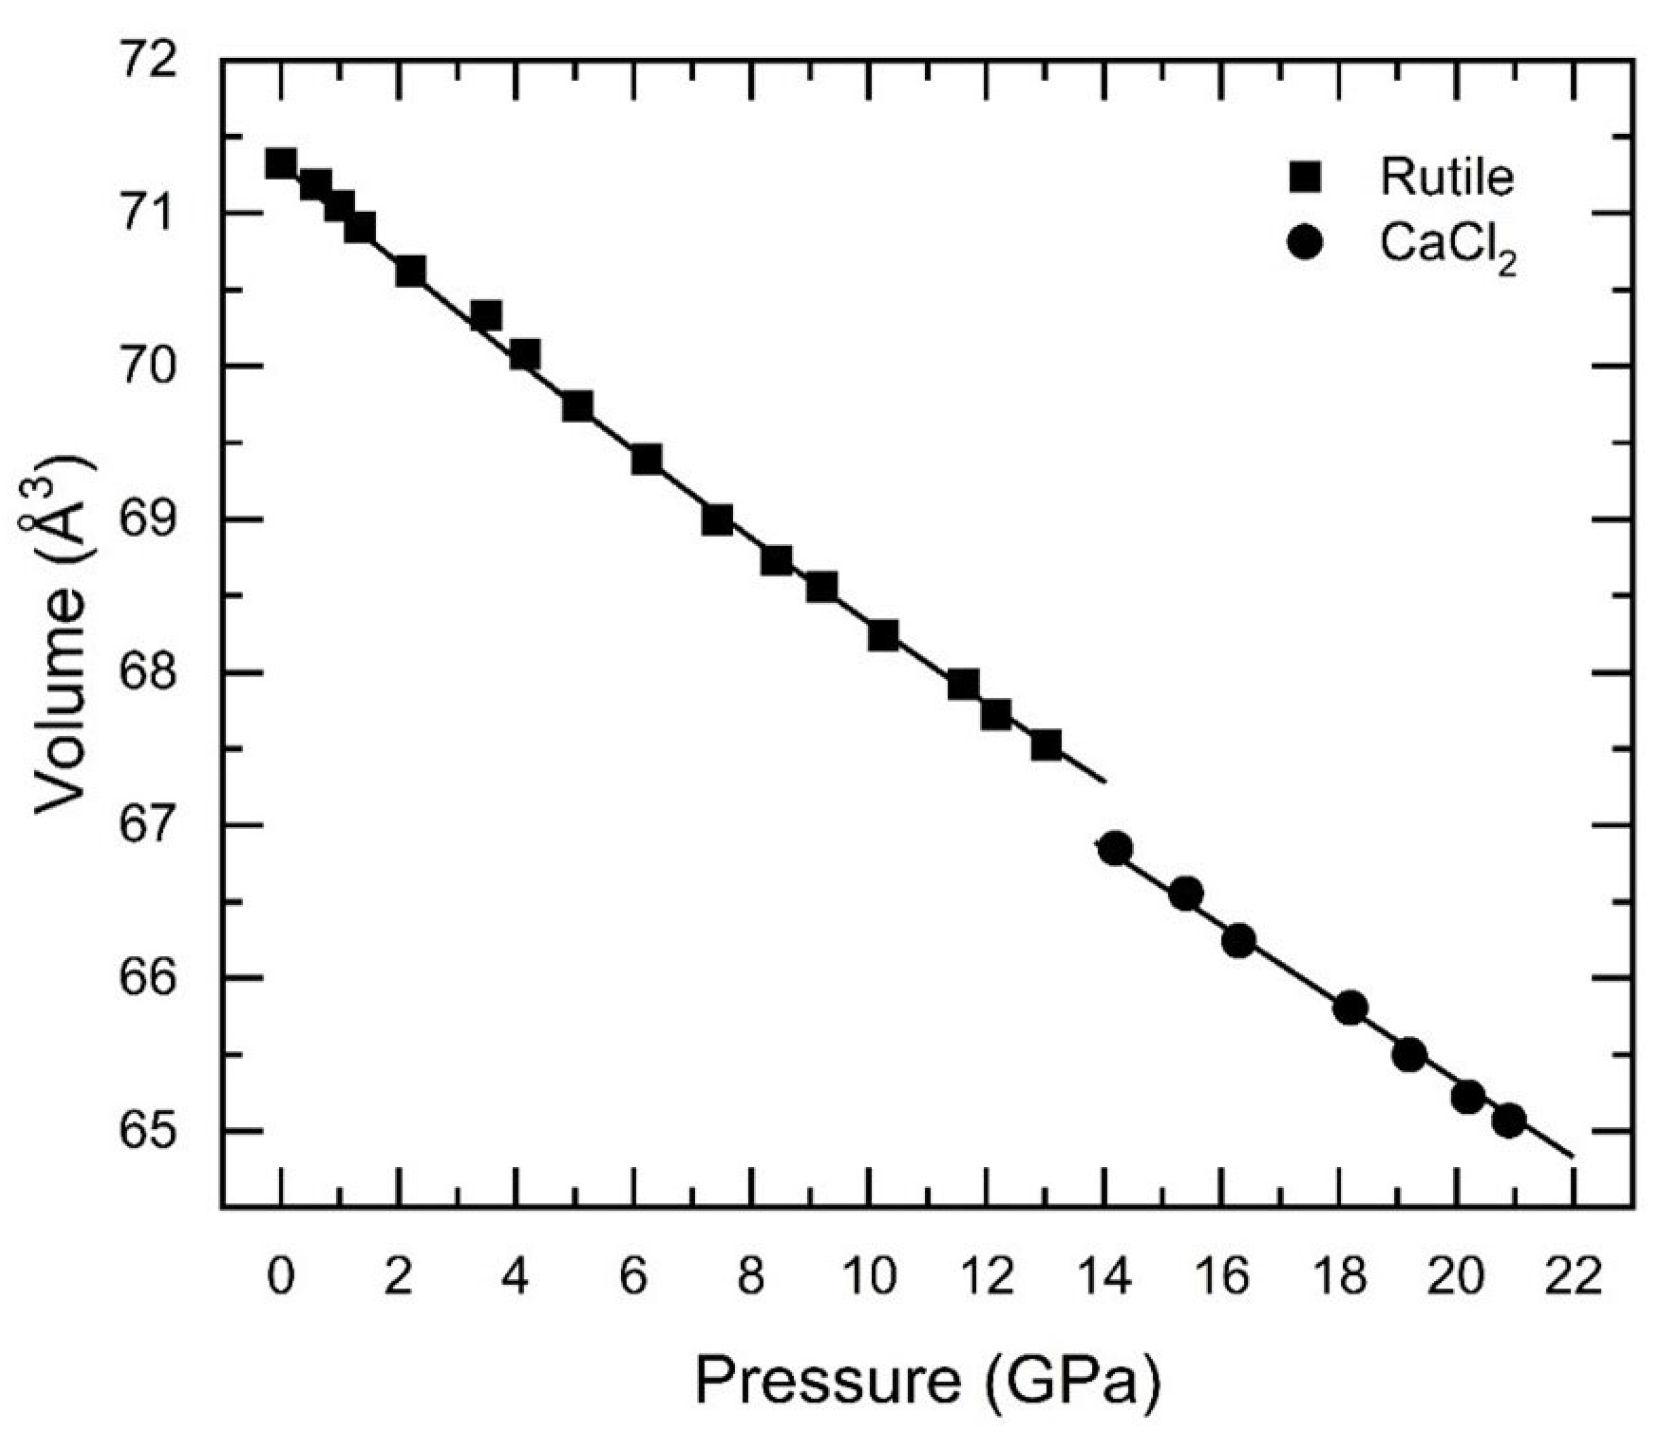
The pressure evolution of the lattice parameters of the Co-doped nanocrystalline SnO2 in the tetragonal rutile-type and orthorhombic CaCl2-type phases is shown in Figure 6. The pressure dependence of the unit-cell volume is reported in Figure 7. We observed a discontinuity in the volume (−ΔV/V~1.0%) at the transition pressure. The change in the volume was larger than the experimental error (which is smaller than the symbols), indicating the first-order nature of the structural phase transition. Using the EOSFIT7 software [40], the linear compressibility values of the axes of each phase were calculated. We observed that in the rutile-type phase of SnO2, the axial compressibility values were highly anisotropic. In particular, the a-axis was more compressible than the c-axis, as is evident from the increase in the c/a ratio from 0.673 at ambient pressure to 0.681 at 13 GPa. The linear compressibility of the c-axis was found to be Kc = 1.02(4) × 10−3 GPa−1, which is almost half of the compressibility of the a-axis, Ka = 1.72(6) × 10−3 GPa−1. This anisotropic behavior in compressibility is in quite good agreement with the earlier reported values of bulk SnO2 samples [31,41,42] and even for un-doped, Fe-doped, and V-doped nanocrystalline SnO2 [28,29]. However, the of axial compressibility vales obtained in this investigation are slightly higher compared to earlier investigations [28,29,31,41,42]. In the case of the orthorhombic CaCl2-type phase of the Co-doped SnO2, the axial compressibility values were found to be highly anisotropic as well. In particular, the b-axis was more compressible when compared to other two axes. The linear compressibility values of all three axes were found to be Ka = 1.65(4) × 10−3 GPa−1, Kb = 1.90(1) × 10−3 GPa−1, and Kc = 1.05(2) × 10−3 GPa−1.
The P–V data of the rutile-type phase of nanocrystalline Co-doped SnO2 in the tetragonal phase, fitted to the second-order Birch–Murnaghan equation of state, provides a bulk modulus at zero pressure of B0 = 213(9) GPa, with its pressure derivative provided as B0′ = 4. During this fit, the bulk modulus B0 and ambient pressure volume V0 were kept as free variables. This value of the bulk modulus is in good agreement with previously reported values for the same parameter in bulk SnO2 [17] and even in un-doped and in Fe-doped nanocrystalline SnO2 [28]. The values of the bulk moduli are summarized in Table 1. However, in V-doped nanocrystalline samples, the bulk modulus was found to decrease with increases in doping concentrations in the range from 142 GPa to 185 GPa [29]. We can then conclude that in contrast with V-doping, a 10% doping with Co and Fe does not affect the mechanical properties of SnO2, which is good for technological applications. A possible reason for this it could be the fact that the V atom has larger ionic radii than the Fe and Co atoms, which would necessarily drive changes in the crystal structure more easily. For the high-pressure phase of the Co-doped SnO2, the bulk modulus we obtained was B0 = 228(9) GPa. The slight increase in the bulk modulus at the phase transition is consistent with the fact that the HP phase is denser than the low-pressure phase due to the volume contraction observed at the transition. However, both bulk moduli agree within error bars: 213(9) and 228(9) GPa. This fact is consistent with the displacive mechanism proposed for the rutile-CaCl2 phase transition [43]. In this regard, the behavior of the Co-doped SnO2 is more similar to the behavior of bulk SnO2 [17], for which no changes have been detected in the bulk modulus at the transition (see Table 1), than to the behavior of the bulk modulus for Fe-doped a nanocrystalline SnO2 [29], for which a 15% increase in the bulk modulus has been reported after the phase transition. At present, it is not clear that the difference in behavior is inherent to the difference in doping or to the difference in non-hydrostatic stresses in the experiments [44]. Future studies are needed to clarify this issue. On the other hand, it should be noted that in the equation of state, the volume at zero pressure (V0) and B0 are correlated parameters. Thus, large uncertainties on V0 could affect the value of B0 [45]. This could be the case for nanocrystalline Co-doped SnO2 for which the phase transition is reversible and therefore no data are available for the HP phase at pressures close to the ambient pressure. This means that the determination of V0 comes from the extrapolation of data measured above 14.2 GPa, which could lead to large errors in the determination of V0. This fact will necessarily propagate to the determination of B0, whose value should be taken with caution.
To conclude the discussion, we would like to mention that the Co-doping of nanocrystalline SnO2 does not affect the structural stability and mechanical properties, making Co-doped SnO2 more attractive than SnO2 doped with other metals for practical applications for which doped SnO2 is deposited as a thin film on substrates such as amorphous solar cells and cadmium telluride solar cells [46]. Thin films are usually subjected to epitaxial strain, which gives rise to misfit stress. It is therefore better to use SnO2 films in which the structural stability and mechanical properties are not affected by doping, as is the case in Co-doped SnO2.
4. Conclusions
In summary, we performed an in situ synchrotron powder X-ray diffraction study on nanocrystalline Co-doped SnO2 at room temperature up to a pressure of 20.9 GPa. This study shows that the studied material undergoes a first-order structural phase transition from the tetragonal rutile-type to the orthorhombic CaCl2-type phase at ∼14.2 GPa. The crystal structure of the high-pressure phase is orthorhombic, and it is isomorphic to the high-pressure structure observed previously in bulk, doped, and un-doped nanocrystalline samples of SnO2. We did not observe any coexistence of phases during the phase transition under conditions of both compression and decompression. The compressibility behavior was found to be highly anisotropic in both phases, and the value of bulk modulus for the tetragonal rutile-type phase was in good agreement with earlier measurements. However, for the orthorhombic high-pressure CaCl2-type phase, the bulk modulus of the Co-doped SnO2 was 10% smaller than the same parameter in Fe-doped SnO2. The high-pressure phase was observed to remain stable up to 20.9 GPa. Upon the release of the pressure, the phase transition was found to be reversible. The reported results could be relevant for the implementation of practical applications using Co-doped thin films prepared via deposition methods.
Author Contributions
Conceptualization, D.E.; methodology and validation, V.P. and D.E. formal analysis, V.P., S.F. and D.E.; investigation, V.P., L.P., S.F., V.B., C.P. and D.E.; writing—original draft preparation, V.P.; writing—review and editing, V.P., L.P., S.F., V.B., C.P. and D.E.; supervision, D.E. All authors have read and agreed to the published version of the manuscript.
Funding
D.E. thanks the financial support from Generalitat Valenciana under the grant PROMETEO CIPROM/2021/075-GREENMAT, the Advanced Materials Programme, supported by MCIN and GVA, with funding from the European Union, NextGenerationEU (PRTR-C17.I1), under grant MFA/2022/007, and from the Spanish Research Agency (AEI) and the Spanish Ministry of Science and Investigation (MCIN) under projects PID2019-106383GB-C41 (DOI: 10.13039/501100011033) and RED2018-102612-T (MALTA Consolider-Team Network).
Data Availability Statement
Data are available upon reasonable request to the corresponding author at [email protected] (D.E.).
Acknowledgments
The authors are grateful for financial support from the Spanish Research Agency (AEI) and the Spanish Ministry of Science and Investigation (MCIN) under grants PID2019-106383GB-41/43 (http://0-dx-doi-org.brum.beds.ac.uk/10.13039/501100011033) and RED2018-102612-T (MALTA Consolider Team Network) and from Generalitat Valenciana under Grant PROMETEO CIPROM/2021/075-GREENMAT. This study forms part of the Advanced Materials program and was supported by MCIN with funding from the European Union Next Generation EU (PRTR-C17.I1) and by Generalitat Valenciana, Grant MFA/2022/007. The authors thank ALBA synchrotron for providing beam time for the XRD experiments (Proposal 2021085226).
Conflicts of Interest
The authors declare no conflict of interest.
References
- Gleiter, H. Nanocrystalline materials. Prog. Mater. Sci. 1989, 33, 223–315. [Google Scholar] [CrossRef]
- Siegel, R. Cluster-assembled nanophase materials. Annu. Rev. Mater. Sci. 1991, 21, 559–578. [Google Scholar] [CrossRef]
- Kodama, R. Magnetic Nanoparticles. J. Magn. Magn. Mater. 1999, 200, 359–372. [Google Scholar] [CrossRef]
- Lv, H.; Yao, M.; Li, Q.; Li, Z.; Liu, B.; Liu, R.; Lu, S.; Li, D.; Mao, J.; Ji, X.; et al. Effect on grain size on pressure-induced structural transition in Mn3O4. J. Phys. Chem. C 2012, 116, 2165–2171. [Google Scholar] [CrossRef]
- Srihari, V.; Verma, A.; Pandey, K.; Vishwanadh, B.; Panchal, V.; Garg, N.; Errandonea, D. Making Yb2Hf2O7 Defect Fluorite Uncompressible by Particle Size Reduction. J. Phys. Chem. C 2021, 125, 27354–27362. [Google Scholar] [CrossRef]
- Jiang, J.; Gerward, L.; Frost, D.; Secco, R.; Peyronneau, J.; Olsen, J. Grain-size effect on pressure-induced semiconductor-to-metal transition in ZnS. J. Appl. Phys. 1999, 86, 6608–6610. [Google Scholar] [CrossRef]
- Wang, Z.; Tait, K.; Zhao, Y.; Schiferl, D.; Zha, C.; Uchida, H.; Downs, R. Size-induced reduction of transition pressure and enhancement of bulk modulus of AlN Nanocrystals. J. Phys. Chem. B 2004, 108, 11506–11508. [Google Scholar] [CrossRef]
- Wang, Z.; Saxena, S.; Pischedda, V.; Liermann, H.; Zha, C. In situ X-ray diffraction study of the pressure-induced phase transformation in nanocrystalline CeO2. Phys. Rev. B 2001, 64, 012102. [Google Scholar] [CrossRef]
- Zvoriste-Walters, C.; Heathman, S.; Jovani-Abril, R.; Spino, J.; Janssen, A.; Caciuffo, R. Crystal size effect on the compressibility of nano-crystalline uranium dioxide. J. Nucl. Mater. 2013, 435, 123–127. [Google Scholar] [CrossRef]
- Bouras, K.; Schmerber, G.; Rinnert, H.; Aureau, D.; Park, H.; Ferblantier, G.; Colis, S.; Fix, T.; Park, C.; Kim, W.; et al. Structural, optical and electrical properties of Nd-doped SnO2 thin films fabricated by reactive magnetron sputtering for solar cell devices. Sol. Energy Mater. Sol. Cells 2016, 145, 134–141. [Google Scholar] [CrossRef]
- Wu, J.; Kuo, C. Ultraviolet photodetectors made from SnO2 nanowires. Thin Solid Film. 2009, 517, 3870–3873. [Google Scholar] [CrossRef]
- Tsai, M.; Bierwagen, O.; Speck, J. Epitaxial Sb-doped SnO2 and Sn-doped In2O3 transparent conducting oxide contacts on GaN-based light emitting diodes. Thin Solid Film. 2016, 605, 186–192. [Google Scholar] [CrossRef]
- Ogale, S.; Choudhary, R.; Buban, J.; Lofland, S.; Shinde, S.; Kale, S.; Kulkarni, V.; Higgins, J.; Lanci, C.; Simpson, J.; et al. High Temperature Ferromagnetism with a Giant Magnetic Moment in Transparent Co-doped SnO2−δ. Phys. Rev. Lett. 2003, 91, 077205. [Google Scholar] [CrossRef] [PubMed]
- Tadeev, A.; Delabouglise, G.; Labeau, M. Influence of Pd and Pt additives on the microstructural and electrical properties of SnO2-based sensors. Mater. Sci. Eng. B 1998, 57, 76–83. [Google Scholar] [CrossRef]
- Chandra, A.; Kalpana, D.; Thangadurai, P.; Ramasamy, S. Synthesis and characterization of nanocrystalline SnO2 and fabrication of lithium cell using nano-SnO2. J. Power Sources 2002, 107, 138–141. [Google Scholar] [CrossRef]
- Xu, T.; Jiang, M.; Wan, P.; Tang, K.; Shi, D.; Kan, C. Bifunctional ultraviolet light-emitting/detecting device based on a SnO2 microwire/p-GaN heterojunction. Photonics Res. 2021, 9, 2475–2485. [Google Scholar] [CrossRef]
- Haines, J.; Leger, J. X-ray diffraction study of the phase transitions and structural evolution of tin dioxide at high pressure: Relationships between structure types and implications for other rutile-type dioxides. Phys. Rev. B 1997, 55, 11144. [Google Scholar] [CrossRef]
- Shieh, S.; Kubo, A.; Duffy, T.; Prakapenka, V.; Guoyin, G. High pressure phases in SnO2 to 117 GPa. Phys. Rev. B 2006, 73, 14105. [Google Scholar] [CrossRef]
- Parlinski, K.; Kawazoe, Y. Ab Initio study of phonons in the rutile structure of SnO2 under pressure. Eur. Phys. J. B 2000, 13, 679–683. [Google Scholar] [CrossRef]
- Hassan, F.; Alaeddine, A.; Zoaeter, M.; Rachidi, I. First-principles investigation of SnO2 at high pressure. Int. J. Mod. Phys. B 2005, 19, 4081–4092. [Google Scholar] [CrossRef]
- Gracia, L.; Beltran, A.; Andres, J. Characterization of high-pressure structures and phase transformations in SnO2. A density functional theory study. J. Phys. Chem. B 2007, 111, 6479–6485. [Google Scholar] [CrossRef] [PubMed]
- Casali, R.; Lasave, J.; Caravaca, M.; Koval, S.; Ponce, C.; Migoni, R. Ab initio and shell model studies of structural, thermoelastic and vibrational properties of SnO2 under pressure. J. Phys. Condens. Matter 2013, 25, 135404. [Google Scholar] [CrossRef]
- Yang, L.; Weiliu, F.; Yanlu, L.; Wei, L.; Zhao, X. Pressure induced ferroelastic phase transition in SnO2 from density functional theory. J. Chem. Phys. 2014, 140, 164706. [Google Scholar] [CrossRef] [PubMed]
- Hellwig, H.; Goncharov, A.; Gregoryanz, E.; Mao, H.; Hemley, R. Brillouin and Raman spectroscopy of the ferroelastic rutile-to-CaCl2 transition in SnO2 at high pressure. Phys. Rev. B 2003, 67, 174110. [Google Scholar] [CrossRef]
- Garg, A. Pressure induced volume anomaly and structural phase transition in nanocrystalline SnO2. Phys. Status Solidi B 2014, 251, 1380–1385. [Google Scholar] [CrossRef]
- Jiang, J.; Gerward, L.; Olsen, J. Pressure induced phase transformation in nanocrystal SnO2. Scr. Mater. 2001, 44, 1983–1986. [Google Scholar] [CrossRef]
- He, Y.; Liu, J.; Chen, W.; Wang, Y.; Wang, H.; Zeng, Y.; Zhang, G.; Wang, L.; Liu, J.; Hu, T.; et al. High pressure behavior of SnO2 nanocrystals. Phys. Rev. B 2005, 72, 212102. [Google Scholar] [CrossRef]
- Grinblat, F.; Ferrari, S.; Pampillo, L.; Saccone, F.; Errandonea, D.; Santamaria-Perez, D.; Segura, A.; Vilaplana, R.; Popescu, C. Compressibility and structural behavior of pure and Fe-doped SnO2 nanocrystals. Sol. State Sci. 2017, 64, 91–98. [Google Scholar] [CrossRef]
- Ferrari, S.; Bilovol, V.; Pampillo, L.; Grinblat, F.; Saccone, F.; Errandonea, D. Characterization of V-doped SnO2 nanoparticles at ambient and high pressures. Mater. Res. Express 2018, 5, 125005. [Google Scholar] [CrossRef]
- Ferrari, S.; Pampillo, L.; Saccone, F. Magnetic properties and environment sites in Fe doped SnO2 nanoparticles. Mater. Chem. Phys. 2016, 177, 206–212. [Google Scholar] [CrossRef]
- Hazen, R.; Finger, L. Bulk moduli and high-pressure crystal structures of rutile-type compounds. J. Phys. Chem. Solids 1981, 42, 143–151. [Google Scholar] [CrossRef]
- Bauer, W. Rutile type compounds. V. Refinements of MnO2 and MgF2. Acta Crystallogr. B 1976, 32, 2200–2204. [Google Scholar] [CrossRef]
- Zhang, Z.; Zhou, F.; Lavernia, E. On the analysis of grain size in bulk nanocrystalline materials via X-ray diffraction. Metall. Mater. Trans. A 2003, 34, 1349–1355. [Google Scholar] [CrossRef]
- Chang, Y.Y.; Tsai, Y.W.; Weng, S.C.; Chen, S.L.; Chang, S.L. Integrated optical chip for a high-resolution, single-resonance-mode X-ray monochromator system. Opt. Lett. 2021, 46, 416–419. [Google Scholar] [CrossRef] [PubMed]
- Klotz, S.; Chervin, J.; Munsch, P.; Marchand, G. Hydrostatic limits of 11 pressure transmitting media. J. Phys. D Appl. Phys. 2009, 42, 075413. [Google Scholar] [CrossRef]
- Dewaele, A.; Loubeyre, P.; Mezouar, M. Equation of state of six metals above 94 GPa. Phys. Rev. B 2004, 70, 094112. [Google Scholar] [CrossRef]
- Rodriguez-Carvajal, J. Recent advances in in magnetic structure determination by neutron powder diffraction. Phys. B 1993, 192, 55–69. [Google Scholar] [CrossRef]
- Liu, X.F.; Gong, W.M.; Iqbal, J.; He, B.; Yu, R.H. Structural defects-mediated room-temperature ferromagnetism in Co-doped SnO2 insulating films. Thin Solid Film. 2009, 517, 6091–6095. [Google Scholar] [CrossRef]
- Gao, Y.; He, J.; Guo, J. Effect of co-doping and defects on electronic, magnetic, and optical properties in SnO2: A first-principles study. Phys. B 2022, 639, 413924. [Google Scholar] [CrossRef]
- Gonzalez-Platas, J.; Alvaro, M.; Nestola, F.; Angel, R. EosFit7-GUI: A new graphical user interface for equation of state calculations, analyses and teaching. J. Appl. Cryst. 2016, 49, 1377–1382. [Google Scholar] [CrossRef]
- Haines, J.; Leger, J.; Schulte, O. The high-pressure phase transition sequence from the rutile-type through to the cotunnite-type structure in PbO2. J. Phys. Condens. Matter 1996, 8, 1631. [Google Scholar] [CrossRef]
- Ross, N.; Shu, J.; Hazen, R.; Gasparik, T. High-pressure crystal chemistry of stishovite. Am. Mineral. 1990, 75, 739–747. [Google Scholar]
- Hyde, B.G. The effect of non-bonded, anion-anion interactions on the CaCl2/rutile transformation and on the bond lengths in the rutile type. Z. Krist. 1987, 179, 205–213. [Google Scholar] [CrossRef]
- Errandonea, D.; Muñoz, A.; Gonzalez-Platas, J. Comment on high pressure X-ray diffraction study of YBO3/ Eu3+, GdBO3, and EuBO3: Pressure induced amorphization in GdBO3. J. Appl. Phys. 2014, 115, 216101. [Google Scholar] [CrossRef]
- Anzellini, S.; Errandonea, D.; MacLeod, S.; Botella, P.; Daisenberger, D.; De’Ath, M.; Gonzalez-Platas, J.; Ibáñez, J.; McMahon, M.; Munro, K.; et al. Phase diagram of calcium at high pressure and high temperature. Phys. Rev. Mater. 2018, 2, 083608. [Google Scholar] [CrossRef]
- Bouabdalli, E.M.; El Jouad, M.; Garmim, T.; Louardi, H.; Hartiti, M.; Monkade, M.; Touhtouh, S.; Hajjaji, A. Elaboration and characterization of Ni and Al co-doped SnO2 thin films prepared by spray pyrolysis technique for photovoltaic applications. Mater. Sci. Eng. B 2022, 286, 116044. [Google Scholar] [CrossRef]
Figure 1.
Schematic view of (a) the tetragonal rutile-type structure of SnO2, space group P42/mnm, and (b) the high-pressure orthorhombic structure of SnO2, space group Pnnm (Sn+4 cations are in blue and O−2 anions are in red). In the figure, we include red, green, and blue arrows showing the directions of the unit-cell axes a, b, and c, respectively.

Figure 2.
The Rietveld profile refinement for the XRD pattern of the tetragonal rutile-type phase of nanocrystalline Co-doped SnO2 at 0.6 GPa and room temperature. The asterisk (*) is the (111) diffraction peak of copper used to determine pressure. The vertical bars indicate the calculated positions of diffraction peaks of the sample and copper (Cu). Miller indexes are shown in the figure.

Figure 3.
Room-temperature X-ray powder diffraction patterns of nanocrystalline Co-doped SnO2 at representative pressures. Pressures are indicated in the figure. The asterisks (*) denote the (111) diffraction peak of copper at each pressure. The diffractogram of the low-pressure phase at 0.6 GPa and that of the high-pressure phase at 14.2 GPa have been indexed with the tetragonal rutile-type and the orthorhombic CaCl2-type structure, respectively. Miller indexes are shown.

Figure 4.
Enhanced view of the regions of XRD patterns measured in nanocrystalline Co-doped SnO2 at 13.0, 14.2, and 20.2 GPa, highlighting the changes that evidence the phase transition discussed in the text.
Figure 4.
Enhanced view of the regions of XRD patterns measured in nanocrystalline Co-doped SnO2 at 13.0, 14.2, and 20.2 GPa, highlighting the changes that evidence the phase transition discussed in the text.

Figure 5.
The Rietveld profile refinement of the XRD pattern measured at 14.2 GPa and room temperature for the orthorhombic CaCl2-type phase of nanocrystalline Co-doped SnO2. The vertical bars indicate the calculated positions of diffraction peaks of sample. The contributions from the gasket and copper (Cu) are also indicated.

Figure 6.
Pressure dependence of lattice parameters of nanocrystalline Co-doped SnO2. Solid squares represent the tetragonal rutile-type phase and solid circles represent the orthorhombic CaCl2-type structure. Solid lines are linear fits to lattice parameters. Error bars are smaller than the size of the symbols. The unit-cell axes, a, b, and c are identified in the figure.

Figure 7.
Volume versus pressure data for nanocrystalline Co-doped SnO2. Solid squares represent the tetragonal rutile-type phase and solid circles represent the orthorhombic CaCl2-type structure. Solid lines represent the second-order Birch–Murnaghan fit to the data for both phases (see text for details). Error bars are smaller than the size of the symbols.


Table 1.
Bulk modulus determined for different phases of nanocrystalline of SnO2. We include results from this work and for the literature [17,18,25,27,28,29].
| Sample | Bulk Modulus (GPa) Rutile-Type SnO2 | Bulk Modulus (GPa) CaCl2-Type SnO2 | Ref. |
|---|---|---|---|
| Bulk | 205 | 204 | [18] |
| Bulk | 252 | ---- | [27] |
| Bulk | 205 | 204 | [17] |
| Nanocrystalline (5 nm) | 217 | --- | [25] |
| Nanocrystalline (3 nm) | 233 | --- | [27] |
| Nanocrystalline (30 nm) | 210 | 252 | [28] |
| Nanocrystalline Fe-doped (18 nm) | 213 | 256 | [28] |
| Nanocrystalline V-doped (13 nm) | 185 | -- | [29] |
| Nanocrystalline Co-doped (15 nm) | 213(9) | 228(9) | This work |
Disclaimer/Publisher’s Note: The statements, opinions and data contained in all publications are solely those of the individual author(s) and contributor(s) and not of MDPI and/or the editor(s). MDPI and/or the editor(s) disclaim responsibility for any injury to people or property resulting from any ideas, methods, instructions or products referred to in the content. |
© 2023 by the authors. Licensee MDPI, Basel, Switzerland. This article is an open access article distributed under the terms and conditions of the Creative Commons Attribution (CC BY) license (https://creativecommons.org/licenses/by/4.0/).
Share and Cite
MDPI and ACS Style
Panchal, V.; Pampillo, L.; Ferrari, S.; Bilovol, V.; Popescu, C.; Errandonea, D. Pressure-Induced Structural Phase Transition of Co-Doped SnO2 Nanocrystals. Crystals 2023, 13, 900. https://0-doi-org.brum.beds.ac.uk/10.3390/cryst13060900
AMA Style
Panchal V, Pampillo L, Ferrari S, Bilovol V, Popescu C, Errandonea D. Pressure-Induced Structural Phase Transition of Co-Doped SnO2 Nanocrystals. Crystals. 2023; 13(6):900. https://0-doi-org.brum.beds.ac.uk/10.3390/cryst13060900
Chicago/Turabian StylePanchal, Vinod, Laura Pampillo, Sergio Ferrari, Vitaliy Bilovol, Catalin Popescu, and Daniel Errandonea. 2023. "Pressure-Induced Structural Phase Transition of Co-Doped SnO2 Nanocrystals" Crystals 13, no. 6: 900. https://0-doi-org.brum.beds.ac.uk/10.3390/cryst13060900
Note that from the first issue of 2016, this journal uses article numbers instead of page numbers. See further details here.