Multiple Fault Location in a Photovoltaic Array Using Bidirectional Hetero-Associative Memory Network in Micro-Distribution Systems

Abstract
:
1. Introduction
2. Methodology
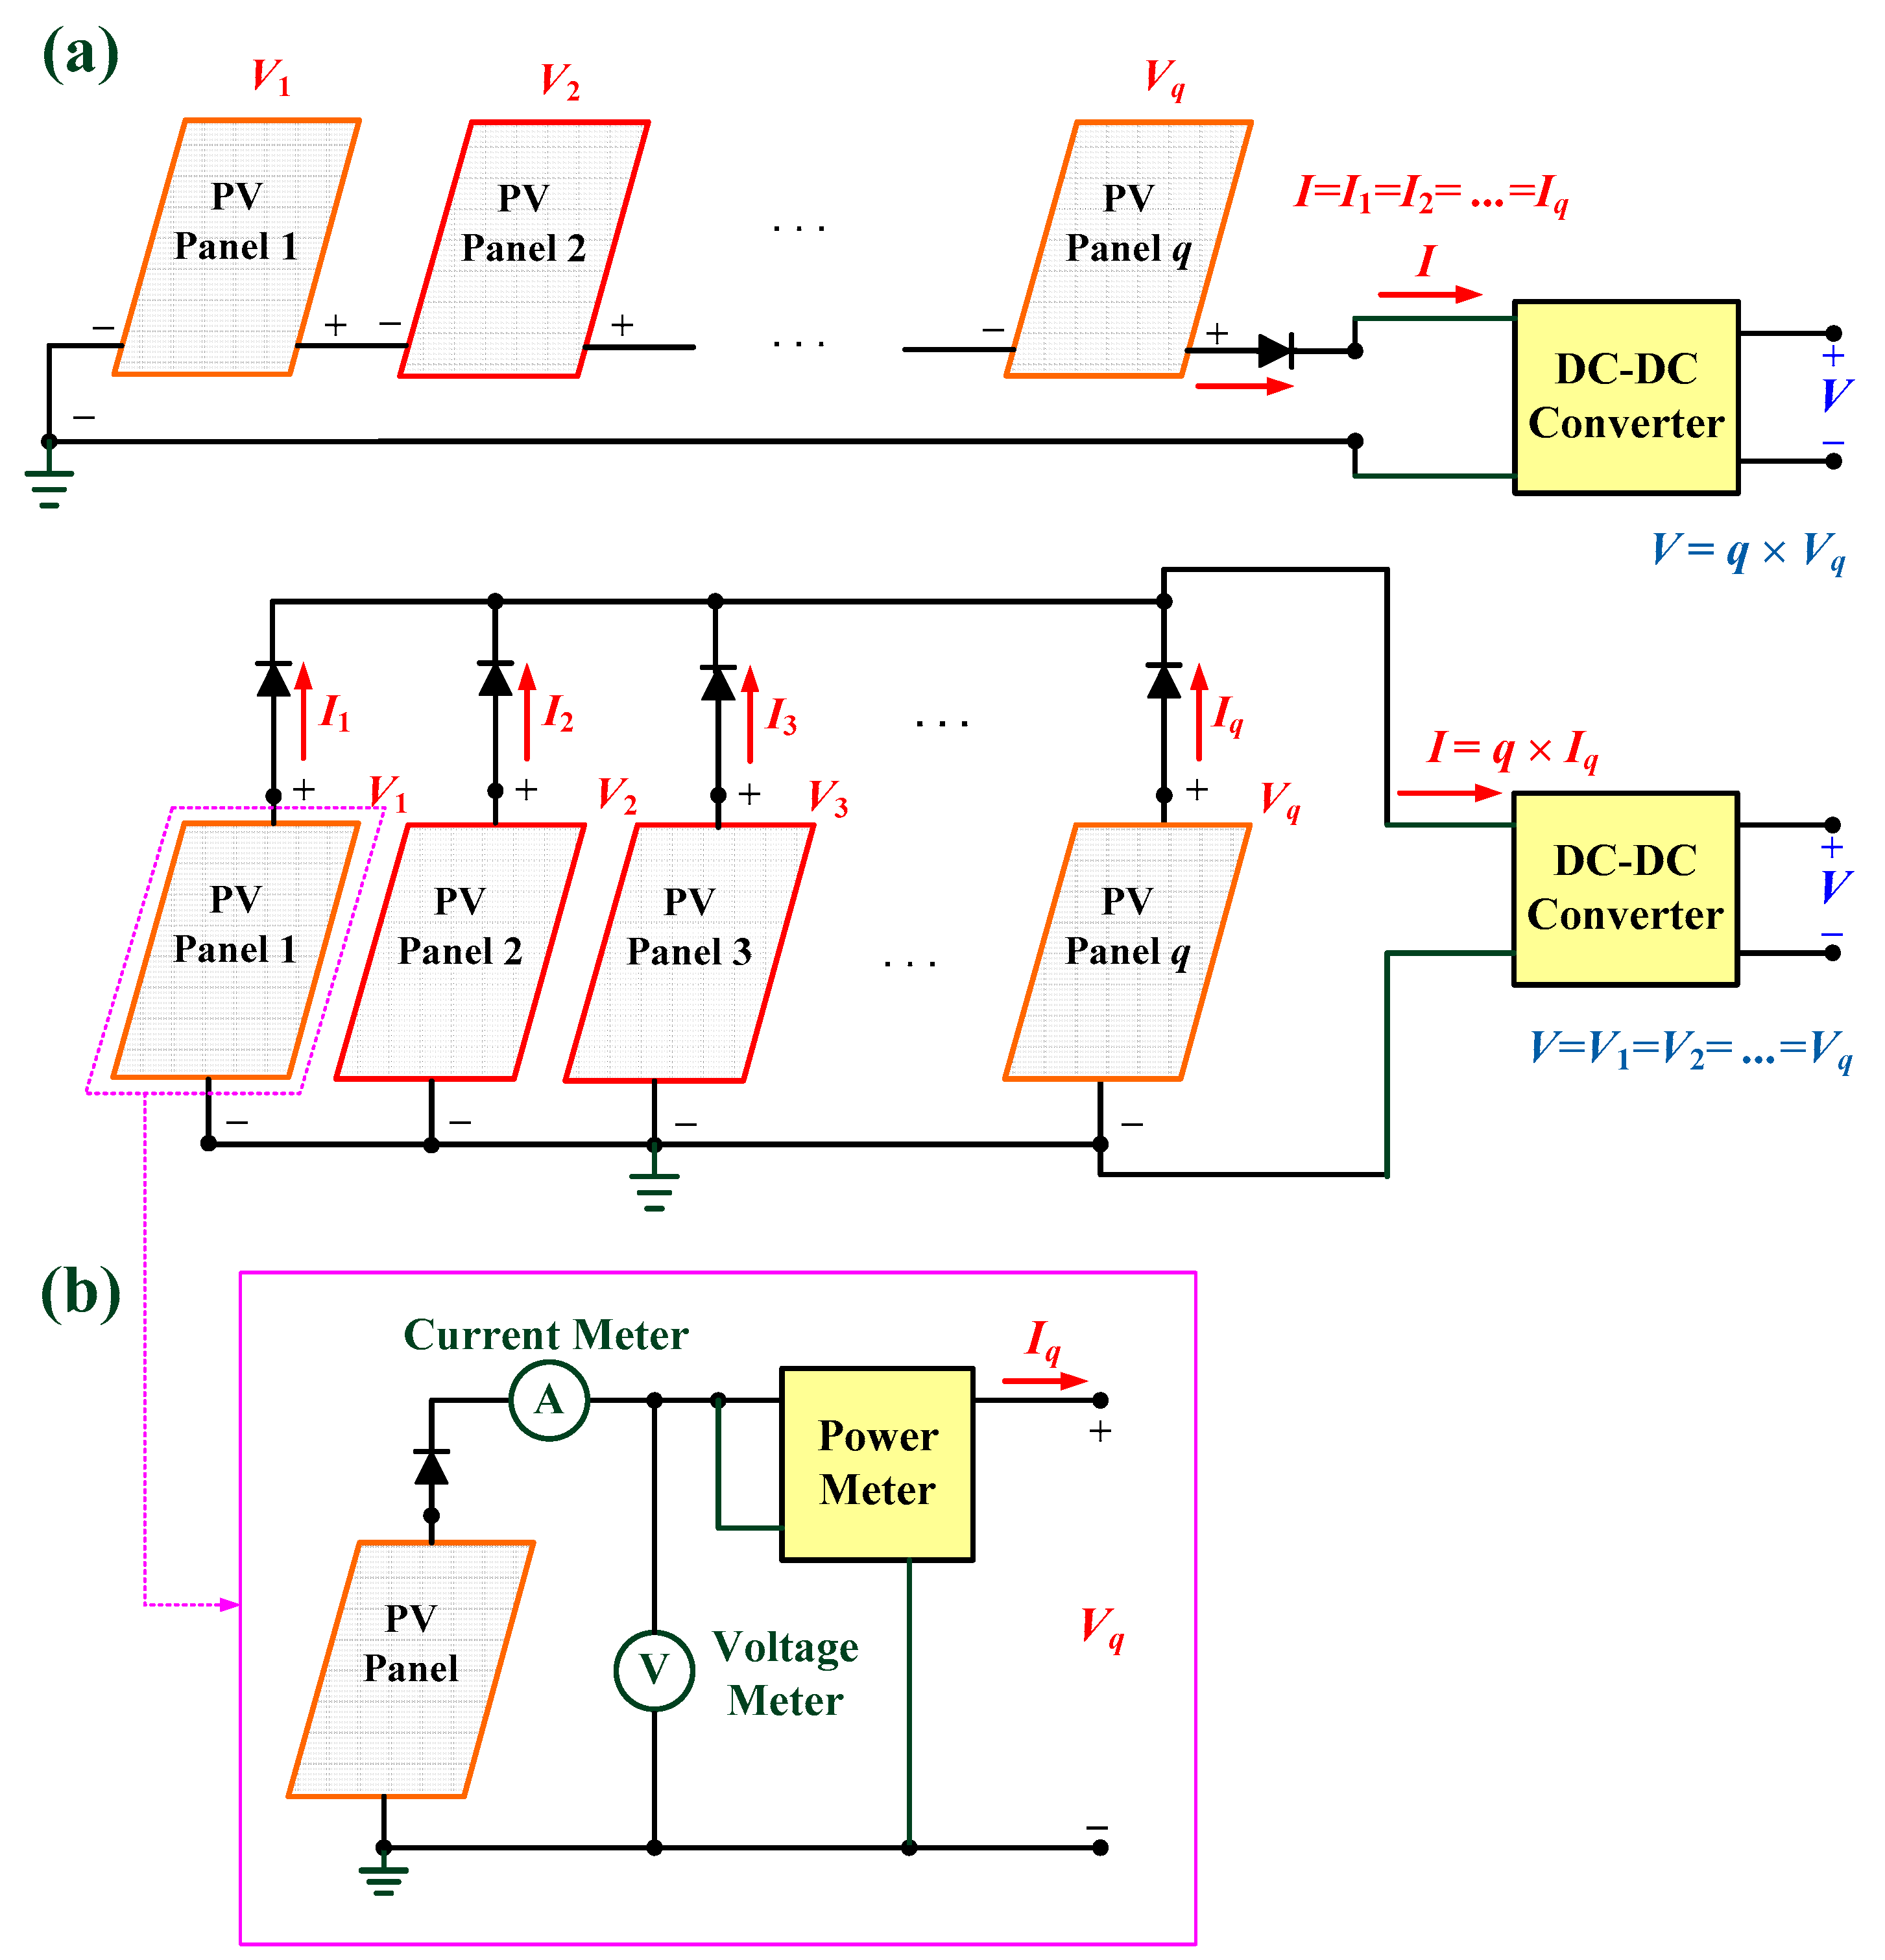
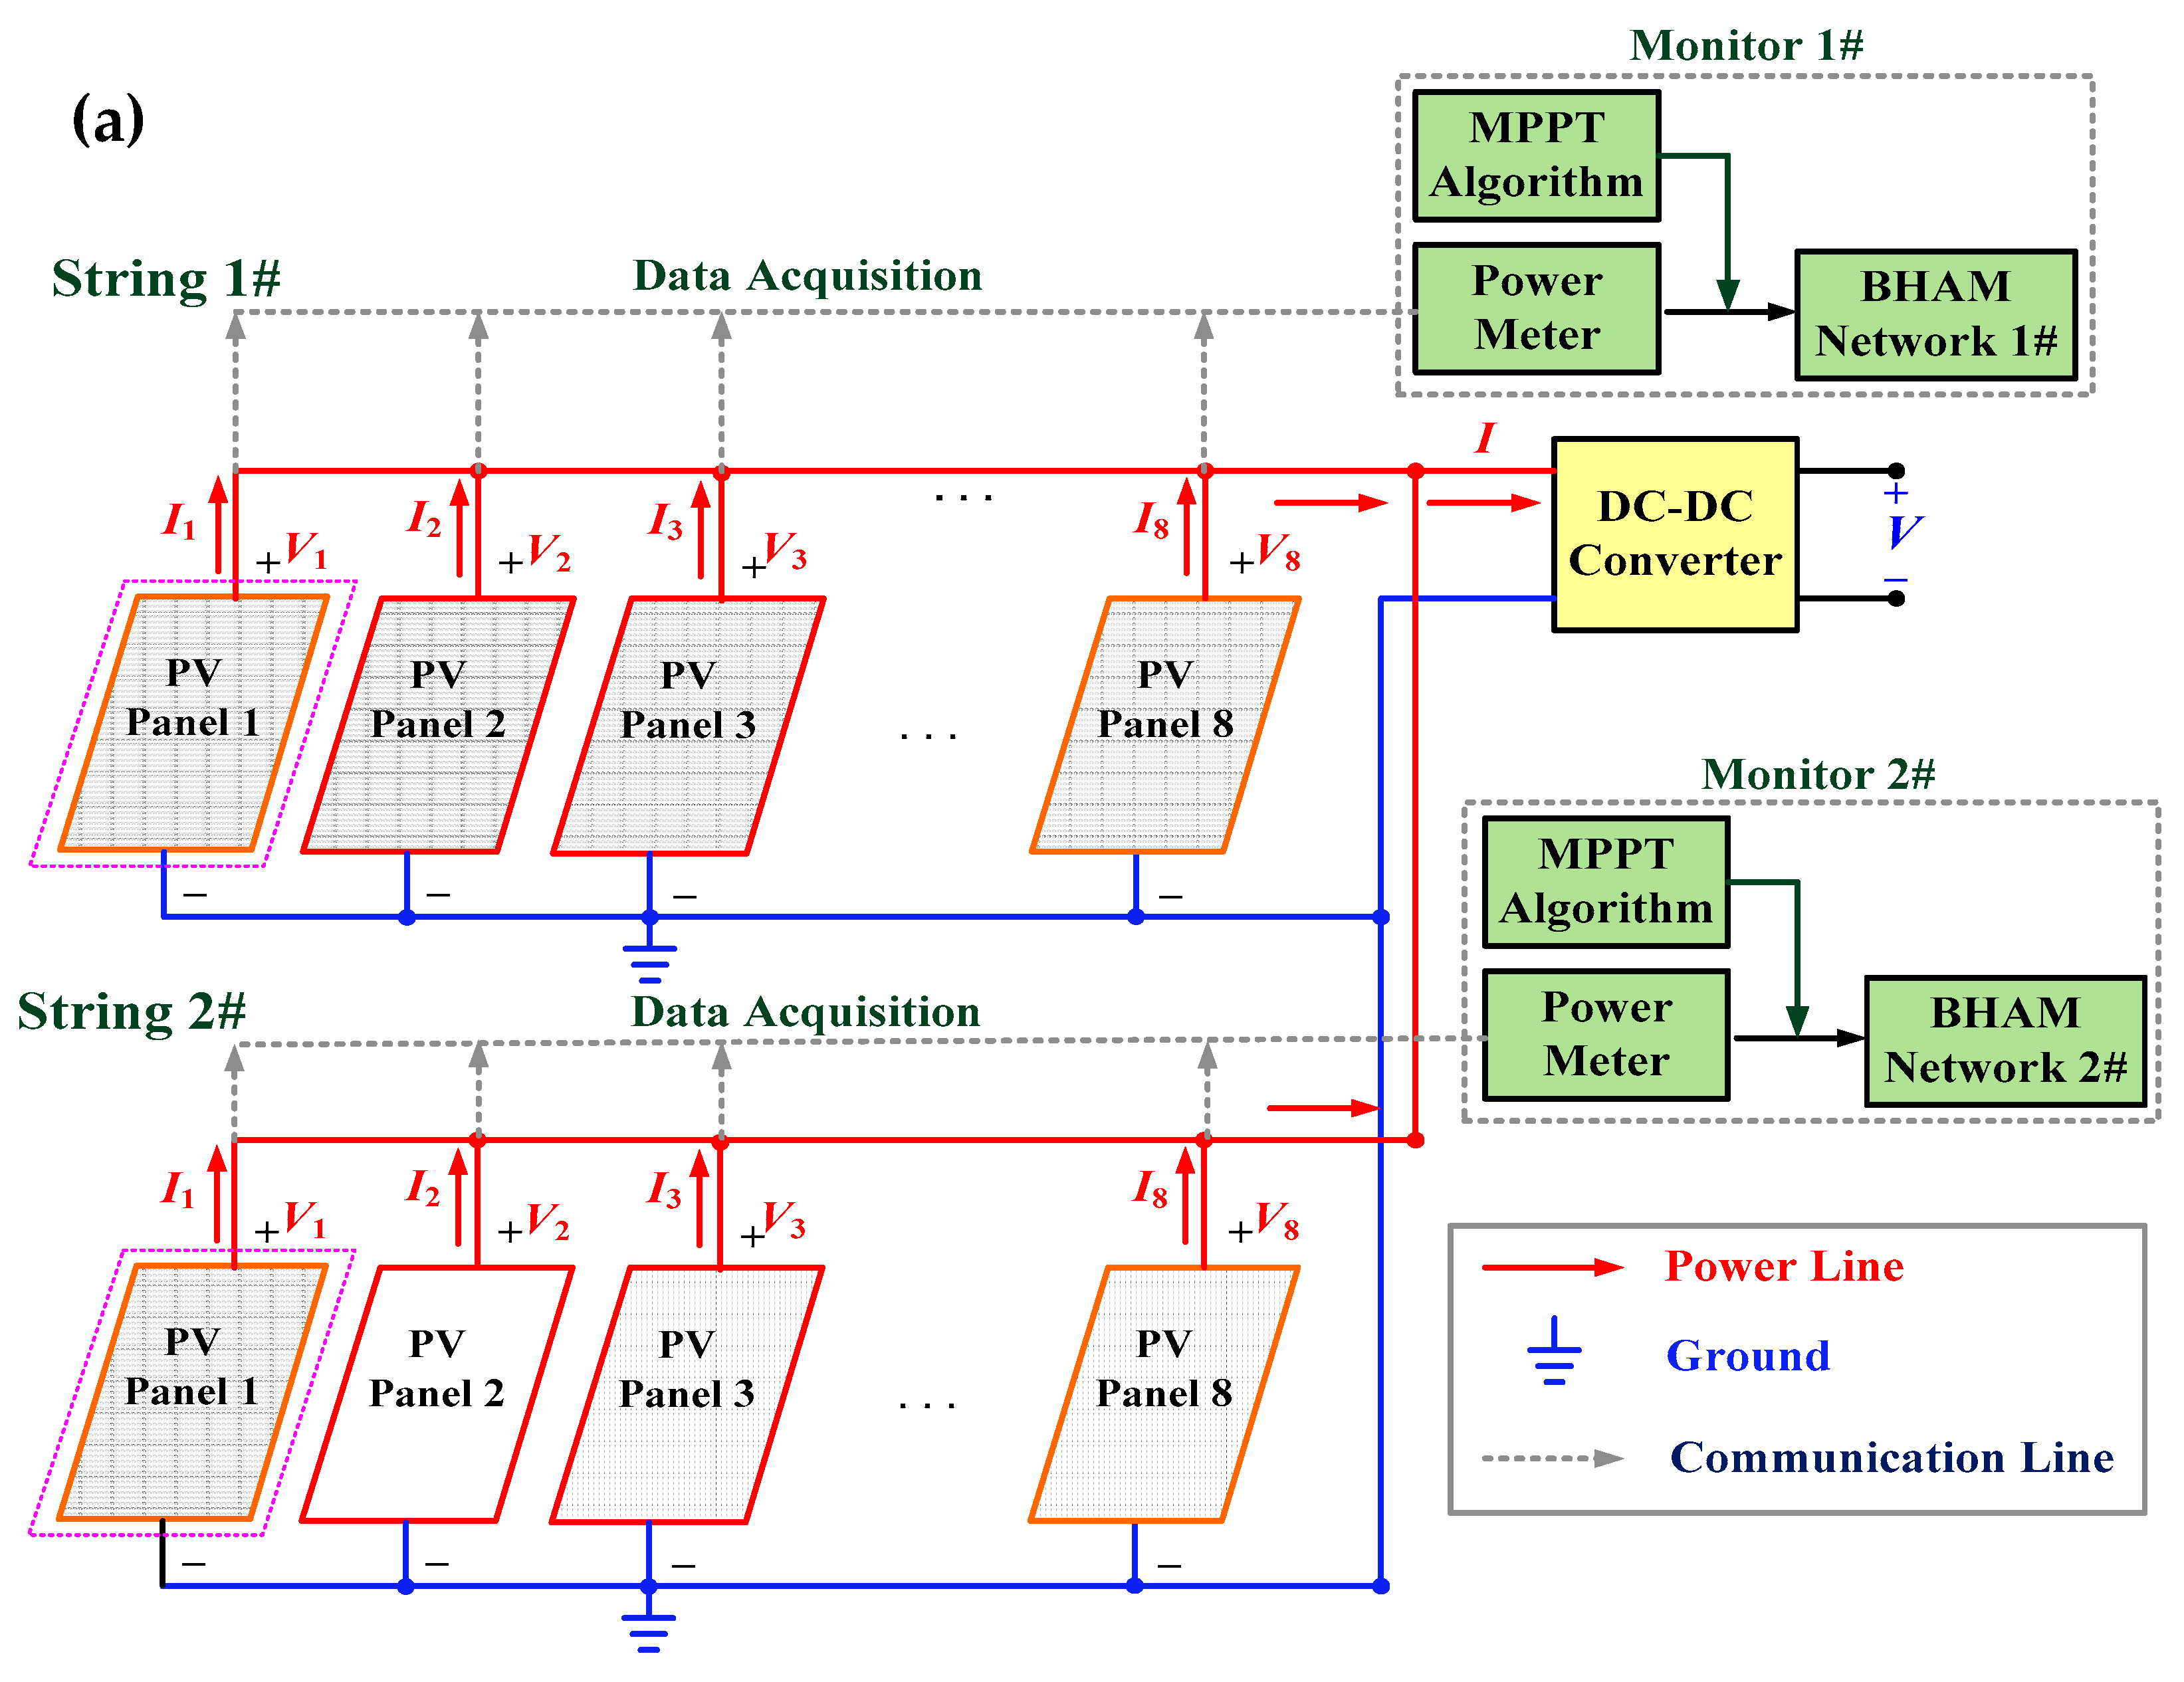
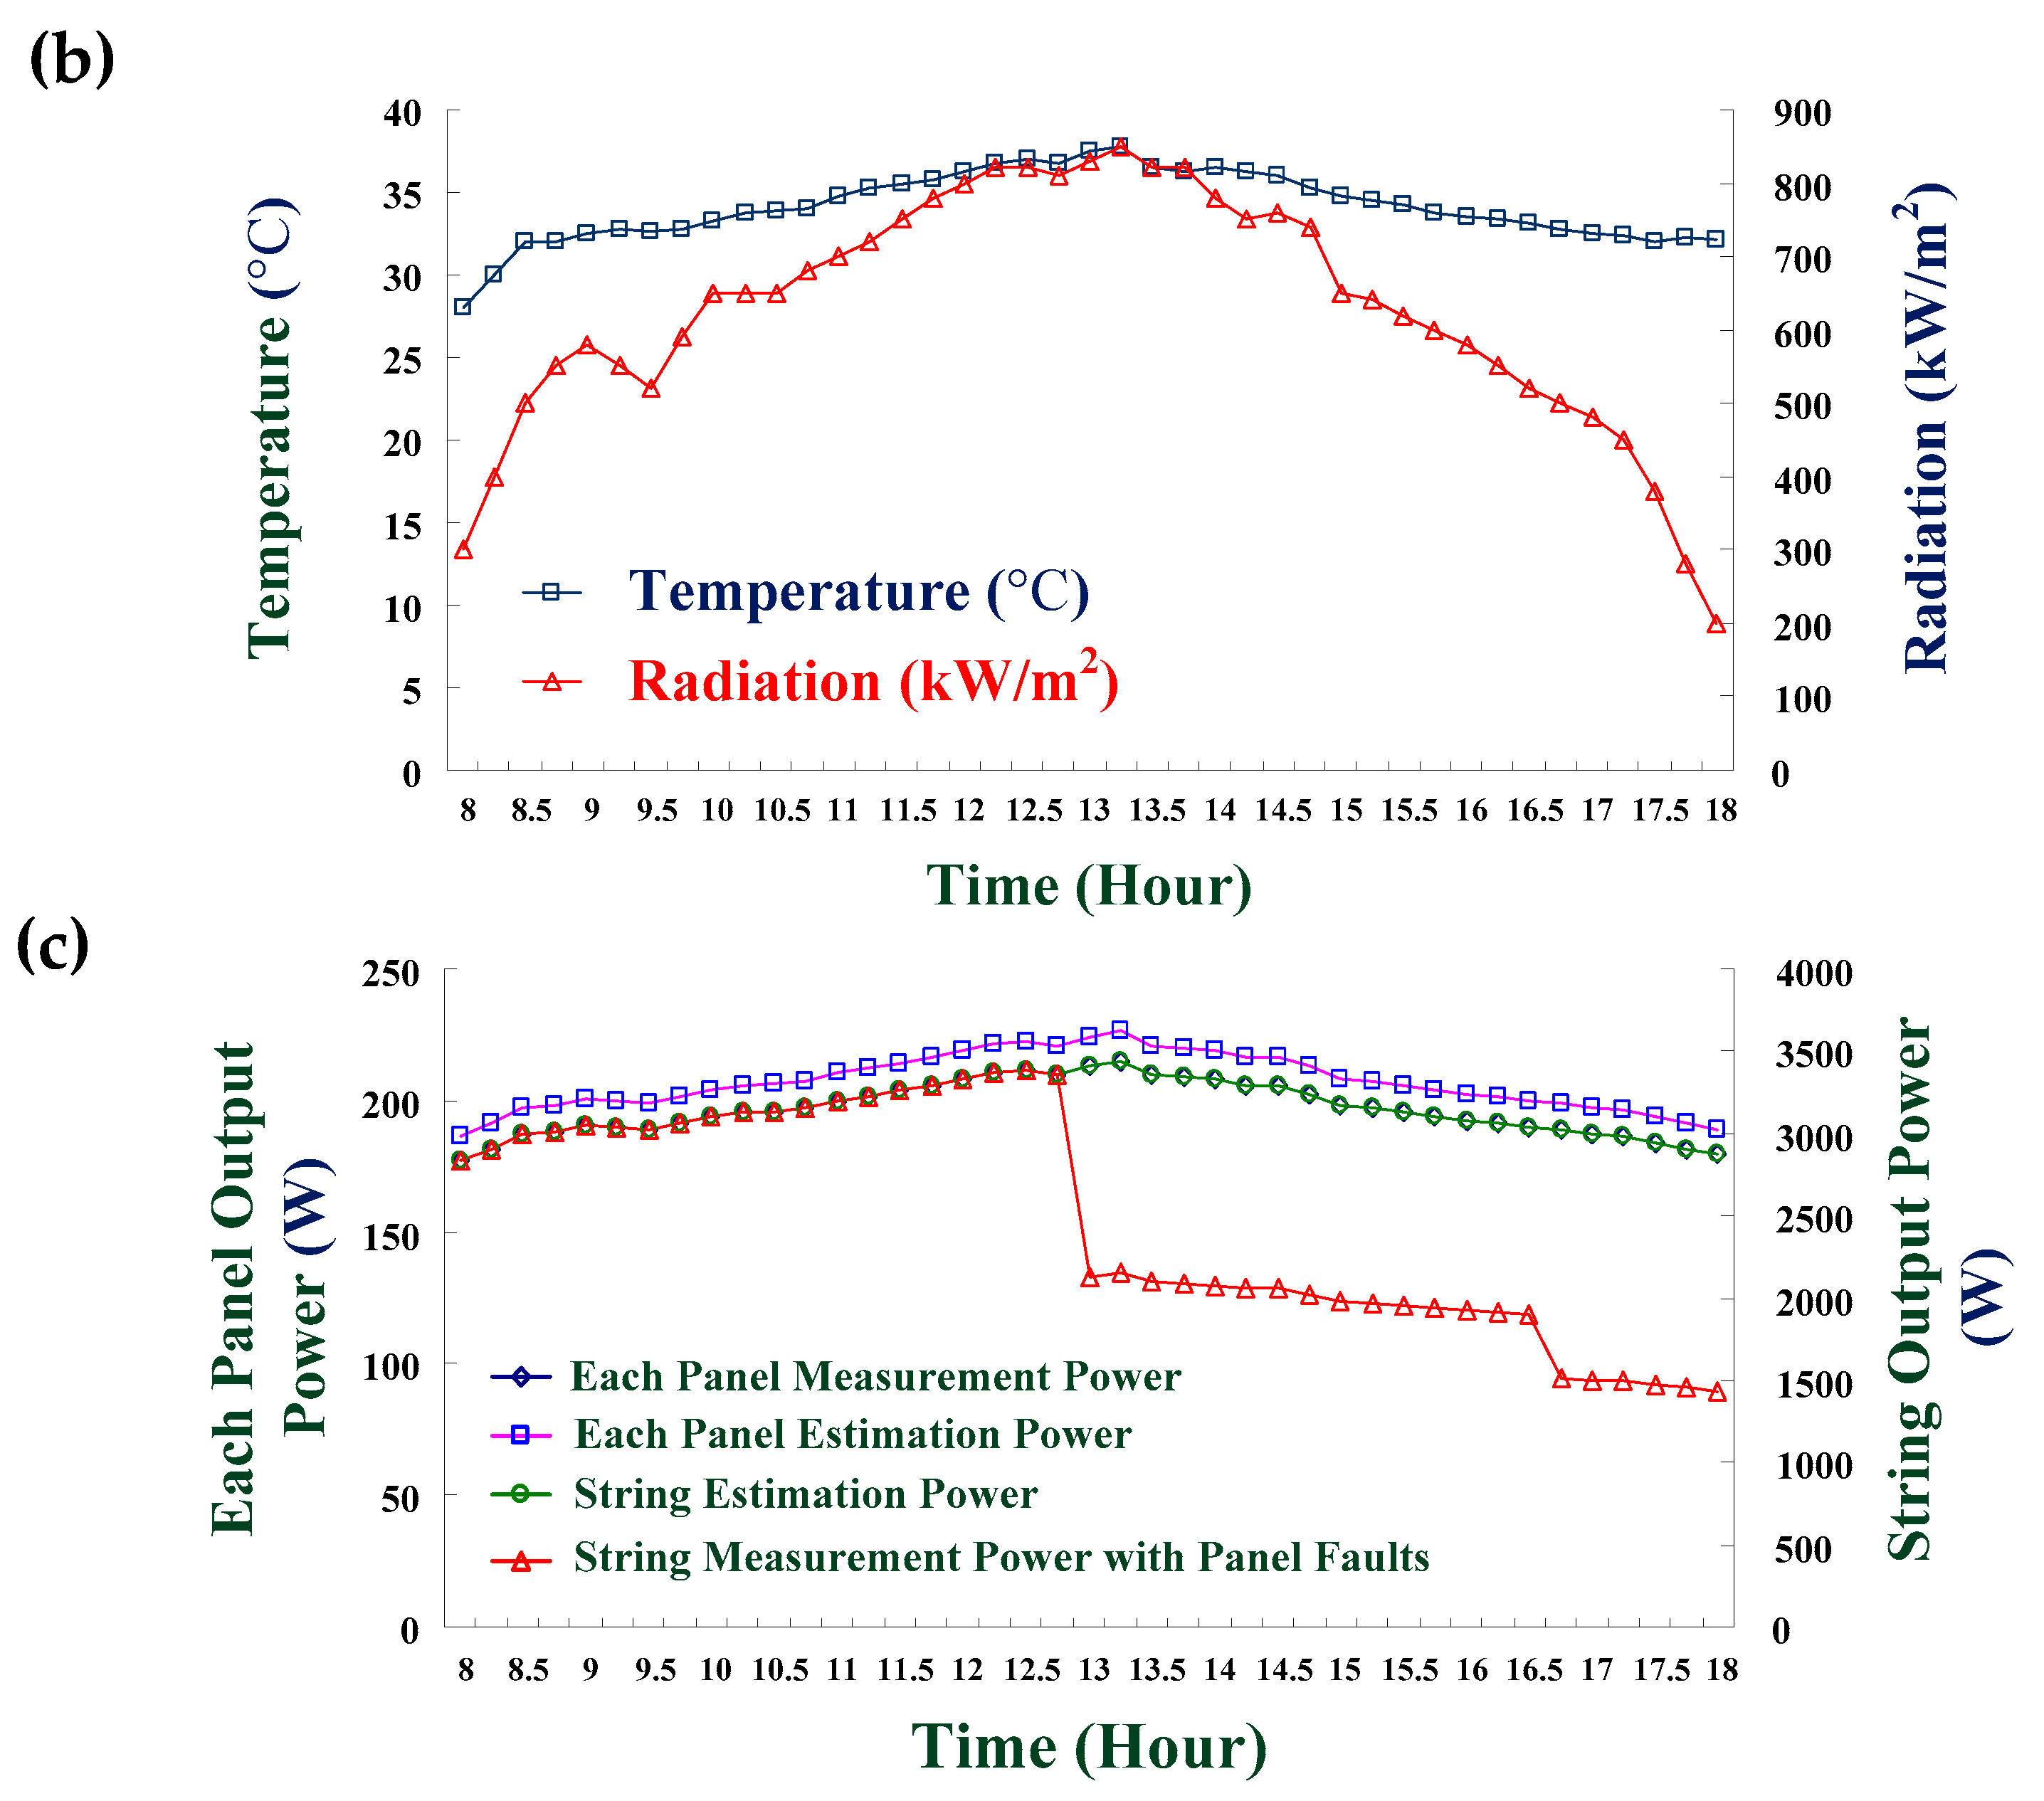
2.1. Maximum Output Power Estimation and Fault Feature Extraction
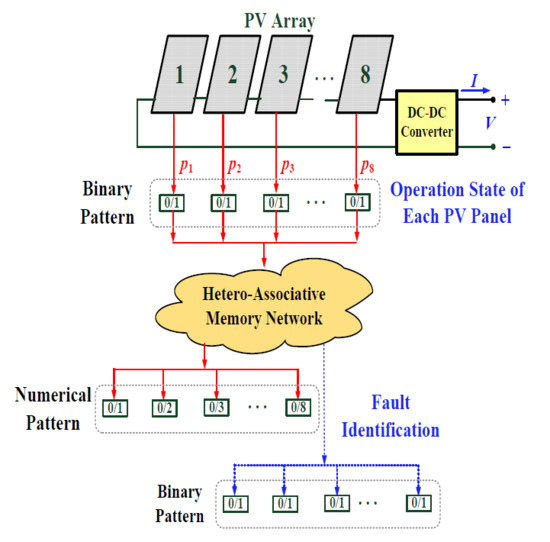
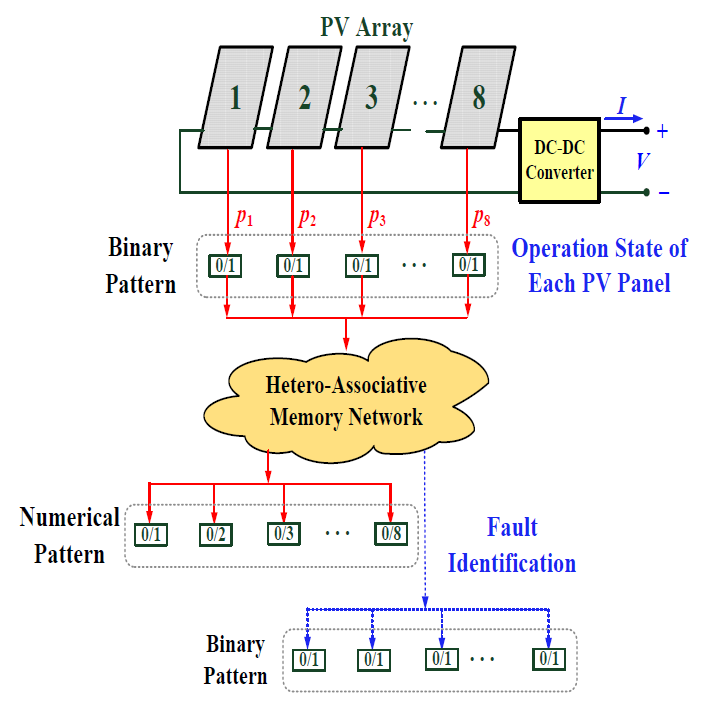
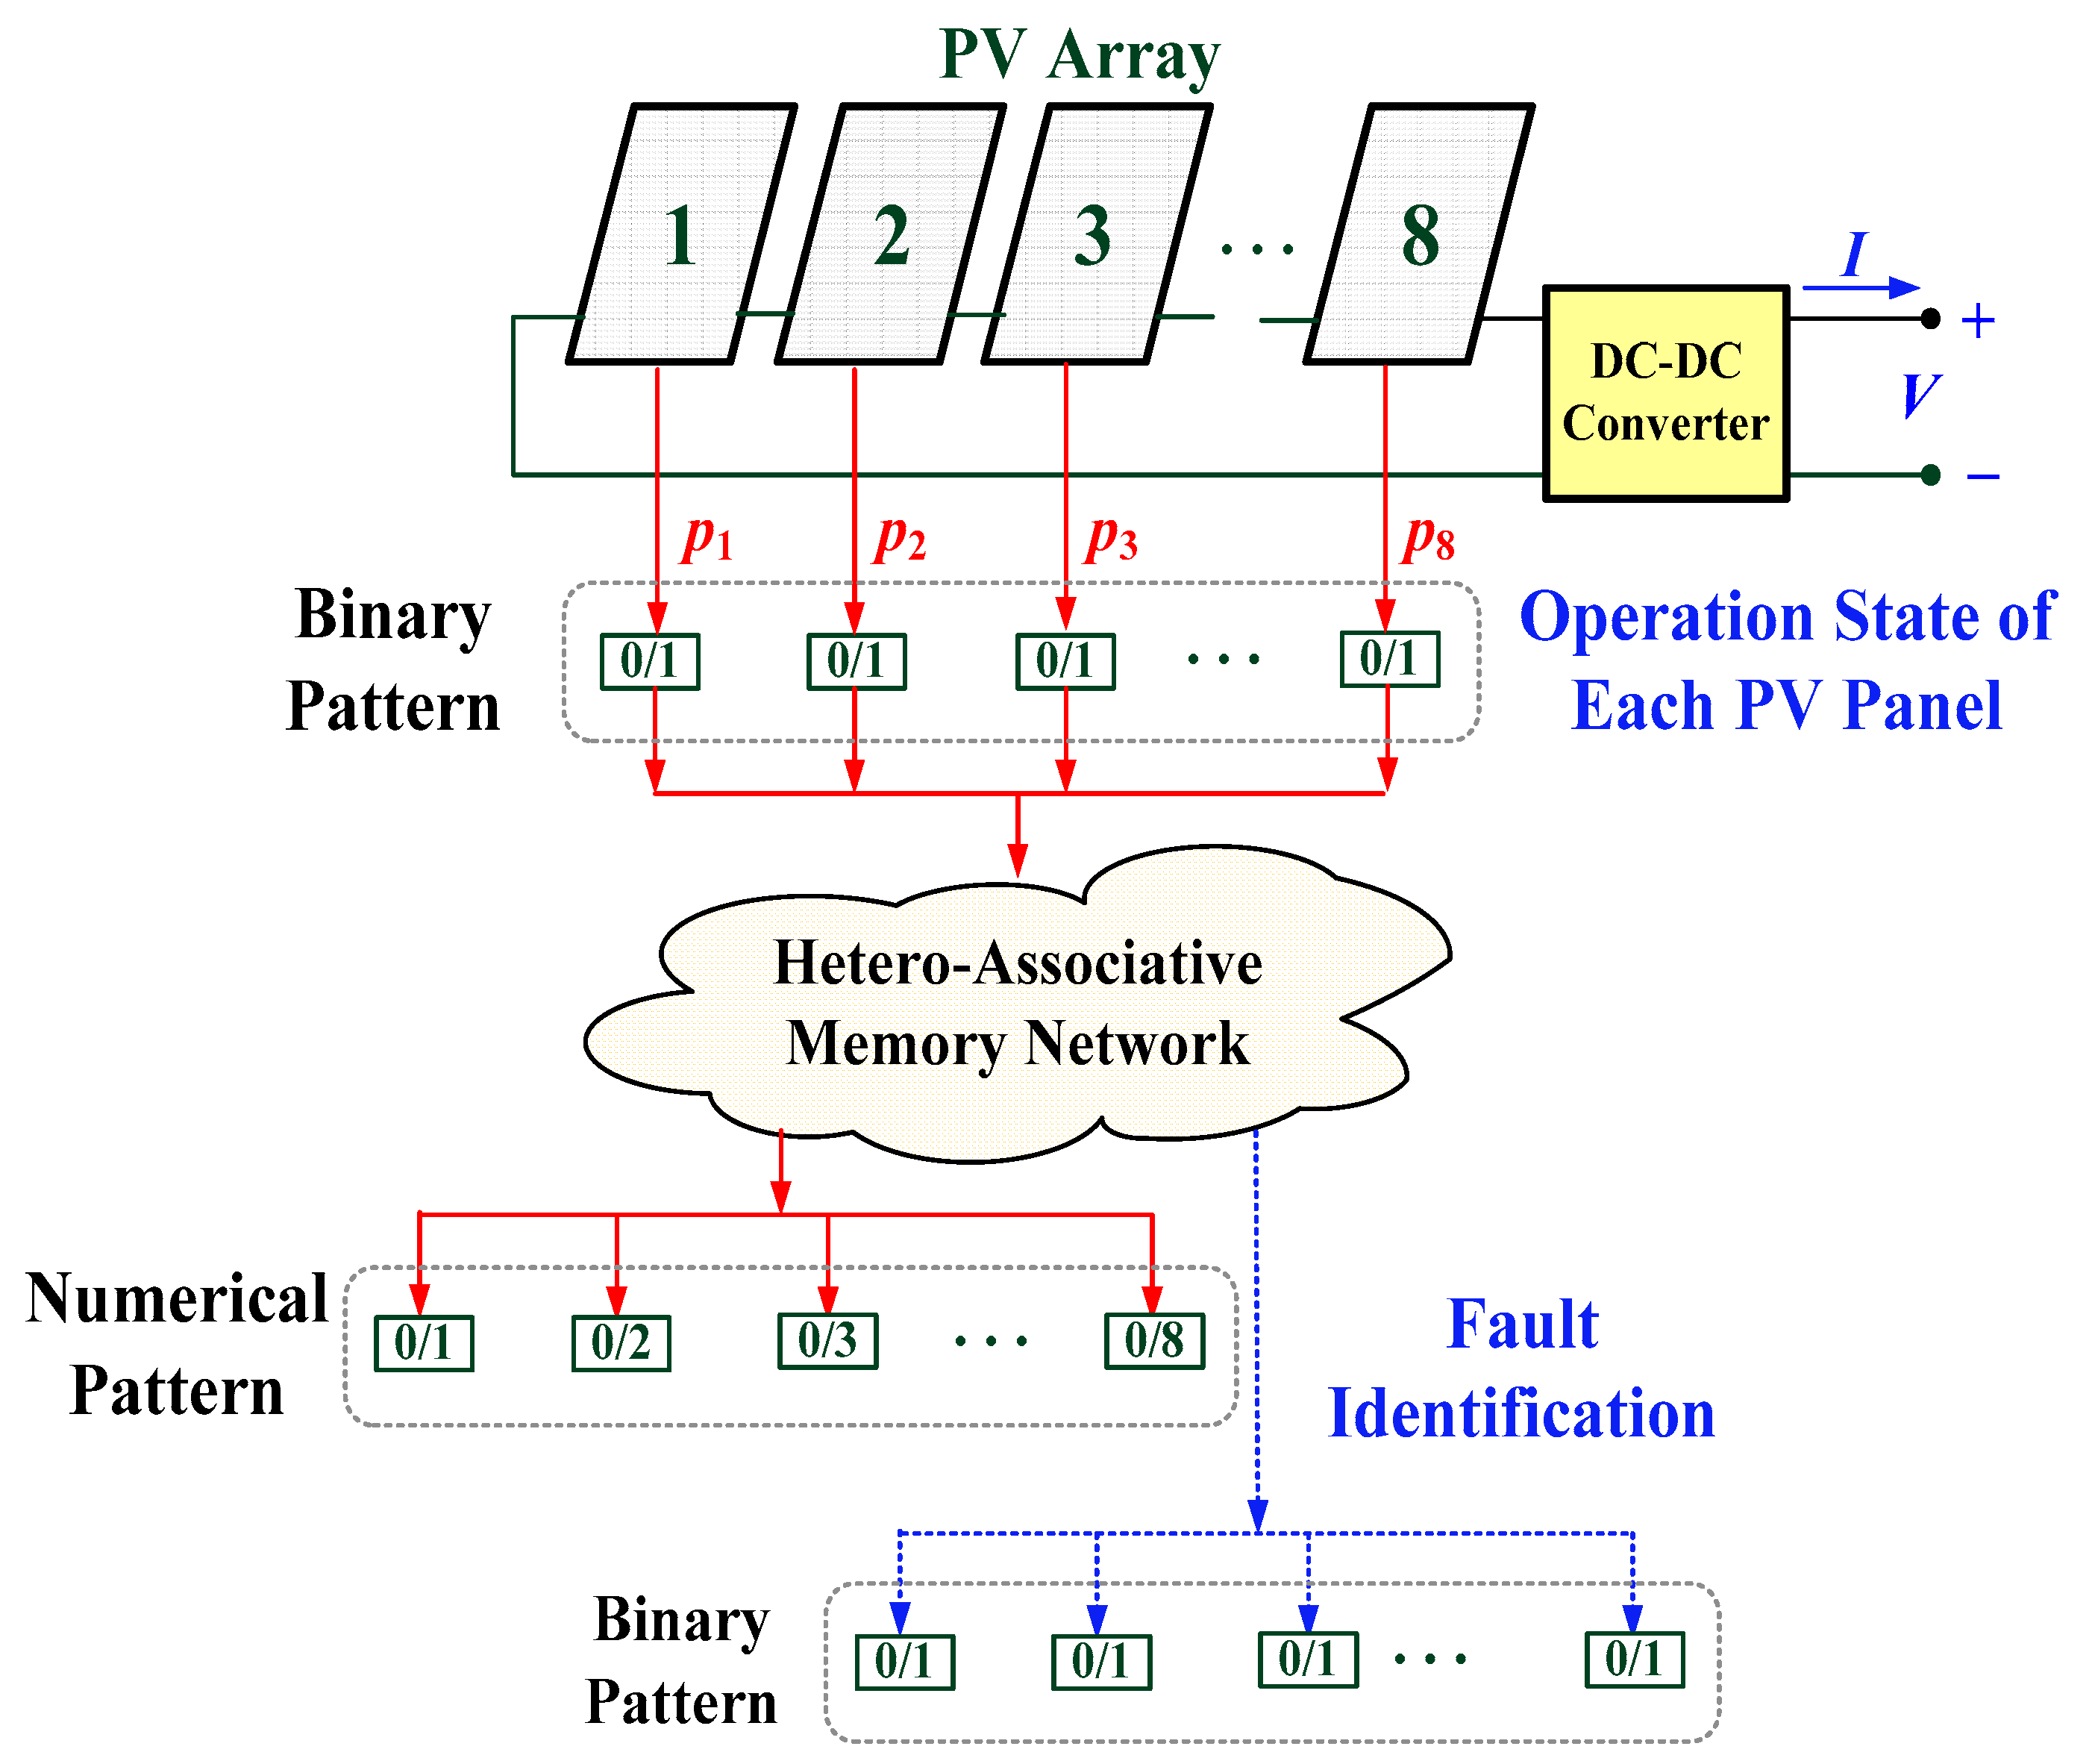
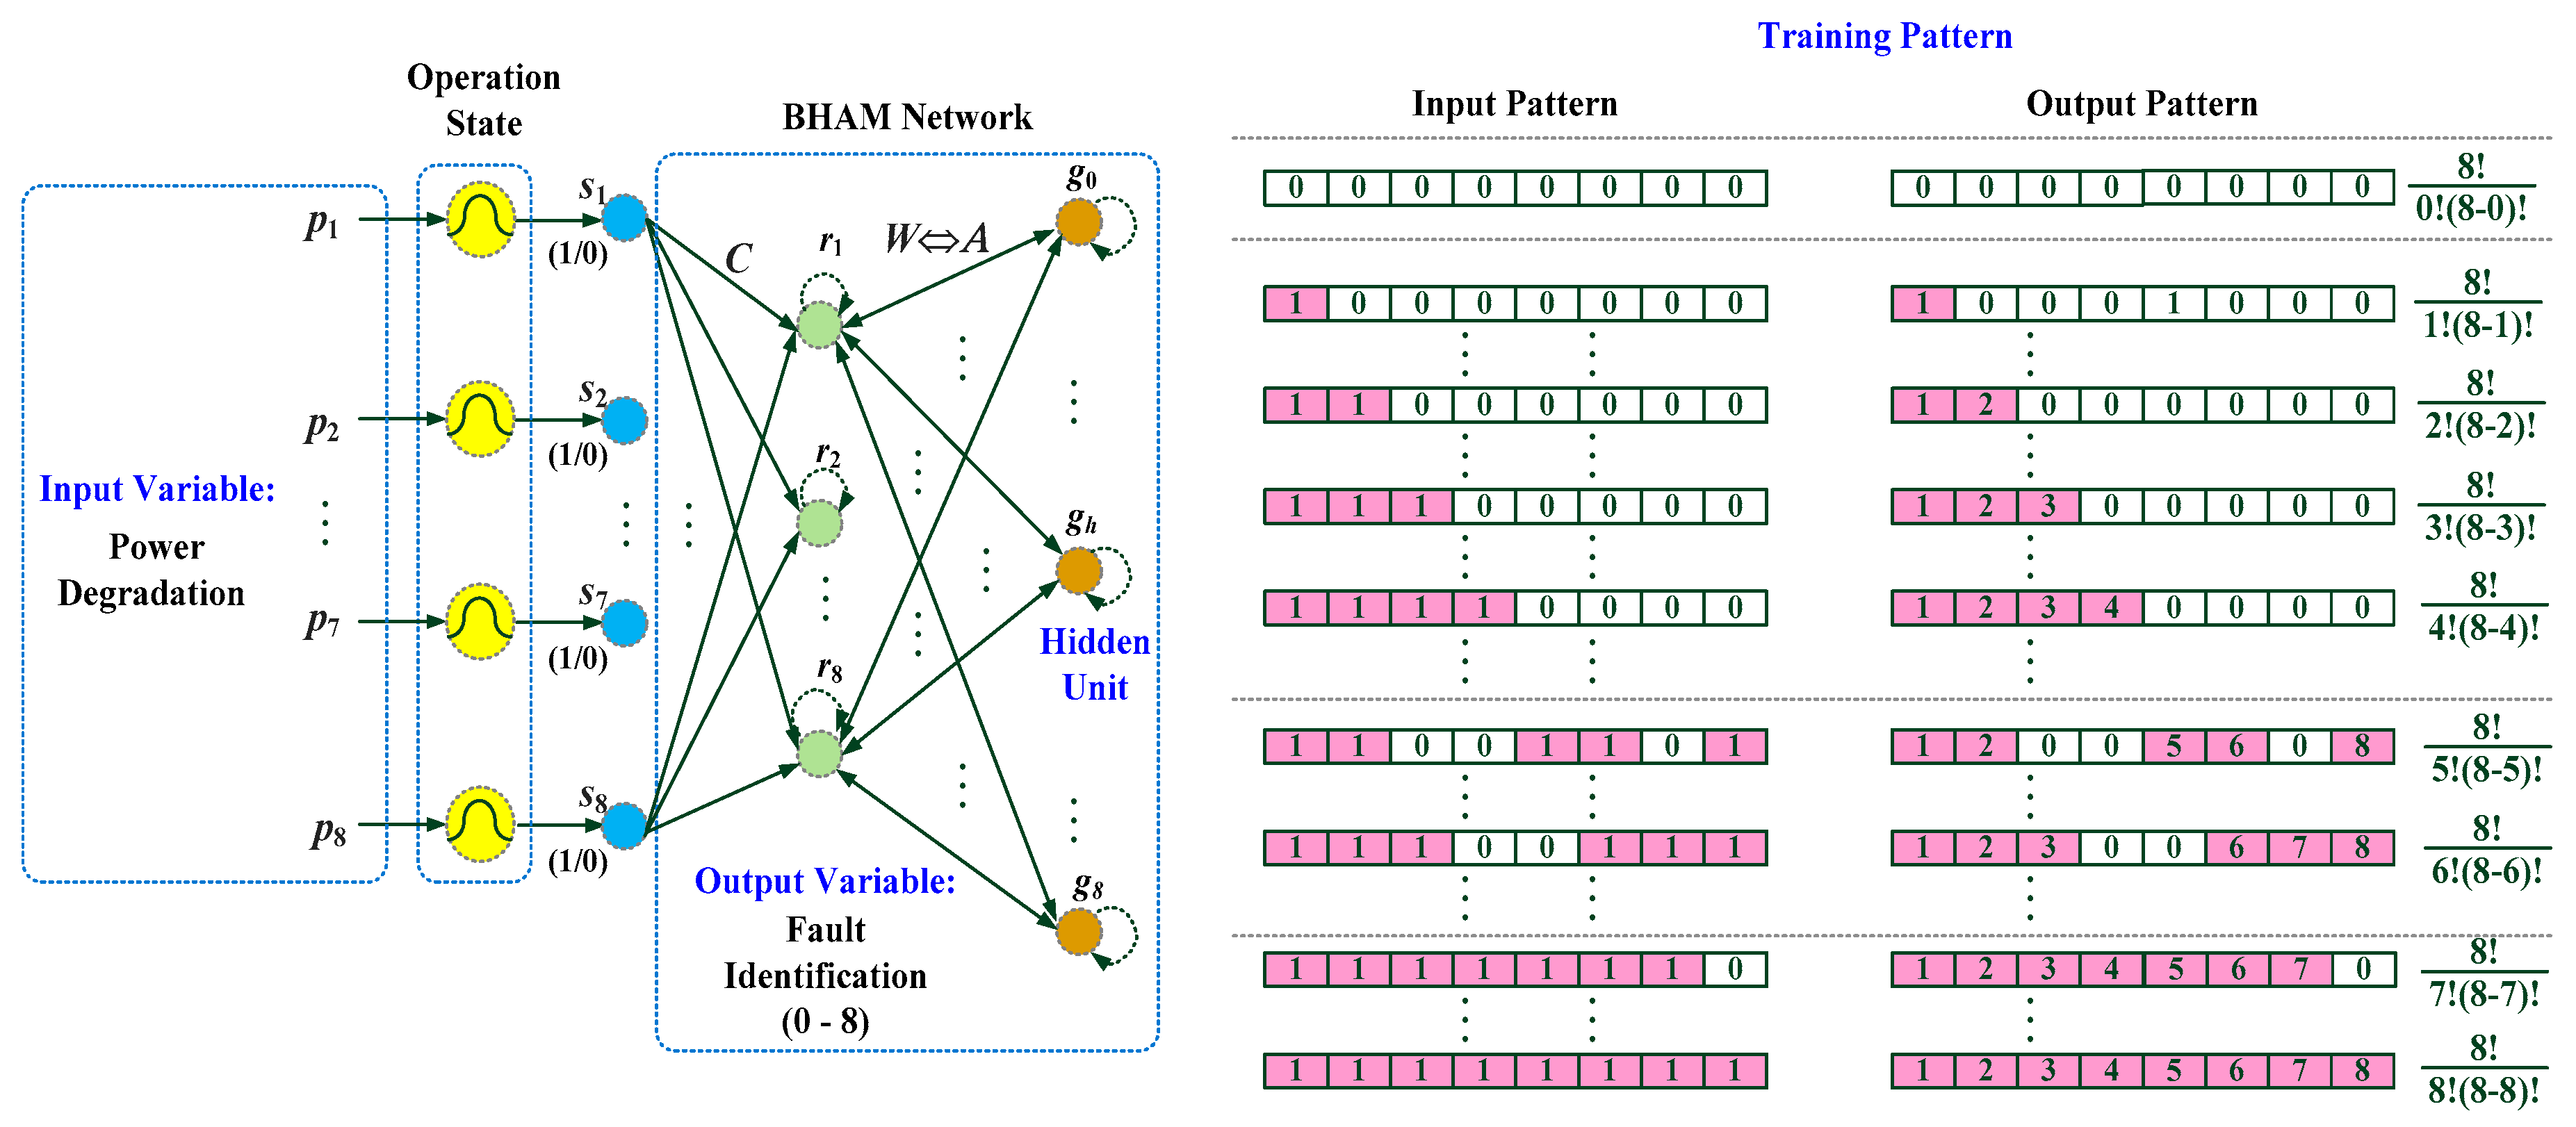
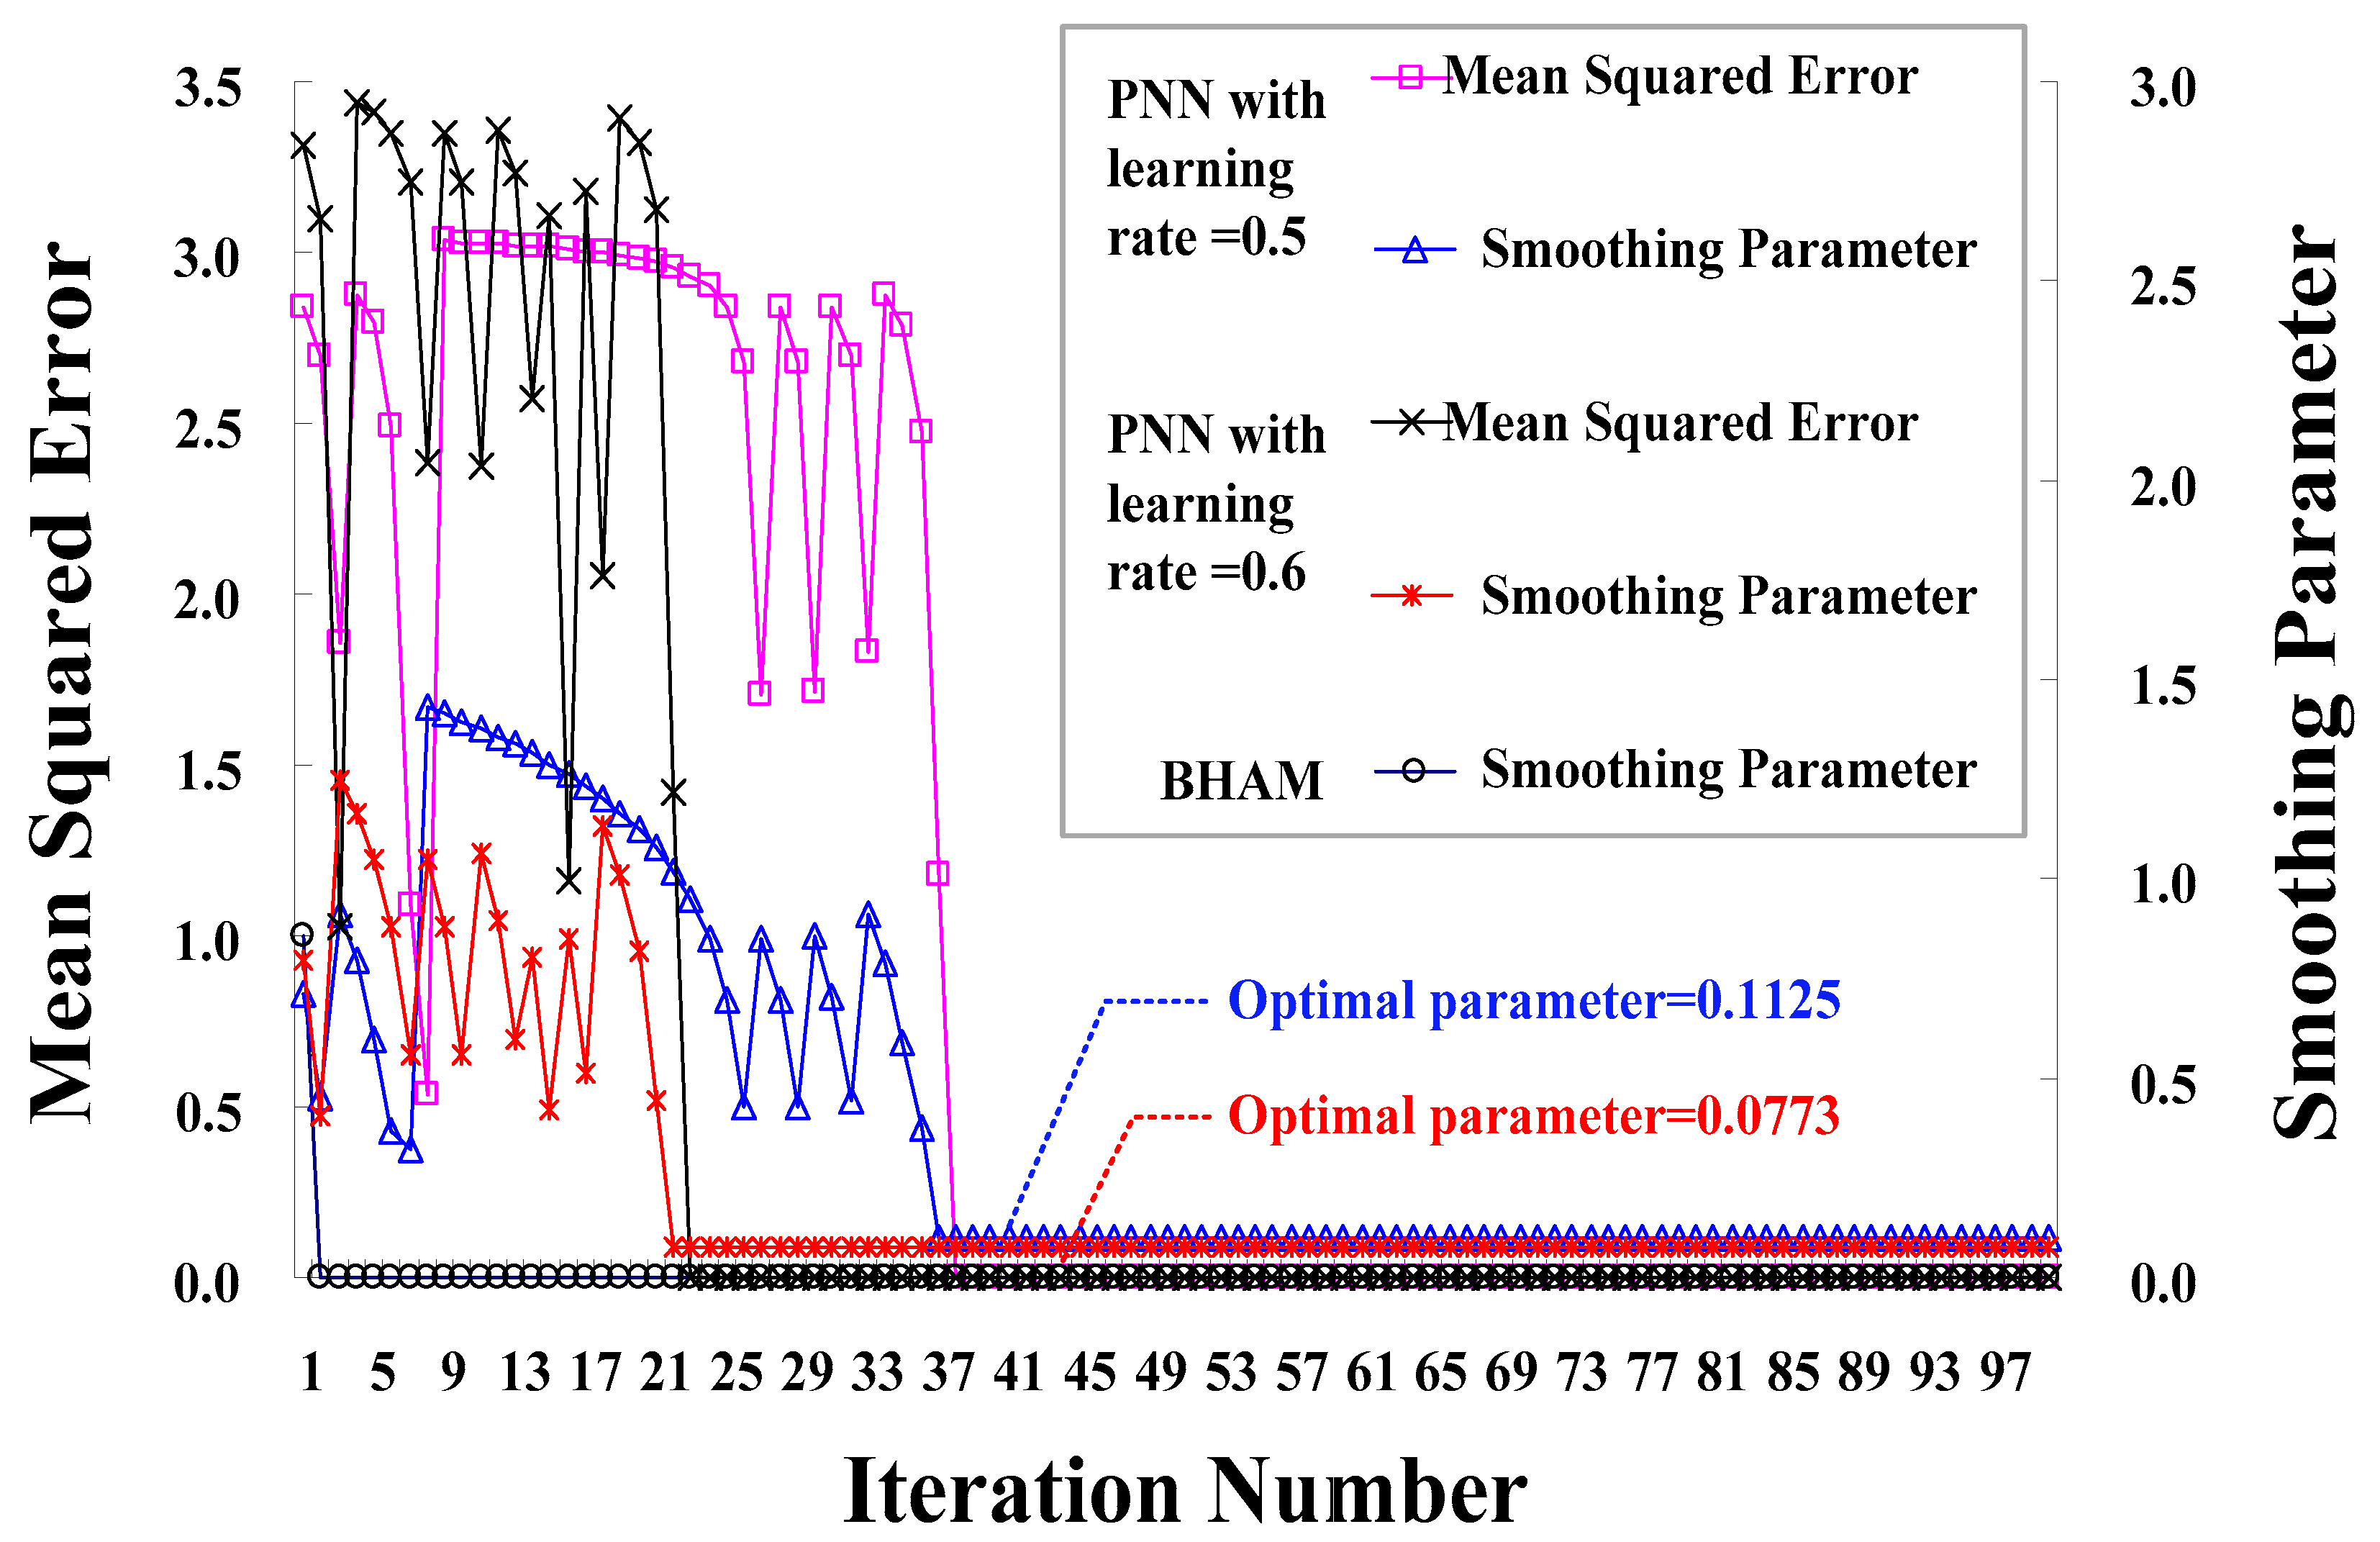
2.2. Bidirectional Associative Memory Network
3. Experimental Results and Discussion
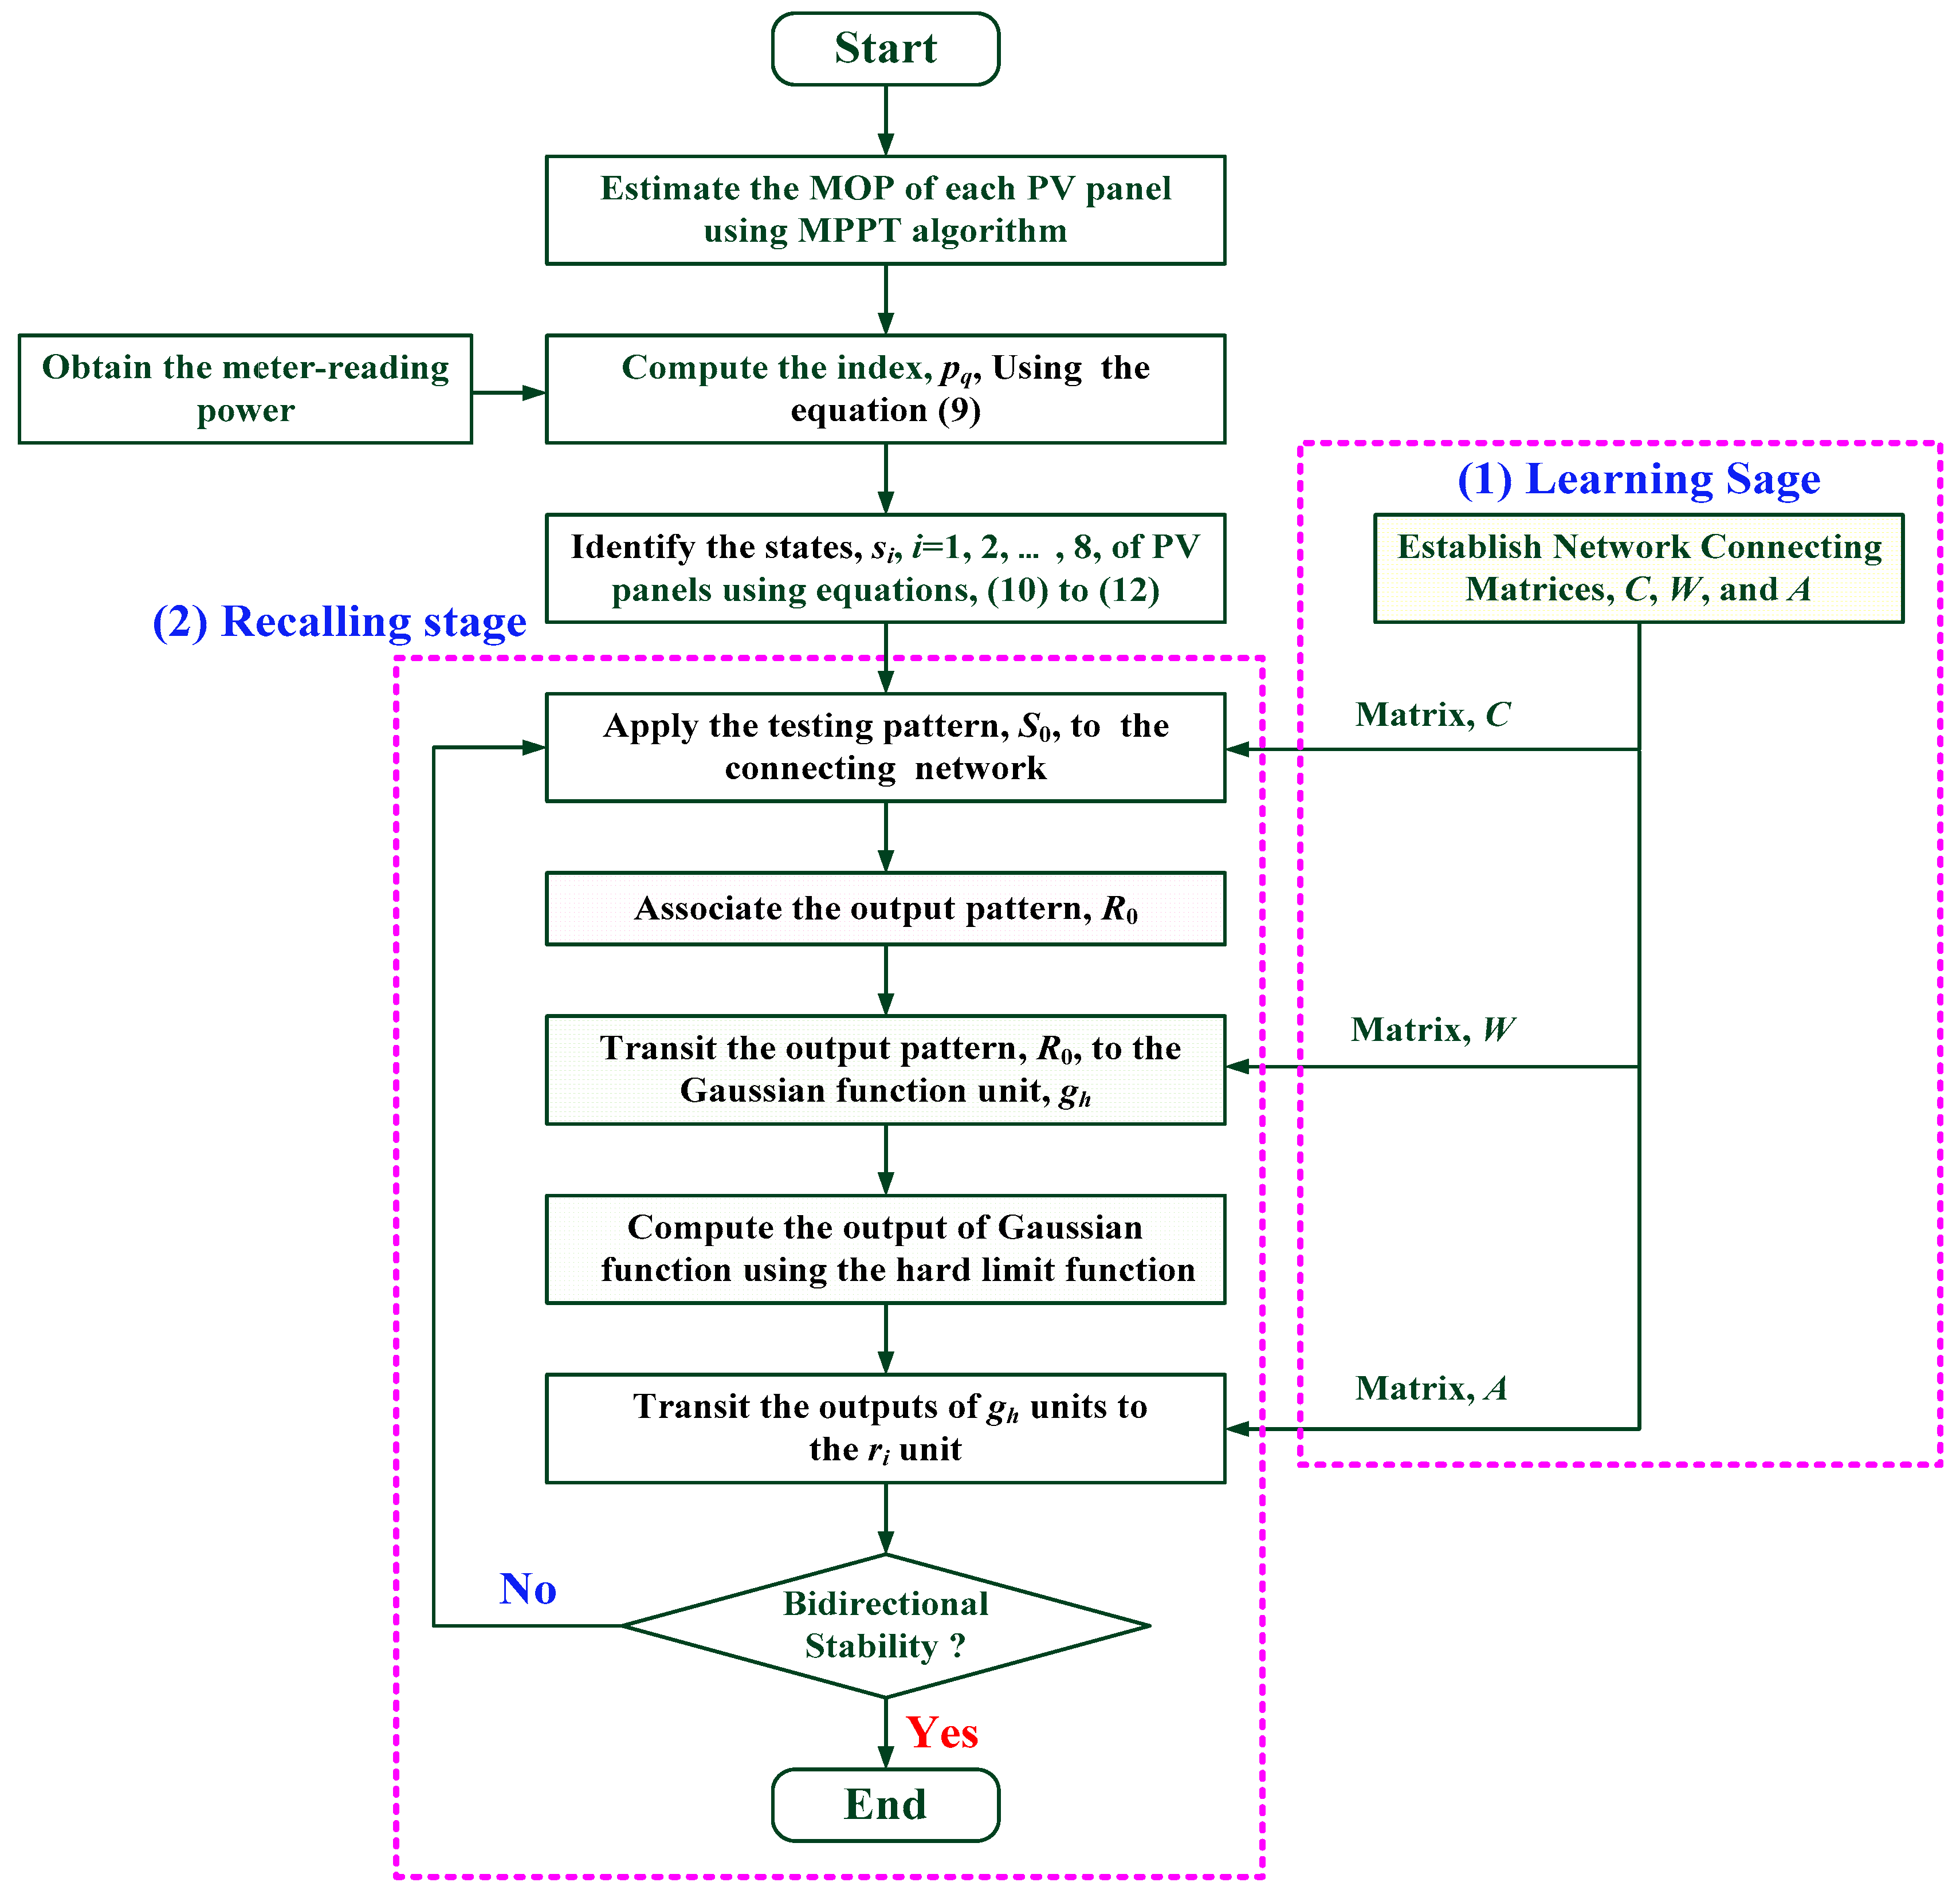
- Step (1)
- String 1#: [p1, p2, p3, p4, p5, p6, p7, p8] = [0.00, 0.00, 0.00, 0.95, 0.96, 0.95, 0.96, 0.97];String 2#: [p1, p2, p3, p4, p5, p6, p7, p8] = [0.00, 0.00, 0.00, 0.96, 0.97, 0.96, 0.96, 0.95];
- Step (2)
- power indexes were parameterized using Equations (10) to (12). The operation states of 16 PV panels were identified asString 1#: [s1, s2, s3, s4, s5, s6, s7, s8] = [1, 1, 1, 0, 0, 0, 0, 0];String 2#: [s1, s2, s3, s4, s5, s6, s7, s8] = [1, 1, 1, 0, 0, 0, 0, 0];
- Step (3)
- associated the output patterns:String 1#: [r1, r2, r3, r4, r5, r6, r7, r8] = [256, 256, 256, 192, 192, 192, 192, 192];String 2#: [r1, r2, r3, r4, r5, r6, r7, r8] = [256, 256, 256, 192, 192, 192, 192, 192];
- Step (4)
- computed the outputs of Gaussian function units:String 1#: [g1, g2, g3, g4, g5, g6, g7, g8] = [0.0454, 0.2665, 0.5738, 0.4881, 0.2148, 0.0888, 0.0362, 0.0147, 0.0060];String 2#: [g1, g2, g3, g4, g5, g6, g7, g8] = [0.0454, 0.2665, 0.5738, 0.4881, 0.2148, 0.0888, 0.0362, 0.0147, 0.0060];
- Step (5)
- transited the outputs of Gaussian function units to the output units using Equations (22) and (23):String 1#: [r1, r2, r3, r4, r5, r6, r7, r8] = [1, 2, 3, 0, 0, 0, 0, 0];String 2#: [r1, r2, r3, r4, r5, r6, r7, r8] = [1, 2, 3, 0, 0, 0, 0, 0];
- Step (6)
- reached bidirectional stability and terminated the BHAM algorithm.
4. Conclusions
Author Contributions
Funding
Conflicts of Interest
References
- Lin, C.H.; Huang, C.H.; Du, Y.C.; Chen, J.L. Maximum photovoltaic power tracking for the PV array using the fractional-order incremental conductance method. Appl. Energy 2011, 88, 4840–4847. [Google Scholar] [CrossRef]
- Chiu, C.-S.; Ouyang, Y.-L. Robust maximum power racking control of uncertain photovoltaic systems: A unified T-S Fuzzy model-based approach. IEEE Trans. Control Syst. Technol. 2011, 19, 1516–1526. [Google Scholar] [CrossRef]
- Kuo, C.-L.; Lin, C.-H.; Yau, H.-T.; Chen, J.-L. Using self-synchronization error dynamics formulation based controller for maximum photovoltaic power tracking in micro-grid systems IEEE J. Emerg. Sel. Top. Circuits Syst. 2013, 3, 459–467. [Google Scholar] [CrossRef]
- Chao, K.-H.; Liao, B.-J.; Hung, C.-P. Applying a cerebellar model articulation controller neural network to a photovoltaic power generation system fault diagnosis. Int. J. Photoenergy 2013, 2013, 839621. [Google Scholar] [CrossRef]
- Zhao, Y. Fault Analysis in Solar Photovoltaic Arrays. Master’s Thesis, Northeastern University, Boston, MA, USA, 2010. [Google Scholar]
- Kuo, C.-L.; Chen, J.-L.; Chen, S.-J.; Kao, C.-C.; Yau, H.-T.; Lin, C.-H. Photovoltaic energy conversion system fault detection using fractional-order color relation classifier in micro-distribution systems. IEEE Trans. Smart Grid 2016. in Press. [Google Scholar] [CrossRef]
- Zhao, Y.; Lehman, B.; DePalma, J.F.; Mosesian, J.; Lyons, R. Fault evolution in photovoltaic array during night-to-day transition. In Proceedings of the 2010 IEEE 12th Workshop on control and Modeling for Power Electronics, Boulder, CO, USA, 28–30 June 2010; pp. 1–6. [Google Scholar]
- Testo, Inc. Practical Guide: Solar Panel Thermography. Available online: www.testo.com (accessed on 10 March 2018).
- Kaplani, E. Detection of degradation effects in field-aged c-Si solar cells through IR thermography and digital image processing. Int. J. Photoenergy 2012, 2012, 396792. [Google Scholar] [CrossRef]
- Kumar, S.; Sarkar, B.; Nija, K.S. Quality improvement of PV modules by electroluminescence and thermal Imaging. Int. J. Eng. Adv. Technol. 2014, 3, 422–427. [Google Scholar]
- Chen, J.-L.; Kuo, C.-L.; Chen, S.-J.; Kao, C.-C.; Zhan, T.-S.; Lin, C.-H.; Chen, Y.-S. DC-side fault detection for photovoltaic energy conversion system using fractional-order dynamic error based fuzzy Petri net integrating with intelligent meters. IET Renew. Power Gener. 2016, 10, 1318–1327. [Google Scholar] [CrossRef]
- Davarifar, M.; Rabhi, A.; El Hajjaji, A. Comprehensive modulation and classification of faults and analysis their effect in DC side of photovoltaic system. Energy Power Eng. 2013, 2013, 230–236. [Google Scholar] [CrossRef]
- Li, H.; Liu, Z.; Liu, K.; Zhang, Z. Predictive power of machine learning for optimizing solar water heater performance: The potential application of high-throughput screening. Int. J. Photoenergy 2017, 2017, 4194251. [Google Scholar] [CrossRef]
- Li, H.; Liu, Z. Performance prediction and optimization of solar water heater via a knowledge-based machine learning method. In Handbook of Research on Power and Energy System Optimization; IGI Global: Hershey, PA, USA, 2018; pp. 55–74. [Google Scholar]
- Chartier, S.; Boukadoum, M. A bidirectional heteroassociative memory for binary and grey-level patterns. IEEE Trans. Neural Netw. 2006, 17, 385–396. [Google Scholar] [CrossRef] [PubMed]
- Zhang, Z.; Pinto, J.; Plahl, C. Channel mapping using bidirectional long short-term memory for dereverberation in hands-free voice controlled devices. IEEE Trans. Consum. Electron. 2014, 60, 525–533. [Google Scholar] [CrossRef]
- Berberian, N.; Aamir, Z.; Helie, S. Encoding sparse features in a bidirectional associative memory. In Proceedings of the 2016 International Joint Conference on Neural networks, Vancouver, BC, Canada, 24–29 July 2016. [Google Scholar]
- Tao, D.; Wen, Y.; Hong, R. Multicolumn bidirectional long short-term memory for mobile devices-based human activity recognition. IEEE Internet Things J. 2016, 3, 1124–1134. [Google Scholar] [CrossRef]
- Pandey, A.; Dasgupta, N.; Mukkerjee, A.K. High-performance algorithms for drift avoidance and fast tracking in solar MPPT system. IEEE Trans. Energy Convers. 2008, 23, 681–689. [Google Scholar] [CrossRef]
- Otieno, C.A.; Nyakoe, G.N.; Wekesa, C.W. A neural Fuzzy based maximum power point tracker for a photovoltaic system. In Proceedings of the 2009 IEEE AFRICON, Nairobi, Kenya, 23–25 September 2009; pp. 1–6. [Google Scholar]
- Buerhop, C.; Pickel, T.; Dalsass, M. Air-PV-check: A quality inspection of PV-power plants without operation interruption. In Proceedings of the 2016 IEEE 43rd Photovoltaic Specialists Conference, Portland, OR, USA, 5–10 June 2016. [Google Scholar]
- Aghaei, M.; Dolara, A.; Leva, S. Image resolution and defects detection in PV inspection by unmanned technologies. In Proceedings of the 2016 Power and Energy Society General Meeting, Boston, MA, USA, 17–21 July 2016. [Google Scholar]
- Quater, P.B.; Grimaccia, F.; Leva, S. Light unmanned aerial vehicles (UAVs) for cooperative inspection of PV plants. IEEE J. Photovolt. 2014, 4, 1107–1113. [Google Scholar] [CrossRef]
- Specht, D.F. A general regression neural network. IEEE Trans. Neural Netw. 1991, 2, 568–576. [Google Scholar] [CrossRef] [PubMed]
- Wu, J.X.; Lin, C.H.; Du, Y.C.; Chen, T. Sprott chaos synchronization classifier for diabetic foot peripheral vascular occlusive disease estimation. IET Sci. Meas. Technol. 2012, 6, 533–540. [Google Scholar] [CrossRef]
- Huang, C.-H.; Lin, C.-H.; Kuo, C.-L. Chaos-synchronization based detector for power quality disturbances classification in a power system. IEEE Trans. Power Deliv. 2011, 26, 944–953. [Google Scholar] [CrossRef]
- Li, H.; Zhang, Z.; Liu, Z. Application of artificial neural networks for catalysis: A review. Catalysts 2017, 7, 306. [Google Scholar] [CrossRef]
- Institute of Electrical and Electronics Engineers. IEEE Std. 802.11-2007: Wireless LAN Medium Access Control (MAC) and Physical Layer (PHY) Specifications; Institute of Electrical and Electronics Engineers: Piscataway, NJ, USA, 2007. [Google Scholar]


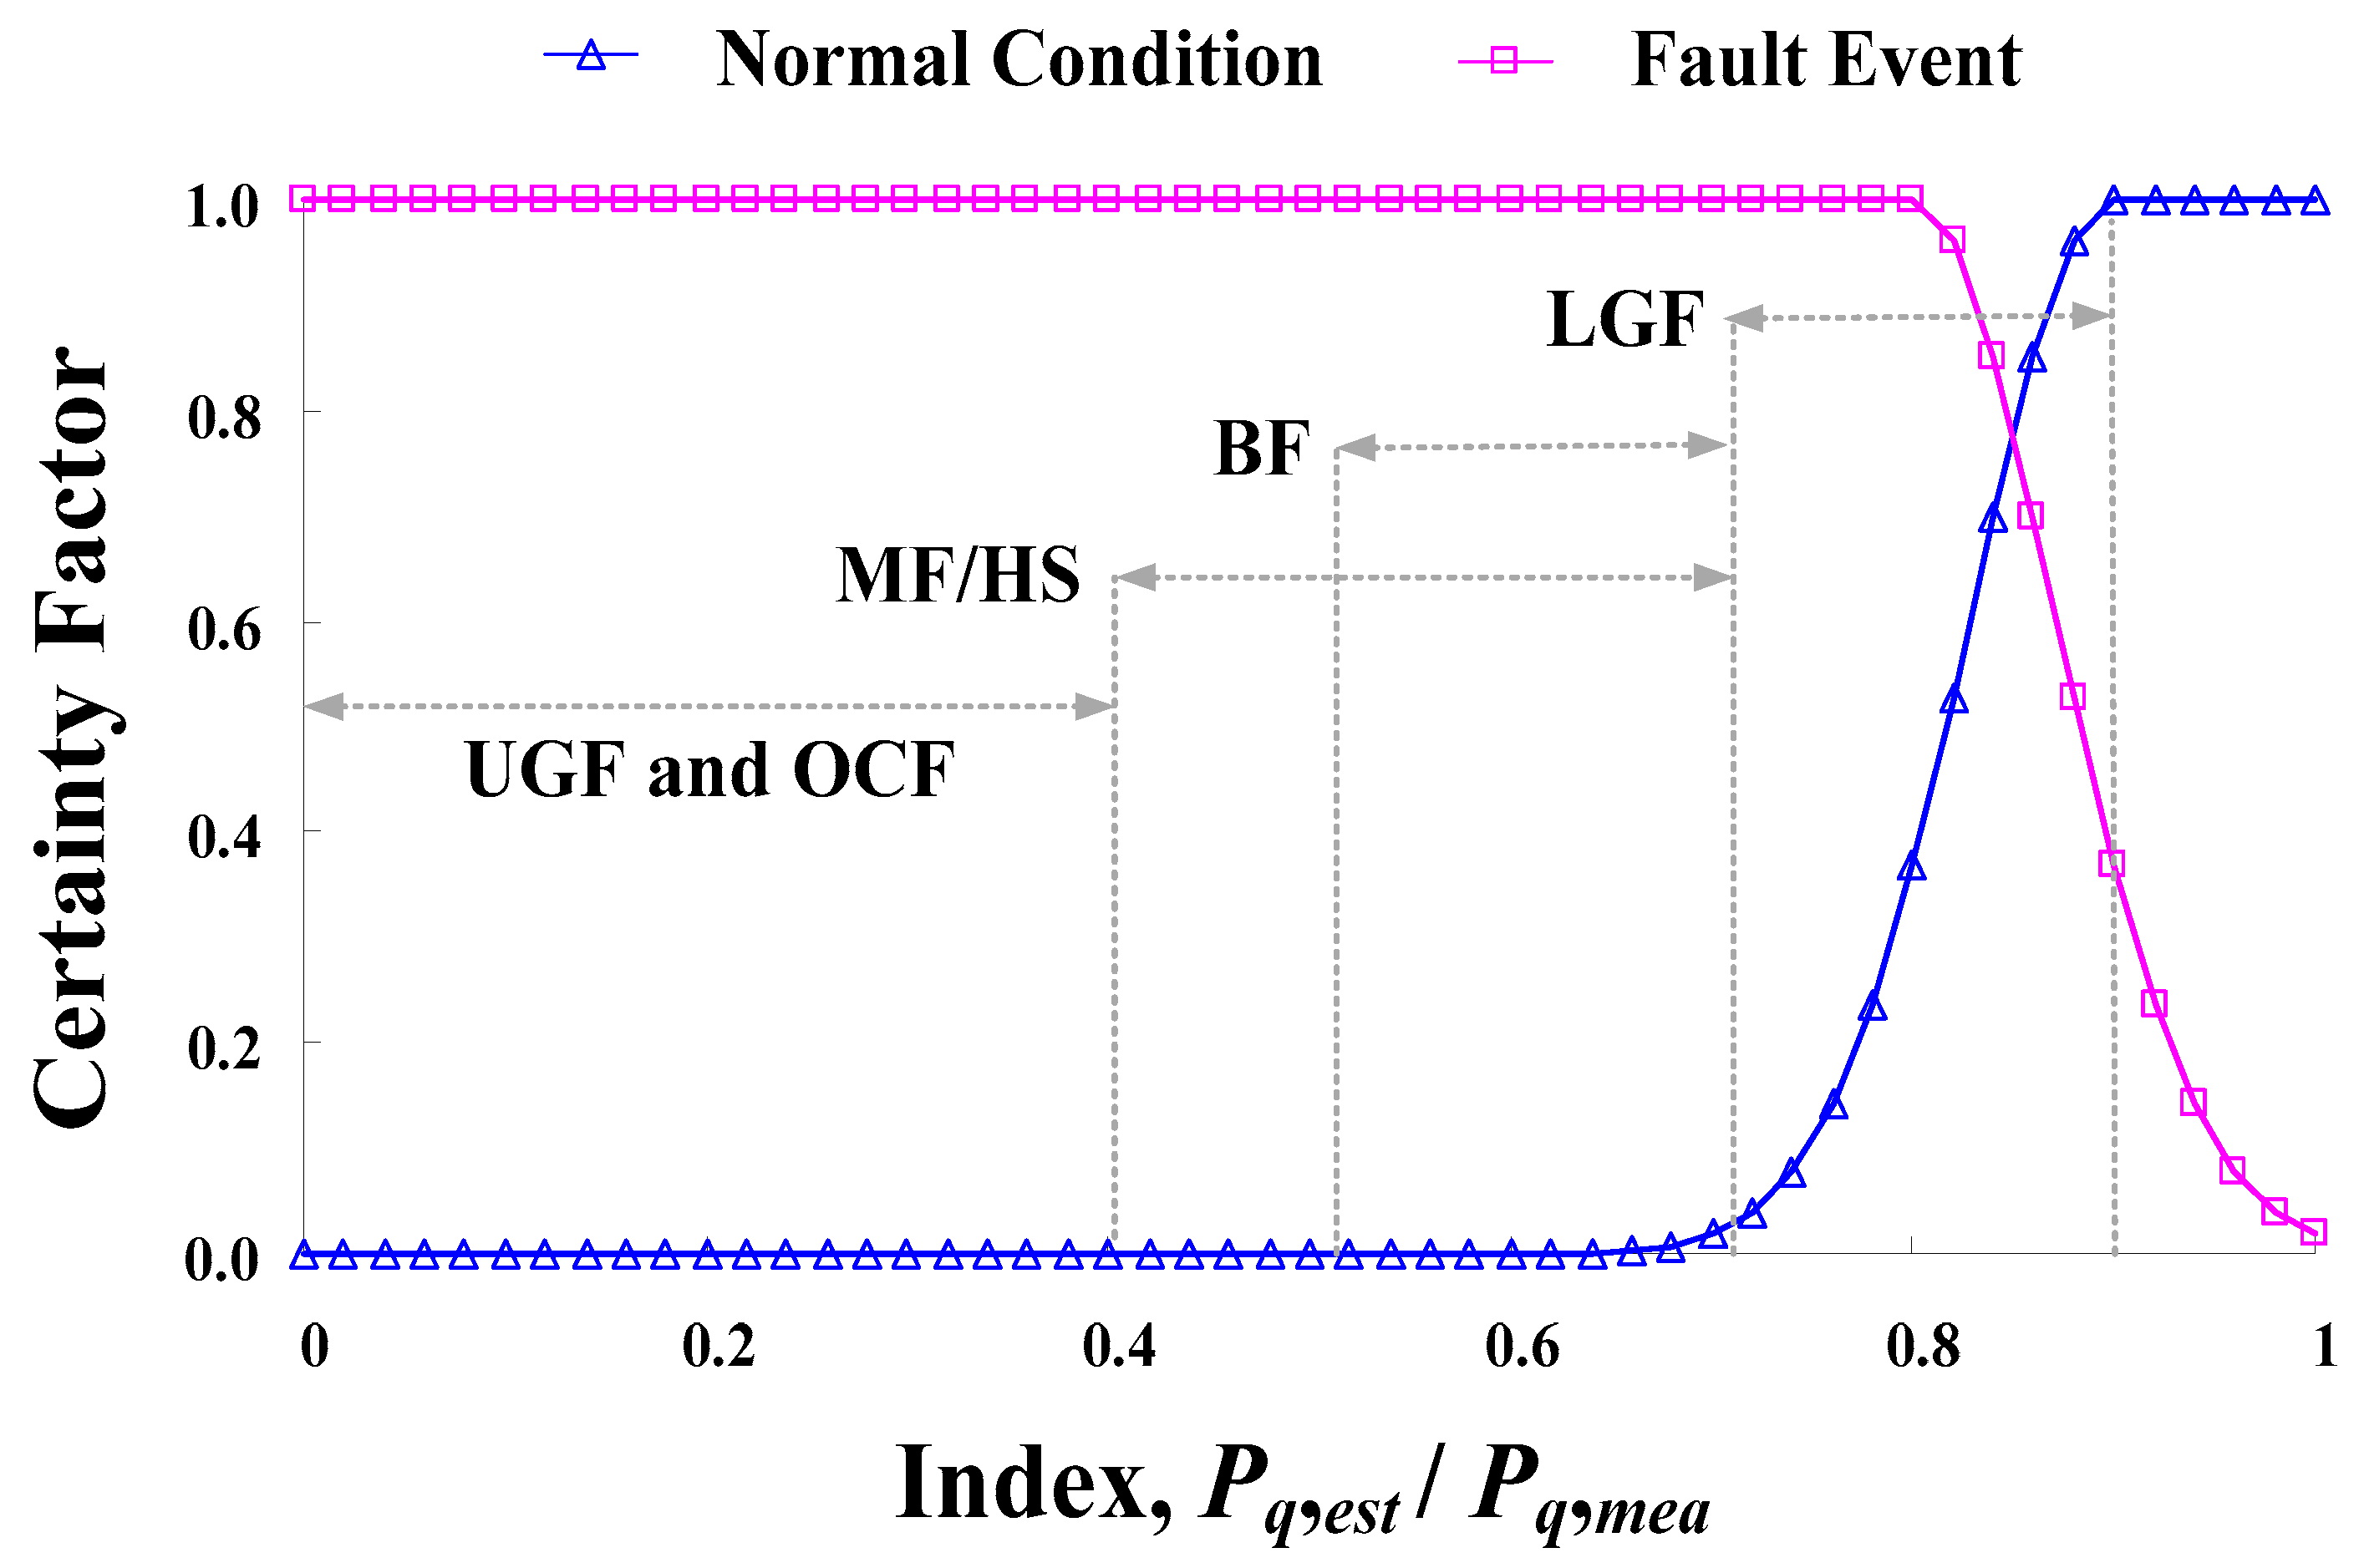
| Fault Type | Power Degradation Index, pq |
|---|---|
| 1. Normal (Nor) | <0.10 |
| 2. Lower Grounded Fault (LGF) | 0.10~0.30 |
| 3. Mismatch Fault/Hot Spot (MF/HS) | 0.30~0.60 |
| 4. Bridged (line-o-line) Fault (BF) | 0.30~0.50 |
| 5. Open Circuit Fault (OCF) | 0.00 |
| 6. Upper Grounded Fault (UGF) | >0.60 |
| Specific Parameter | Value |
|---|---|
| Maximum Power Pmax | 87.70 (W) |
| Short-circuit Current ISC | 4.80 (A) |
| Open-circuit Voltage VOC | 21.70 (V) |
| Rated Voltage VR | 19.14 (V) |
| Rated Current IR | 4.58 (A) |
| Number of Modules Connected in Series ns | 36 |
| Number of Modules Connected in Parallel np | 2 |
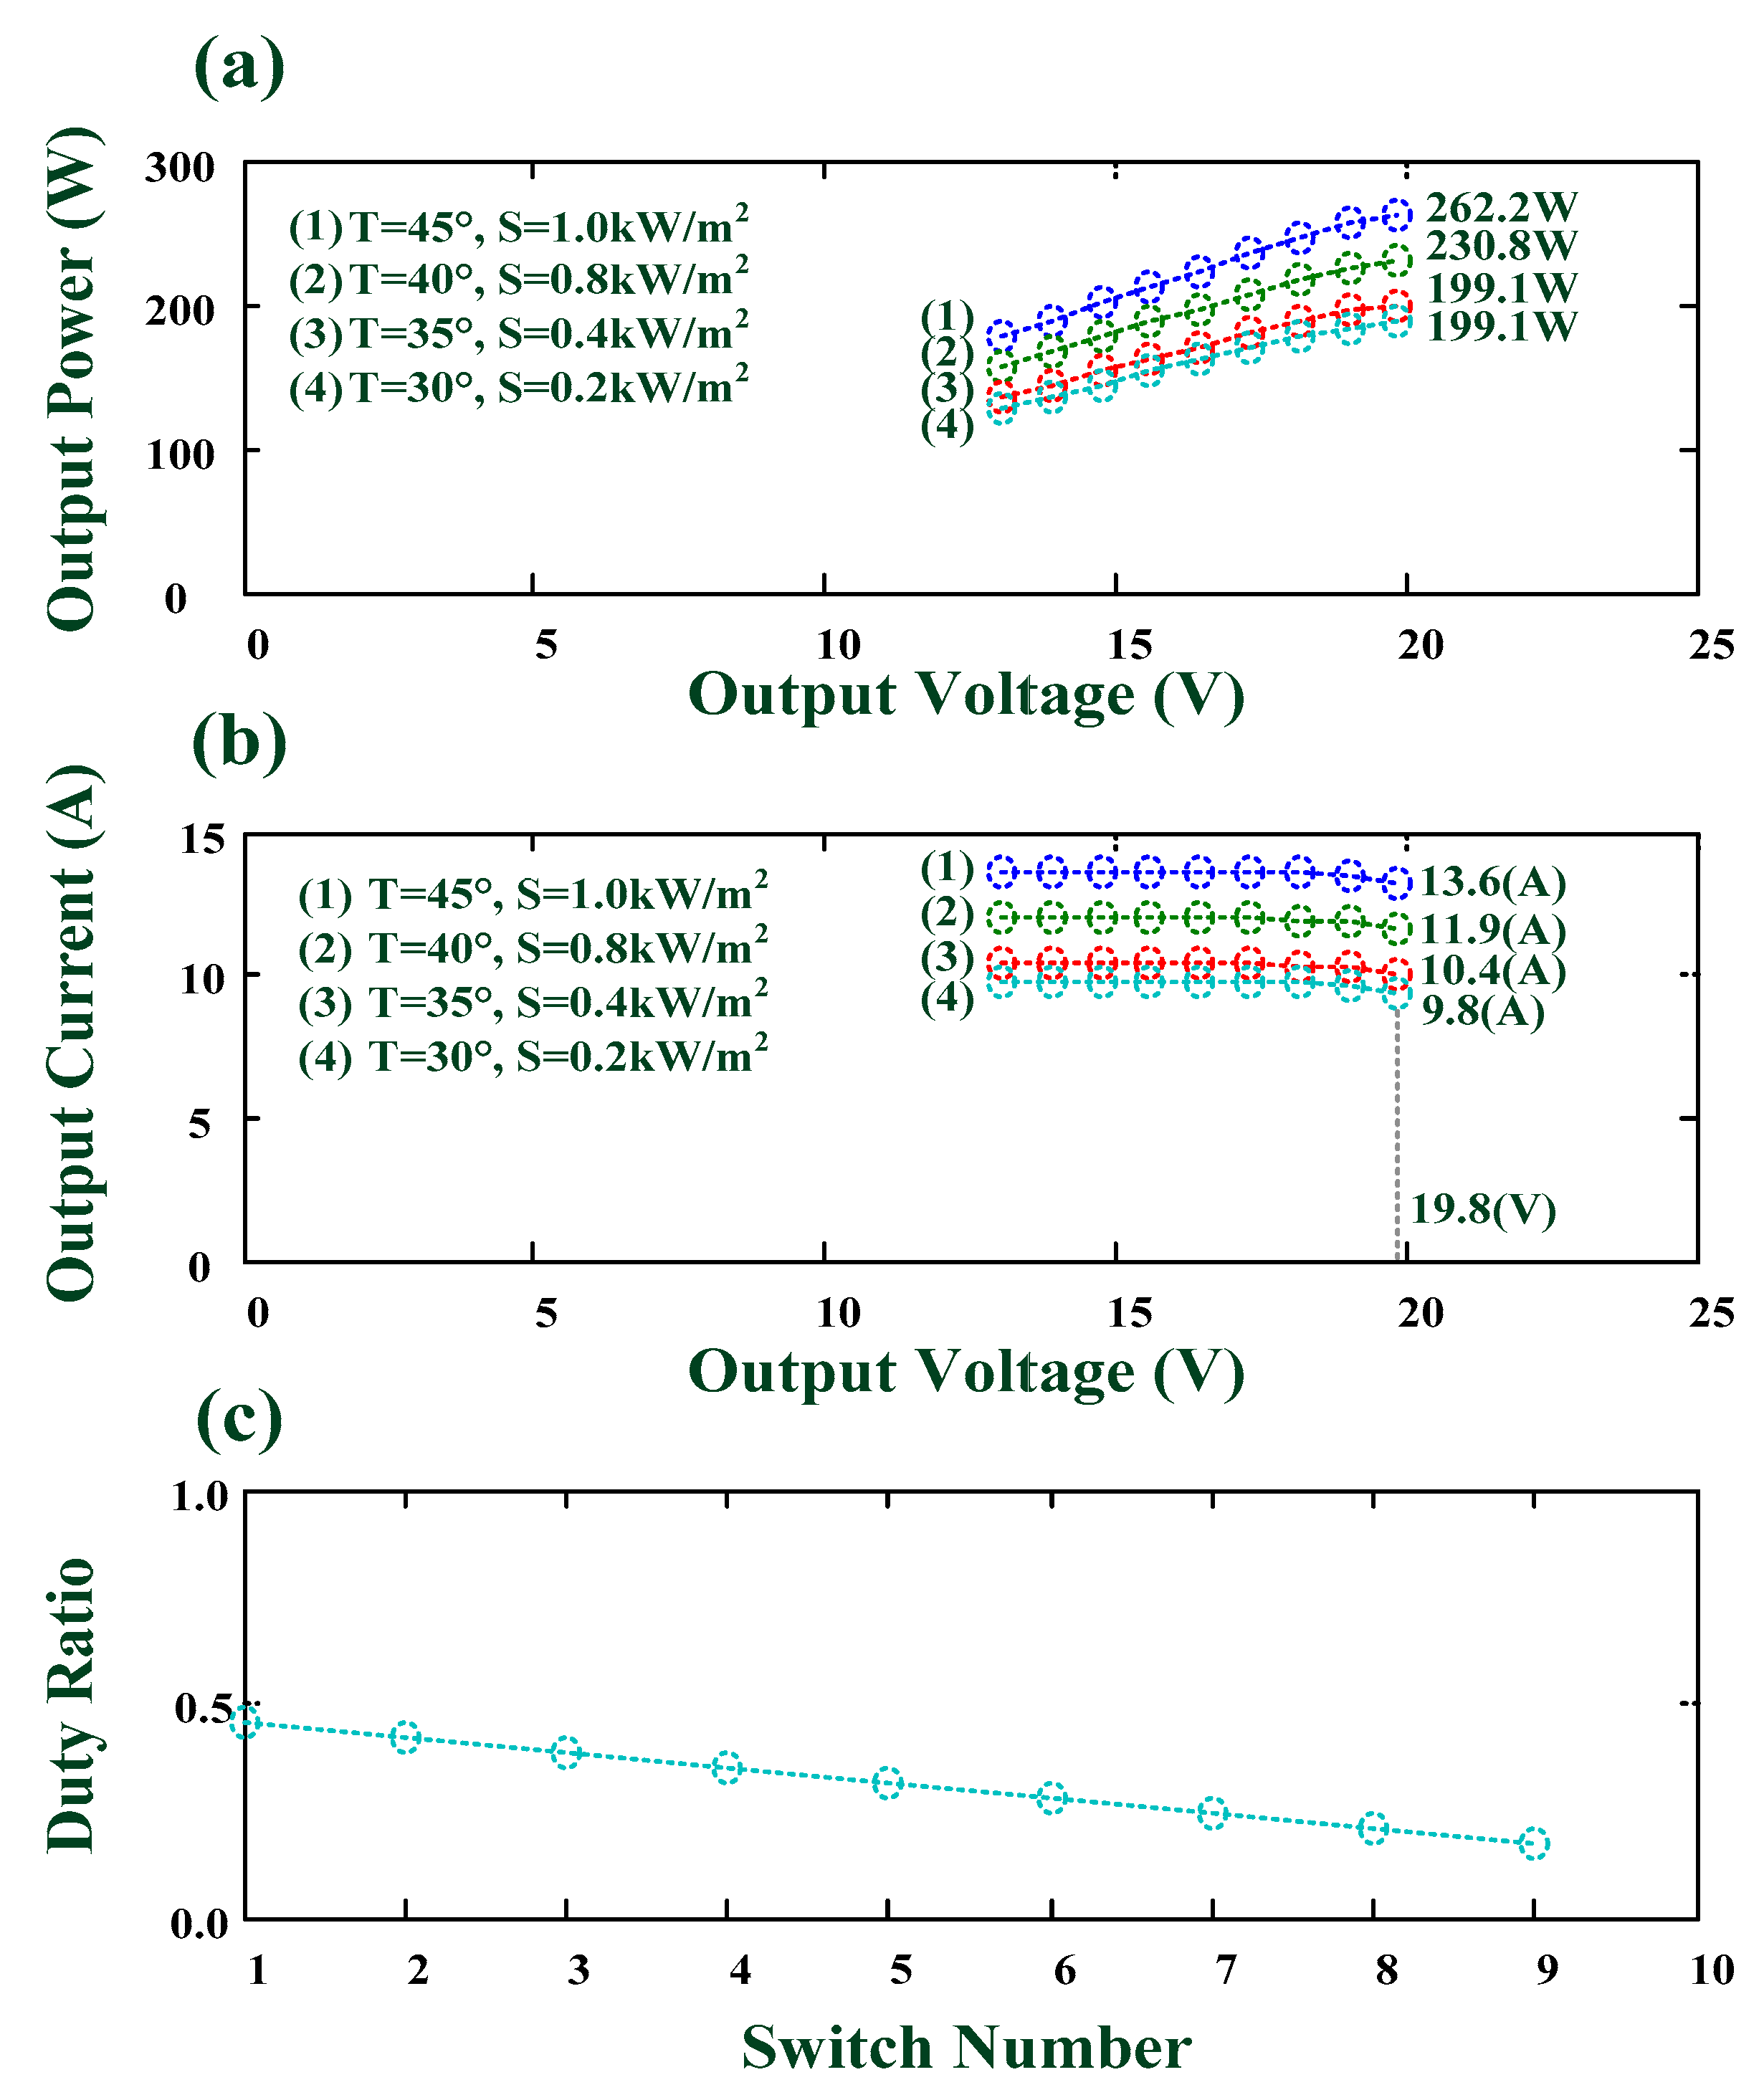
| String | Panel Number | Radiation kW/m2 | Temperature °C | Each Panel Power (W) | Total Output Power (kW) and Current (A) |
|---|---|---|---|---|---|
| 1# | 8 | 0.2–1.0 | 30–45 | 199.1–262.2 | 1.6–2.1 kW 78.4–108.8 A |
| 2# | 8 | 0.2–1.0 | 30–45 | 199.1–262.2 | 1.6–2.1 kW 78.4–108.8 A |
| Method | BHAM Network | PNN Method [24,25] | |
|---|---|---|---|
| Task | |||
| Network Configuration | 8-8-9 | 8-256-9-8 | |
| Number | 2 BHAM networks for 2 strings | 2 PNNs for 2 strings | |
| Training Data | 256 input-output pairs | 256 input-output pairs | |
| Storage Matrix | C8×8, W9×8, and A9×8 | Input (256 × 8) and output (256 × 8) matrices | |
| Memory Storage | 832 bytes | 16,384 bytes | |
| Process Unit | Gaussian function and hard limit function | Gaussian function | |
| Learning Algorithm | Bidirectional associative memory | Least square algorithm | |
| Learning Stage | Establish matrices, C, W, and A (Matrix Operation) | Iteration computing process < 100 | |
| Recalling Stage | Iteration computing process ≤2 | - | |
| Execution Time | Average time: <0.03 s | Average time: <20 s | |
| Testing Pattern | 256 patterns for each BHAM network | 256 patterns for each PNN | |
| Accuracy | 100% | 100% | |
| Application | Easy to implement in a mobile intelligent vehicle | Average to implement in a mobile intelligent vehicle | |
© 2018 by the authors. Licensee MDPI, Basel, Switzerland. This article is an open access article distributed under the terms and conditions of the Creative Commons Attribution (CC BY) license (http://creativecommons.org/licenses/by/4.0/).
Share and Cite
Chang, L.-Y.; Pai, N.-S.; Chou, M.-H.; Chen, J.-L.; Kuo, C.-L.; Lin, C.-H. Multiple Fault Location in a Photovoltaic Array Using Bidirectional Hetero-Associative Memory Network in Micro-Distribution Systems. Crystals 2018, 8, 327. https://0-doi-org.brum.beds.ac.uk/10.3390/cryst8080327
Chang L-Y, Pai N-S, Chou M-H, Chen J-L, Kuo C-L, Lin C-H. Multiple Fault Location in a Photovoltaic Array Using Bidirectional Hetero-Associative Memory Network in Micro-Distribution Systems. Crystals. 2018; 8(8):327. https://0-doi-org.brum.beds.ac.uk/10.3390/cryst8080327
Chicago/Turabian StyleChang, Long-Yi, Neng-Sheng Pai, Min-Hung Chou, Jian-Liung Chen, Chao-Lin Kuo, and Chia-Hung Lin. 2018. "Multiple Fault Location in a Photovoltaic Array Using Bidirectional Hetero-Associative Memory Network in Micro-Distribution Systems" Crystals 8, no. 8: 327. https://0-doi-org.brum.beds.ac.uk/10.3390/cryst8080327