Article

Spatio-temporal Investigations of the Incomplete Spin Transition in a Single Crystal of [Fe(2-pytrz)2{Pt(CN)4}]·3H2O: Experiment and Theory

1
Groupe d’Etudes de la Matière Condensée, UMR 8635, CNRS-Université de Versailles, Université Paris Saclay, 45 Avenue des Etats Unis, 78035 Versailles, France
2
Univ Brest, CNRS, CEMCA, 6 Avenue Le Gorgeu, C.S. 93837 - 29238 Brest Cedex 3, France
*
Author to whom correspondence should be addressed.
Submission received: 13 December 2018 / Revised: 9 January 2019 / Accepted: 11 January 2019 / Published: 16 January 2019
(This article belongs to the Special Issue Synthesis and Applications of New Spin Crossover Compounds)

Abstract

:
Optical microscopy technique is used to investigate the thermal and the spatio-temporal properties of the spin-crossover single crystal [Fe(2-pytrz) 2 {Pt(CN) 4 }]·3H 2 O, which exhibits a first-order spin transition from a full high-spin (HS) state at high temperature to an intermediate, high-spin low-spin (HS-LS) state, below 153 K, where only one of the two crystallographic Fe(II) centers switches from the HS to HS-LS state. In comparison with crystals undergoing a complete spin transition, the present transformation involves smaller volume changes at the transition, which helps to preserving the crystal’s integrity. By analyzing the spatio-temporal properties of this spin transition, we evidenced a direct correlation between the orientation and shape of HS/HS-LS domain wall with the crystal’s shape. Thanks to the small volume change accompanying this spin transition, the analysis of the experimental data by an anisotropic reaction-diffusion model becomes very relevant and leads to an excellent agreement with the experimental observations.

1. Introduction

Because of the growing societal requirement of information processing and big data storage, the design of devices with reversible and high density storage capacities as well as fast responses becomes mandatory. Multi-functional molecular materials with intrinsic physical properties at the molecular scale constitute serious candidates for their use as nano-memories, nano-switches or nano-probes due to many advantages, like their easy processability and their low cost. In this context, spin crossover (SCO) materials, based on iron (II) complexes, have been recognized as prime candidates, in particular due to their variety of nano-structuration possibilities [1,2,3,4,5] allowing their integration into devices for a various set of currently considered applications, e.g., as display and memory devices [6,7,8,9], sensing of temperature [10,11,12], probes of contact pressure or shocks [13], as well as actuators [14,15,16]. From the thermodynamic point of view, the SCO phenomenon is an entropic-driven mechanism involving the switching between two different electronic states, namely a diamagnetic low-spin (LS) state and a paramagnetic high-spin (HS) state, as a response to the application of an external stimulus. In the case of d 6 Fe(II) based SCO compounds, the electronic configuration of the metal ion in the HS state, which generally emerges at high temperature, is (t 2 g 4 e g 2 ), where the valence electrons fill all electronic orbitals according to the Hund rule leading to the total spin momentum S = 2 , which makes the SCO systems paramagnetic in this state. In contrast, in the LS state, which appears at low-temperature, the electronic configuration t 2 g 6 e g 0 is stabilized, for which corresponds a spin momentum, S = 0 , leading to a diamagnetic LS state.
On the other hand, due to the antibonding nature of the e g orbital, the Fe-ligand distances increase by 10 % in the HS state in comparison with those of LS state, which induces an expansion of the unit cell volume in the HS state [17]. This molecular volume expansion and contraction in the HS and LS states, respectively, is delocalized in the lattice over several unit cells and is at the origin of the cooperative effects observed in these molecular solids. Indeed, as a consequence of these long-range interactions between molecules, insured by the lattice phonons, SCO solids can display first-order phase transitions accompanied with thermal hysteresis loops [6,18,19], allowing them to show macroscopic bistability, and then to switch collectively between the LS and the HS states. In addition, the spin transition can be triggered by various external parameters, such as pressure, light, temperature, electric and magnetic fields, [6,20,21], thus increasing their potential application in many areas.
From the microscopic point of view, the spin transition phenomenon has been considered as a vibronic problem [22,23] in which the electronic and vibrational structures of the molecule are strongly coupled, to the extent that in some cases, the Born-Oppenheimer approximation is not valid [24,25]. The microscopic changes of the magnetoelastic properties of the SCO solids at the transition, accompanied with large volume changes resulting from the constructive interferences of the molecular volume changes which deploy at long-range through elastic interactions, cause important variations in the physical properties of the SCO materials, which show thermo-chromic features at the transition as well as significant rigidity changes. As a direct consequence, an important panel of experimental techniques is utilized to study the SCO phenomenon, among them one can quote, the differential scanning calorimetry [26], magnetometry [27], X-ray diffraction [28], Mössbauer spectroscopy [29], diffuse reflectivity [30] as well as optical microscopy (OM) [31,32,33,34,35,36,37,38], which has been found very useful in the understanding of the non-equilibrium properties of the SCO materials. As a matter of fact, OM is now recognized as one of the major techniques allowing a direct spatiotemporal imaging of the thermally-induced spin crossover transition, with the respective spatial and temporal resolutions of 0.3 μ m and 10 ms.
OM allows the study of the first-order phase transitions of SCO solids on a unique single crystal, which constitutes an undeniable progress towards a deep understanding of the fundamental aspects of this phenomenon. In addition, this technique provides valuable information not only on the electronic properties of the studied single crystals along the transition but also on the modification of their elastic properties, particularly when the spin transition is accompanied with a significant volume change. Among the large number of SCO compounds already investigated by OM [31,32,33,34,35,36,37,38], it is interesting to recall that the first quantitative experiments [35] were conducted on the fragile SCO single crystals of [Fe(btr) 2 (NCS) 2 ]H 2 O (btr = 4,4 -bis-1,2,4-triazole), which easily lose watter molecules at the transition, causing their deterioration. To avoid such a disastrous effect, the single crystals were embedded in oil and the OM measurements have been performed by preventing any dehydration. Despite this, the first cooling process from HS to LS revealed the appearance of irreversible defects in the crystal caused by the mechanical stresses generated by the volume change at the spin transition, which hindered the complete analysis of the spatio-temporal properties along the two branches of the thermal hysteresis, although it was possible to evaluate the HS-LS interface velocity on cooling to ∼2.3 μ m·s 1 . Later on, Chong et al. [36] investigated the spin transition in the hexagonally-shaped single crystals of [Fe(bbtr) 3 ](ClO 4 ) 2 . Similarly to the previous study, the SCO transition was found to start at the corner of the hexagon, with a clear HS-LS interface which adapts its length and shape along its propagation process. Unfortunately, due to the large lattice parameter misfit between the LS and HS structures, the system does not succeed in finding a stress free interface, which causes irreversible crystal damages after the first cooling. It is worth mentioning that this enhanced brittleness of the crystals around the interface region which stores the excess of elastic energy, is quite well explained in the theoretical electro-elastic models [37,39,40,41,42] describing the elastic properties of the SCO solids. Finally, more recent OM studies, performed on the resilient SCO single crystal [Fe(NCSe)(py) 2 ( μ -bpypz)] (py = pyridine and bpypz = 3,5-bis(2-pyridyl)-pyrazolate) [37,42,43,44], allowed for the first-time to monitor the motion of the HS-LS interface on both cooling and heating processes, whose corresponding velocities were estimated in the range 4–6 μ m·s 1 . In the latter case, due to the particularly regular shape of the crystals, made of rectangular platelets along the direction of the interface propagation, the shape of the HS-LS interface remained unchanged during its motion. Very recently [38], the SCO compound, [Fe(2-pytrz) 2 Pd(CN) 4 ]·3H 2 O (2-pytrz = 4-(2-pyridyl)-1,2,4,4H-triazole), has been investigated by OM and showed a well defined interface during the spin transition. Thanks to the robust character of the investigated single crystals, the dynamical properties of the interface propagation were deeply studied, and their behavior were well reproduced by a reaction diffusion model. In the present work, we report about new OM investigations, realized on a high quality SCO complex of formula [Fe(2-pytrz) 2 Pt(CN) 4 ]·3H 2 O (1) for which we selected a reliable single crystal characterized by an irregular shape, in order to investigate the interplay between the mode of interface propagation and the crystal’s shape. The expected synergetic effects are considered here as an evidence of the action of the long-range elastic interactions between the SCO molecules within the crystal, caused by the volume change at the transition. One of the consequences will be that mean-field based models become suitable for the theoretical description of the spatiotemporal properties of SCO materials, as will be demonstrated below.
The present manuscript is organized as follows: Section 2 summarizes the experimental findings on the thermo-induced spin transition of the [Fe(2-pytrz) 2 {Pt(CN) 4 }]·3H 2 O and presents the data of OM investigations which revealed the spatio-temporal character of the SCO transition. In Section 3, we introduce the theoretical spatio-temporal model, based on reaction diffusion description, allowing to faithfully describe the experimental data. Section 4 concludes and outlines some possible developments of this work.

2. Results and Discussion

The present work contains experimental investigations of optical microscopy performed at several temperatures in the thermal hysteresis region in order to observe the spatio-temporal features of the first-order spin transition of the title compound. To understand the physical mechanism of the interface propagation in this particular system, in which the spin transition is accompanied with a small volume change, we developed an appropriate modeling, based on a reaction diffusion description, allowing to reproduce the experimental spatiotemporal features of the current first-order SCO transition.

3. Experimental Investigations

3.1. Synthesis

Single crystals of [Fe(2-pytrz) 2 {Pt(CN) 4 }]·3H 2 O were obtained by slow diffusion, in a fine glass tube ( 3.0 m m diameter) of two different aqueous solutions: the first one was prepared by dissolving K 2 [Pt(CN) 4 ]·xH 2 O (37.7 mg, 0.1 mmol) in 10 mL; the second one was obtained by dissolving iron(II) perchlorate salt (25.5 mg, 0.1 mmol) in a solution (10 mL) of 4-(2-pyridyl)-1,2,4,4H-triazole (2-pytrz) (29.2 mg, 0.2 mmol), which became light yellow after a night. A volume of 1 mL of the K 2 [Pt(CN) 4 ]·xH 2 O solution was put in the fine glass tube and then similar volume (1 mL) was layered meticulously onto the yellow solution. After two days of slow diffusion, colorless fine square crystals of [Fe(2-pytrz) 2 {Pt(CN) 4 }]·3H 2 O were formed [45].

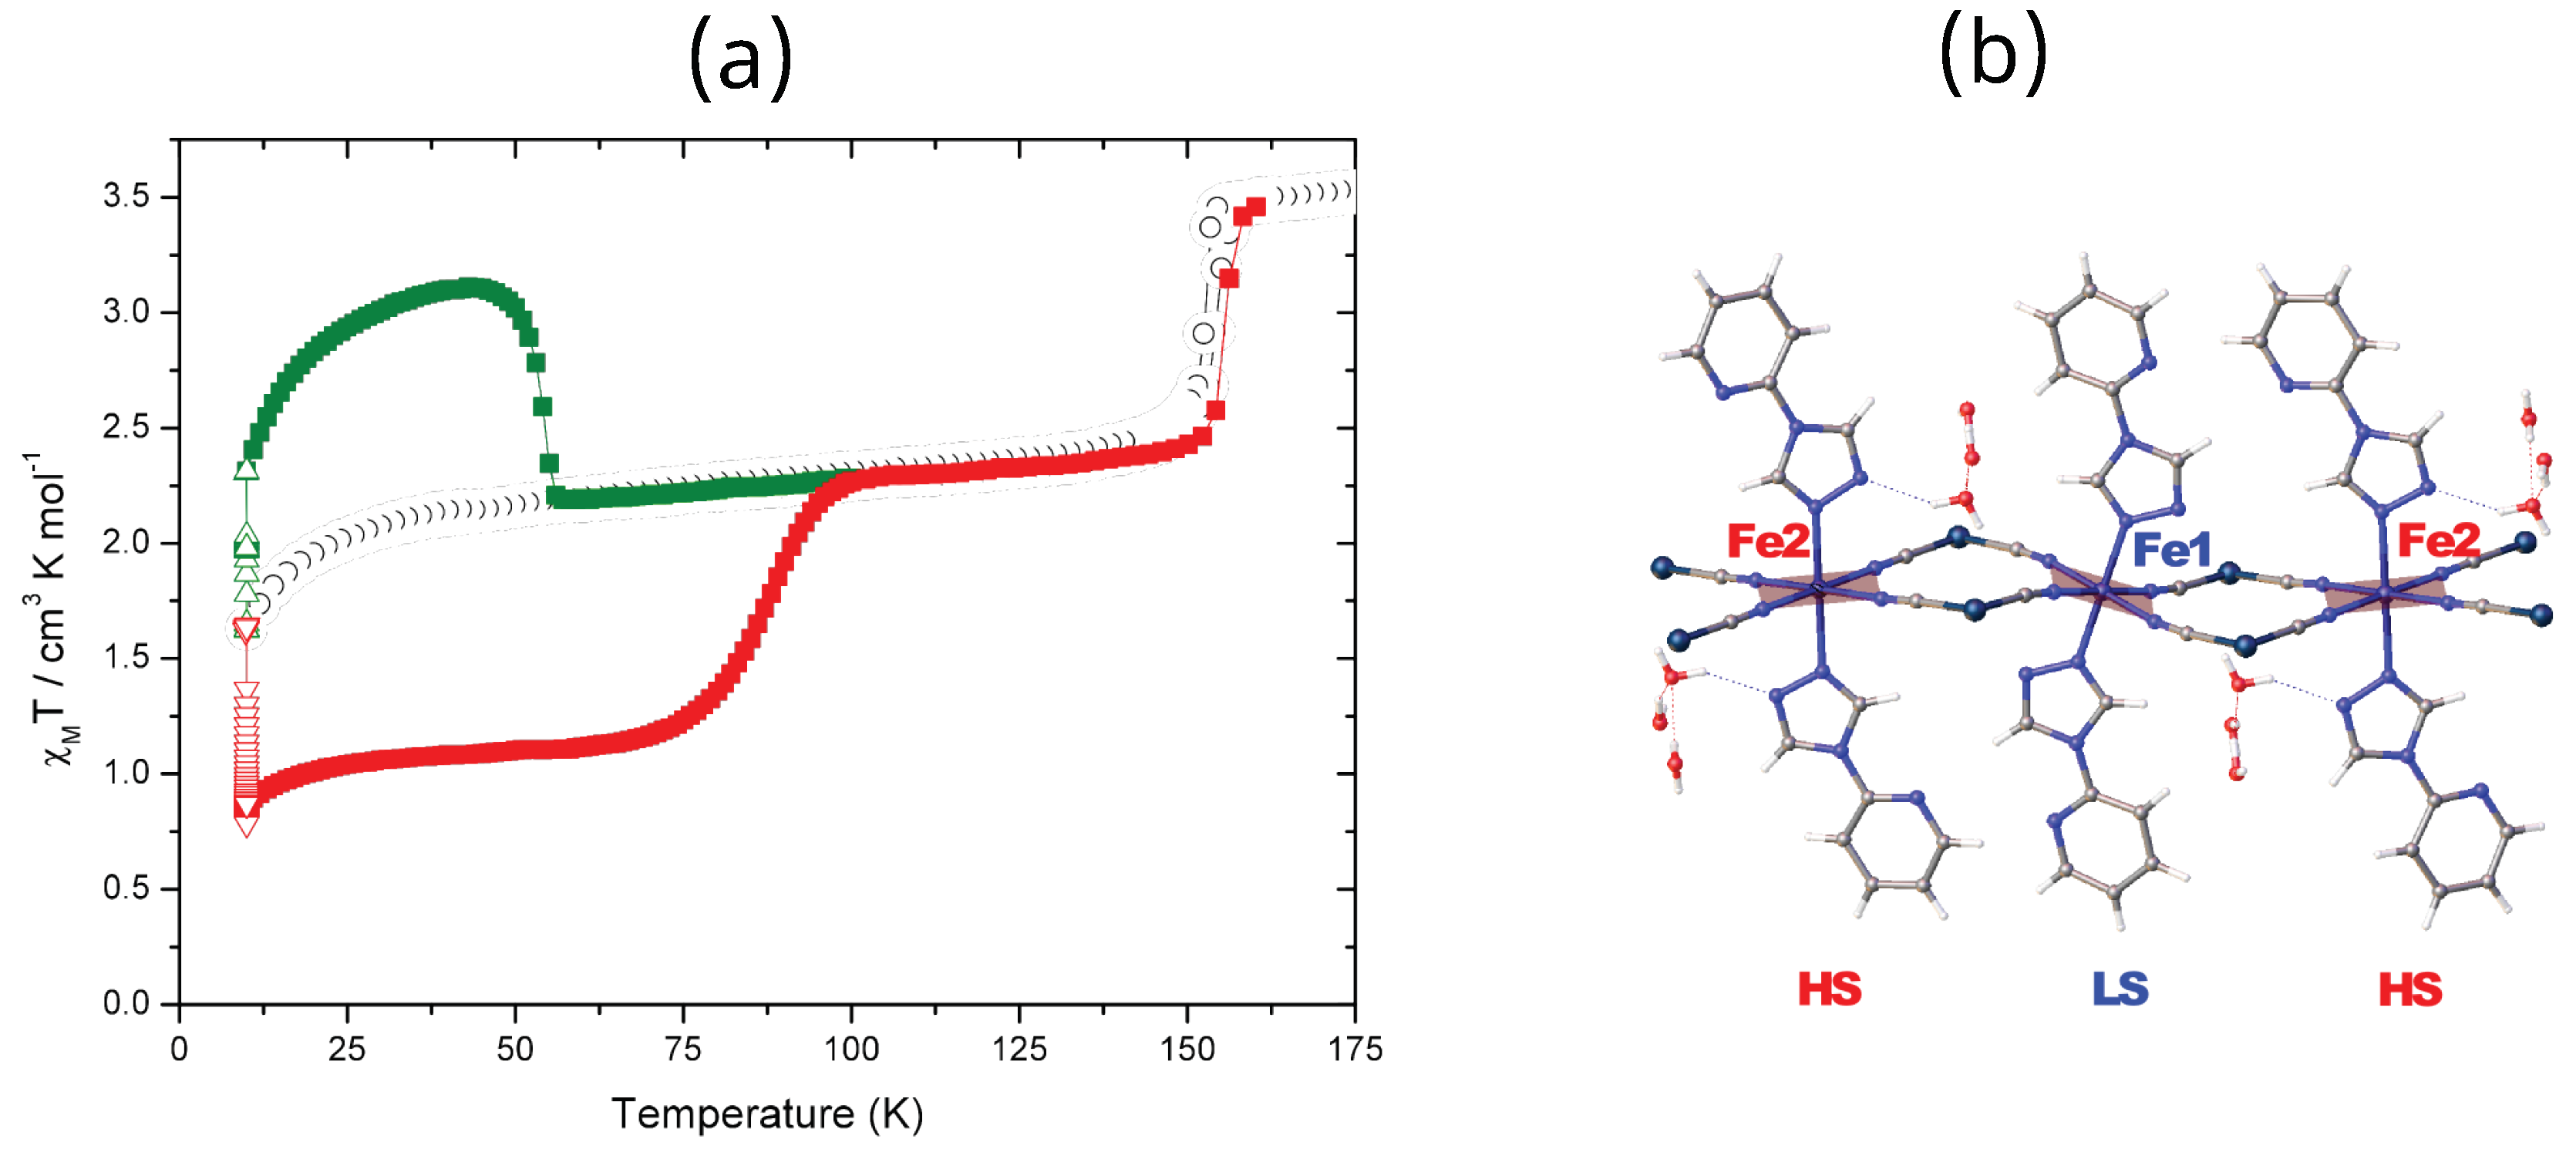
3.2. Magnetic and Structural Characterizations

Magnetic measurements of [Fe(2-pytrz) 2 {Pt(CN) 4 }]·3H 2 O performed in Ref. [45] and reported in Figure 1, show the cooperative character of this SCO material which leads to a thermally-induced first-order spin transition occurring around ∼152 K on cooling and ∼154 K on heating, accompanied with a thermal hysteresis of ca. 2 K width. As already discussed in Ref. [45], Figure 1a, shows χ m T values of 3.51 cm 3 ·K·mol 1 compatible with a HS ( S = 2 ) state of Fe(II) at high temperature, while below 150 K, this value drops abruptly to ca. 2.0 cm 3 ·K·mol 1 , indicating an incomplete spin transition, with the presence of 56 % residual HS fraction at low temperature. The slight decrease of this fraction at very low temperature (i.e., below 30 K) is attributed to zero field splitting effects, induced by the magnetic anisotropy of the current hexacoordinated Fe(II) ions. In agreement with X-rays diffraction data measurements [45], it was demonstrated that in the low-temperature regime, the spin transition involves one out of two atoms, as shown in Figure 1b. Indeed, the distortion experienced by one of the iron sites (see Figure 1b), originating from an elastic frustration occurring inside the lattice, induces the trapping of Fe1 in the HS state, thus precluding its transition at low-temperature.
In addition to the thermal hysteresis and the incomplete HS to HS-LS spin transition, Figure 1 reports the photomagnetic response of this compound under green light ( λ = 510 nm) showing a clear evidence of a LIESST (Light-Excited-Spin-State-Trapping) [45,46,47,48] effect allowing to access metastable photo-induced HS state at low-temperature. The resultant irradiated HS state relaxes back to the intermediate HS-LS state around ∼52 K. On the other hand, the excitation of the intermediate HS-LS low-temperature phase using a red wavelength ( λ = 830 nm) produced the reverse-LIESST effect [45,47,48,49], leading to the fully “stable” LS state, whose thermal relaxation to the intermediate HS-LS phase takes place at T 90 K. The investigations of the dynamical properties of this LS state allowed in a previous study [45] to demonstrate its stability at very low-temperature. It results that the intermediate HS-LS state is stable on cooling until some temperature located in the region 40–70 K and then becomes metastable due to its thermal freezing at lower temperatures.
This bistability between HS and HS-LS states was confirmed by DSC studies for which the thermal variation of the heat flow shows exo- and endothermic transitions at ∼151.8 K and ∼154.4 K, respectively (see Figure 2). The phase transition occurs with an enthalpy and entropy changes of Δ H = 4.8 kJ·mol 1 and Δ S = 30 J· K 1 · mol 1 , respectively, in agreement with the values reported in literature of SCO compounds [38,50]
The change of the unit cell parameters as well as β angle misfit between HS and HS-LS states is depicted in Table 1. The latter is compared to two other SCO compounds that have been already studied by optical microscopy, namely [{Fe(NCSe)(py) 2 } 2 (m-bpypz)] [37,42,43,44] and [Fe(btr) 2 (NCS) 2 ]·H 2 O [35]. One can see that the change of β angle is much smaller for the title compound, which then exhibits reduced distortion at the transition.
To avoid the strong elastic effects and volume changes which usually degrade the materials, and to compare the crystal shape effects on the interface behavior (shape and velocity), we investigate the spatio-temporal features of the compound [Fe(2-pytrz) 2 {Pt(CN) 4 }]·3H 2 O for which the unit cell distortion between the low-temperature and the high-temperature phases is less significant than those of compounds [{Fe(NCSe)(py) 2 } 2 (m-bpypz)] and [Fe(btr) 2 (NCS) 2 ](H 2 O). Indeed in [Fe(2-pytrz) 2 {Pt(CN) 4 }]·3H 2 O, the transition takes place between a fully HS phase at high temperature and an intermediate HS-LS phase at low-temperature, which then involves less volume change.

3.3. Optical Microscopy Measurements

Optical microscopy studies have been performed on a single crystal of the SCO compound [Fe(2-pytrz) 2 {Pt(CN) 4 }]·3H 2 O [45] of size ∼400 μ m × 300 μ m which exhibits an incomplete transition between a fully HS state at high temperature and a well organized HS-LS phase at low temperature [45].

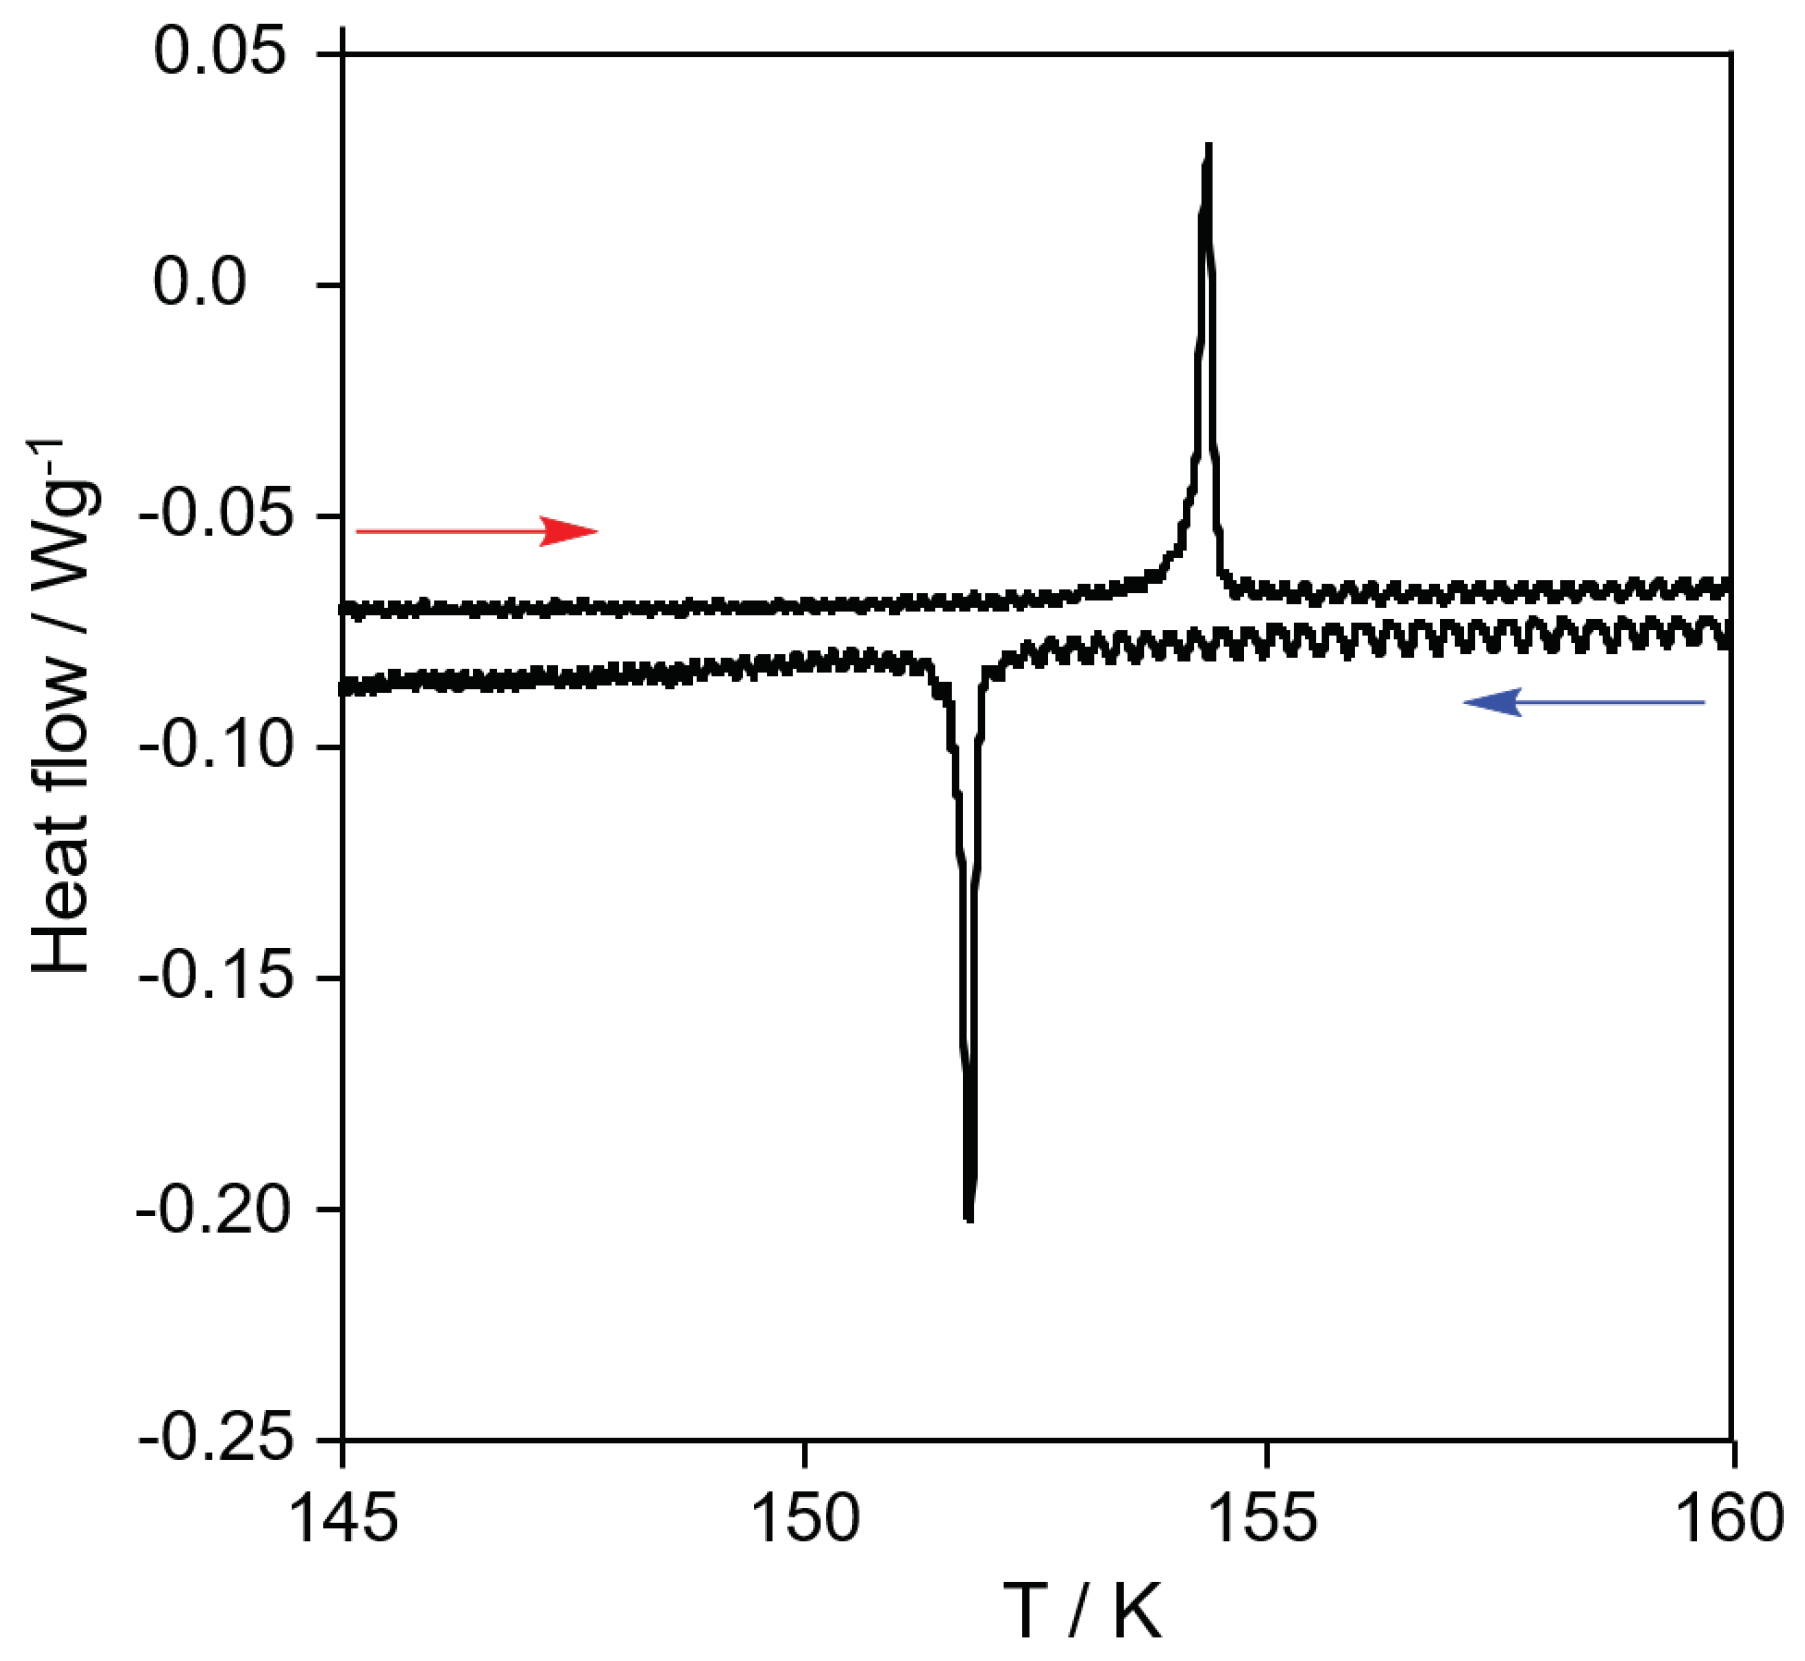
3.3.1. Thermal Hysteresis of One Single Crystal

OM investigations evidencing the spatio-temporal properties of the present single crystal along its thermal spin transition are reported in Figure 3a, which displays a set of selected snapshots on cooling and heating processes, exhibiting different colors in the HS and HS-LS phases. Furthermore, a single domain nucleation and growth mechanism upon spin transition accompanied with a well-defined interface between the two phases, is observed. We exploited the thermochromic character of this transformation, which leads to which leads to different optical densities (OD) [ O D = log 10 ( I 0 I ) , where I 0 is the incident bright field intensity and I is the transmitted intensity] for the HS and HS-LS states. The transition temperatures and the thermal hysteresis loop of the system, were evaluated using an image processing treatment, whose procedure was already explained in [38,51], the spatially averaged total OD emerging from the single crystal. The obtained thermal evolution of the OD is given in Figure 3b. It is worth mentioning that the local HS fraction, n ( x , y , T ) , of the system connects linearly to the normalized local OD, defined as n ( x , y , T ) = O D ( x , y , T ) O D ( H S L S ) O D ( H S ) O D ( H S L S ) (where OD(HS) and OD(HS-LS) are the OD values in the HS and intermediate HS-LS states, respectively).
The transition temperatures deduced from Figure 3b were found to be T 143 K on cooling and T + 153 K on heating. Compared to the magnetic data which led to T 152 K and T + 154 , one may conclude to the existence of a net disagreement. However, one has to consider that the thermal hysteresis of OM data relates to the transition of a unique single crystal, while that of magnetic measurements (Figure 1a) resulted from the average response of a large number of crystalline powder (or micro-crystals) sample with distributed sizes, shapes, transition temperatures and thermal hysteresis.
OM images of Figure 3a, recorded during the spin transition indicate that the first-order transition, on cooling between the HS and the intermediate HS-LS phases, starts from the bottom left corner (point A) and proceeds as a unique domain that propagates until reaching the first upper right corner (point B). During this first stage, the interface has more or less, a circular shape with contact angles perpendicular to the crystal edges. From point B the two crystal borders become parallel, which affects the interface shape becomes sigmoidal (S-shaped). This special shape is imposed by: (i) the border conditions between the interface and the crystal borders (i.e., the contact angles) which remain perpendicular to each others and (ii) the shift existing along the crystal length between the downer and upper interface points. When the interface reaches point C, a similar behavior as that of the first stage (A → B) occurs again, since its shape becomes again curved with contact angles equal to π 2 .

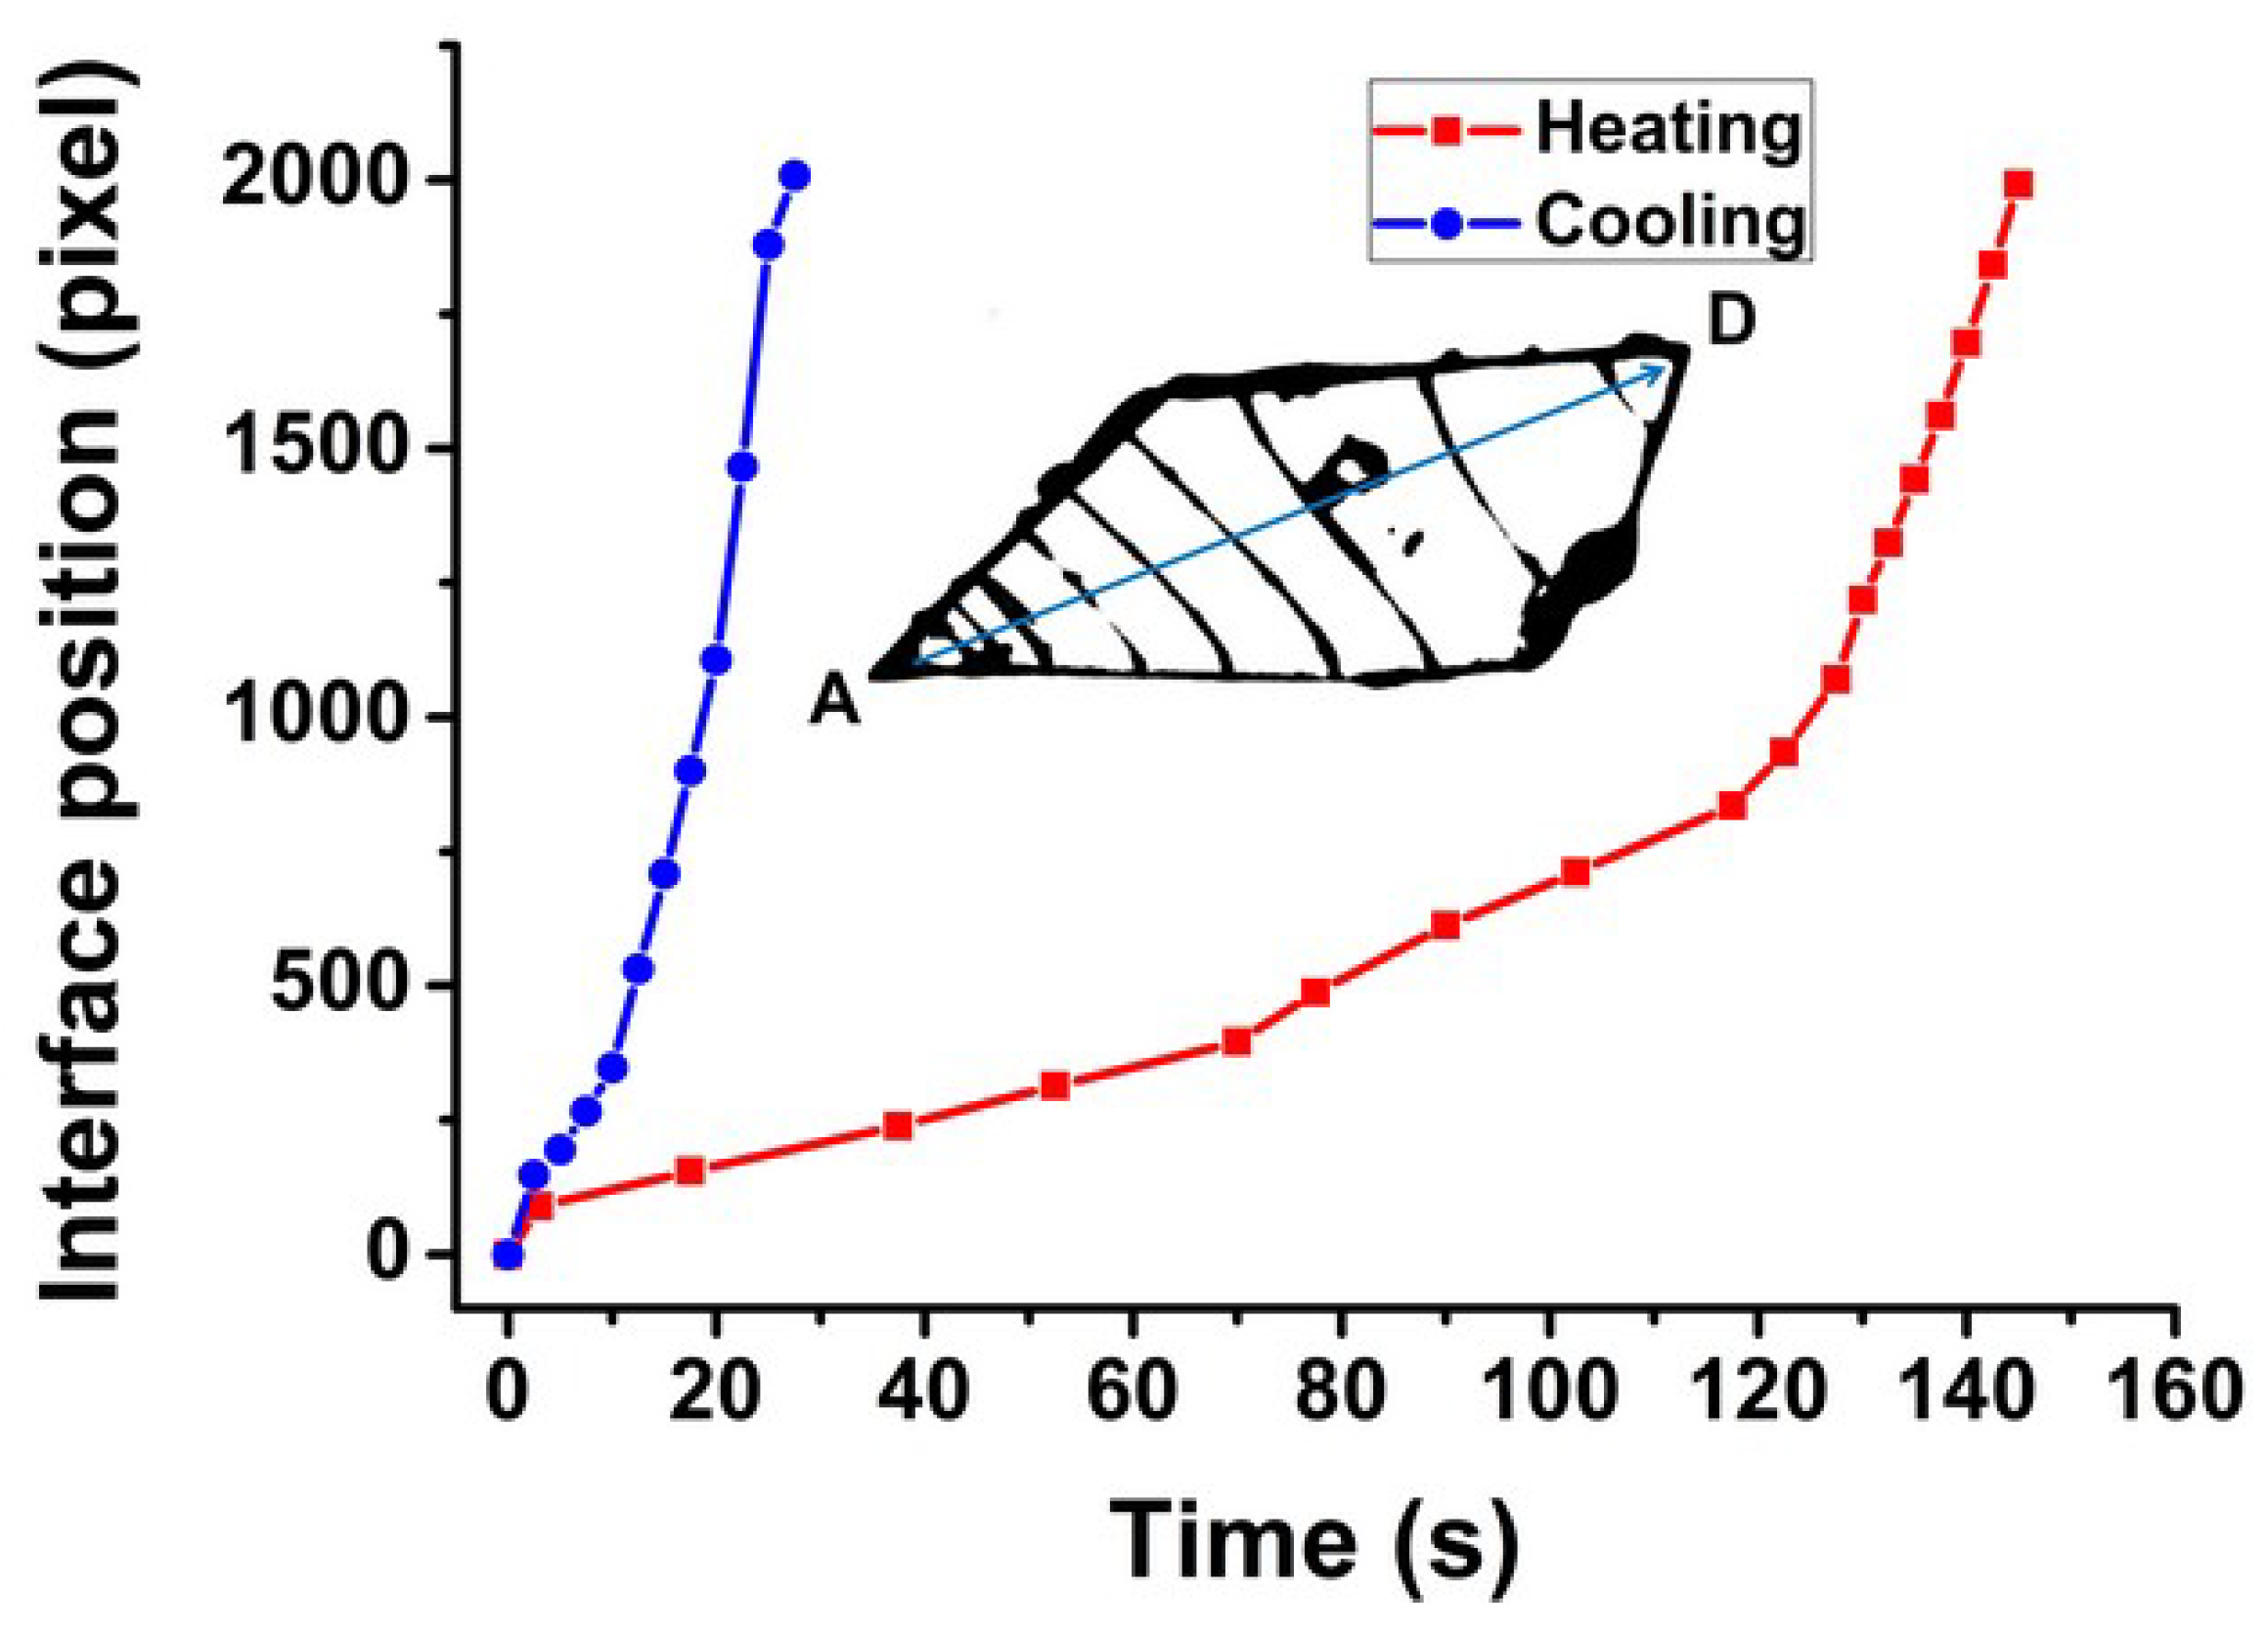
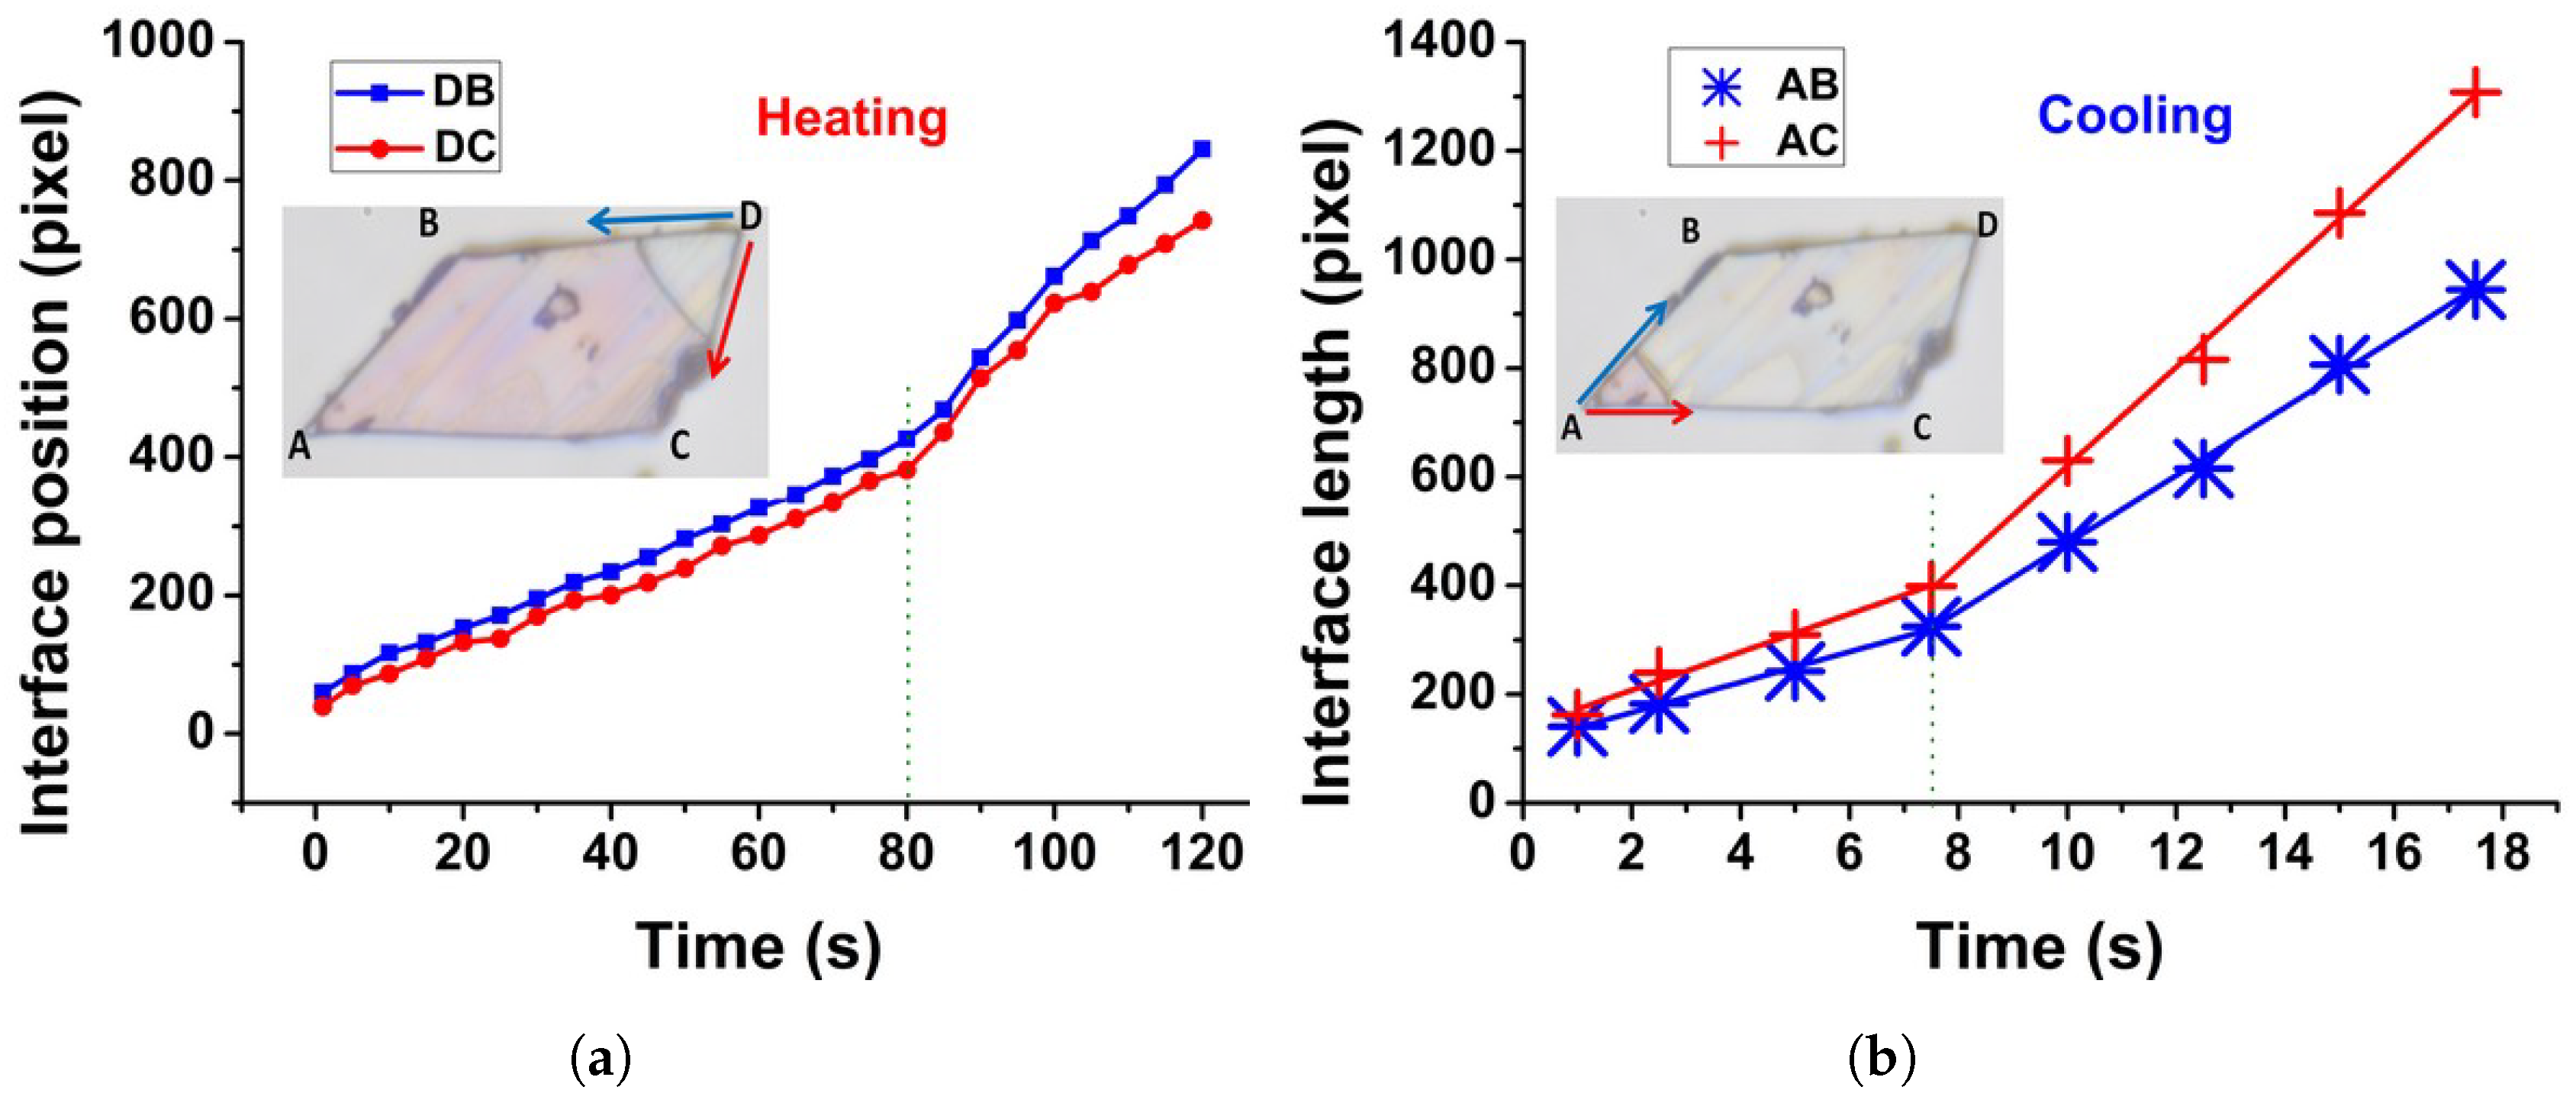
3.3.2. Interface Velocities

As we use the OM data to evaluate the thermal hysteresis loop of Figure 3b, we use it also to monitor the interface position along the diagonal line AD (see Figure 3a) as a function of time, the behavior of which is given in Figure 4. There, one can easily remark that the average velocity of the interface on cooling is higher than that on heating. We can also observe the existence of different propagation regimes with different velocities for both processes, attributed to the irregular shape of the single crystal, in good agreement with a similar study, recently realized on the analogous compound [Fe(2-pytrz) 2 Pd(CN) 4 ]·3H 2 O [38]. Figure 4 also evidences the occurrence of an acceleration regime when the interface gets close to the extremity of the single crystal. It is interesting to notice that this result is in good agreement with the predictions of recent theoretical investigations [40,52]. The quantitative evaluation of the average propagation velocities in the first regime before the acceleration are 17 μ m·s 1 and 2.3 μ m·s 1 on cooling and heating processes, respectively.
In Figure 5, we present the time evolution of the interface position along the crystal edges upon cooling and heating. In Figure 5a, the interface velocity is evaluated along DB and DC directions during the heating process. The obtained curves display a very similar behavior with the presence of a regime change (an acceleration) starting around t 80 s for both of them. In the first regime on DB and DC directions, the measured interface velocities are v 1 = 1.6 μ m·s 1 and v 1 = 1.4 μ m·s 1 , respectively, while for the second regime, we found the respective values, v 2 = 3.7 μ m·s 1 and v 2 = 3.1 μ m·s 1 . The set of obtained results is summarized in Table 2. The existence of the above two regimes is here attributed to the observable crystal defect, visible in the inset of Figure 5a along DC direction, which perturbs the interface propagation process on heating. Figure 5b presents the time-dependence of the interface position on cooling along AB and AC directions. There also, we remark the existence of two regimes. The first one, in AB and AC directions is characterized by the interface velocities, v 1 = 10 μ m·s 1 and v 1 = 12 μ m·s 1 , respectively, while the second regime has higher respective velocities, v 2 = 22 μ m·s 1 and v 2 = 32 μ m·s 1 . Interestingly, both curves show a regime change at the same time, t 8 s, which was identified as a particular time at which OM images show the spontaneous emergence of an additional HS-LS phase ahead the front interface. To emphasize this point, we represent in Figure 6 the spatial dependence of the transmitted light intensity across the interface along the blue line reported in the snapshots of Figure 6. This investigation is performed for different positions of the interface during the cooling regime. The intensity profile across the interface (Figure 6) is characterized by the presence of a significant reduction of the light intensity signal in the interface region compared to those of HS and HS-LS phases. This decrease is due to the darker character of the front which results from the light diffusion caused by the HS/(HS-LS) interface. In the right panels of Figure 6, we represented the intensity profile along the blue lines associated to the images of the left panel. For the two regimes showed in (b) and (c) images, the intensity profile shows a single peak corresponding to a unique interface, although that of image (b) appears as little bit broader. In contrast, the intensity profile corresponding to image (a), associated to the particular time value, t = 8 s, for which the velocity regime change appeared in Figure 5b, shows the existence of two peaks. This indicates the presence at this particular time of a second interface emerging ahead the main front. The origin of this second interface is attributed to a nucleation starting from the bottom of the crystal and initiated by the presence of defects which accelerate the process of relaxation of the elastic strain accompanying the volume change at the transition.
OM allows also to derive relevant information about the change of the crystal dimensions during the spin transition process. Using our own image processing software developed on Matlab, we could measure the distances AB, AC and AD in the low-temperature and high temperature phases, from which we deduced their relative variations. The obtained results are summarized in Table 3. Thanks to the good agreement with the relative variation of the lattice parameters extracted from X-rays studies [38,45] and summarized in the same Table 3, one can easily identify that the front propagation takes place in the a-b plane, where the most important changes are observed at the transition.

4. Theoretical Section

4.1. The Hamiltonian

The present experimental results are modeled using the kinetic version of an Ising model [53] in which the low- and the high-temperature phases are assumed to be LS and HS, respectively. We demonstrated in a previous work, that the spatiotemporal version of such a description leads to a reaction diffusion equation [38,54] that governs the time and space dependence of the HS fraction during the spin transition. The Hamiltonian of the Ising-like model is expressed as follows,
H = J i j S i S j + Δ e f f i S i .
In Equation (1), S i is a fictitious operator whose eigenvalues + 1 and 1 are respectively associated with the HS and LS states and J > 0 stands for the ferro-elastic interactions between the spin states, while Δ e f f = Δ k B T 2 ln g is the effective energy gap, which contains the contributions of the ligand-field energy, Δ , and the degeneracy ratio, g = g H S g L S , between the HS and LS states. The latter contribution enters under the form of an entropic term in the effective ligand-field energy. The mean-field analysis of Hamiltonian (1) leads quite easily to the following expression of the free energy,
F h o m = 1 2 J m 2 k B T ln [ 2 g cosh ( J m Δ e f f k B T ) ] ,
where m = < s > , is the average fictitious magnetization per site and T is the temperature. This net magnetization connects to the HS fraction, n H S , through the simple relation
n H S = 1 + m 2
The used parameters for this simulation are Δ = 380 K, ln g = 5 and J = 300 K. The transition temperature obtained with the model is here T 1 2 = 2 Δ k B ln ( g ) 150 K. The current model does not account for the elastic effects between the SCO sites nor for the volume change at the transition between LS and HS states. The equilibrium properties of the mean field version of Hamiltonian (1) have been carefully studied in the literature; they are obtained by solving the equation, F h o m m = 0 , which gives the state equation,
m = tanh β ( J m Δ e f f ) ,
whose resolution leads to specify the conditions of obtaining first-order and gradual spin transition [38,54]. This model is then quite well adapted to mimic the spatio-temporal behavior of SCO materials showing first-order transitions with low volume change. Here, we are mainly interested in the correlation between the dynamics of the HS-LS interface (as well as its shape along the propagation process) and its relation with the global macroscopic crystal’s shape. Therefore, to be as realistic as possible, we designed in the simulation a lattice which has a shape resembling that of the current crystal, shown in Figure 3.

4.2. Spatio-Temporal Aspects of the HS Fraction

According to the experimental results of OM, summarized in Figure 3, the interface propagates along the diagonal direction of the lattice, with different velocities along the lattice edges (Figure 4). This behavior supports the idea of the existence of strong anisotropic effects in the propagation process. To include this important property, we extended our previous isotropic reaction diffusion model [54], for which we give the main developments below.

Derivation of the Anisotropic Reaction Diffusion Approach

First, we start with the homogeneous mean-field free energy of Equation (2), that we expanded as function of n H S ( r , t ) and n H S , where r is the position and t, the time. The density of free energy at position r is then written as f ( r ) = f ( n H S , n H S ) for which corresponds the density of the homogeneous free energy f h o m ( n H S ) = f ( n H S , n H S = 0 ) which relates to F h o m through F h o m = V × f h o m ( n H S ) , where V denotes the system’s volume (here, the surface in 2D). Following a standard procedure, f ( n H S , n H S ) is expanded as a function of successive powers of the gradient of the HS fraction, giving
f ( n H S , n H S ) = f h o m ( n H S , 0 ) + L · n H S + 1 2 T · D i j · n H S ,
where,
L = L x 1 , L x 2 , L x 3 = f n H S / x i ,
is a vector evaluated at zero gradient, and D i j is a tensor property known as the gradient-energy coefficient with components,
D i j = 1 2 2 f n H S / x i n H S / x j ,
which should be a symmetric tensor. Since the free energy density does not depend on the direction of the gradients, we take L = 0 . Furthermore, if the homogeneous system has an inversion center, L is automatically zero, and if in addition the system is isotropic or cubic, D i j will be a diagonal tensor with equal components. In Equation (5), T is the transpose of the gradient operator. So, in the general case of an anisotropic material, the density of free energy is given by,
f ( n H S , n H S ) = f h o m ( n H S , 0 ) + 1 2 T · D i j · n H S .
and the equation of motion of the HS fraction, including the spatial variations, is expressed as,
n H S t = f n H S .
The local diffusion potential f ( r ) at instant t = t 0 can be determined from the variation of the rate of the total free energy, F , as follows
F t 0 = V f h o m n H S ( r , t 0 ) + L · n H S + 1 2 T n H S D i j · n H S d V ,
where, we have kept the general expression of f ( r ) , given in Equation (5). Considering that the order parameter varies with the local velocity, as n H S ( r , t ) = n H S ( r , t 0 ) + n H S ˙ × t , we can estimate the rate of variation of F at t 0 , as follows
d F d t t 0 = V f h o m n H S ( r , t 0 ) n H S n H S ˙ + L · n H S ˙ + T n H S ˙ D i j · n H S d V .
Using the general identity
T p ˙ D i j p = p ˙ T D i j p + T p ˙ D i j · p ,
which is combined to the divergence theorem, and applying Newman border conditions which zeros the gradient of the HS fraction at the lattice borders one easily finds the following expression for the rate of variation of F ,
d F d t t 0 = V f h o m n H S ( r , t 0 ) n H S T D i j · n H S n H S ˙ d V .
Since the lattice parameters varies with a quantity δ n H S = n H S ˙ × δ t , the change in the total potential, δ F is then the sum of local variations and can be written as,
δ F = V f h o m n H S ( r , t 0 ) n H S T D i j · n H S δ n H S r d V .
The quantity between brackets in Equation (14) is the change of the density of local free energy resulting from the change of HS fraction. The equation of motion is then simply given by
n H S t = δ d F d V δ n H S .

4.3. The Spatio-Temporal Equation of Motion of the HS Fraction

The general spatio-temporal equation of motion of the HS fraction for an anisotropic diffusion of the spin states, is deduced from Equation (15) as follows,
n H S t = Γ F h o m n H S + T D i j · n H S ,
where Γ is a time scale factor. The anisotropy of the diffusion constant may have several origins, among which we quote (i) the anisotropic deformation of the unit cell at the transition between the LS and HS states, as already demonstrated for the SCO compound [{Fe(NCSe)(py) 2 } 2 (m-bpypz)] [37], or (ii) the existence of direction-dependent elastic constants acting between the SCO units, as well as (iii) the presence of a crystalline misorientation (a jump in angle across the boundary) which leads to an inclination angle of the boundary plane between the LS and the HS phases. On the other hand, ideally the gradient n H S and the diffusion tensor D i j (given in Equation (7)) should be calculated in the crystalline frame, which is not the same in the intermediate HS-LS and HS states of the title compound.
Because of the change of the unit cell structure at the transition, the direct relation between the tensor D i j and crystalline frame is far from obvious. However, if one considers that the crystal structure remains unchanged, and the misorientation angle at the interface is zero, then the diffusion tensor can be written in the general form as D i j = R θ T D i j d i a g R θ , where D i j d i a g is the diagonal diffusion constant, and R θ is the transfer matrix where the superscript “ T ” stands here for the transpose. The matrices D i j d i a g and R θ have the following expressions,
D i j d i a g = D 1 0 0 D 2 and R θ = cos θ sin θ sin θ cos θ .
By developing D i j as function of D 1 , D 2 and θ , whose expressions are introduced in Equation (16), the following general equation of motion is obtained:
n H S t = Γ n F h o m n H S + D x x 2 x 2 + D y y 2 y 2 + D x y 2 x y n H S ,
where, the expressions of the three components of the diffusion tensor, connect to D 1 , D 2 and θ , as follows,
D x x = D 1 cos 2 θ + D 2 sin 2 θ , D y y = D 1 sin 2 θ + D 2 cos 2 θ , D x y = D 1 D 2 cos θ sin θ .
According to Equation (7), the elements of the diffusion tensor, D i j , have the following expressions,
D x x = 1 2 2 f 2 n H S / x , D y y = 1 2 2 f 2 n H S / y D x y = 1 2 2 f n H S / x n H S / y .
Equation (18) expresses the motion of a front interface in the case of an anisotropic diffusion of spin states. In these qualitative simulations, we used D 1 = 2.0 μ m 2 ·s 1 , D 2 = 15.0 μ m 2 ·s 1 and θ = 30 , which were found to well reproduce the experimental shapes of the interface. However, it should be noted that other triplets of solutions may also exist.
It is interesting to discuss briefly some limiting cases. First of all, in the stationary and uniform state, i.e., n H S t = 0 and and 2 n H S = 0 , Equation (18) gives the self-consistent mean-field Equation (4), which describes the equilibrium properties of the SCO material. Furthermore, one can easily see that in the case of an isotropic diffusion of the spin states, i.e., D 1 = D 2 = D , Equation (18) leads to D x y = 0 and D x x = D x y = D , which allows to recover the previous equation of motion,
n H S t = Γ n F h o m n H S + D Δ n H S ,
that we have established in Ref. [54] to describe the front propagation observed in the SCO compound [{Fe(NCSe)(py) 2 } 2 (m-bpypz)]. The solutions of Equation (18) have the form (in 1D) n H S ( x , t ) = a + b tanh ( x v t δ ) where v is the interface velocity and δ is its width. Here v is proportional to D , and the propagation direction takes place along the crystal length with a right interface as we demonstrated in a previous report [54], which does no meet the experimental results of Figure 3.
Unfortunately, the analytical resolution of the anisotropic reaction diffusion Equation (18) is out of reach, although one may expect that the existence of several components in the Laplacian of the HS fraction will drive the front propagation along a direction depending on the ratio D 2 D 1 .
Equation (18) is then solved numerically, after discretization of time and space using finite difference method, where the used space ( d x , d y ) and time ( d t ) steps values are, d x = d y = 0.2 μ m and d t = 0.001 s.
As clearly shown by Figure 7, the calculated snapshots are in excellent agreement with the experimental results proving the reliability of the anisotropic reaction diffusion model in the description of the spatio-temporal features of the front propagation accompanying the first-order transitions of [Fe(2-pytrz) 2 {Pt(CN) 4 }]·3H 2 O SCO single crystal. In particular, it is found that the anisotropy of the spin states diffusion tensor, D i j , allows here to control the direction of propagation of the interface, which depends on the angle θ and the ratio D 2 D 1 . Furthermore, the shape of the simulated HS/LS interface, its variation along the transformation process and the obtained contact angles with the “crystal” edges are very similar to the experimental ones (see Figure 7).
Furthermore, it is an interesting extension to consider the direct connection between the tensor elements D 1 , D 2 and θ or D x x , D x y , D y y and the crystallographic data. For that the gradients of HS fraction, should be expressed in the crystallographic basis of the material. Let us denote by a and b the two vectors of unit cell attached to the material in which a point M has the coordinates ( x , y ) and by i , j the orthonormal system attached to the laboratory framework, where the same point has the coordinates ( x , y ) , so that we have O M = x i + y j = x a + y b . The transfer matrix between the two basis, denoted P, is made of scalar products between the two vectors of the sets of basis. It is easy to demonstrate that gradient operator in the crystal frame is expressed,
= A x a + B y b ,
where A = 1 x x + y x and B = 1 x y + y y depend on the scalar products between the crystal and laboratory set of basis defined above.
Since the objective of this part is to re-write the equation of motion (18) of the HS fraction in the crystal frame, it is enough to focus on the diffusion part, i.e., · D · , whose developed expression can be written,
· D i j · = A 2 a 2 D x x 2 x 2 + B 2 b 2 D y y 2 y 2 + A a · b D x y + D y x 2 x y
The comparison between Equations (18) and (23) in which the diffusion parts should be equal, allows to connect the tensor elements of the diffusion tensors D and D, as follows:
D x x = A 2 a 2 D x x , D y y = B 2 b 2 D y y , D x y + D y x = A × B a · b D x y + D y x .
These equations help to better understand how the lattice structure affects the diffusion tensor and so the direction of propagation of the HS/LS interface. These interesting features will be examined in a further work.

5. Conclusions

We have presented the spatio-temporal aspects of the spin transition derived from OM experiments, of a new robust single crystal of the compound [Fe(2-pytrz) 2 {Pt(CN) 4 }]·3H 2 O showing a clear correlation between the HS/HS-LS interface properties at the thermal transition and the macroscopic crystal shape. In particular, the shape, the length and the velocity of the interface adapts to the change of the macroscopic crystal shape during the propagation process. This interplay between the electro-elastic HS/HS-LS interface and the macroscopic characteristics of the crystal validates our belief that the origin of the elastic interactions in SCO materials are of long-range nature, as predicted in related elastic models [37,39,40,41,42]. In addition, the analysis of the total crystal length change derived from OM data enabled to find an excellent agreement with X-rays data [45], thus enhancing the relevance of this technique. Finally, the present experimental spatio-temporal findings are adequately described by a reaction diffusion formalism which allowed to reproduce the main experimental features, such as (i) the diagonal character of the front propagation and (ii) the change of the interface shape according to that of the crystal during the transition. To reproduce these aspects, we extended our previous spatio-temporal mean-field dynamics to include anisotropic effects of the spin state “diffusion”, resulting in a more general description, which can be studied for its own. This work highlights the importance of synthesis of cooperative SCO materials showing incomplete transitions, which present less volume change, thus enhancing their resilience at the transition. Experiments on light driven interface control are in progress to explore the dynamical response of the interface to such excitations.

Author Contributions

H.F. did the optical microscopy measurements and made the image processing of the data. G.B. helped in the technical developments of the experimental setup of cryogenic optical microscopy. M.P.-E. worked on the experimental modeling of the spatiotemporal data and did the simulations of the reaction diffusion model. S.T., synthesized the sample, did and analyzed the crystallographic and the calorimetric measurements. K.B. supervised the optical microscopy and theoretical works and wrote the paper with the contribution of all authors.

Funding

This research was funded by the CNRS, Université de Versailles Saint-Quentin-en-Yvelines, Université Paris Saclay, Université de Brest, and by “Agence Nationale de la Recherche” (ANR project BISTA-MAT: ANR-12-BS07-0030-01).

Acknowledgments

The authors are indebted to CNRS and the Université de Versailles St-Quentin, member of the Université Paris-Saclay, for their financial support.

Conflicts of Interest

There are no conflicts to declare.

References

  1. Cavallini, M. Status and perspectives in thin films and patterning of spin crossover compounds. Phys. Chem. Chem. Phys. 2012, 14, 11867–11876. [Google Scholar] [CrossRef] [PubMed]
  2. Shepherd, H.J.; Molnár, G.; Nicolazzi, W.; Salmon, L.; Bousseksou, A. Spin Crossover at the Nanometre Scale. Eur. J. Inorg. Chem. 2013, 2013, 653–661. [Google Scholar] [CrossRef]
  3. Cavallini, M.; Bergenti, I.; Milita, S.; Kengne, J.C.; Gentili, D.; Ruani, G.; Salitros, I.; Meded, V.; Ruben, M. Thin deposits and patterning of room-temperature-switchable one-dimensional spin-crossover compounds. Langmuir 2011, 27, 4076–4081. [Google Scholar] [CrossRef] [PubMed]
  4. Naik, A.D.; Stappers, L.; Snauwaert, J.; Fransaer, J.; Garcia, Y. A Biomembrane Stencil for Crystal Growth and Soft Lithography of a Thermochromic Molecular Sensor. Small 2010, 6, 2842–2846. [Google Scholar] [CrossRef] [PubMed]
  5. Basak, S.; Hui, P.; Chandrasekar, R. Flexible and Optically Transparent Polymer Embedded Nano/Micro Scale Spin Crossover Fe(II) Complex Patterns/Arrays. Chem. Mater. 2013, 25, 3408–3413. [Google Scholar] [CrossRef]
  6. Gütlich, P.; Goodwin, H.A. Spin crossover—An overall perspective. In Spin Crossover in Transition Metal Compounds I; Topics in Current Chemistry; Springer: Berlin/Heidelberg, Germany, 2004; Volume 233, pp. 1–47. [Google Scholar]
  7. Linares, J.; Codjovi, E.; Garcia, Y. Pressure and temperature spin crossover sensors with optical detection. Sensors 2012, 12, 4479–4492. [Google Scholar] [CrossRef]
  8. Bousseksou, A.; Molnár, G.; Salmon, L.; Nicolazzi, W. Molecular spin crossover phenomenon: Recent achievements and prospects. Chem. Soc. Rev. 2011, 40, 3313–3335. [Google Scholar] [CrossRef]
  9. Gütlich, P.; Gaspar, A.B.; Garcia, Y. Spin state switching in iron coordination compounds. Beilstein J. Org. Chem. 2013, 9, 342–391. [Google Scholar] [CrossRef] [Green Version]
  10. Cavallini, M.; Melucci, M. Organic Materials for Time–Temperature Integrator Devices. ACS Appl. Mater. Interfaces 2015, 7, 16897–16906. [Google Scholar] [CrossRef]
  11. Gentili, D.; Demitri, N.; Schäfer, B.; Liscio, F.; Bergenti, I.; Ruani, G.; Ruben, M.; Cavallini, M. Multi-modal sensing in spin crossover compounds. J. Mater. Chem. C 2015, 3, 7836–7844. [Google Scholar] [CrossRef]
  12. Naik, A.D.; Robeyns, K.; Meunier, C.F.; Léonard, A.F.; Rotaru, A.; Tinant, B.; Filinchuk, Y.; Su, B.L.; Garcia, Y. Selective and Reusable Iron(II)-Based Molecular Sensor for the Vapor-Phase Detection of Alcohols. Inorg. Chem. 2014, 53, 1263–1265. [Google Scholar] [CrossRef] [PubMed]
  13. Boukheddaden, K.; Ritti, M.H.; Bouchez, G.; Sy, M.; Dîrtu, M.M.; Parlier, M.; Linares, J.; Garcia, Y. Quantitative Contact Pressure Sensor Based on Spin Crossover Mechanism for Civil Security Applications. J. Phys. Chem. C 2018, 122, 7597–7604. [Google Scholar] [CrossRef]
  14. Shepherd, H.J.; Gural’skiy, I.A.; Quintero, C.M.; Tricard, S.; Salmon, L.; Molnar, G.; Bousseksou, A. Molecular actuators driven by cooperative spin-state switching. Nat. Commun. 2013, 4, 2607. [Google Scholar] [CrossRef] [PubMed] [Green Version]
  15. Sy, M.; Garrot, D.; Slimani, A.; Paez-Espejo, M.; Varret, F.; Boukheddaden, K. Reversible Control by Light of the High-Spin Low-Spin Elastic Interface inside the Bistable Region of a Robust Spin-Transition Single Crystal. Angew. Chem. Int. Ed. 2016, 55, 1755–1759. [Google Scholar] [CrossRef]
  16. Paez-Espejo, M.; Sy, M.; Boukheddaden, K. Unprecedented Bistability in Spin-Crossover Solids Based on the Retroaction of the High Spin Low-Spin Interface with the Crystal Bending. J. Am. Chem. Soc. 2018, 140, 11954–11964. [Google Scholar] [CrossRef] [PubMed]
  17. König, E. Nature and dynamics of the spin-state interconversion in metal complexes. In Complex Chemistry; Springer: Berlin/Heidelberg, Germany, 1991; pp. 51–152. [Google Scholar]
  18. Gütlich, P.; Hauser, A.; Spiering, H. Thermal and optical switching of iron(II) complexes. Angew. Chem. Int. Ed. 1994, 33, 2024–2054. [Google Scholar] [CrossRef]
  19. Köhler, C.P.; Jakobi, R.; Meissner, E.; Wiehl, L.; Spiering, H.; Gütlich, P. Nature of the phase transition in spin crossover compounds. J. Phys. Chem. Solids 1990, 51, 239–247. [Google Scholar] [CrossRef]
  20. Bousseksou, A.; Negre, N.; Goiran, M.; Salmon, L.; Tuchagues, J.P.; Boillot, M.L.; Boukheddaden, K.; Varret, F. Dynamic triggering of a spin-transition by a pulsed magnetic field. Eur. Phys. J. B 2000, 13, 451–456. [Google Scholar]
  21. Hauser, A.; Jeftic, J.; Romstedt, H.; Hinek, R.; Spiering, H. Cooperative phenomena and light-induced bistability in iron(ii) spin-crossover compounds. Coord. Chem. Rev. 1999, 190, 471–491. [Google Scholar] [CrossRef]
  22. Kambara, T. The Effect of Iron Concentration on the High-Spin Low-Spin Transitions in Iron Compounds. J. Phys. Soc. Jpn. 1980, 49, 1806–1811. [Google Scholar] [CrossRef]
  23. Sasaki, N. Theory of cooperative high-spin low-spin transitions in iron (iii) compounds induced by the molecular distortions. J. Chem. Phys. 1981, 74, 3472. [Google Scholar] [CrossRef]
  24. D’Avino, G.; Painelli, A.; Boukheddaden, K. Vibronic model for spin crossover complexes. Phys. Rev. B 2011, 84, 104119. [Google Scholar] [CrossRef]
  25. Klinduhov, N.; Boukheddaden, K. Vibronic Theory of Ultrafast Intersystem Crossing Dynamics in a Single Spin-Crossover Molecule at Finite Temperature beyond the Born-Oppenheimer Approximation. J. Phys. Chem. Lett. 2016, 7, 722–727. [Google Scholar] [CrossRef] [PubMed]
  26. Castro, M.; Roubeau, O.; Pineiro-Lopez, L.; Real, J.A.; Rodriguez-Velamazan, J.A. Pulsed-Laser Switching in the Bistability Domain of a Cooperative Spin Crossover Compound: A Critical Study through Calorimetry. J. Phys. Chem. C 2015, 119, 17334–17343. [Google Scholar] [CrossRef] [Green Version]
  27. De Gaetano, Y.; Jeanneau, E.; Verat, A.Y.; Rechignat, L.; Bousseksou, A.; Matouzenko, G.S. Ligand Induced Distortions and Magneto Structural Correlations in a Family of Dinuclear Spin Crossover Compounds with Bipyridyl Like Bridging Ligands. Eur. J. Inorg. Chem. 2013, 2013, 1015–1023. [Google Scholar] [CrossRef]
  28. Pillet, S.; Hubsch, J.; Lecomte, C. Single crystal diffraction analysis of the thermal spin conversion in [Fe(btr)2(NCS)2](H2O): Evidence for spin-like domain formation. Eur. Phys. J. B 2004, 38, 541–552. [Google Scholar] [CrossRef]
  29. Gawali-Salunke, S.; Varret, F.; Maurin, I.; Enachescu, C.; Malarova, M.; Boukheddaden, K.; Codjovi, E.; Tokoro, H.; Ohkoshi, S.; Hashimoto, K. Magnetic and Mössbauer Investigation of the Photomagnetic Prussian Blue Analogue Na0.32Co[Fe(CN)6]0.74·3.4H2O: Cooperative Relaxation of the Thermally Quenched State. J. Phys. Chem. B 2005, 109, 8251–8256. [Google Scholar] [CrossRef]
  30. Mishra, V.; Mukherjee, R.; Linares, J.; Balde, C.; Desplanches, C.; Letard, J.F.; Collet, E.; Toupet, L.; Castro, M.; Varret, F. Temperature-dependent interactions and disorder in the spin-transition compound [FeII(L)2][ClO4]2·C7H8 through structural, calorimetric, magnetic, photomagnetic, and diffuse reflectance investigations. Inorg. Chem. 2008, 47, 7577–7587. [Google Scholar] [CrossRef]
  31. Varret, F.; Chong, C.; Goujon, A.; Boukheddaden, K. Light-induced phase separation (LIPS) in [Fe(ptz)6](BF4)2 spin-crossover single crystals: Experimental data revisited through optical microscope investigation. J. Phys. Conf. Ser. 2009, 148, 012036. [Google Scholar] [CrossRef]
  32. Goujon, A.; Varret, F.; Boukheddaden, K.; Chong, C.; Jeftic, J.; Garcia, Y.; Naik, A.D.; Ameline, J.C.; Collet, E. An optical microscope study of photo-switching and relaxation in single crystals of the spin transition solid [Fe(ptz)6](BF4)2, with image processing. Inorg. Chim. Acta 2008, 361, 4055–4064. [Google Scholar] [CrossRef]
  33. Chong, C.; Mishra, H.; Boukheddaden, K.; Denise, S.; Bouchez, G.; Collet, E.; Ameline, J.C.; Naik, A.D.; Garcia, Y.; Varret, F. Electronic and Structural Aspects of Spin Transitions Observed by Optical Microscopy. The Case of [Fe(ptz)6](BF4)2. J. Phys. Chem. B 2010, 114, 1975–1984. [Google Scholar] [CrossRef]
  34. Slimani, A.; Varret, F.; Boukheddaden, K.; Chong, C.; Mishra, H.; Haasnoot, J.; Pillet, S. Visualization and quantitative analysis of spatiotemporal behavior in a first-order thermal spin transition: A stress-driven multiscale process. Phys. Rev. B 2011, 84, 094442. [Google Scholar] [CrossRef]
  35. Varret, F.; Slimani, A.; Boukheddaden, K.; Chong, C.; Mishra, H.; Collet, E.; Haasnoot, J.; Pillet, S. The Propagation of the Thermal Spin Transition of [Fe(btr)2(NCS)2](H2O) Single Crystals, Observed by Optical Microscopy. New J. Chem. 2011, 35, 2333. [Google Scholar] [CrossRef]
  36. Chong, C.; Slimani, A.; Varret, F.; Boukheddaden, K.; Collet, E.; Ameline, J.C.; Bronisz, R.; Hauser, A. The kinetics features of a thermal spin transition characterized by optical microscopy on the example of [Fe(bbtr)3](ClO4)2 single crystals: Size effect and mechanical instability. Chem. Phys. Lett. 2011, 504, 29–33. [Google Scholar] [CrossRef]
  37. Sy, M.; Varret, F.; Boukheddaden, K.; Bouchez, G.; Marrot, J.; Kawata, S.; Kaizaki, S. Structure-Driven Orientation of the High-Spin–Low-Spin Interface in a Spin-Crossover Single Crystal. Angew. Chem. 2014, 126, 7669–7672. [Google Scholar] [CrossRef]
  38. Fourati, H.; Milin, E.; Slimani, A.; Chastanet, G.; Abid, Y.; Triki, S.; Boukheddaden, K. Interplay between a crystal’s shape and spatiotemporal dynamics in a spin transition material. Phys. Chem. Chem. Phys. 2018, 20, 10142–10154. [Google Scholar] [CrossRef]
  39. Nishino, M.; Enachescu, C.; Miyashita, S.; Rikvold, P.A.; Boukheddaden, K.; Varret, F. Macroscopic nucleation phenomena in continuum media with long-range interactions. Sci. Rep. 2011, 1, 162. [Google Scholar] [CrossRef]
  40. Slimani, A.; Boukheddaden, K.; Varret, F.; Nishino, M.; Miyashita, S. Properties of the low-spin high-spin interface during the relaxation of spin-crossover materials, investigated through an electro-elastic model. J. Chem. Phys. 2013, 139, 194706. [Google Scholar] [CrossRef]
  41. Slimani, A.; Boukheddaden, K.; Yamashita, K. Effect of intermolecular interactions on the nucleation, growth, and propagation of like-spin domains in spin-crossover materials. Phys. Rev. B 2015, 92, 014111. [Google Scholar] [CrossRef]
  42. Traiche, R.; Oubouchou, H.; Zergoug, M.; Boukheddaden, K. Spatio-temporal aspects of the domain propagation in a spin-crossover lattice with defect. Phys. B Condens. Matter 2017, 516, 77–84. [Google Scholar] [CrossRef]
  43. Slimani, A.; Varret, F.; Boukheddaden, K.; Garrot, D.; Oubouchou, H.; Kaizaki, S. Velocity of the high-spin low-spin interface inside the thermal hysteresis loop of a spin-crossover crystal, via photothermal control of the interface motion. Phys. Rev. Lett. 2013, 110, 087208–087213. [Google Scholar] [CrossRef] [PubMed]
  44. Sy, M.; Traiche, R.; Fourati, H.; Singh, Y.; Varret, F.; Boukheddaden, K. Spatiotemporal Investigations on Light-Driven High-Spin– Low-Spin Interface Dynamics in the Thermal Hysteresis Region of a Spin-Crossover Single Crystal. J. Phys. Chem. C 2018, 122, 20952–20962. [Google Scholar] [CrossRef]
  45. Milin, E.; Patinec, V.; Triki, S.; Bendeif, E.E.; Pillet, S.; Marchivie, M.; Chastanet, G.; Boukheddaden, K. Elastic Frustration Triggering Photoinduced Hidden Hysteresis and Multistability in a Two-Dimensional Photoswitchable Hofmann-Like Spin-Crossover Metal Organic Framework. Inorg. Chem. 2016, 55, 11652–11661. [Google Scholar] [CrossRef] [PubMed]
  46. Decurtins, S.; Gütlich, P.; Köhler, C.P.; Spiering, H.; Hauser, A. Light-induced excited spin state trapping in a transition-metal complex: The hexa-1-propyltetrazole-iron (II) tetrafluoroborate spin-crossover system. Chem. Phys. Lett. 1984, 105, 1–4. [Google Scholar] [CrossRef]
  47. Boukheddaden, K.; Sy, M. Direct Optical Microscopy Observation of Photo-Induced Effects and Thermal Relaxation in a Spin Crossover Single Crystal. Curr. Inorg. Chem. 2016, 6, 40–48. [Google Scholar] [CrossRef]
  48. Chastanet, G.; Desplanches, C.; Baldé, C.; Rosa, P.; Marchivie, M.; Guionneau, P. A critical review of the T(LIESST) temperature in spin-crossover materials What it is and what it is not. Chem. Sq. 2018, 2. [Google Scholar] [CrossRef]
  49. Hauser, A. Reversibility of light-induced excited spin state trapping in the Fe(ptz)6(BF4)2, and the Zn1−xFex(ptz)6(BF4)2 spin-crossover systems. Chem. Phys. Lett. 1986, 124, 543–548. [Google Scholar] [CrossRef]
  50. Sorai, M.; Seki, S. Phonon coupled cooperative low-spin 1A1 ⇌ high-spin 5T2 transition in [Fe(phen)2(NCS)2] and [Fe(phen)2(NCSe)2] crystals. J. Phys. Chem. Solids 1974, 35, 555–570. [Google Scholar] [CrossRef]
  51. Varret, F.; Chong, C.; Slimani, A.; Garrot, D.; Garcia, Y.; Naik, A.D. Real-Time Observation of Spin-Transitions by Optical Microscopy. In Spin-Crossover Materials; John Wiley & Sons Ltd.: New York, NY, USA, 2013; pp. 425–441. [Google Scholar]
  52. Nishino, M.; Enachescu, C.; Miyashita, S.; Boukheddaden, K.; Varret, F. Intrinsic Effects of the Boundary Condition on Switching Processes in Effective Long-Range Interactions Originating from Local Structural Change. Phys. Rev. B Condens. Matter Mater. Phys. 2010, 82, 020409. [Google Scholar] [CrossRef]
  53. Boukheddaden, K.; Shteto, I.; Hoo, B.; Varret, F. Dynamical model for spin-crossover solids. I. Relaxation effects in the mean-field approach. Phys. Rev. B 2000, 62, 14796–14805. [Google Scholar] [CrossRef]
  54. Paez-Espejo, M.; Sy, M.; Varret, F.; Boukheddaden, K. Quantitative macroscopic treatment of the spatiotemporal properties of spin crossover solids based on a reaction diffusion equation. Phys. Rev. B 2014, 89, 024306. [Google Scholar] [CrossRef]
Figure 1. (a) Thermal behavior of the magnetic moment of the SCO compound [Fe(2-pytrz) 2 {Pt(CN) 4 }]·3H 2 O, adapted from Ref. [45]. Black open circles represent the heating and cooling process without light showing the presence of a first order transition with thermal hysteresis around T 153 K, between the HS and the intermediate HS-LS states. The green curve is the heating process after the green light ( λ = 510 nm) irradiation at the lowest temperature, and the red one corresponds to the heating process from the LS to the HS state through HS-LS state after the red light ( λ = 830 nm) irradiation at the lowest temperature. The relaxation temperatures, after green and red light excitations, are T L I E S S T 52 K and ≃90 K, respectively. Temperature sweep rate is 0.4 K·min 1 for all experiments. (b) Structure of [Fe(2-pytrz) 2 {Pt(CN) 4 }]·3H 2 O in the HS-LS phase.
Crystals 09 00046 g001
Figure 2. DSC study for [Fe(2-pytrz) 2 {Pt(CN) 4 }]·3H 2 O (scan rate = 0.3 K·min 1 ) revealing the exo- and the endo-thermic transitions with maxima at 151.8 and 154.4 K, respectively. These values, derived from the maximum of the DSC peaks, are in good agreement with the transition temperatures obtained in magnetic data.
Crystals 09 00046 g002
Figure 3. (a) Snapshots of the single crystal during the thermo-induced spin transition on cooling and heating. (b) Temperature dependence of the average OD showing the occurrence of a thermal hysteresis loop. The temperature sweep rate was 0.5 K·min 1 , for both cooling and heating processes.
Crystals 09 00046 g003
Figure 4. The interface position as a function of time, estimated along the diagonal of the crystal, from point A to point D and D to A on cooling and heating, respectively, indicated with blue and red symbols. Inset shows the interface positions on the crystal along the heating process.
Crystals 09 00046 g004
Figure 5. Interface velocity evaluated along the crystal edges as indicated in the two insets: (a) on heating along DB (blue) and DC (red) directions and (b) on cooling along AB (blue) and AC (red) directions. The vertical dashed lines indicate the times at which a regime change takes place in the propagation process.
Crystals 09 00046 g005
Figure 6. Intensity profile across the interface (separating HS and HS-LS phases) along the blue line during the cooling process. The pixel size is 0.3 μ m × 0.3 μ m.
Crystals 09 00046 g006
Figure 7. (af) Left panels present the experimental optical microscopy images of the crystal transformation of the compound [Fe(2-pytrz) 2 {Pt(CN) 4 }]·3H 2 O on cooling along the thermal hysteresis of Figure 3b. Right panels present the simulated snapshots obtained from the resolution of the anisotropic Equation (18), showing the spatiotemporal configurations of the lattice along the nucleation and growth of the LS phase (in blue) inside the HS (in red) phase on cooling. The parameter values are D 1 = 2.0 μ m 2 ·s 1 , D 2 = 15.0 μ m 2 ·s 1 and θ = 30 and the temperature is 150 K.
Crystals 09 00046 g007
Table 1. Relative variation of lattice parameters between the high- and low-temperature phases of several SCO compounds. The isotropic/anisotropic character of the volume change at the transition affects the HS-LS interface velocity and the resilience of the single crystal during the transition. HS, LS and HS-LS phases denote high spin, low-spin and intermediate HS-LS states, respectively.
CompoundPhases Δ a a (%) Δ b b (%) Δ c c (%) Δ β   ( )
[{Fe(NCSe)(py) 2 } 2 (m-bpypz)]HS ↔ LS0.61.580.3−2.329
[Fe(2-pytrz) 2 {Pt(CN) 4 }]·3H 2 OHS ↔ HS-LS1.822.170.69−0.036
[Fe(btr) 2 (NCS) 2 ](H 2 O)HS ↔ LS−2.044.123.1−1.22
Table 2. The various interface velocities evaluated on heating and cooling along AB, AC, DB and DC directions for the two different regimes identified in Figure 5.
Direction of PropagationVelocity ( μ m·s 1 )
1st Regime2nd Regime
HeatingDB1.63.7
DC1.43.1
CoolingAB1022
AC1232
Table 3. Relative variation of the crystal sizes derived from OM data and X-rays measurements [38,45] in the HS and HS-LS phases. The pixel size is ∼0.3 × 0.3 μ m 2 .
X-rays Data
Lattice Parameter (Å)HSHS-LSRelative Variation (%)
a25.24824.7951.82
b7.40447.2472.17
c27.29327.1050.69
Optical Microscopy Data
Distances (pixel)HSHS-LSRelative Variation (%)
d B D 120911971
d A B 9509292.2
d A C 154215221.2

