Article

Synthesis and Biological Evaluations of a Novel Oxidovanadium(IV) Adenosine Monophosphate Complex as Anti-Diabetic Agent

by
Ahmed M. Naglah
1,2,*,
Mohamed A. Al-Omar
1,
Mashooq A. Bhat
3,
Asma S. Al-Wasidi
4,
Amnah M. A. Alsuhaibani
5,
Akram M. El-Didamony
6,
Nader Hassan
7,
Sameh Abo Taleb
7 and
Moamen S. Refat
7,8,*
1
Department of Pharmaceutical Chemistry, Drug Exploration & Development Chair (DEDC), College of Pharmacy, King Saud University, Riyadh 11451, Saudi Arabia
2
Peptide Chemistry Department, Chemical Industries Research Division, National Research Centre, Cairo 12622-Dokki, Egypt
3
Department of Pharmaceutical Chemistry, College of Pharmacy, King Saud University, Riyadh 11451, Saudi Arabia
4
Department of Chemistry, College of Science, Princess NourahBint Abdulrahman University, Riyadh 11671, Saudi Arabia
5
Nutrition and Food Sciences Department, Princess NourahBint Abdulrahman University, Riyadh 11671, Saudi Arabia
6
Department of Chemistry, Faculty of Science, Zagazig University, Zagazig 44519, Egypt
7
Department of Chemistry, Faculty of Science, Port Said, Port Said University, Port Said 42526, Egypt
8
Chemistry Department, Faculty of Science, Taif University, P.O. Box 888, Al-Hawiah, Taif 21974, Saudi Arabia
*
Authors to whom correspondence should be addressed.
Submission received: 5 March 2019 / Revised: 3 April 2019 / Accepted: 9 April 2019 / Published: 15 April 2019

Abstract

:
In the present study, a novel [(AMP)(VO)(H2O)2] complex was formed through chemical reactions between oxidovanadium(IV)sulfate and adenosine monophosphate. This complex was characterized using various analyses, including microanalytical, molar conductivity, spectroscopic (solid reflectance and FTIR), magnetic susceptibility, thermogravimetric (TGA), X-ray powder diffraction (XRD), and scanning (SEM) and transmission (TEM) electron microscopy. The in vivo antidiabetic activity of the oxidovanadium(IV) complex was determined using streptozotocin-induced rats. The results suggested that the synthesized complex can be used as an antidiabetic agent based on the observed biochemical effects.

1. Introduction

A number of potential pharmaceutical agents contain metal-binding sites, which can bind or interact with metal ions and may affect their vital activities [1]. Some vanadium compounds have insulin-mimetic properties that are involved in the maintenance of some active metabolic pathways regulated by insulin, through its binding with receptors [2]. Vanadium metal ions have insulin-like effects in both liver and adipose tissues [3] and also improve hepatic and insulin sensitivity [4]; therefore, vanadium can potentially be used to treat both types of diabetes. Potent vanadium complexes with various coordination modes and their structure–function relationship have been studied using both in vivo and in vitro approaches [5,6].
A lack of β-cells in the pancreas is the reason for the pathophysiological symptoms during the progression of diabetes type I, while type II results from a lack of insulin sensitivity in target tissues [7,8,9,10]. Therefore, the therapeutic goal for this disease is to stimulate or mimic the production of insulin, which would ameliorate the disease or, at least, lessen its many symptoms and comorbidities [11,12].
Adenosine monophosphate (AMP; Figure 1) plays an essential role as an allosteric effector in the regulation of carbohydrate metabolism [13,14,15,16]. Myocardial 5′-AMP catabolism was studied by Headrick et al. (2001) in perfused guinea pigs, rats, and mice [17,18]. Herein, the current study explores the synthesis, structure elucidation, and antidiabetic effects of a novel oxidovanadium(IV)–AMP complex.

2. Materials and Methods

2.1. Chemicals and Reagents

All chemicals in this article were received from Sigma-Aldrich Chemical Company (St. Louis, MI, USA) with pure grade.

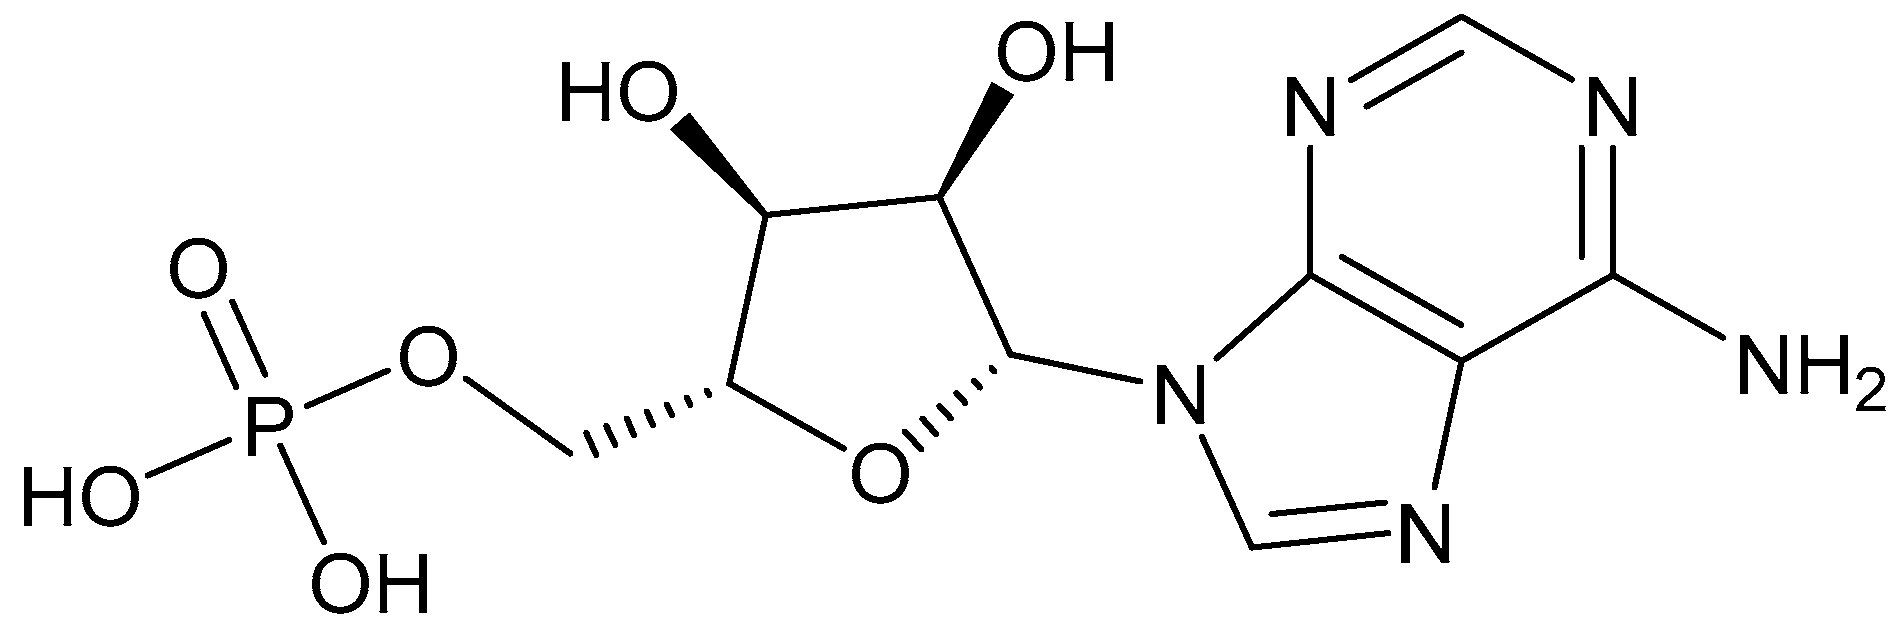
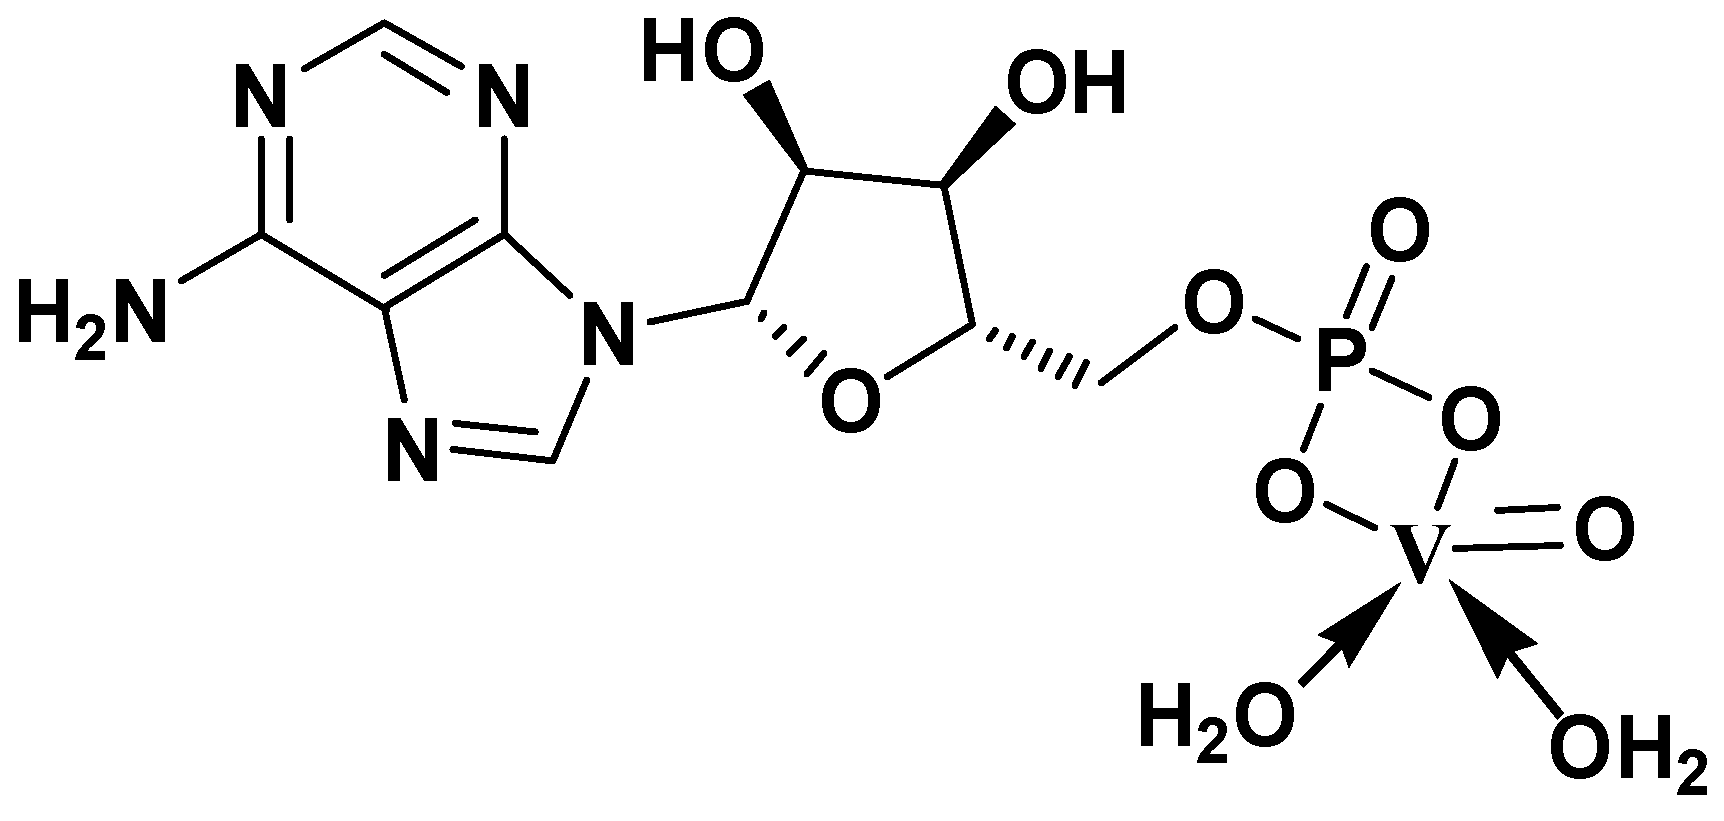
2.2. Synthesis of Oxidovanadium(IV)–AMP Complex

The [(AMP)(VO)(H2O)2] complex was synthesized through the reaction between VOSO4·H2O (0.181 g, 1.0 mmol) and AMP (0.347 g, 1.0 mmol) in 40 mL of CH3OH/H2O (50/50 (v/v)) mixed solvent. The reaction mixture was adjusted to a pH of 8.5 using 5% NH3standard solution. The chemical reaction was refluxed at ~60 °C for 30 min until the precipitate settled. It was filtered, washed several times by minimal amounts of hot methanol, dried, and then stored in a vacuum desiccator.

2.3. Instruments and Methods

Elemental analyses were performed using PerkinElmer model CHN 2400.
Vanadium metal percentage was calculated gravimetrically as vanadium oxide.
Molar conductivity of oxidovanadium(IV)–AMP complex was measured using a conductivity meter model Jenway4010 at 1.0 × 10⁻³ mol/cm3 concentration in DMSO solvent.
Solid reflectance spectra were scanned using UV–Vis Spectrophotometer model UV-3101 PC.
FTIR spectra were performed on a Bruker FTIR spectrophotometer.
Magnetic data were collected based on a magnetic susceptibility balance.
TGA/DTG curves were scanned depending on the thermogravimetric analyzer model Shimadzu–50Hunder nitrogen atmosphere.
SEM images were acquired using a Quanta 250 FEG microscope.
TEM images were acquired using JEOL 100S microscope.
XRD were recorded on the X’Pert PRO PANalytical.

2.4. In Vivo Experimental Design

The animals (male albino rats, weight 100–120 g) were classified into four groups of 10 animals per group.
Group I: untreated negative control.
Group II: untreated diabetic positive control—one-time intraperitoneal (ip) injection of streptozotocin (STZ) (50 mg/kg) [19].
Group III: oxidovanadium(IV)sulfate itself—ip injection of STZ +ip injection of oxidovanadium(IV)sulfate itself (40 mg/kg) for 30 days.
Group IV: oxidovanadium(IV)–AMP complex—ip injection of STZ +ip injection of oxidovanadium(IV)–AMP(40 mg/kg) for 30 days.

2.4.1. Diabetes Induction

Animals were fasted for 18 h before receiving one STZ injection (50 mg/kg) according to previously published methods [20]. The animals were considered “diabetic” when they exceeded blood sugar levels of 220 mg/dL, which occurred about 72 h after injection of STZ.

2.4.2. Collection of Blood and Tissue Samples

On day 30, after 18 h of fasting, blood and tissue (liver and pancreas) samples were collected based on standard methods in the literature [21].

2.4.3. Levels of Hemoglobin (Hb), Insulin, and Blood Glucose

The level of Hbin blood (g/dL) was measured using a cell counter (SysmexKX-21N, Sysmex Corporation, Bellport, NY, United States). Insulin and blood glucose levels were determined using InsulinI-125 Kit, a radioimmunoassay kit, and Udind Spain React Kit [22].

2.4.4. Lipid Profile

Dependent on the autochemistry INTEGRA 400 plus analyzer, the lipid profile of total cholesterol (TC), triglyceride (TG), high-density lipoprotein cholesterol (HDL-c) and low-density lipoprotein cholesterol (LDL-c) were determined.

2.4.5. Liver and Kidney Functions

Liver and kidney functions were assessed by determining the levels of LDH, ALT, creatinine, and uric acid using the COBAS Integra 400 Plus Analyzer (Roche, Basel, Switzerland).

2.4.6. Blood Superoxide Dismutase (SOD) Activity

SOD activity was determined using a diagnostic kit according to manufacturer’s instructions.

2.4.7. Histopathological Examination

Histopathological examinations of liver and pancreas samples were performed according to Carleton’s histological technique [23].

2.5. Statistical Analyses

Using Snedecor and Cochran statistical methods [24], the statistical analyses for all groups were calculated using the SPSS v15.0 software with p-values < 0.05.

3. Results and Discussion

3.1. Interpretations of the Chemical Formulation

The dark green oxidovanadium(IV)–AMP complex was stable and soluble in DMF and DMSOorganic solvents. The physical and analytical data revealed1:1 stoichiometry between VO2+ and AMP. The experimental magnetic moment of complex was in accordance with a square pyramid geometry.

3.1.1. Microanalytical and Physical Data

Microanalytical data of oxidovanadium(IV)–AMP complex: molecular formula (C10H16N5O10PV), molecular mass(448 g/mol), and yield (85%). Elemental analysis: calcd—C = 26.78%, H = 3.57%, N = 15.62%, V = 11.38%; found—C = 26.66%, H = 3.52%, N = 15.60%, V = 11.31%.The absence of remaining SO42− ions was confirmed using a 10% stock solution of BaCl2.2H2O, which was added to the oxidovanadium(IV)–AMP complex solution after decomposition using concentrated nitric acid. Molar conductivity data for the oxidovanadium(IV)–AMP complex in DMSO was 33 Ω−1∙cm2∙mol−1, suggesting it is not an electrolyte [25].

3.1.2. Electronic and Magnetic Measurements

The electronic spectrum of the oxidovanadium(IV)–AMP complex revealed distinguishable bands of oxidovanadium(IV) in a square pyramidal geometry. The absorption bands around 795 and 626 nm were respectively assigned to 2B22E and 2B22B1 electronic transitions [26]. The weak bands around 530 and 425 nm were assigned to L−MCT charge transfer. The experimental magnetic moment of the oxidovanadium(IV)–AMP complex was 2.02 BM, due to the square pyramidal oxidovanadium(IV)geometry [26,27].

3.1.3. Infrared Spectra

The infrared spectra of the oxidovanadium(IV)–AMP complex and 5′-AMP were determined in order to elucidate the bonding mechanism responsible for complex formation. The spectra of the complex and its free ligand were similar but there were some differences, suggestive of the following coordination dynamics:
(1) In the comparison between free AMP ligand and the oxidovanadium(IV)–AMP complex, the shifts in bands observed between 4000 and 1700 cm−1 were attributed to the rearrangement of the hydrogen bonding network upon complex formation [28].
(2) Free 5′-AMP showed a strong absorption band at 1641 cm−1 that was mainly attributed to the bending (scissoring) of NH2 [29]. In the oxidovanadium(IV)–AMP complex, the intensity of this band changed slightly, but its position was not affected (1648 cm−1). This observation allowed for the exclusion of any coordination through the NH2 group, as the metalation–deprotonation mechanism required for the metal–NH2 interaction would cause a shift or disappearance in the absorption frequencies [28]. The small shift in intensity was due to the replacement of intramolecular hydrogen bonds of the NH2 to the phosphate group in the 5′-AMP, with stronger hydrogen bonds of the complexed H2O molecule [29].
(3) The stretching vibration bands within 3400–2700 cm−1 and 1400–400 cm−1 [28] were assigned to the sugar vibrational frequencies of 5′-AMP, and the presence of weak absorption bands at 900–800 cm−1 were due to the frequencies of sugar phosphate vibrations [28]. These bands were affected upon the complexation, through the phosphate group [28].
(4) Absorption bands of the phosphate group were found at 1104, 983, and 813 cm−1, due to PO3 asymmetric, PO3 symmetric, and P–O stretching vibrations, respectively [29]. Comparing these bands to those of the oxidovanadium(IV)–AMP complex revealed similar positioning but clear changes in intensity, particularly in PO3 symmetric and P–O stretching vibration, while the PO3 asymmetric vibration was less affected due to the overlap with the ν(V = O) peak. These data are consistent with the coordination of the metal ion occurring through deprotonation of the phosphate group [28].
(5) In the case of complexation, the absorption bands within the 3300–3000 cm−l range are likely due to ν(OH) of the coordinated molecules [29], and this was further supported by the presence of bands at ~800 cm−l due to the rocking vibration motion δr (H2O) of the coordinated H2O molecules [28].
(6) After complexation, the strong band at 1114 cm−1 was assigned to ν(V = O) stretching vibration, as expected from data published on oxidovanadium(IV) complexes [28].
(7) In case of oxidovanadium(IV)–AMP complex, a new band was observed at 520 cm−1 that was assigned to the ν(M–O) of the M–OH2 bond [29].
The analytical and spectroscopic data conformed to the stoichiometric formulations proposed in Figure 2.

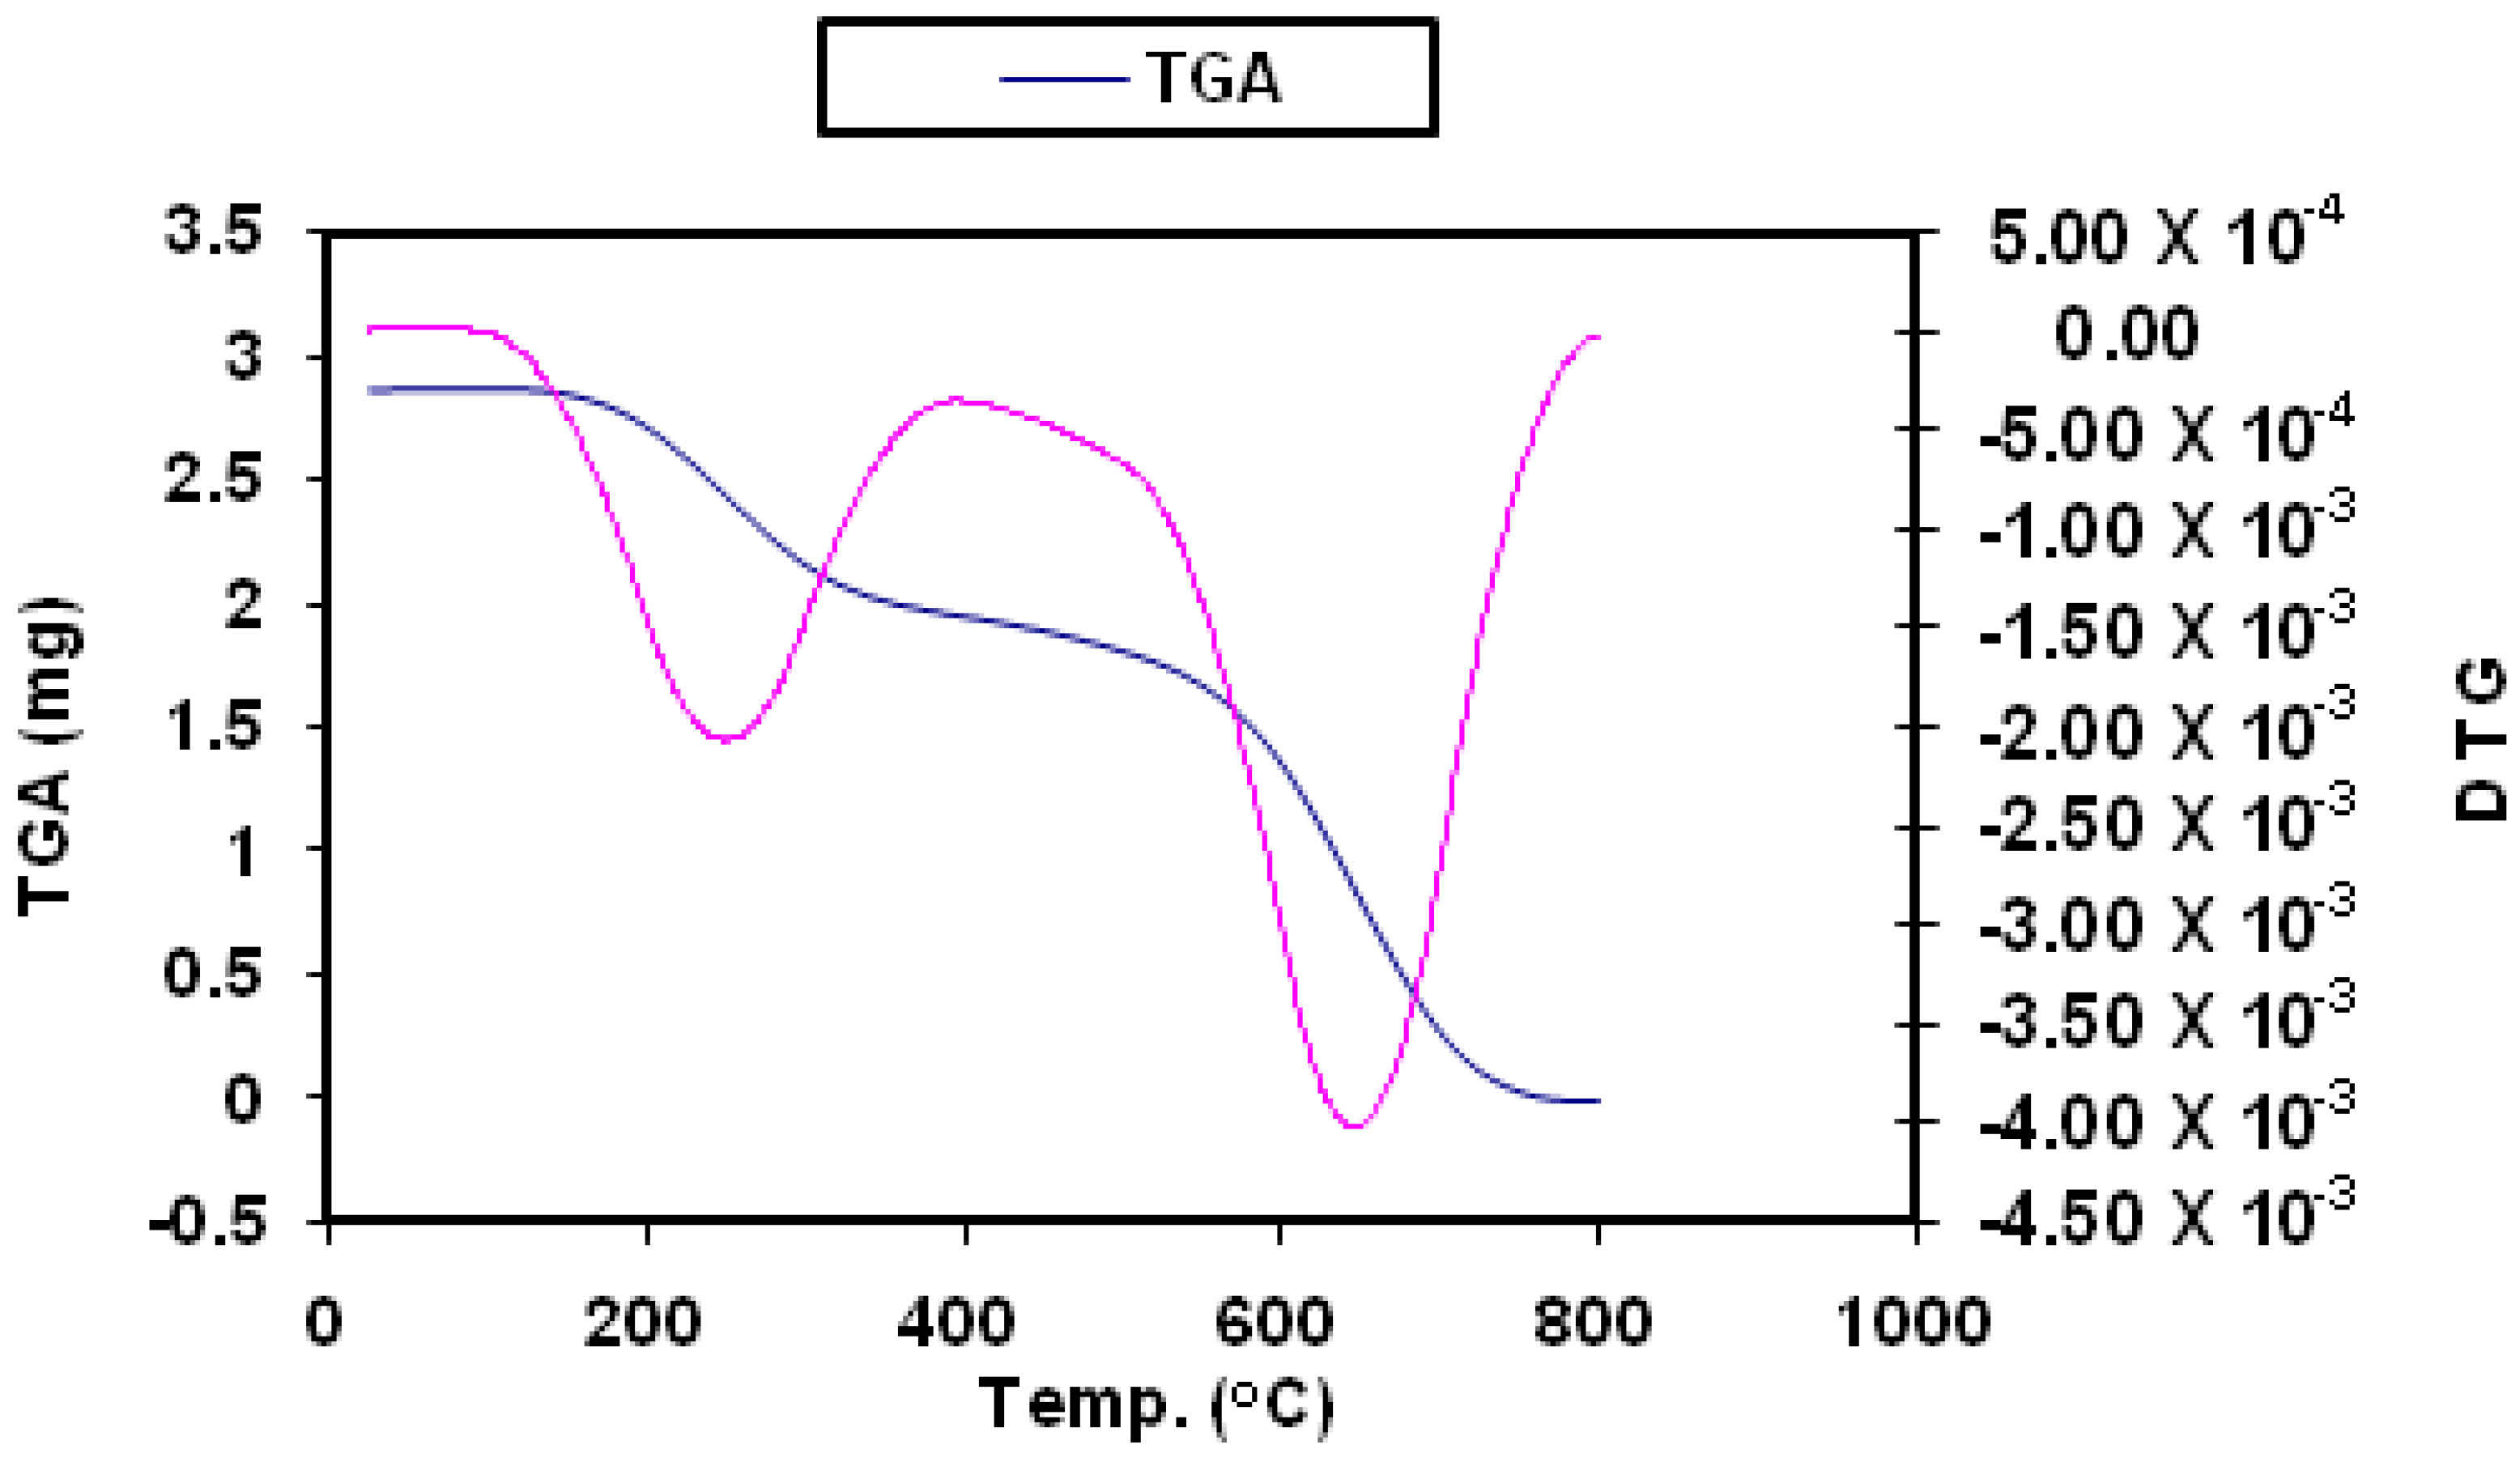
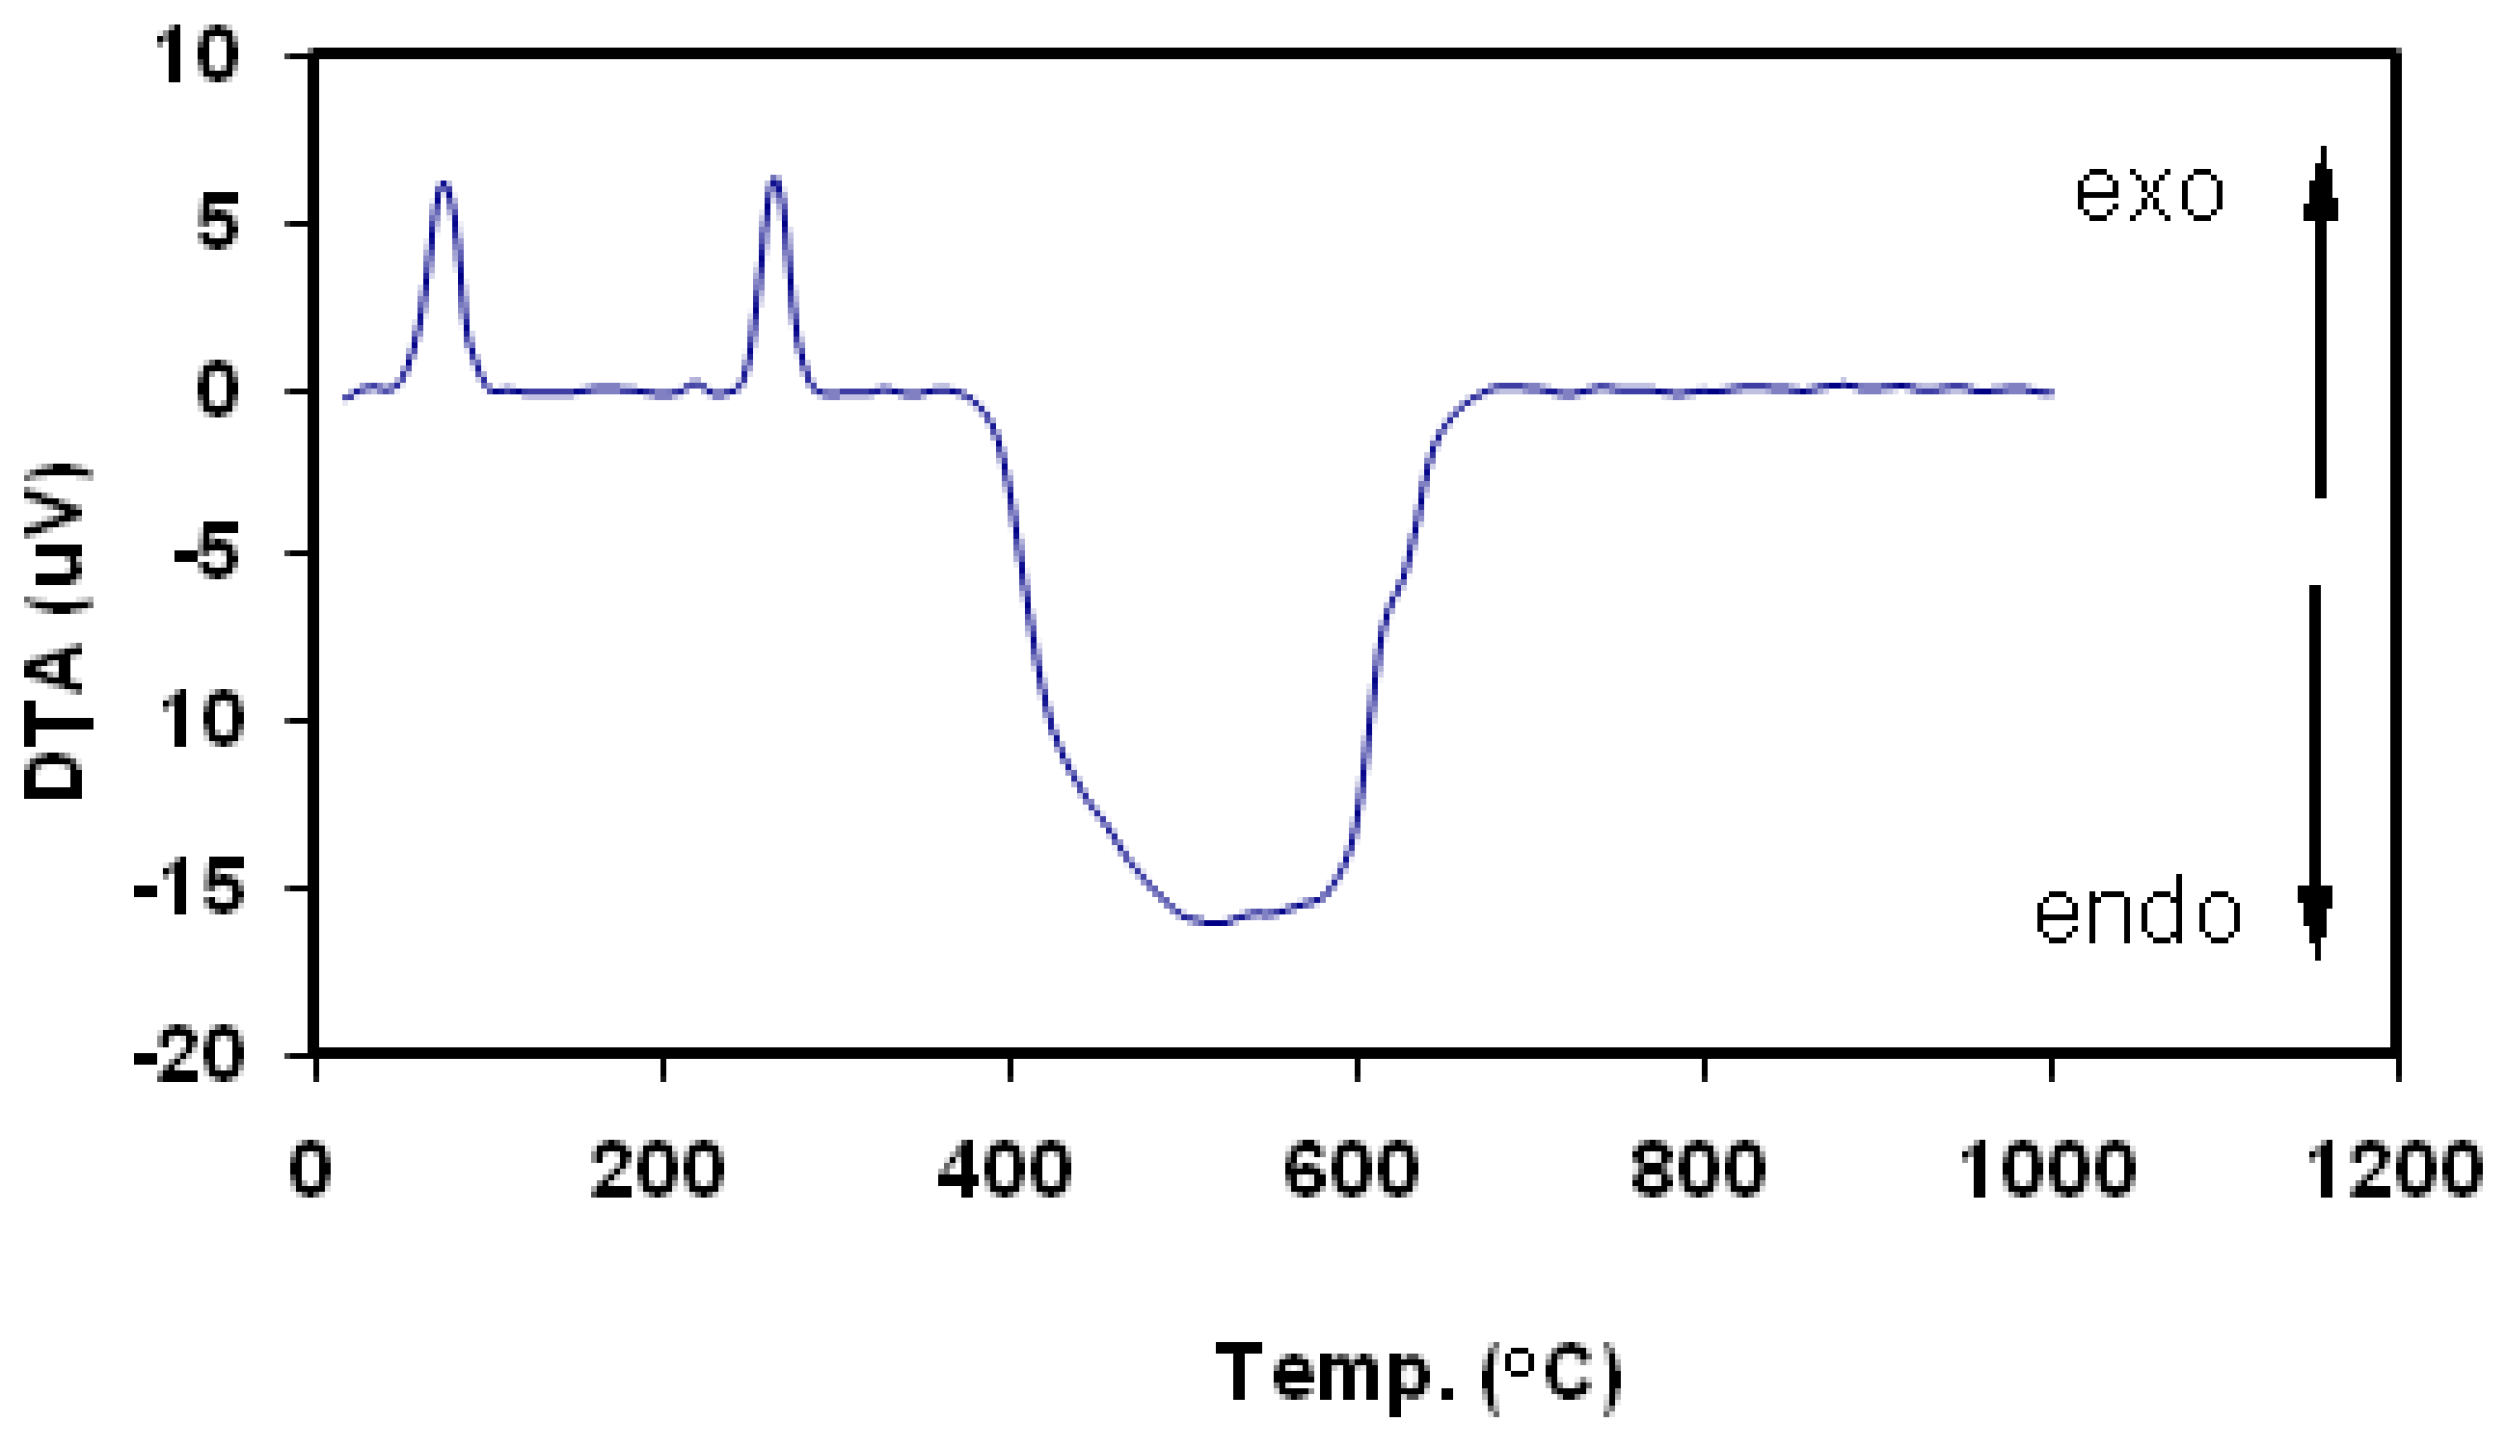
3.1.4. Thermal and Kinetic Studies

The TG curve of the [(AMP)(VO)(H2O)2] complex was redrawn as the mass loss against temperature, and the DTA curve was redrawn as the rate of mass loss against temperature under a nitrogen gas environment. The thermal decomposition curves (TG/DTG and DTA) are given in Figure 3 and Figure 4, and the thermoanalytical data are listed in Table 1. The thermal decomposition of the oxidovanadium(IV)–AMP complex occurred in two steps. The first degradation step occurred at 27–392 °C, DTGmax = 254 °C, and DTA = 74 and 265 °C (exo), which corresponded to the loss of C4H6N2O2 (organic moiety), reflected by an observed 25.62% reduction in mass (calculated = 25.44%). The second step occurred between 393 and 714 °C, DTGmax = 635 °C, and DTA = 517 °C (endo) due to the loss of C6H10N3O6P and the mass associated with this organic moiety (observed = 55.49%, calculated = 56.02%). VO2oxide was the final residue at 800 °C.
In Table 2, the kinetic–thermodynamic parameters ΔE*, ΔS*, ΔH*, and ΔG* of the [(AMP)(VO)(H2O)2] complex were calculated dependent on the Coats–Redfern and Horowitz–Metzger relations [30,31]. Some important results were deduced from the kinetic–thermodynamic parameters, as follows:
The [(AMP)(VO)(H2O)2] complex had a high thermal stability according to high activation energy.
The negative value of the oxidovanadium(IV)–AMP complex gave an impression of a more ordered, rather than free, AMP ligand.

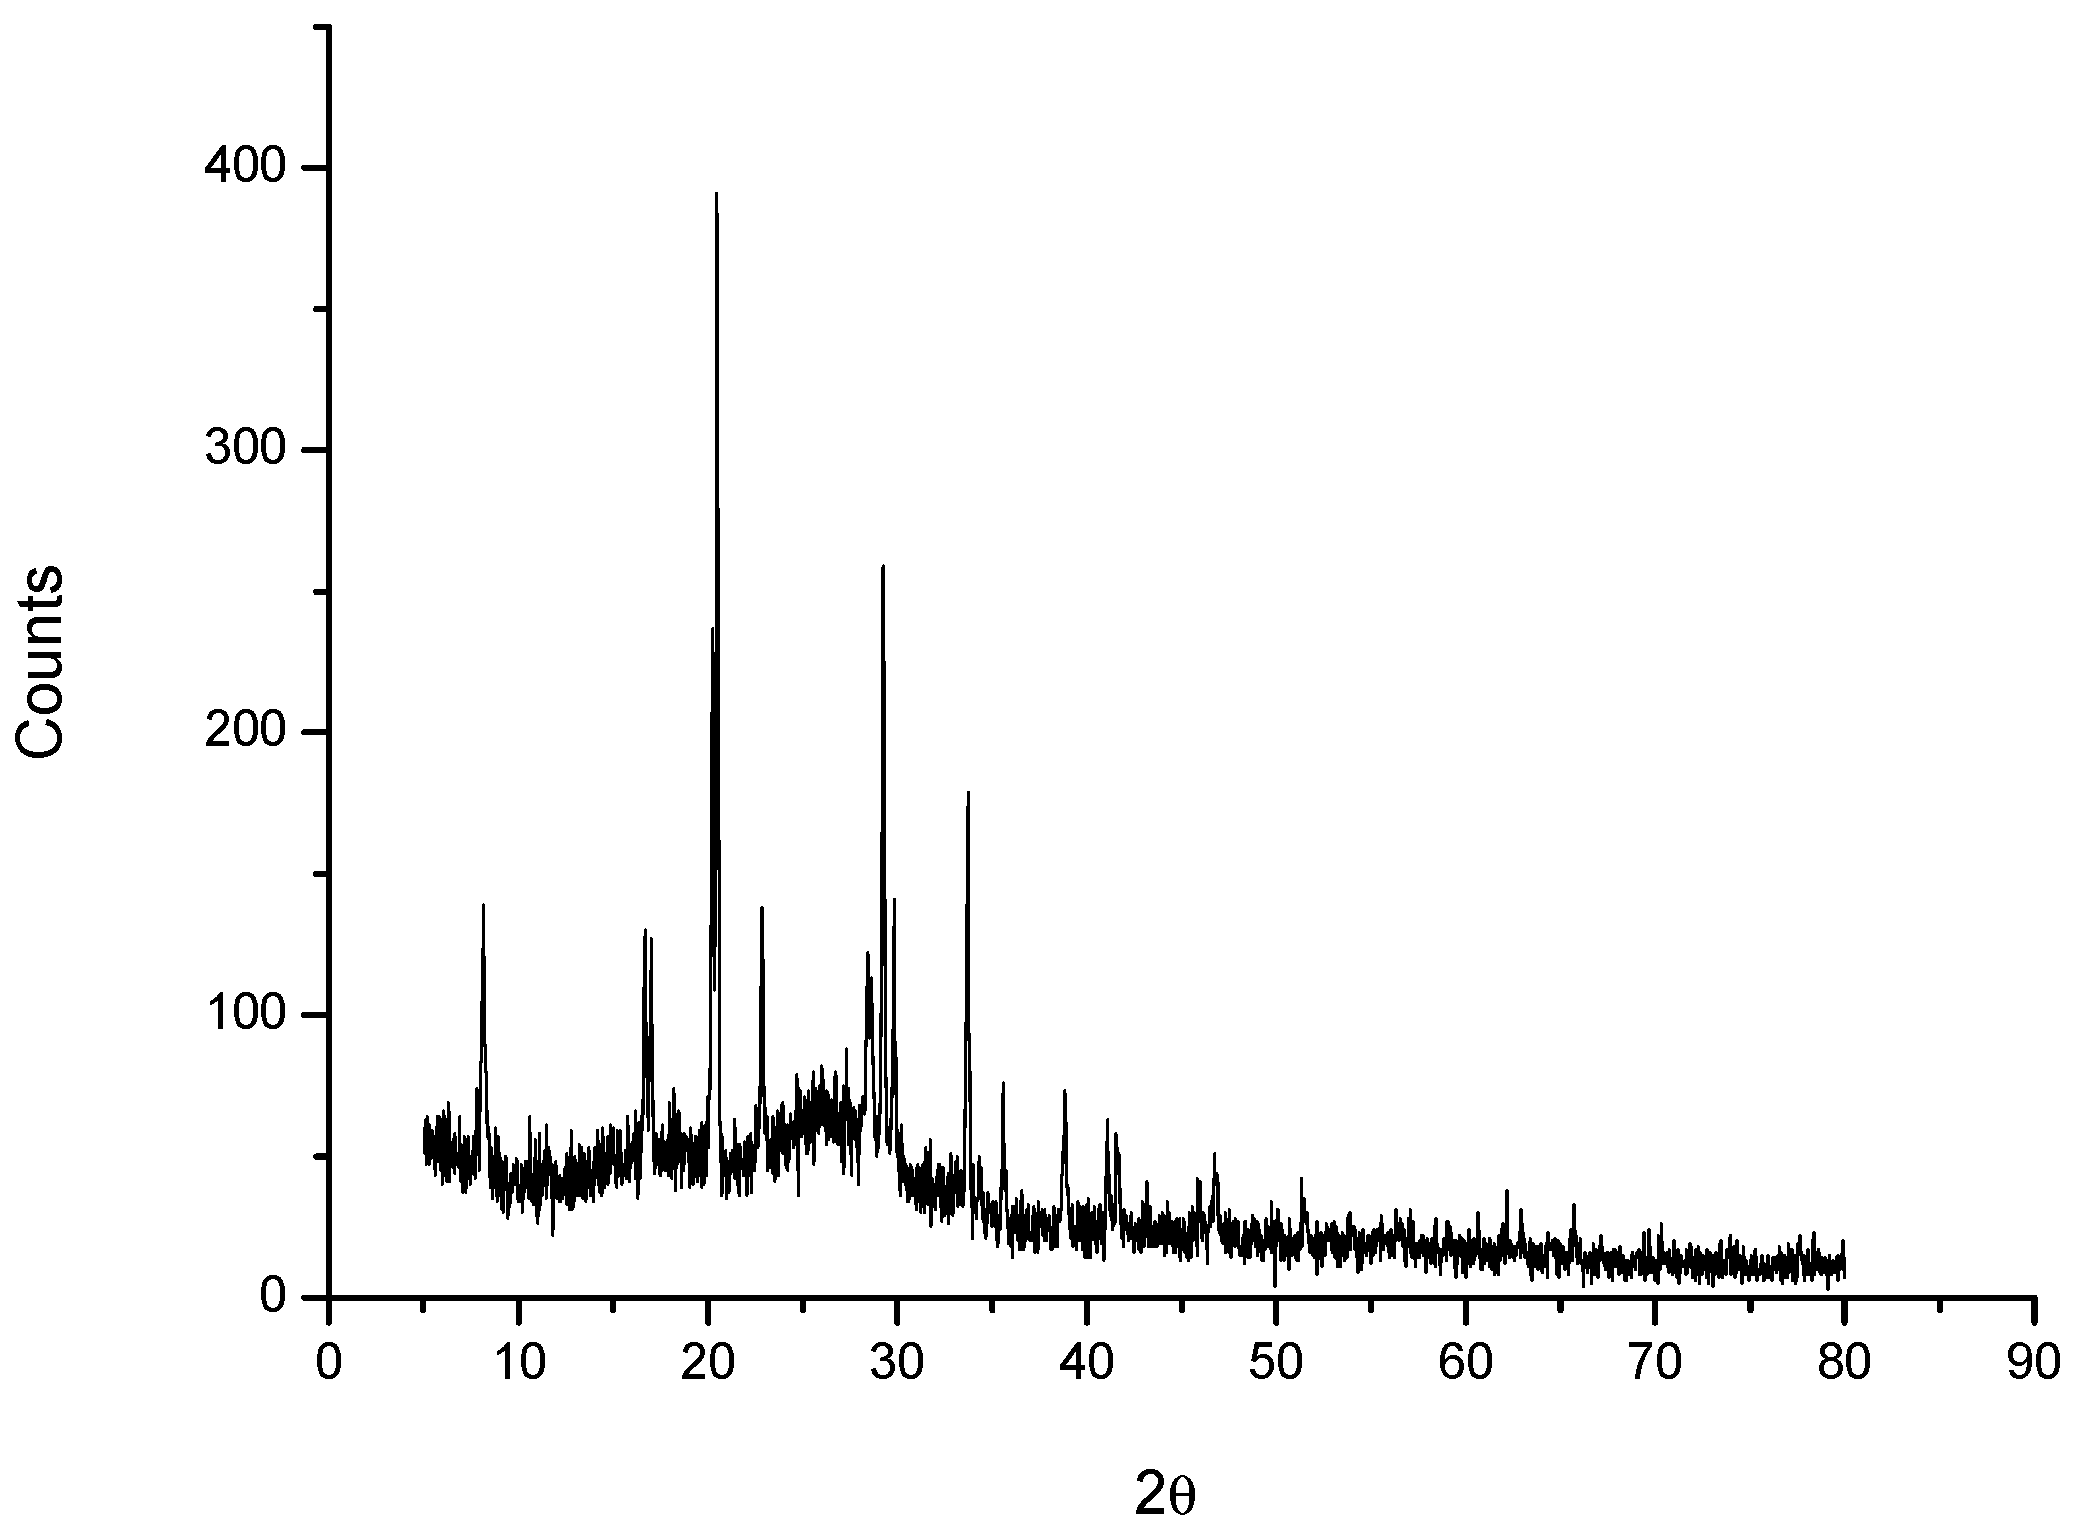
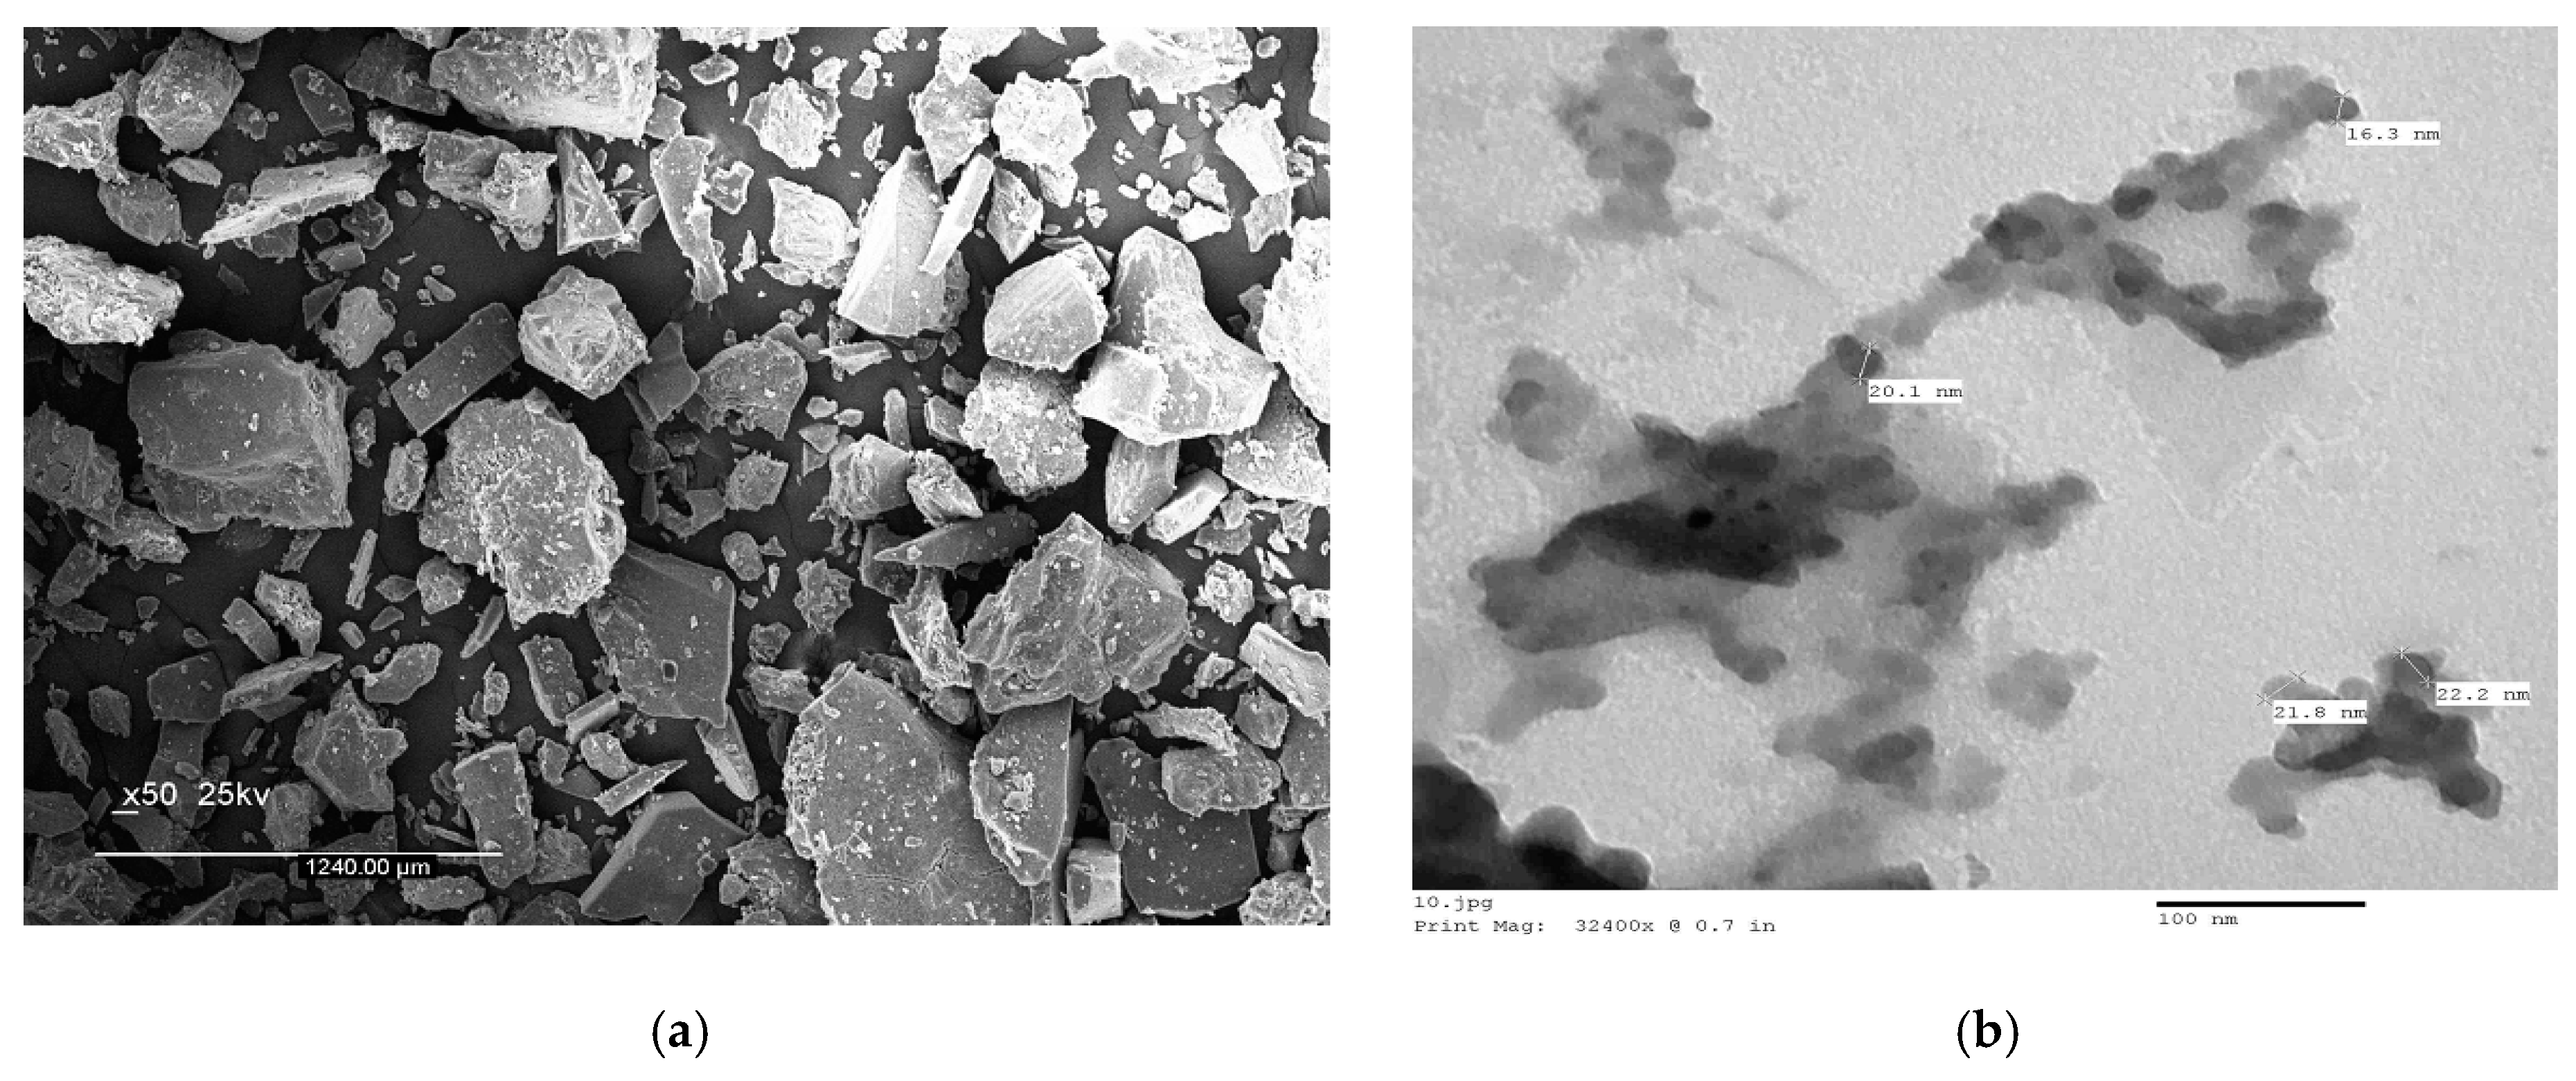
3.1.5. Morphological Studies Using XRD, SEM, and TEM

Nanoparticles of the [(AMP)(VO)(H2O)2] complex were created and characterized by XRD at 2θ 4–80°, SEM, and TEM. The XRD analysis showed that the oxidovanadium(IV)–AMP complex was pure and had good crystallinity, as no peak characteristics of impurities were observed. The Scherrer equation [32,33] was employed to determine the particle size of oxidovanadium(IV)–AMP complex at the highest diffraction peak (2θ = 20.43°) (Figure 5). XRD patterns revealed the nanocrystalline (20 nm) nature of the oxidovanadium(IV)–AMP complex.
SEM and TEM analyses gave information concerning the particle size and surface morphology of the isolated solid [(AMP)(VO)(H2O)2] complex. The SEM and TEM images revealed that the solid complex aggregated into different grain sizes, with a narrow size distribution that averaged around 20 nm. The SEM micrographs at different magnifications showed that the oxidovanadium(IV)–AMP complexes were organized into regular slices and arranged into stone structures with no well-defined particles (Figure 6a). Increasing the magnification did not provide better particle resolution (Figure 6a). According to the TEM images, the particles of the [(AMP)(VO)(H2O)2] complex were irregularly shaped, and their size was widely distributed around 20 nm (Figure 6b).

3.2. In Vivo Application of the Oxidovanadium(IV)–AMP Complex

3.2.1. Blood Glucose and Insulin Levels

In Table 3, both Group III and Group IV showed significantly decreased blood glucose levels relative to the positive control Group II. This effect was clearer for the oxidovanadium(IV)–AMP complex, which decreased blood glucose levels by 31.66%from 410.23 ± 14.52 mg/dL in Group II to 280.34 ± 6.87 mg/dL in Group IV, while Group III decreased by 30.88%.STZ treatment significantly reduced the levels of insulin compared to the untreated negative control animals. The administration of oxidovanadium(IV) sulfate and the oxidovanadium(IV)–AMP complex to STZ-treated rats also significantly increased insulin levels compared to the untreated diabetic animals. For Group III, the insulin increased by 42.61% and for Group IV, by 44.64%; thus, these data agree with the reports in the literature that oxidovanadium(IV)compounds can mimic many metabolic activities of insulin both in vivo and in vitro [34,35].

3.2.2. GPT Activity

In Table 3, the GPT enzyme data indicated that Group II was slightly increased by 10.30% from 111.50 ± 7.44 U/L in Group II to 124.31 ± 10.53 U/L in Group III, whereas after the injection of rats by oxidovanadium(IV)–AMP complex (Group IV), the serum GPT activity was decreased to 101.57 ± 6.33 U/L (8.90%), which was less than Group II, and less than Group III by 18.29%. According to these data, it can be concluded that the oxidovanadium(IV)–AMP complex had a minor effect on the liver cells in comparison with STZ or oxidovanadium(IV) alone, and both had higher levels than Group I (72.33 ± 6.61 U/L) [36].

3.2.3. Creatinine and Uric Acid Levels

According to Table 3, the diabetic rats treated with either oxidovanadium(IV) sulfate alone or the oxidovanadium(IV) complex showed decreased creatinine levels compared to untreated diabetic rats. This was particularly pronounced in Group IV, where the serum creatinine decreased to 0.79 ± 0.14 mg/dL from 1.14 ± 0.18 mg/dL in the Group II. These data indicate that the oxidovanadium(IV) complex had no major effect on the tissue of kidney in vivo, and improved kidney function.
The increased levels of uric acid (hyperuricemia) observed in diabetic rats in this study, compared to the healthy control group, are similar to a previous report [37]. Relative to the positive control, uric acid levels decreased by 20.04% with the treatment of the oxidovanadium(IV)–AMP complex and by 19.41% with oxidovanadium(IV) sulfate alone. This reduction can be discussed based on the inhibition of oxidative phosphorylation, which contributed to decreasing protein synthesis [37].

3.2.4. LDH and G6PD Activities

The LDH activity in case of the diabetic rats (Group II) was significantly increased compared with the control group (Group I), as clarified in Table 3. The LDH activity of oxidovanadium(IV)–AMP complex (Group IV) had a 4.34%decrease compared with Group II, whereas the treatment of diabetic rats by oxidovanadium(IV) sulfate itself was increased by 5.78%. This increase in the level of LDH activity was due to the leakage of LDH into the blood because of STZ toxicity on the liver. Our experimental data is in agreement with a previous report [38].
The G6PD level was decreased in the diabetic rats in comparison with Group I (Table 3), similar to observations in previous work survey [39]. Through treatment with oxidovanadium(IV)–AMP complex (Group IV), a significant increase of 18.01% was observed relative to Group II, whereas the treatment with oxidovanadium(IV) sulfate itself caused an increase of 14.37%.

3.2.5. Hb Level

From data in Table 3, the Hb levels were decreased in Group II in comparison with Group I. Reduction of Hb and anemia were due to the non-enzymatic glycosyls of red blood cell membranes [40]. The Hb level following oxidovanadium(IV)–AMP complex treatment(Group IV) was increased by 13.84% compared to the untreated diabetic group, whereas the treatment with oxidovanadium(IV) sulfate itself (Group III) increased the Hblevel by 9.40%.

3.2.6. SOD Activity

SOD activity is low in diabetes, and this low activity can be due to its degradation or inhibition as a result of increased free radical production [41,42]. In this study (Table 3), the SOD activity was significantly decreased in Group II compared with Group I. The SOD activity was decreased by 6.46% in diabetic rats treated with the oxidovanadium(IV) complex, and by 8.83% for the group treated with oxidovanadium(IV) sulfate itself.

3.2.7. TC, TG, HDL-c, and LDL-cLipid Factors

In Table 3, the lipid factors were increased in Group II in comparison with Group I. This result was averse to published data by Bolkent et al. (2005) [1], which referred to reduced serum HDL-c levels in Group II. In our study, the results of the oxidovanadium(IV) complex (Group IV) led to a decrease in TC, TG, and LDL-c lipid factors(38.03%, 23.26%, and 26.89%), respectively, while HDL-c levels were increased by 40.78% relative to Group II. In addition, oxidovanadium(IV) compounds may improve hypercholesterolemia status by modulating lipoprotein metabolism, enhancing LDL uptake by increasing LDL receptor expression, and/or by increasing lecithin cholesterol acyltransferase activity [42,43,44].

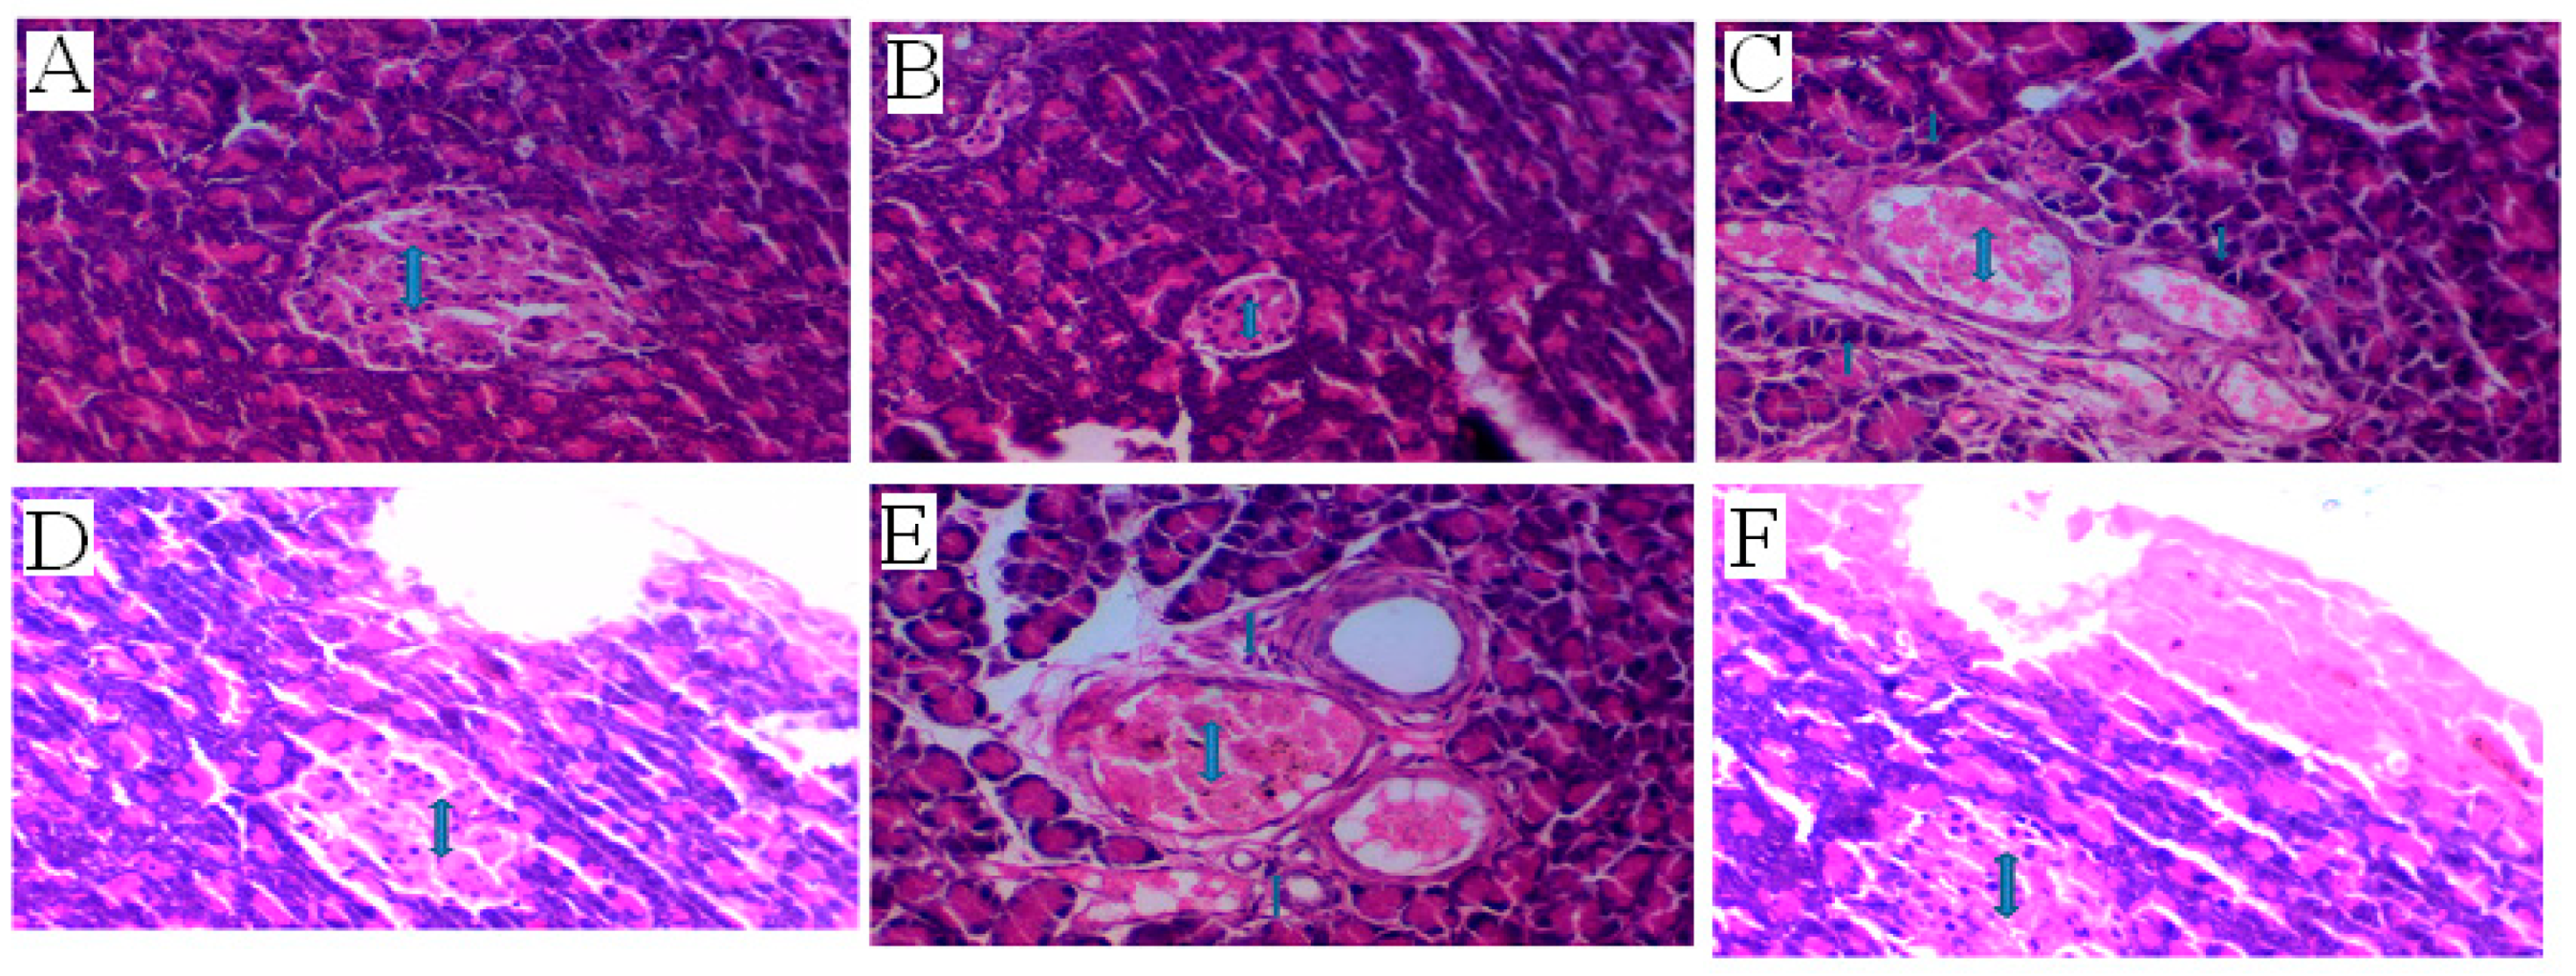
3.2.8. Histopathology of the Pancreas

In this study, STZ-induced diabetes produced a marked loss in total body mass and the mass of the pancreas. Diabetes is typically associated with loss of mass as the body switches to using fatty acids for energy, instead of glucose, due to insulin deficiencies. The histopathology of the pancreas from the control rats (Group I) showed healthy pancreatic tissue with typically sized islets of Langerhans and surrounded by healthy pancreatic acini (Figure 7a). By contrast, STZ administration (positive control, Group II) caused severe injury to the pancreas, illustrated by a decrease in islet cell numbers and in the diameter of the islets (Figure 7b,c). This destruction and shrinkage of islets corresponded to the reduced insulin levels that are characteristic of diabetes. The administration of oxidovanadium(IV) sulfate alone (Group III) resulted in the expansion of islets and appeared to reduce the overall injury to the pancreas after30 days of treatment (Figure 7d,e). Treatment with the oxidovanadium(IV)–AMP complex seemed to restore healthy histological structure, including rich vascular supply (Figure 7f). This suggests that the oxidovanadium(IV)–AMP complex enables recovery of, or prevents the damage to, the pancreatic tissue caused by STZ-induced diabetes.
Generally, histological examination of the pancreas of diabetic rats showed shrinkage and a reduction in the size and number of islets of Langerhans, while the group treated with oxidovanadium(IV)–AMP complex showed a restoration in the number and size of these islets. The histology consistently showed well-organized islet structure and many insulin-immune reactive cells within the islets of Langerhans of the diabetic rats treated with oxidovanadium(IV) sulfate and its AMP complex. These data suggest that oxidovanadium(IV) is either protective or regenerative, and further studies with different animal models are necessary to distinguish between these two potential mechanisms.

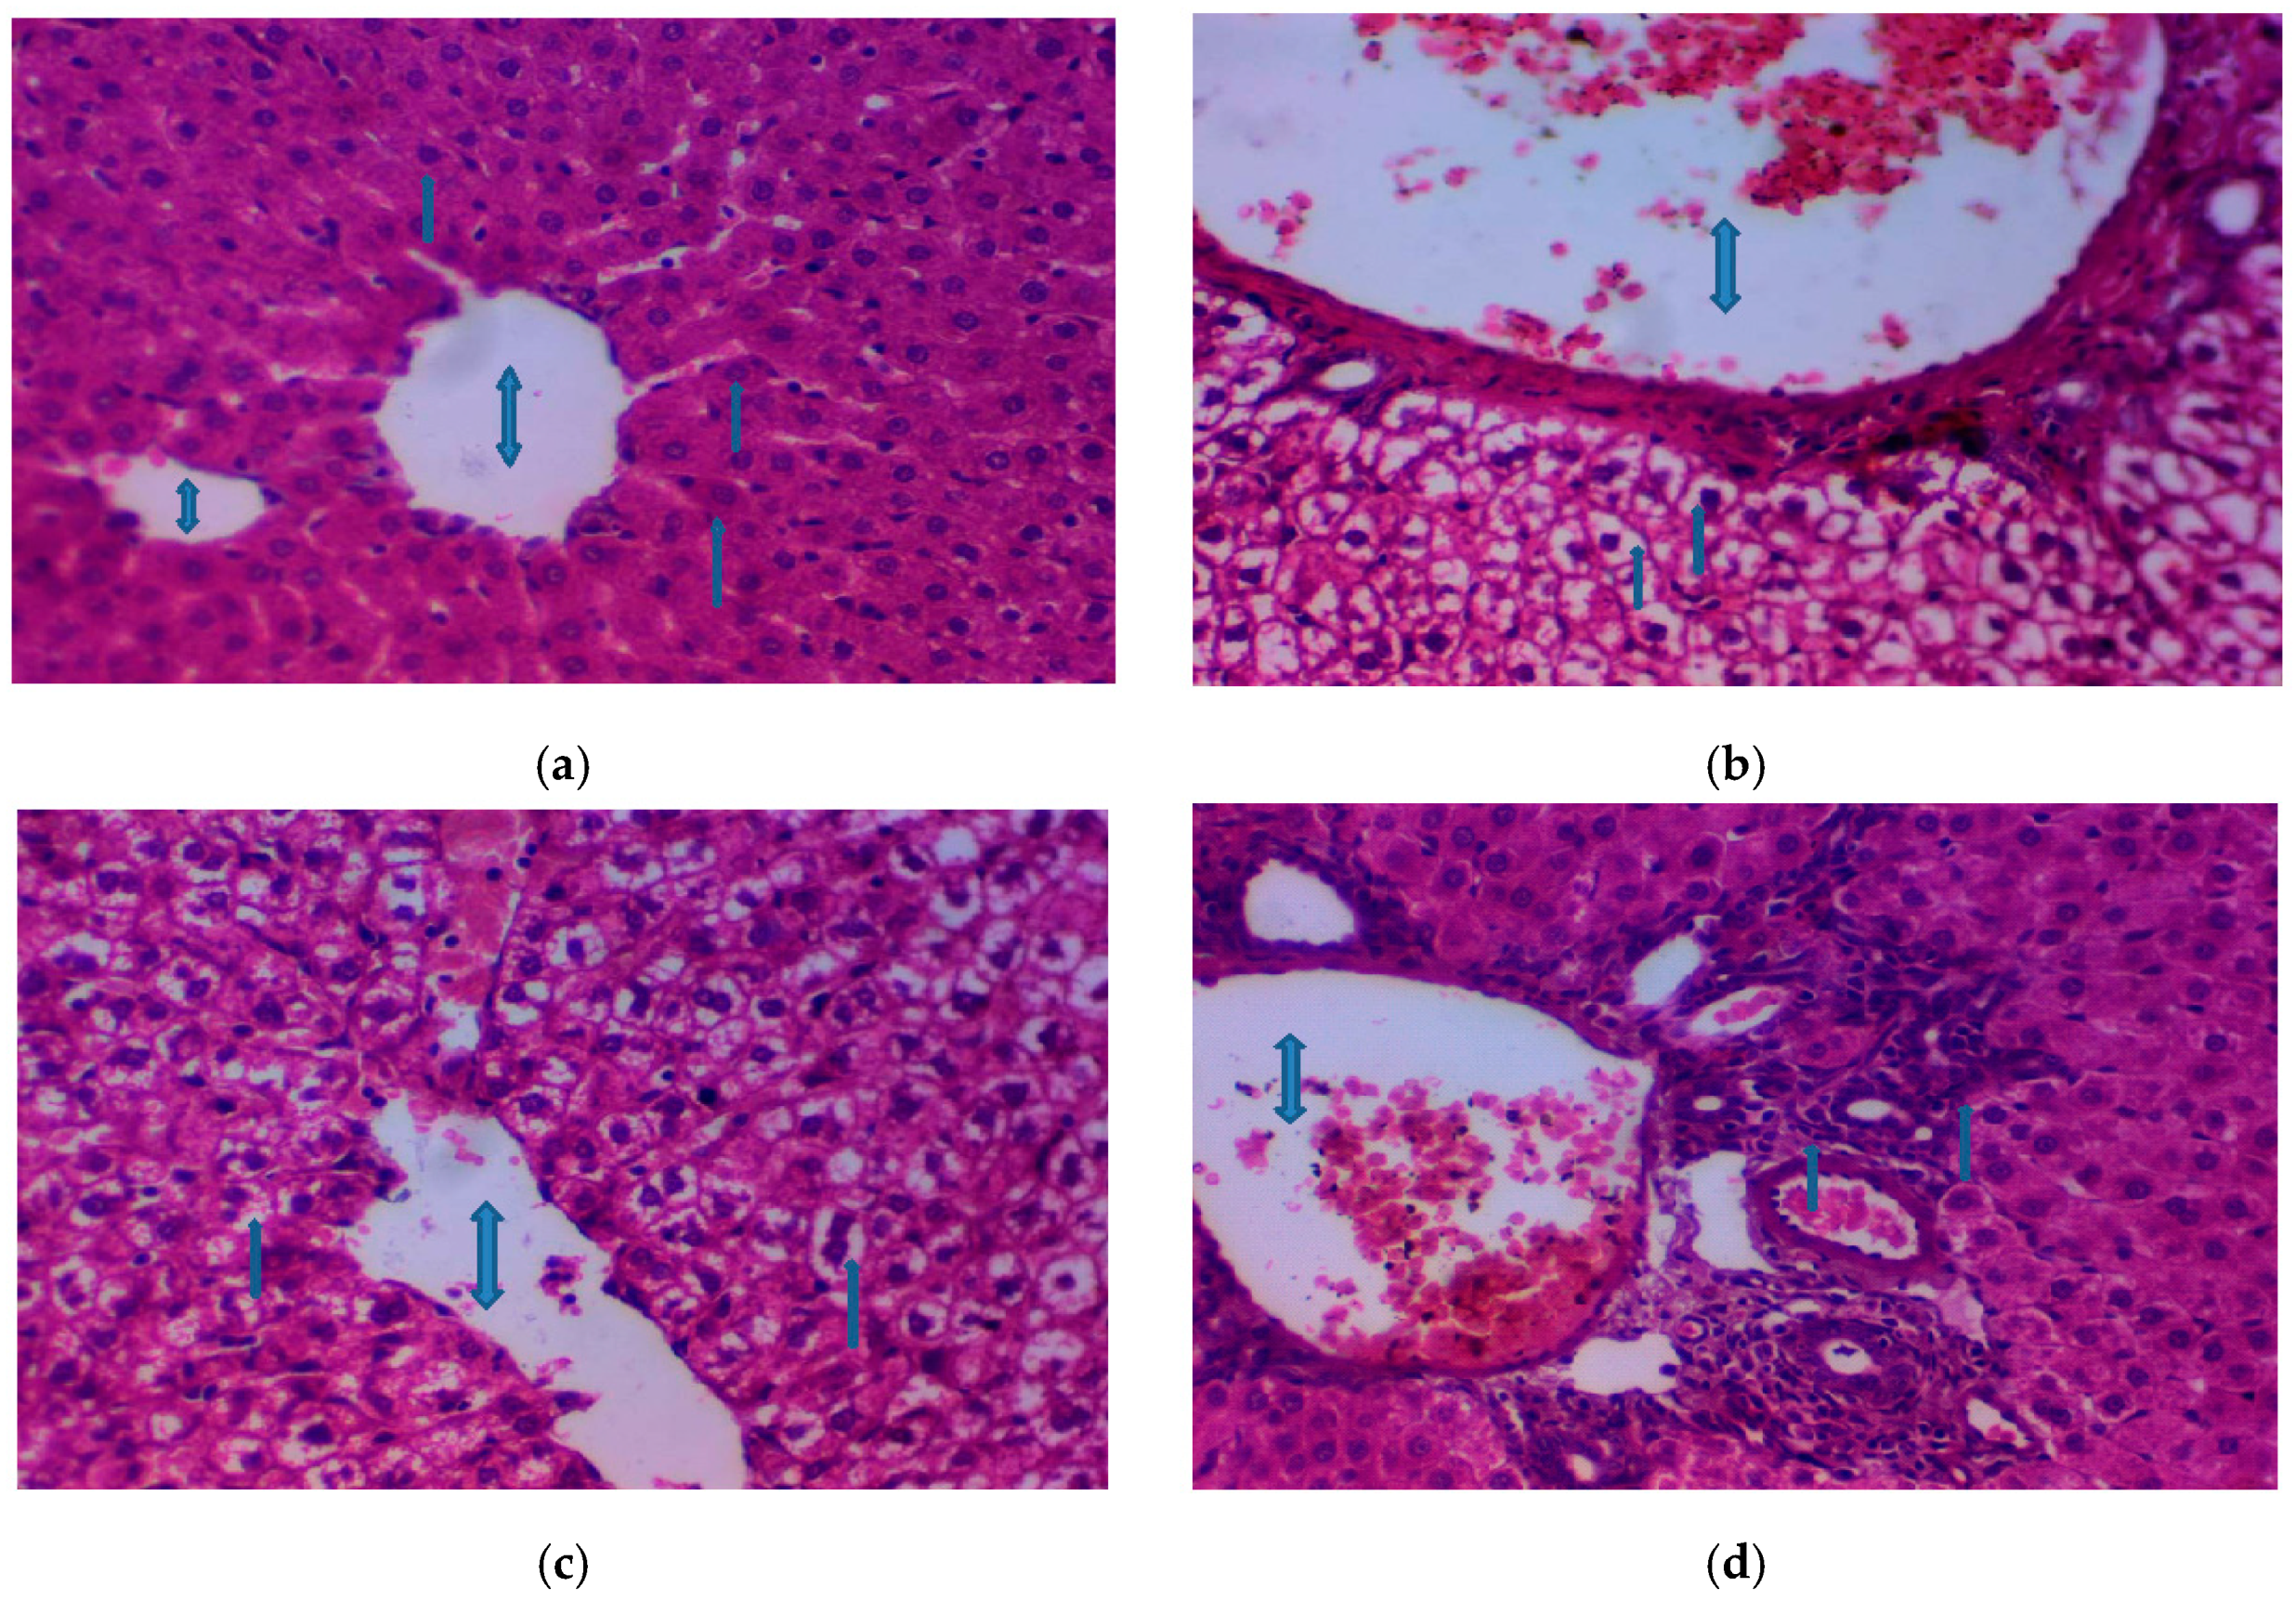
3.2.9. Histopathology of the Liver

The damage to the liver caused by STZ treatment was clearly visible in the form of a dystrophic central vein, necrotic hepatocytes, and an abundance of inflammatory cells. This in vivo study revealed that compared to the healthy control group (Group I, Figure 8a), the liver tissue from the STZ-induced diabetic rats (Group II) had marked dilatation and congestion of the central vein, large areas of hepatic necrosis, and inflammatory cell invasion (Figure 8b).
By contrast, the liver tissue of diabetic rats treated with the oxidovanadium(IV)–AMP complex had healthy histological structures and hepatic parenchyma (Figure 8d). This is reflective of the protective or regenerative effect of the complex, potentially due to its antioxidant properties. These data suggest that treating diabetic patients with the oxidovanadium(IV)–AMP complex could reduce pervasive tissue damage and diminish the complications from liver dysfunction that occur in this complex disease.

Author Contributions

Conceptualization, A.M.N. and M.S.R.; methodology, S.A.T., N.H., A.M.A.A. and M.S.R.; formal analysis, A.M.E.-D., S.A.T. and M.S.R.; investigation, A.M.N., M.A.A.-O., M.A.B., A.S.A.-W., A.M.A.A., A.M.E.-D., N.H., S.A.T. and M.S.R.; writing—original draft preparation, A.M.N., S.A.T., M.S.R. and A.M.E.-D.; visualization, A.M.N., M.A.A.-O., M.A.B., A.S.A.-W., A.M.A.A., A.M.E.-D., N.H., S.A.T. and M.S.R.; supervision, A.M.N., M.A.A.-O., M.A.B., A.S.A.-W., A.M.A.A., A.M.E.-D., N.H., S.A.T. and M.S.R. project administration, A.M.N., M.A.A.-O., M.A.B., A.S.A.-W., A.M.A.A., A.M.E.-D., N.H., S.A.T. and M.S.R.; funding acquisition, A.M.N., M.A.A.-O. and M.S.R; writing—review and editing, A.M.N., M.A.A.-O., M.A.B., A.S.A.-W., A.M.A.A., A.M.E.-D., N.H., S.A.T. and M.S.R.

Funding

This research was funded by Deanship of Scientific Research at King Saud University, grant number RG-1436-015.

Conflicts of Interest

The authors declare no conflict of interest.

References

  1. Bolkent, S.; Bolkent, S.; Yanardag, R.; Tunali, S. Protective effect of vanadyl sulfate on the pancreas of streptozotocin-induced diabetic rats. Diabetes Res. Clin. Pract. 2005, 70, 103–109. [Google Scholar] [CrossRef] [PubMed]
  2. Cam, M.C.; Rodrigues, B.; McNeill, J.H. Distinct glucose lowering and beta cell protective effects of vanadium and food restriction in streptozotocin-diabetes. Eur. J. Endocrinol. 1999, 141, 546–554. [Google Scholar] [CrossRef] [PubMed] [Green Version]
  3. El-Megharbel, S.M.; Hamza, R.Z.; Gobouri, A.A.; Refat, M.S. Synthesis of new antidiabetic agent by complexity between vanadyl (II) sulfate and vitamin B1: Structural, characterization, anti-DNA damage, structural alterations and antioxidative damage studies. Appl. Organomet. Chem. 2019, e4892, 1–15. [Google Scholar] [CrossRef]
  4. Naglah, A.M.; Al-Omar, M.A.; Kalmouch, A.; Alsuhaibani, A.M.A.; El-Didamony, A.M.; Hassan, N.; Abo Taleb, S.; Refat, M.S.; Al-Shakliah, N.S.; Al-Humaidi, J.Y. Synthesis, characterization and antidiabetic effects of vanadyl (II) adenosine monophosphate amino acid mixed-ligand complexes. Future Med. Chem. 2019, 11. [Google Scholar] [CrossRef]
  5. Naglah, A.M.; Al-Omar, M.A.; Almehizia, A.A.; Bhat, M.A.; Afifi, W.M.; Al-Wasidi, A.S.; Al-Humaidi, J.Y.; Refat, M.S. A novel oxidovanadium (IV)-orotate complex as an alternative antidiabetic agent: Synthesis, characterization, and biological assessments. BioMed Res. Int. 2018, 2018, 8108713. [Google Scholar] [CrossRef]
  6. Zhang, H.; Yi, Y.; Feng, D.; Wang, Y.; Qin, S. Hypoglycemic properties of oxovanadium (IV) coordination compounds with carboxymethyl-carrageenan and carboxymethyl-chitosan in alloxan-induced diabetic mice. Evid. Based Complement Altern. Med. 2011, 69, 67–70. [Google Scholar] [CrossRef] [PubMed]
  7. Cusi, K.; Cukier, S.; DeFronzo, R.A.; Torres, M.; Puchulu, F.M.; Redondo, J.C.; Clin, J. Vanadyl sulfate improves hepatic and muscle insulin sensitivity in type 2 diabetes. J. Clin. Endocrinol. Metab. 2001, 86, 1410–1417. [Google Scholar] [CrossRef] [PubMed]
  8. Thompson, K.H.; McNeill, J.H.; Orvig, C. Vanadium compounds as insulin mimics. Chem. Rev. 1999, 99, 2561–2572. [Google Scholar] [CrossRef] [PubMed]
  9. Thompson, K.H.; Orvig, C. Coordination chemistry of vanadium in metallopharmaceutical candidate compounds. Coord. Chem. Rev. 2001, 219, 1033–1053. [Google Scholar] [CrossRef]
  10. Chan, S.-Y.; Ou, S.-M.; Chen, Y.-T.; Shih, C.-J. Effects of DPP-4 inhibitors on cardiovascular outcomes in patients with type 2 diabetes and end-stage renal disease. Int. J. Cardiolol. 2016, 218, 170–175. [Google Scholar] [CrossRef]
  11. King, H.; Aubert, R.E.; Herman, W.H. Global burden of diabetes, 1995–2025: Prevalence, numerical estimates, and projections. Diabetes Care 1998, 21, 1414–1431. [Google Scholar] [CrossRef] [PubMed]
  12. De la Monte, S.M. Relationships Between Diabetes and Cognitive Impairment. Endocrinol. Metab. Clin. N. Am. 2014, 43, 245–267. [Google Scholar] [CrossRef] [Green Version]
  13. Harper, E.; Forde, H.; Davenport, C.; Rochfort, K.D.; Smith, D.; Cummins, P.M. Vascular calcification in type-2 diabetes and cardiovascular disease: Integrative roles for OPG, RANKL and TRAIL. Vasc. Pharmacol. 2016, 82, 30–40. [Google Scholar] [CrossRef] [PubMed]
  14. Ibrahim, M.A.; Habila, J.D.; Koorbanally, N.A.; Islam, M.S. Butanol fraction of Parkiabiglobosa (Jacq.) G. Don leaves enhance pancreatic β-cell functions, stimulates insulin secretion and ameliorates other type 2 diabetes-associated complications in rats. J. Ethnopharmacol. 2016, 183, 103–111. [Google Scholar] [CrossRef] [PubMed]
  15. Bhowmik, D.; Chiranjib, B.; Yadav, J.; Chandira, M.R. Role of community pharmacist in management and prevention diabetic foot ulcer and infections. J. Chem. Pharm. Res. 2009, 1, 38. [Google Scholar]
  16. Kvetensky, J.; Zaoralek, A.; Harinova, E. Application of a hydroxyl functionalized ionic liquid modified electrode for the sensitive detection of adenosine-5′-monophosphate. Vnitr. Lek. 1966, 12, 601–606. [Google Scholar] [PubMed]
  17. Wiontzek, H. Treatment of acute intermittent prophyria using adenosine monophosphoric acid. Med. Klin. 1969, 64, 1238–1240. [Google Scholar] [PubMed]
  18. Haug, H.; Strik, W.O.; Meyer, W.; Deibert, K.; Polzien, P. On the concentration changes of glucose, lactic acid, pyruvic acid and adenosine tri-, di-and monophosphoric acids (ATP, ADP, AMP) in the blood of the pulmonary artery before and after administration of theophylline ethylendiamine. Arzneimittelforschung 1967, 17, 1411–1414. [Google Scholar]
  19. Rudichenko, V.F.; Dumanskii, I.D. Effect of adenosine monophosphoric acid on oxidative phosphorylation in the liver under the prolonged action of microwaves. Gig. Tr. Prof. Zabol. 1976, 10, 51–52. [Google Scholar]
  20. Lujf, A.; Schwarzmeier, J.; Moser, K. Über den Adeninnukleotidgehalt (ATP, ADP, AMP) normaler menschlicher Skeletmuskulatur. Klin. Wochenschr. 1971, 49, 499–500. [Google Scholar] [CrossRef]
  21. Headrick, J.P.; Peart, J.; Hack, B.; Garnham, B.; Matherne, G.P. 5′-Adenosine monophosphate and adenosine metabolism, and adenosine responses in mouse, rat and guinea pig heart. Comp. Biochem. Physiol. Part A Mol. Integr. Physiol. 2001, 130, 615–631. [Google Scholar] [CrossRef]
  22. Hounsom, L.; Horrobin, D.F.; Tritschler, H.; Corder, R.; Tomlinson, D.R. A lipoic acid-gamma linolenic acid conjugate is effective against multiple indices of experimental diabetic neuropathy. Diabetologia 1998, 41, 839–843. [Google Scholar] [CrossRef]
  23. Siddiqui, M.R.; Taha, A.; Moorthy, K.; Hussain, M.E.; Basir, S.F.; Baquer, N.Z.J. Amelioration of altered antioxidant status and membrane linked functions by vanadium and Trigonella in alloxan diabetic rat brains. J. Biosci. 2005, 30, 101–108. [Google Scholar] [CrossRef]
  24. Stone, S.H. Method for obtaining venous blood from the orbital sinus of the rat or mouse. Science 1954, 119, 100. [Google Scholar] [CrossRef]
  25. Woodhead, O.; Otton, P.; Spake, L. Radioimmunoassay of insulin. Clin. Pharmacol. 1947, 21, 11–15. [Google Scholar]
  26. Carleton, H.M. Carleton’s Histological Technique, 4th ed.; Oxford University Press: Oxford, UK, 1967. [Google Scholar]
  27. Snedecor, G.W.; Cochran, W.G. Statistical Methods, 8th ed.; Ames Iowa State University: Iowa City, IA, USA, 1982. [Google Scholar]
  28. Geary, W.J. The use of conductivity measurements in organic solvents for the characterisation of coordination compounds. Coord. Chem. Rev. 1971, 7, 81–122. [Google Scholar] [CrossRef]
  29. Lever, A.B.P. Inorganic Electronic Spectroscopy; Elsevier: Amsterdam, The Netherlands, 1986. [Google Scholar]
  30. Uivarosi, V.; Barbuceanu, S.F.; Aldea, V.; Arama, C.C.; Badea, M.; Olar, R.; Marinescu, D. Synthesis, spectral and thermal studies of new rutinvanadyl complexes. Molecules 2010, 15, 1578–1589. [Google Scholar] [CrossRef] [PubMed]
  31. Tajmir-Riahi, H.A.; Theophanides, T. Adenosine-5′-monophosphate complexes of Pt(II) and Mg(II) metal ions. Synthesis, FT-IR spectra and structural studies. Inorg. Chim. Acta 1983, 80, 183. [Google Scholar] [CrossRef]
  32. Kyogoku, Y.; Higuchi, S.; Tsuboi, M. Intra-red absorption spectra of the single crystals of 1-methyl-thymine, 9-methyladenine and their 1: 1 complex. Spectrochim. Acta Part A Mol. Spectrosc. 1967, 23, 969–983. [Google Scholar] [CrossRef]
  33. Horowitz, H.W.; Metzger, G. A new analysis of thermogravimetric traces. Anal. Chem. 1963, 35, 1464–1468. [Google Scholar] [CrossRef]
  34. Coats, A.W.; Redfern, J.P. Kinetic parameters from thermogravimetric data. Nature 1964, 201, 68–69. [Google Scholar] [CrossRef]
  35. Miyauchi, A.; Okabe, T.H. Production of metallic vanadium by preform reduction process. Mater. Trans. 2010, 51, 1102–1108. [Google Scholar] [CrossRef]
  36. Cullity, B.D. Elements of X-ray Diffraction; Addison-Wesley Publishing Company: Boston, MA, USA, 1978. [Google Scholar]
  37. Brichard, S.M.; Okitolonda, W.; Henquin, J.C. Long term improvement of glucose homeostasis by vanadate treatment in diabetic rats. Endocrinology 1988, 123, 2048–2053. [Google Scholar] [CrossRef] [PubMed]
  38. Yoshikawa, Y.; Ueda, E.; Kawabe, K.; Miyake, H.; Takino, T.; Sakurai, H.; Kojima, Y.J. Development of new insulinomimetic zinc(II) picolinate complexes with a Zn(N2O2) coordination mode: Structure characterization, in vitro, and in vivo studies. Biol. Inorg. Chem. 2002, 7, 68–73. [Google Scholar] [CrossRef] [PubMed]
  39. Braunwald, E.; Isselbacher, K.J.; Wilson, J.D.; Martin, J.B.; Kasper, D.; Hauser, S.L.; Longo, D.L. (Eds.) Evaluation of liver function. In Harrison’s Principles of Internal Medicine; McGraw-Hill: New York, NY, USA, 2001; pp. 1711–1715. [Google Scholar]
  40. Delanghe, J.; De Slypere, J.P.; De Buyzere, M.; Robbrecht, J.; Wieme, R.; Vermeulen, A. Normal reference values for creatine, creatinine, and carnitine are lower in vegetarians. Clin. Chem. 1989, 35, 1802–1803. [Google Scholar]
  41. Butt, A.A.; Michaels, S.; Greer, D.; Clark, R.; Kissinger, P.; Martin, D.H. Serum LDH level as a clue to the diagnosis of histoplasmosis. AIDS Read 2002, 12, 317–321. [Google Scholar]
  42. Gad, Z.M.; Ehssan, A.N.; Ghiet, H.M.; Wahman, F.L. Effects of pioglitazone and metformin on carbohydrate metabolism in experimental models of glucose intolerance. Int. J. Diabetes Metab. 2010, 18, 132–138. [Google Scholar]
  43. Szudelski, T. The mechanism of alloxan and streptozotocin action in B cells of the rat pancreas. Physiol Res. 2001, 50, 537–546. [Google Scholar]
  44. Rajasekaran, S.; Sivagnanam, K.; Subramanian, S. Mineral contents of aloe vera leaf gel and their role on streptozotocin-induced diabetic rats. Biol. Trace. Elem. Res. 2005, 108, 185–195. [Google Scholar] [CrossRef]
Figure 1. Chemical structure of adenosine monophosphate (AMP).
Crystals 09 00208 g001
Figure 2. Proposed structure of the oxidovanadium(IV)–AMP complex.
Crystals 09 00208 g002
Figure 3. TGA/DTG curves of the [(AMP)(VO)(H2O)2] complex.
Crystals 09 00208 g003
Figure 4. DTA curve of [(AMP)(VO)(H2O)2] complex.
Crystals 09 00208 g004
Figure 5. XRD of the solid oxidovanadium(IV)–AMP complex.
Crystals 09 00208 g005
Figure 6. SEM (a) and TEM (b) micrographs of the solid oxidovanadium(IV)–AMP complex.
Crystals 09 00208 g006
Figure 7. Histology of the pancreas. Pancreatic tissue was collected from each animal after 30 days of treatment. The tissue was sectioned, stained using H & E, and imaged using standard light microscopy at 400× magnification. Double-sided arrows (↕) denote islets of Langerhans. (A) Pancreas from healthy control animal (Group I); (B) Pancreas from STZ-treated diabetic animal (Group II); (C) Pancreas from STZ-treated diabetic animal (Group II); (D) Pancreas from animal treated with oxidovanadium(IV) sulfate alone (Group III); (E) Pancreas from animal treated with oxidovanadium(IV) sulfate alone (Group III); (F) Pancreas from animal treated with oxidovanadium(IV)–AMP complex (Group III).
Crystals 09 00208 g007
Figure 8. Histology of the liver. Liver tissue was collected from each animal after 30 days of treatment. The tissue was sectioned, stained using H & E, and imaged using standard light microscopy at 400× magnifications. Double-sided arrow (↕) denotes the central vein and single-sided arrows (↑) indicate aggregates of inflammatory cells. (a) Liver from healthy control animal (Group I); (b) Liver from STZ-treated diabetic animal (Group II); (c) Liver from animal treated with oxidovanadium(IV) sulfate alone (Group III); (d) Liver from animal treated with the oxidovanadium(IV)–AMP complex (Group IV).
Crystals 09 00208 g008
Table 1. Thermal data of [(AMP)(VO)(H2O)2] complex.
StepsTemperature Range (°C)DTGmax (°C)DTA (°C)Mass Loss (%)Assignments
FoundCalcd
127–39225474 and 265 (exo)25.6225.44C4H6N2O2
2393–714635517 (endo)55.4956.02C6H10N3O6P)
Final residue = VO2 (found = 18.89%, calcd=18.52%)
exo = exothermic peak, endo = endothermic peak.
Table 2. Kinetic and thermodynamic parameters of the second thermal decomposition step of the oxidovanadium(IV)–AMP complex.
MethodParametersr
E (J mol−1)A (s−1)ΔS (J mol−1 K−1)ΔH (J mol−1)ΔG (J mol−1)
CR7.80 × 10470.5−2.19 × 1027.05 × 1042.69 × 1050.9853
HM1.03 × 1053.36 × 103−1.87 × 1029.59 × 1042.65 × 1050.9860
Table 3. Biochemical effects of the oxidovanadium(IV)–AMP complex in vivo. SOD, superoxide dismutase; TC, total cholesterol; TG, triglyceride; HDL-c, high-density lipoprotein cholesterol; LDL-c, low-density lipoprotein cholesterol.
Biological TestGroup IGroup IIGroup IIIGroup IV
Insulin (IU/mL)57.64 ± 1.7623.78 ± 2.5041.44 ± 1.2342.96 ± 1.99
Glucose (mg/dL)77.55 ± 4.93410.23 ± 14.52283.51 ± 9.21280.34 ± 6.87
GPT (U/L)72.33 ± 6.61111.50 ± 7.44124.31 ± 10.53101.57 ± 6.33
Creatinine (mg/dL)0.52 ± 0.121.14 ± 0.180.85 ± 0.153.83 ± 0.25
Uric acid (mg/dL)3.52 ± 0.244.79 ± 0.373.86 ± 0.290.79 ± 0.14
LDH (U/L)295.43 ± 15.33409.55 ± 13.27434.72 ± 19.76391.75 ± 21.31
G6PD (U/L)12.13 ± 0.647.92 ± 0.479.25 ± 0.419.66 ± 0.71
Hb (g/dL)12.82 ± 0.449.83 ± 0.3710.85 ± 0.5111.41 ± 0.61
SOD (U/mL)307.53 ± 15.15259.41 ± 21.66280.37 ± 18.76287.65 ± 17.77
TC (mg/dL)75.66 ± 7.65210.52 ± 10.57129.66 ± 8.77130.44 ± 4.65
TG (mg/dL)139.67 ± 9.45197.46 ± 11.86156.77 ± 10.56151.52 ± 8.72
HDL-c (mg/dL)42.33 ± 3.1221.44 ± 1.7732.32 ± 2.1136.21 ± 2.11
LDL-c (mg/dL)31.33 ± 4.2252.57 ± 5.3242.88 ± 4.7138.43 ± 5.22

