Silver Doping Mechanism in Bioceramics—From Ag+:Doped HAp to Ag°/BCP Nanocomposite

Université Clermont Auvergne, CNRS, SIGMA Clermont, ICCF, F-63000 Clermont-Ferrand, France
*
Author to whom correspondence should be addressed.
Crystals 2019, 9(7), 326; https://0-doi-org.brum.beds.ac.uk/10.3390/cryst9070326
Submission received: 24 May 2019
/
Revised: 20 June 2019
/
Accepted: 23 June 2019
/
Published: 26 June 2019
(This article belongs to the Special Issue Structural Characterization of Calcium Phosphates by Means of X-ray Diffraction)
Abstract
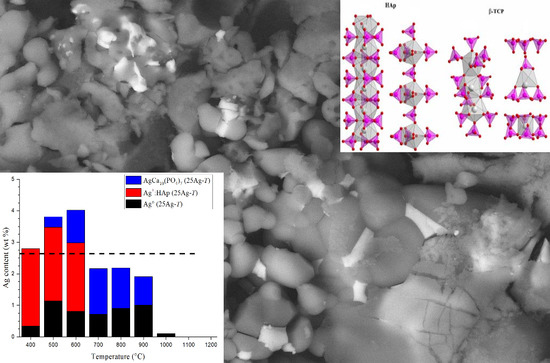
:The results presented in this paper, based on the powder X-ray diffraction technique followed by Rietveld analyses, are devoted to the mechanism of silver incorporation in biphasic calcium phosphates. Results were confirmed by SEM observation. Samples were synthesized via the sol-gel route, followed by heat treatments. Two incorporation sites were highlighted: Ca2+ replacement by Ag+ into the calcium phosphates (HAp: hydroxyapatite and β-TCP: tricalcium phosphate), and the other as metallic silver Ag° nanoparticles (formed by autogenous reduction). The samples obtained were thus nanocomposites, written Ag°/BCP, composed of closely-mixed Ag° particles of about 100 nm at 400 °C (which became micrometric upon heating) and calcium phosphates, themselves substituted by Ag+ cations. Between 400 °C and 700 °C the cationic silver part was mainly located in the HAp phase of the composition Ca10−xAgx(PO4)6(OH)2−x (written Ag+: HAp). From 600 °C silver cations migrated to β-TCP to form the definite compound Ca10Ag(PO4)7 (written Ag+: TCP). Due to the melting point of Ag°, the doping element completely left our sample at temperatures above 1000 °C. In order to correctly understand the biological behavior of such material, which is potentially interesting for biomaterial applications, its complex doping mechanism should be taken into consideration for subsequent cytotoxic and bacteriologic studies.
1. Introduction
The utilization of synthetic materials for bone reconstructive surgery is generally necessary, because autograft and allograft practices are limited by the quantity of available material, and in the first case entails a second surgical procedure [1]. Among the numerous synthetic materials investigated for bone replacement and/or prosthesis coating, hydroxyapatite (HAp, Ca10(PO4)6(OH)2) is the most often-used material due to its chemical and structural similarities with the bone mineral constituent [2,3,4,5]. Biological apatite refers to the main constituent of bone and hard tissue in mammals: a poorly crystallized non-stoichiometric carbonate-containing HAp that composes about 65 weight percent (wt %) of bone and about 90 wt % of dental enamel [6]. Apatite is a complex and diverse class of materials, with a flexible structure that accepts many substitutions, either cationic or anionic [7]. Hydroxyapatite is therefore an interesting biocompatible and osteoconductive material, but it has limited antibacterial properties [8], even though bacterial infections are the main cause of postoperative problems [9]. Bacterial overgrowth on the surface of orthopaedic implants-that is, biofilm formation-potentially leads to serious complications during reconstructive surgery, with severe physiological damage, significant patient discomfort, and additional costly surgical procedures [10,11,12]. About 1% of total joint hip arthroplasties, and about 3% in the case of knees, require a second (or multiple) surgical intervention(s) because of bone healing process complications, which makes it a real societal problem on a global scale [13,14,15,16,17]. Nowadays, an antibacterial effect at the surgical site is ensured by systematic antibiotic administration via the blood, which potentially generates toxicity, poor penetration into the surgical site, and also the problem of bacterial resistance. The delivery, or the presence, of a bactericidal agent directly at the surgical site would ensure a really promising alternative [18,19]. Among the various possibilities, the use of silver—well known in medicine since ancient times in the treatment of bacterial infection—seems very promising by combining broad spectrum and long term antimicrobial activity with the absence of microorganisms developing resistance [20,21,22,23,24,25]. A particularity of the antiseptic properties of silver is the possibility of using it in metallic or ionic form, without a loss of efficiency [26,27,28,29,30,31,32,33,34,35,36,37,38,39,40,41]. For these reasons, research on silver incorporation into hydroxyapatite has developed in recent years, and has shown the high potential of the synthesized materials [17,22,29,30,31,32,33,34,35]. Although the results agree regarding the beneficial biological effects, the literature on the topic does not address the fine description of the synthesized materials and the mechanisms of silver incorporation. Many synthesis methods have been described (co-precipitation [29,35,42] potentially followed by a thermal [8,22,33,36,38] or reducing treatment [34,41], sol-gel [17,30,40,43], electrochemical [31,37], hydrothermal [32], microwave [26,39], sonochemical [44], plasma-spraying [42,45], and also impregnation [46,47] methods), with the formation of two different kinds of material: either an Ag+:doped HAp compound or an Ag°/HAp nanocomposite material. The difference is—of course—fundamental, since in the first case the single-phase material contains Ag+ cations that substitute Ca2+ from the HAp crystal structure, while in the second case metallic silver particles are intimately mixed in a multi-phase composite. Although these two alternatives are listed and described in the literature [44] there is a lack of understanding the mechanisms that lead to one or the other.
The purpose of this paper is to fully characterize the silver–HAp doping mechanism in the case of sol-gel synthesis followed by gradual thermal treatment leading to silver auto-reduction. The study is a continuation of our previous work on the BCP (biphasic calcium phosphate) doping mechanism with cations from the first-row transition metals [48]. The case of zinc doping, with an interstitial mode of incorporation into the HAp crystal structure, was first fully characterized [49,50,51], then investigated for iron [52]. In the case of copper, it transpired that control of the doping mechanism allowed an insight into behavior in a biological environment [53]. For a complete understanding of the present paper it is very important to note the difference between the notations used: Ag+: HAp and Ag°/HAp. Ag+: HAp corresponds to the incorporation of Ag+ cations within the crystal structure of hydroxyapatite (which is expected in the case of conventional cationic doping), whereas Ag°/HAp means the formation of a composite containing two distinct phases, the hydroxyapatite trapping nanoparticles of Ag° metallic silver.
2. Materials and Methods
2.1. Sol-Gel Elaboration of Silver Containing BCP Samples
The sol-gel route previously proposed by the authors was used to synthesize both undoped and Ag-doped series of BCP samples [51]. Briefly, to produce 2 g of undoped BCP powder, 4.7 g of Ca(NO3)2·4H2O (Sigma–Aldrich, Saint Quentin Fallavier, France), and 0.84 g of P2O5 (Sigma–Aldrich, Saint Quentin Fallavier, France) were dissolved in ethanol under stirring and refluxed at 85 °C for 24 h. The solution was then maintained at 55 °C for 24 h to obtain a white consistent gel, and further heated at 80 °C for 10 h to obtain a white powder. Finally, the powder was heat-treated for 15 h. This thermal treatment was performed between 100 °C and 1200 °C. Samples from the undoped series were named the 0Ag-T series with T indicating the temperature (from 400 °C to 1200 °C) of the following thermal treatment. Required amounts of AgNO3 (Sigma–Aldrich, Saint Quentin Fallavier, France) were added to the solution simultaneously with Ca(NO3)2·4H2O (Sigma–Aldrich, Saint Quentin Fallavier, France) in order to synthesize the Ag-doped series. Nominal compositions were calculated, assuming Ag+ calcium substitution (i.e., assuming a (Ca+Ag)/P = 1.67 constant ratio) with two doping levels: a 2.5% calcium substitution (Ag/(Ca+Ag) = 0.025 corresponding to the nominal composition Ca9.75Ag0.25(PO4)6(OH)1.75; named the 25Ag-T series) and a 10% calcium substitution (Ag/(Ca+Ag) = 0.1 corresponding to the nominal composition Ca9Ag1(PO4)6(OH); named the 100Ag-T series). As-synthesized Ag-doped powders were pale yellow; heat treatments turn the color to light grey, and then to white above 1000 °C.
2.2. Powder X-Ray Diffraction (PXRD) and Rietveld Analyses
Powder X-ray diffraction (PXRD) patterns were recorded on a Philips X’Pert Pro PANalytical diffractometer (Almelo, Netherlands), with θ-θ geometry, reflection mode, equipped with a solid-state X-Celerator detector (PANalytical, Almelo, Netherlands), and using Cu Kα radiation (λ = 1.54184 Å). PXRD patterns were recorded at room temperature in the interval 3° < 2θ < 120°, with a step size of Δ2θ = 0.0167° and a counting time of 200 s for each data value.
Rietveld refinements were systematically performed for each measurement (13 temperatures for the 3 series) using the FullProf.2k program [54]. The Rietveld strategy was detailed in previous related works [48,49,50,51,52,53]. A new additional phosphate compound was considered here: AgCa10(PO4)7, which crystallizes in the trigonal R3c space group with a = 10.4372 Å and c = 37.3379 Å [55]. It is isotopic with members of the MCa10(PO4)7 (M = Li, Na, K, and Cs) series, and is closely related to the structure of β-TCP (β-Ca3(PO4)2, R3c symmetry with a = 10.4352 Å and c = 37.4029 Å [56]). The half-occupied Ca4 site of β-TCP [56] becomes fully occupied by silver cations in AgCa10(PO4)7 [55], explaining the charge compensation between Ca2+ and Ag+. The metal Ag° phase was also considered in several samples; it is a compact cubic structure with a = 4.085 Å [57]. An example of a Rietveld plot is shown in Figure S1 (Supplementary Materials).
2.3. Scanning Electron Microscopy (SEM)
Electronic microscopy observations used a ZEISS SUPRA 55VP (Carl Zeiss Microscopy Ltd., Cambridge, UK) with GEMINI Field Emission-Scanning Electron Microscope (Carl Zeiss Microscopy Ltd., Cambridge, UK) and were carried out on pressed pellets after gold metallization. No polishing was carried out to avoid the leaching of the silver cations and to avoid the deformation of the ductile metallic silver particles. The main object of this analysis is not the quantification, but the localization, of the silver element. Quantitative analyses were performed using an EDS (OXFORD XMAX 80 N+ 80 mm2 Si-detector (Oxford Instruments, High Wycombe, UK) combined with OXFORD AZtec Advanced V3.3 software (Oxford Instruments, High Wycombe, UK) on Ca, P, and Ag elements. Measurements were made using an acceleration voltage of 20 kV and 30 seconds of acquisition on three wide areas (magnification ×100) before averaging. Some specific isolated measurements were performed using ×5000 magnification. A 4QBSD detector (Carl Zeiss Microscopy Ltd., Cambridge, UK) was used to acquire chemical contrast images to highlight silver particles.
The following nine samples were characterized by SEM: 0Ag-400, 0Ag-700, 0Ag-1200, 25Ag-400, 25Ag-700, 25Ag-1200, 100Ag-400, 100Ag-700, and 100Ag-1200.
3. Results: Materials Characterization
3.1. Quantitative Phase Analysis
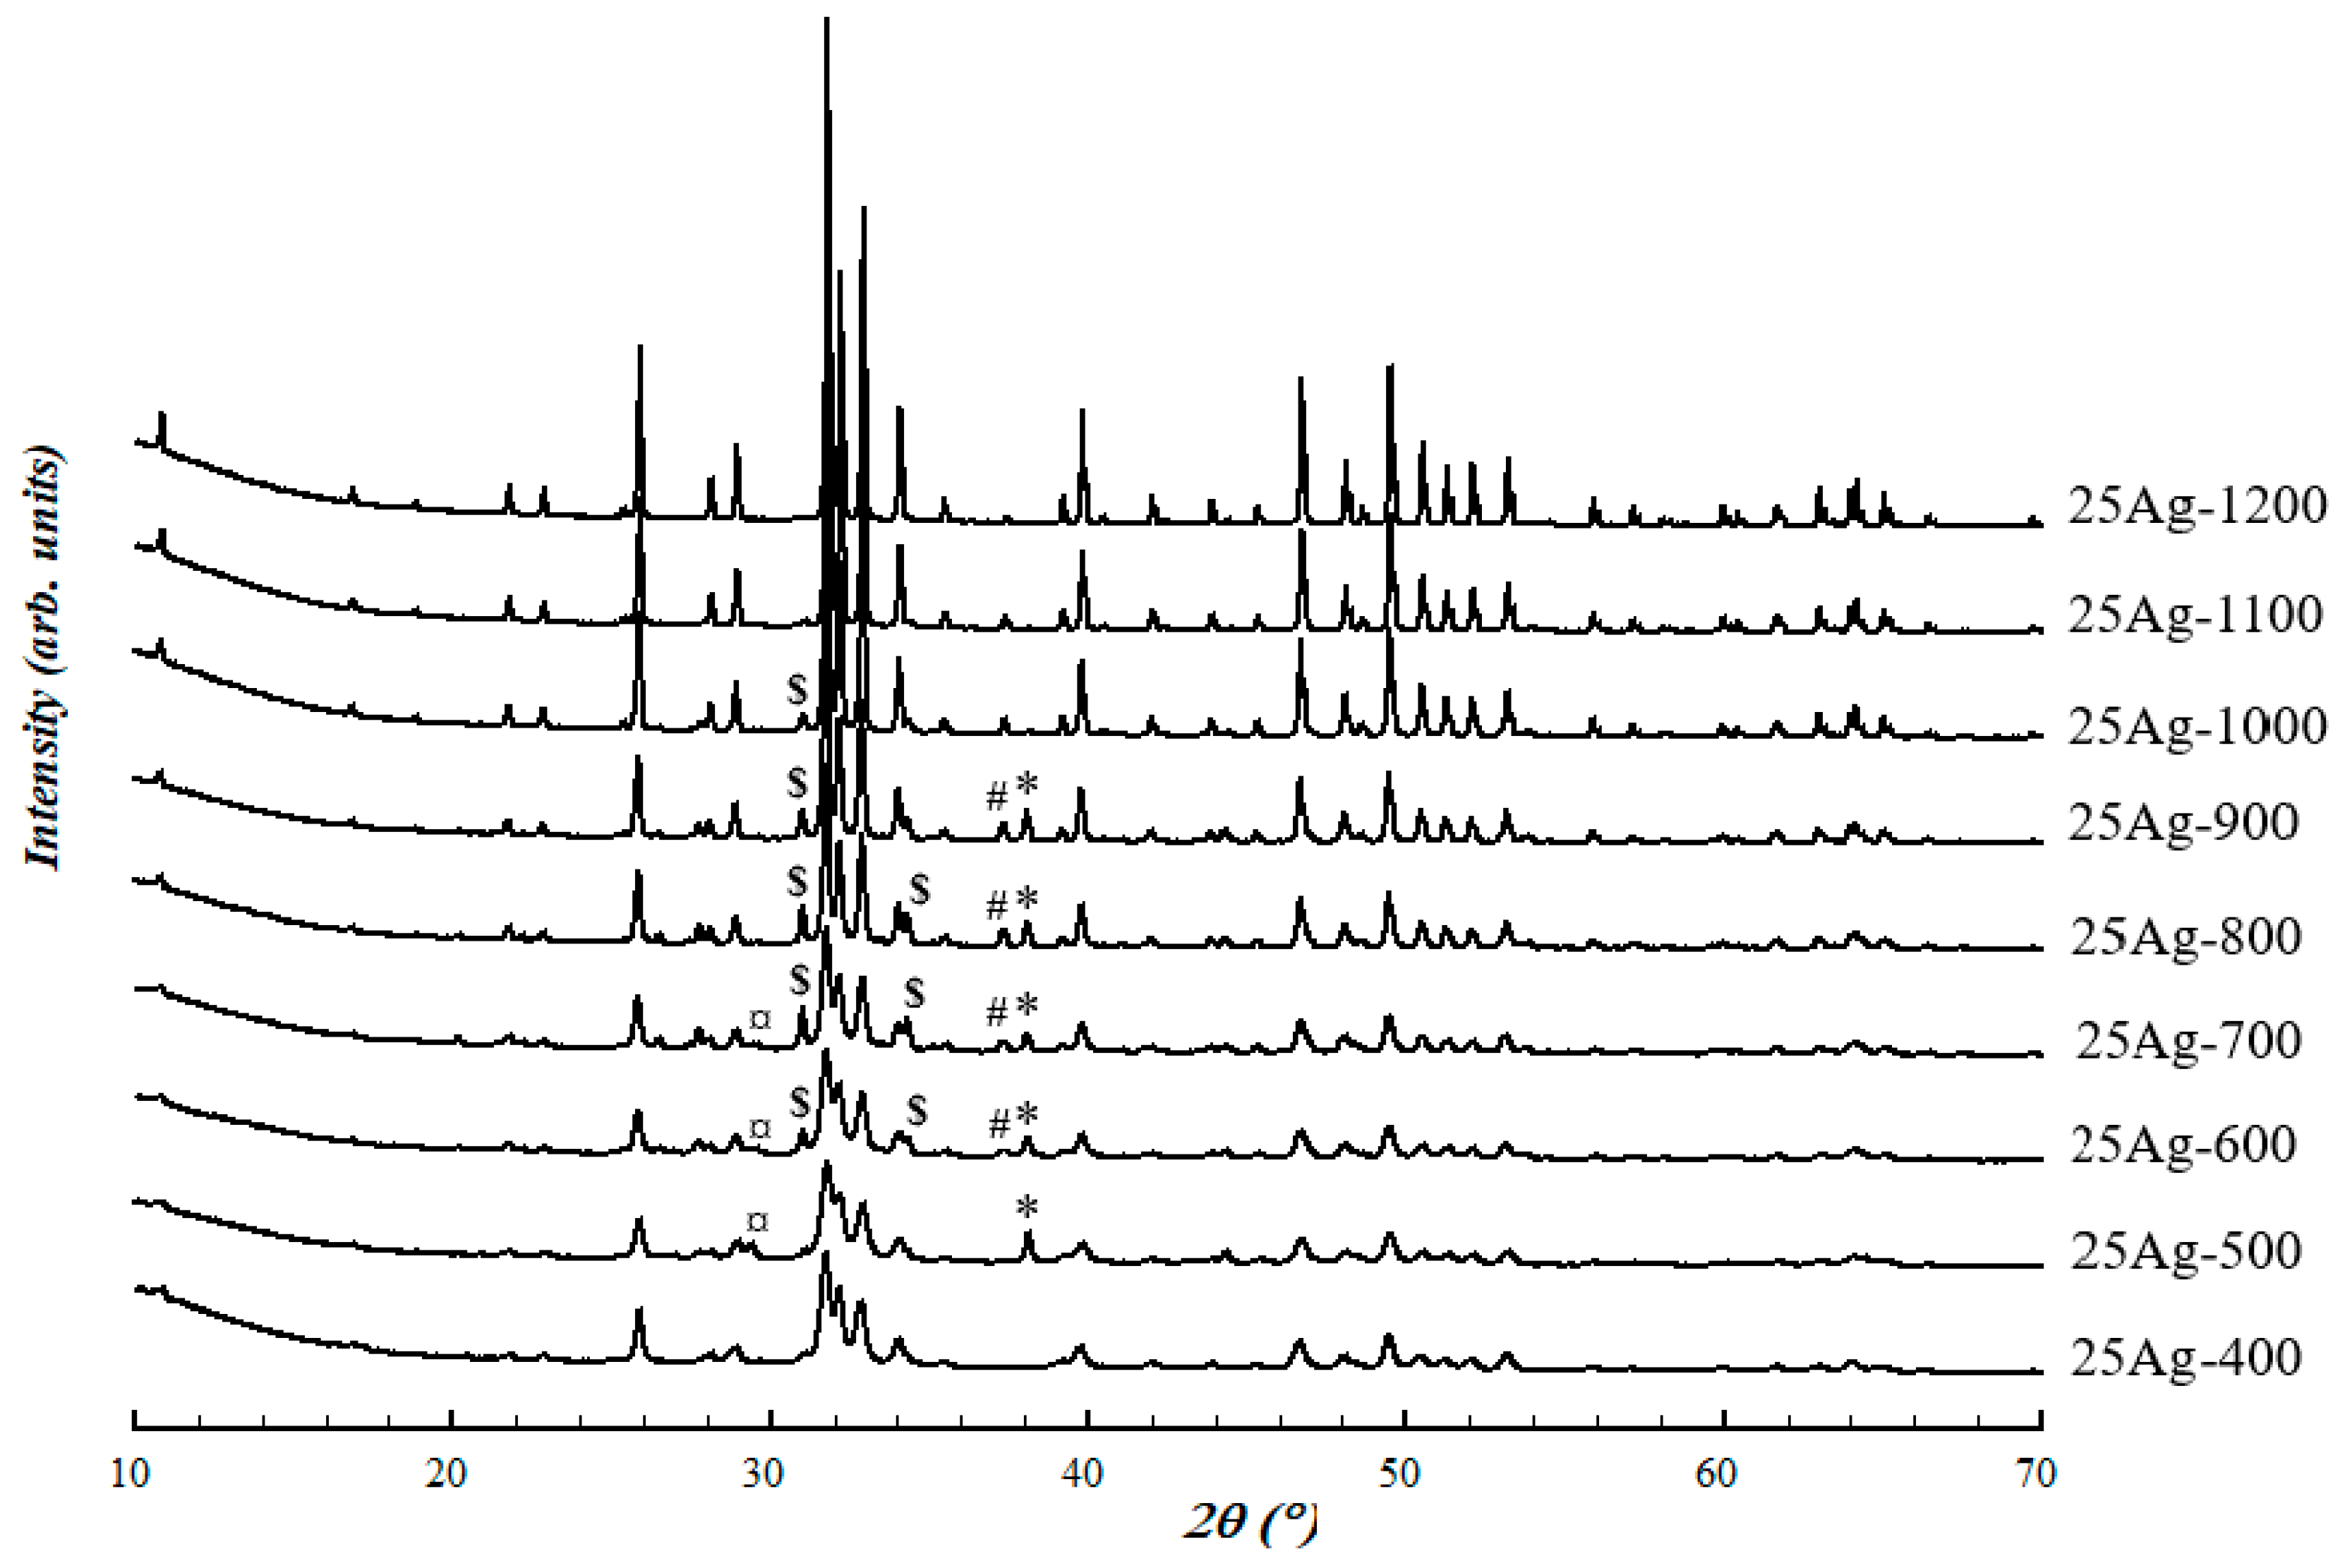
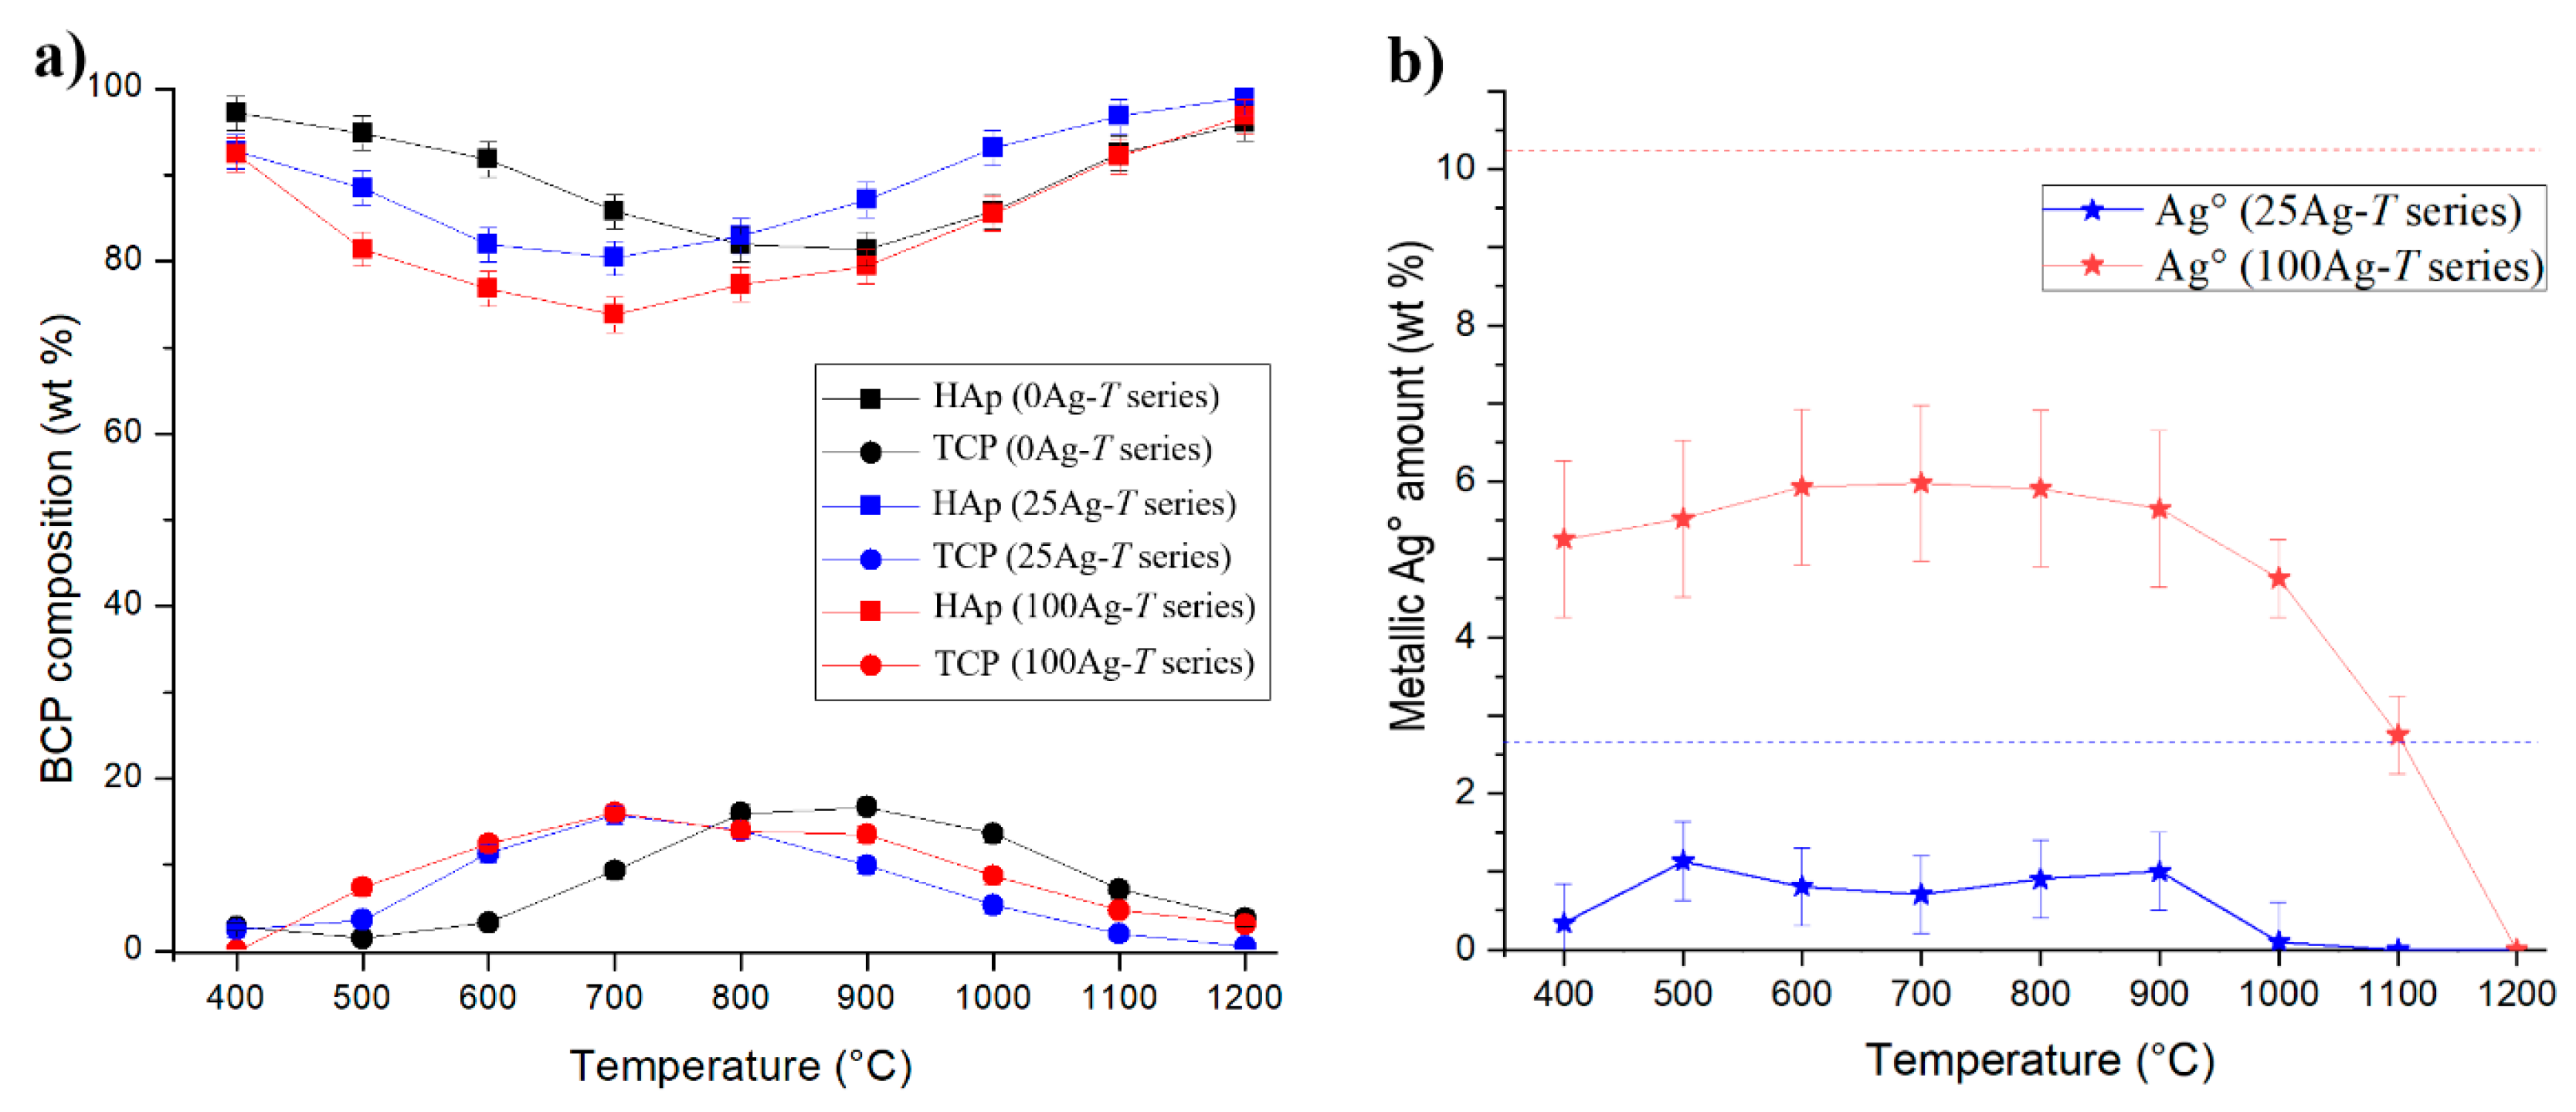
To correctly interpret the behavior of our samples, their phase compositions were extracted from Rietveld analyses (PXRD patterns from the 25Ag-T series are shown in Figure 1). Figure 1 evidences the gradual increase in crystallinity of HAp with respect to temperature by the decrease in the diffraction peak width. Phase compositions of the undoped BCP series and of the two Ag-doped BCP series (x = 25 and 100) are presented in Table 1, and Figure 2a represents the thermal composition variation for the two main phases: HAp and β-TCP. Supplementary minor phases were observed. α-CDP (dicalcium diphosphate with composition Ca2P2O7) was observed up to 700 °C, with a maximum amount of 4 wt % at 500–600 °C. CaO and CaCO3 (calcite) were present in the samples. They are indicated in CaO equivalent content in Table 1, as calcite decarbonation leads to CaO formation at about 800 °C. The amount of CaO equivalent becomes negligible at high temperatures, where the BCP were mainly composed of HAp (corresponding to the nominal composition). All these observations—on main and minor phases—were similar to those of our previous studies on first-row transition metal doping [48,49,50,51,52,53]. The β-TCP phase is stabilized for intermediate temperatures, with a maximum amount close to 20 wt % around 900 °C for the undoped series and around 700 °C for the two silver-doped series. The main difference compared to our previous works concerns the formation of metallic silver, Ag°, already at 400 °C in the Ag-doped series (contrary to metal oxide formation for the first-row transition metals, including ZnO and CuO). The amount of metallic silver reached 1 wt % for the 25Ag-T series and 6 wt % for the 100Ag-T series (Table 1 and Figure 2b). These values are to be compared to the quantities introduced during the syntheses: 2.65 wt % for the nominal Ca9.75Ag0.25(PO4)6(OH)1.75 composition and 10.22 wt % for the nominal Ca9Ag1(PO4)6(OH) composition (respectively the 25Ag-T and the 100Ag-T series). Figure 2b highlights the fact that the entirety of the dopant introduced was not found exclusively in metallic form, but rather of the order of half of this quantity. The reduction of the incorporated Ag+ silver cation to Ag° silver metal was autogenous, and monitored by the thermal treatment only, without any reducing agent.
The formation of Ag°/HAp nanocomposite by heating Ag+-incorporated hydroxyapatite has already been mentioned in the literature, either using a reducing agent (NaBH4 [34,58], hydrazine [41]) or not [17,22,26,38,44]. However, the nanocomposite formation mechanism, the main subject of this paper, has never been studied and detailed. It may first be pointed out that a thermal study on silver nitrate (AgNO3; not shown here) showed decomposition accompanied by reduction at 300 °C, which leads to the production of metallic silver (Ag°). To complete this information, the color changes of our samples are also interesting. The undoped series remained constantly white, while the doped series were yellow at 400 °C (pale yellow for the 25Ag-T series and yellow-brown for the 100Ag-T series), then turned grey up to 1000 °C before bleaching above 1100 °C. The grey color can be attributed to the silver nanoparticles present in the Ag°/HAp composite. It is therefore normal to lose the grey color above 1000 °C, since silver has a melting point of 962 °C. Thus it is difficult to design Ag°/HAp composites which could be obtained following heat treatments at more than 1000 °C [8,36,39,59]. Our white 25Ag-1100, 25Ag-1200, and 100Ag-1200 samples were then exempt of silver particles, and certainly just composed of undoped HAp counterbalanced by a few wt % of β-TCP due to the introduced Ca/P ratio (1.625 for the 25Ag-T series and 1.5 for the 100Ag-T series instead of the 1.67 value for HAp). By wetting calcium phosphate particles, metallic silver was still present in the 25Ag-1000 sample (in very little amount) and in 100Ag-1100 sample (although the Ag° amount decrease is very clear at above 900 °C).
3.2. Thermal Variation in the HAp Structural Parameters
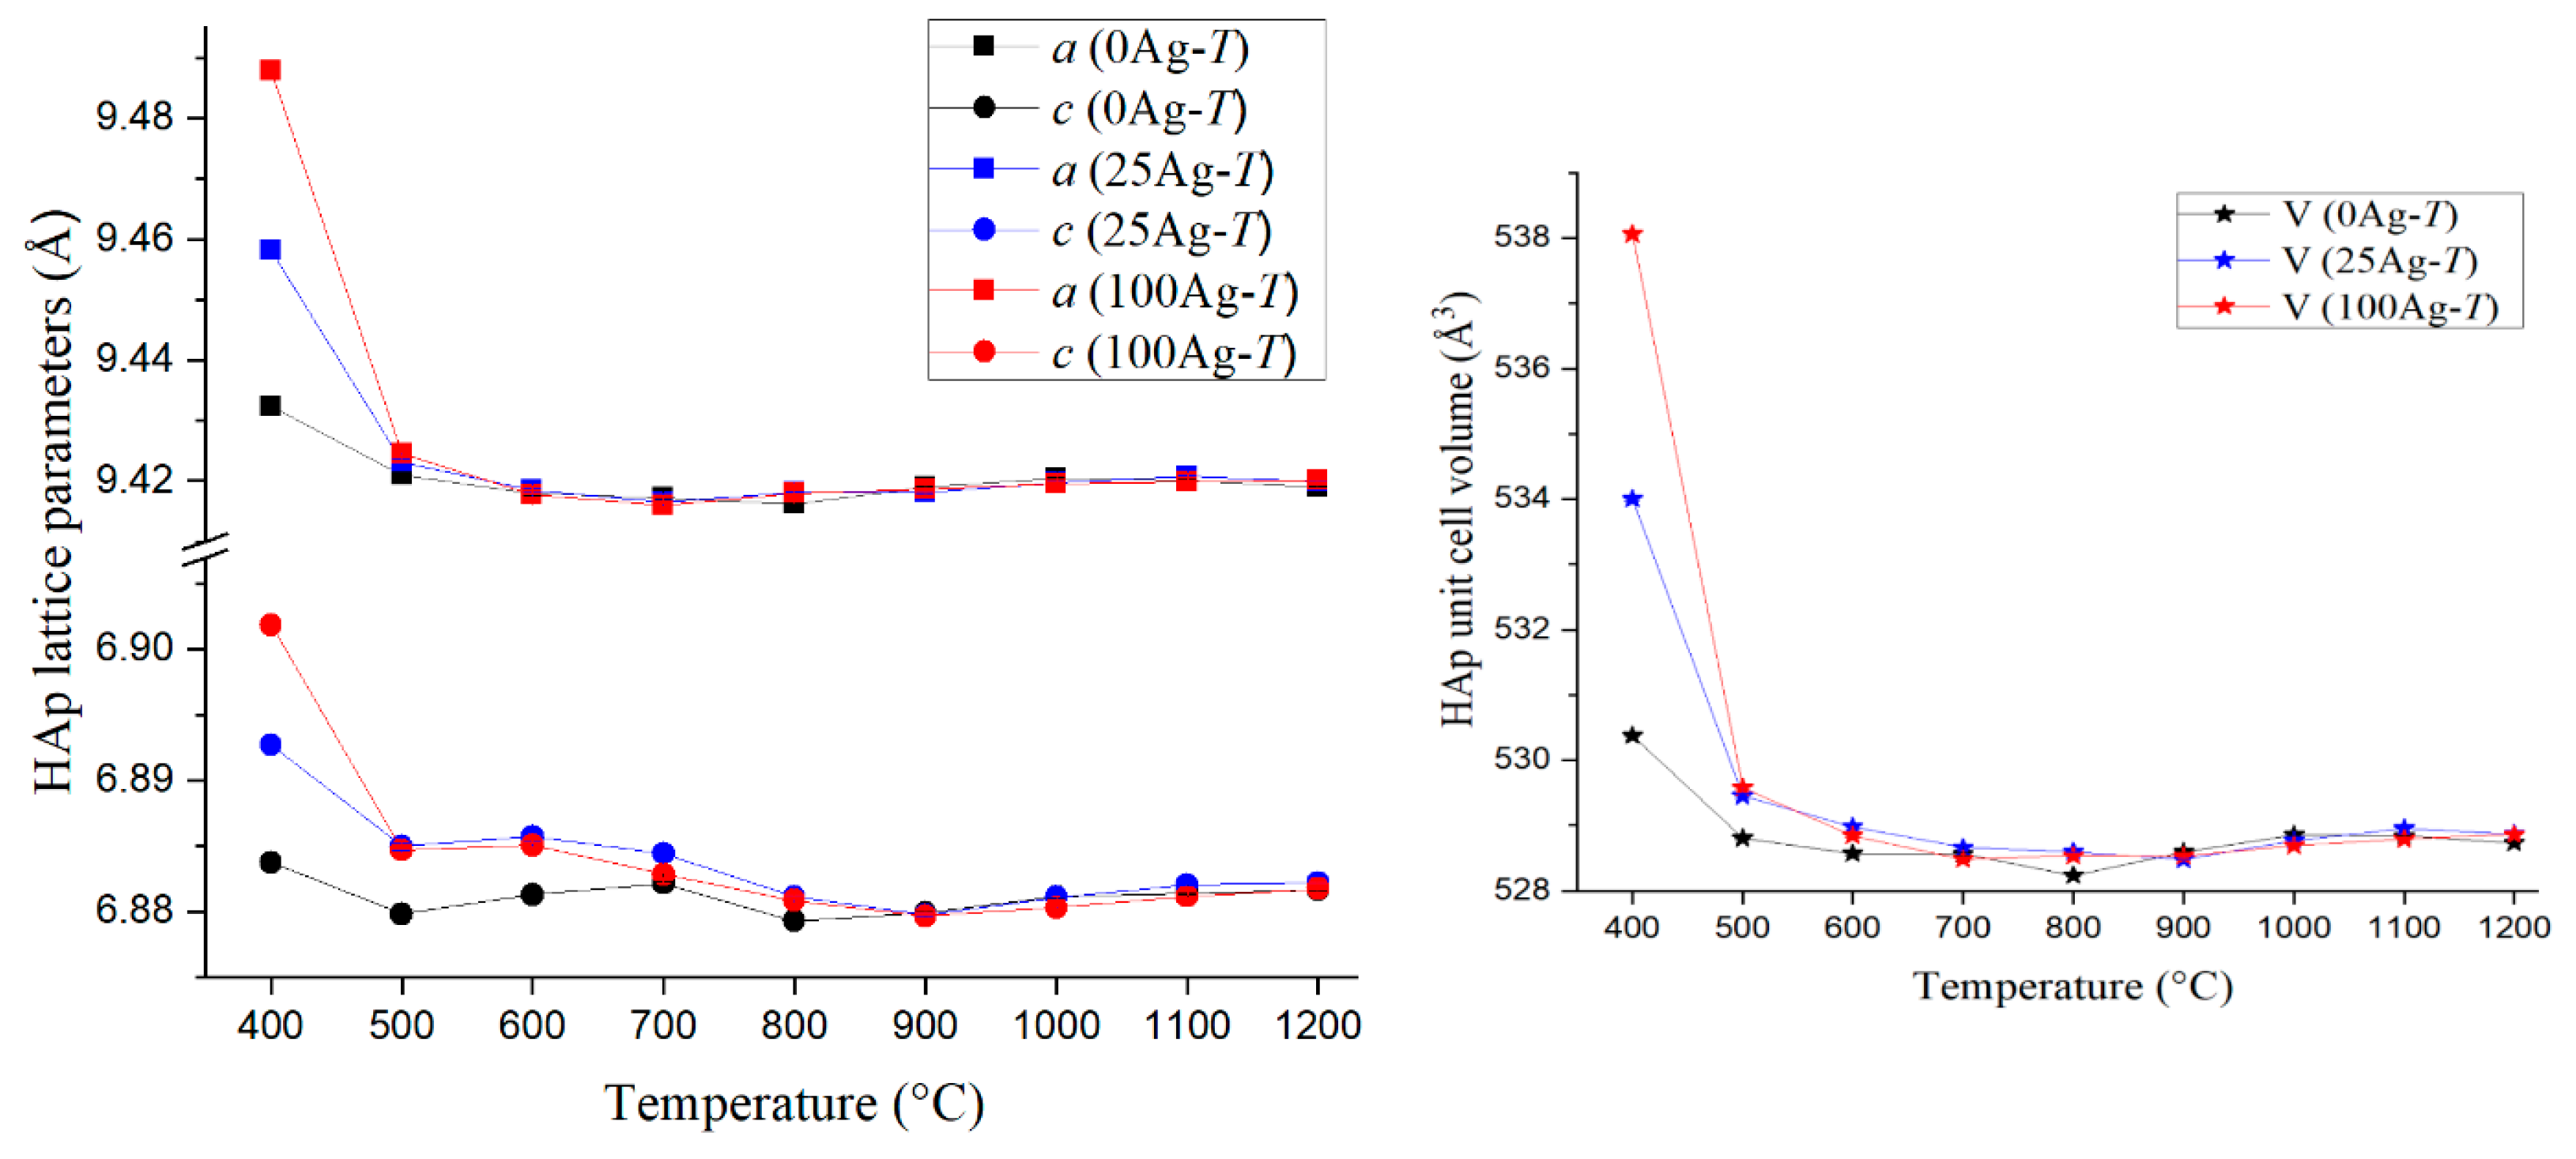
Thermal variations in the HAp lattice parameters are shown in Figure 3 and collated in Table S1 (Supplementary Materials). Figure 3 clearly shows that the parameters of the HAp network evolved for the lowest temperatures and then showed no more variations. The undoped series presents a relatively weak contraction between 400 °C and 500 °C for both a and c lattice parameters (and consequently for the unit cell volume). This contraction is also observed between 400 °C and 500 °C on the basal a lattice parameter for the two silver-doped series, but much more markedly. Concerning the hexagonal c lattice parameter, the difference between the undoped and the two-doped series extends up to 700 °C, which of course also affects the unit cell volume difference up to 700 °C. For the lowest temperatures, an enlargement of the HAp network is in favor of a calcium-to-silver substitution, explained by the larger cationic radius of the Ag+ cation: 1.28 Å for Ag+ against 1.12 Å for Ca2+ in eightfold coordination [60]. This indication of a silver substitution mechanism to form Ag+: HAp with larger lattice parameters is consistent with previous literature results [32,33,38], but more marked in our study. Indeed, the large values found here (a = 9.488 Å and c = 6.901 Å for the 100Ag-400 sample) have never been evinced before. Despite the electronic contrast between Ag+ and Ca2+ cations, the last Rietveld refinement cycles failed to clearly locate the silver atoms in the hydroxyapatite structure. Nevertheless, the indications obtained support the notion of a substitution mechanism at the Ca1 and Ca2 sites; the results indicate substitution rates which are too weak, but which are present (silver occupancies about 3% and 5%-instead of the expected 10 %—for the Ca1 and Ca2 sites respectively), and show the absence of chemical elements at the interstitial site within the hexagonal channel (i.e., the 2b Wyckoff site). This leads us to privilege the Ca10−xAgx(PO4)6(OH)2−x stoichiometry for the doped Ag+: HAp phase, and not that proposed by Geng et.al., Ca10−xAg2x(PO4)6(OH)2 [32], which implies a double mechanism by substitution and insertion. Our work on the structural parameters of hydroxyapatite enables us to conclude that the HAp silver-doped phase is present in our samples from 400 °C to 600 °C. This is correlated with the refined isotropic thermal parameters (see Biso in Table S1, Supplementary Materials) of hydroxyl anions, which are exaggerated in these samples: 25Ag-400, 25Ag-500, 25Ag-600, 100Ag-400, 100Ag-500, and 100Ag-600. We will consider below for these temperatures that the Ag+: HAp phase presents the nominal stoichiometry, that is to say Ca9.75Ag0.25(PO4)6(OH)1.75 for the 25Ag-T series and Ca9Ag1(PO4)6(OH) for the 100Ag-T series, although there is no definitive experimental proof for these compositions.
3.3. Thermal Variation in the β-TCP Structural Parameters
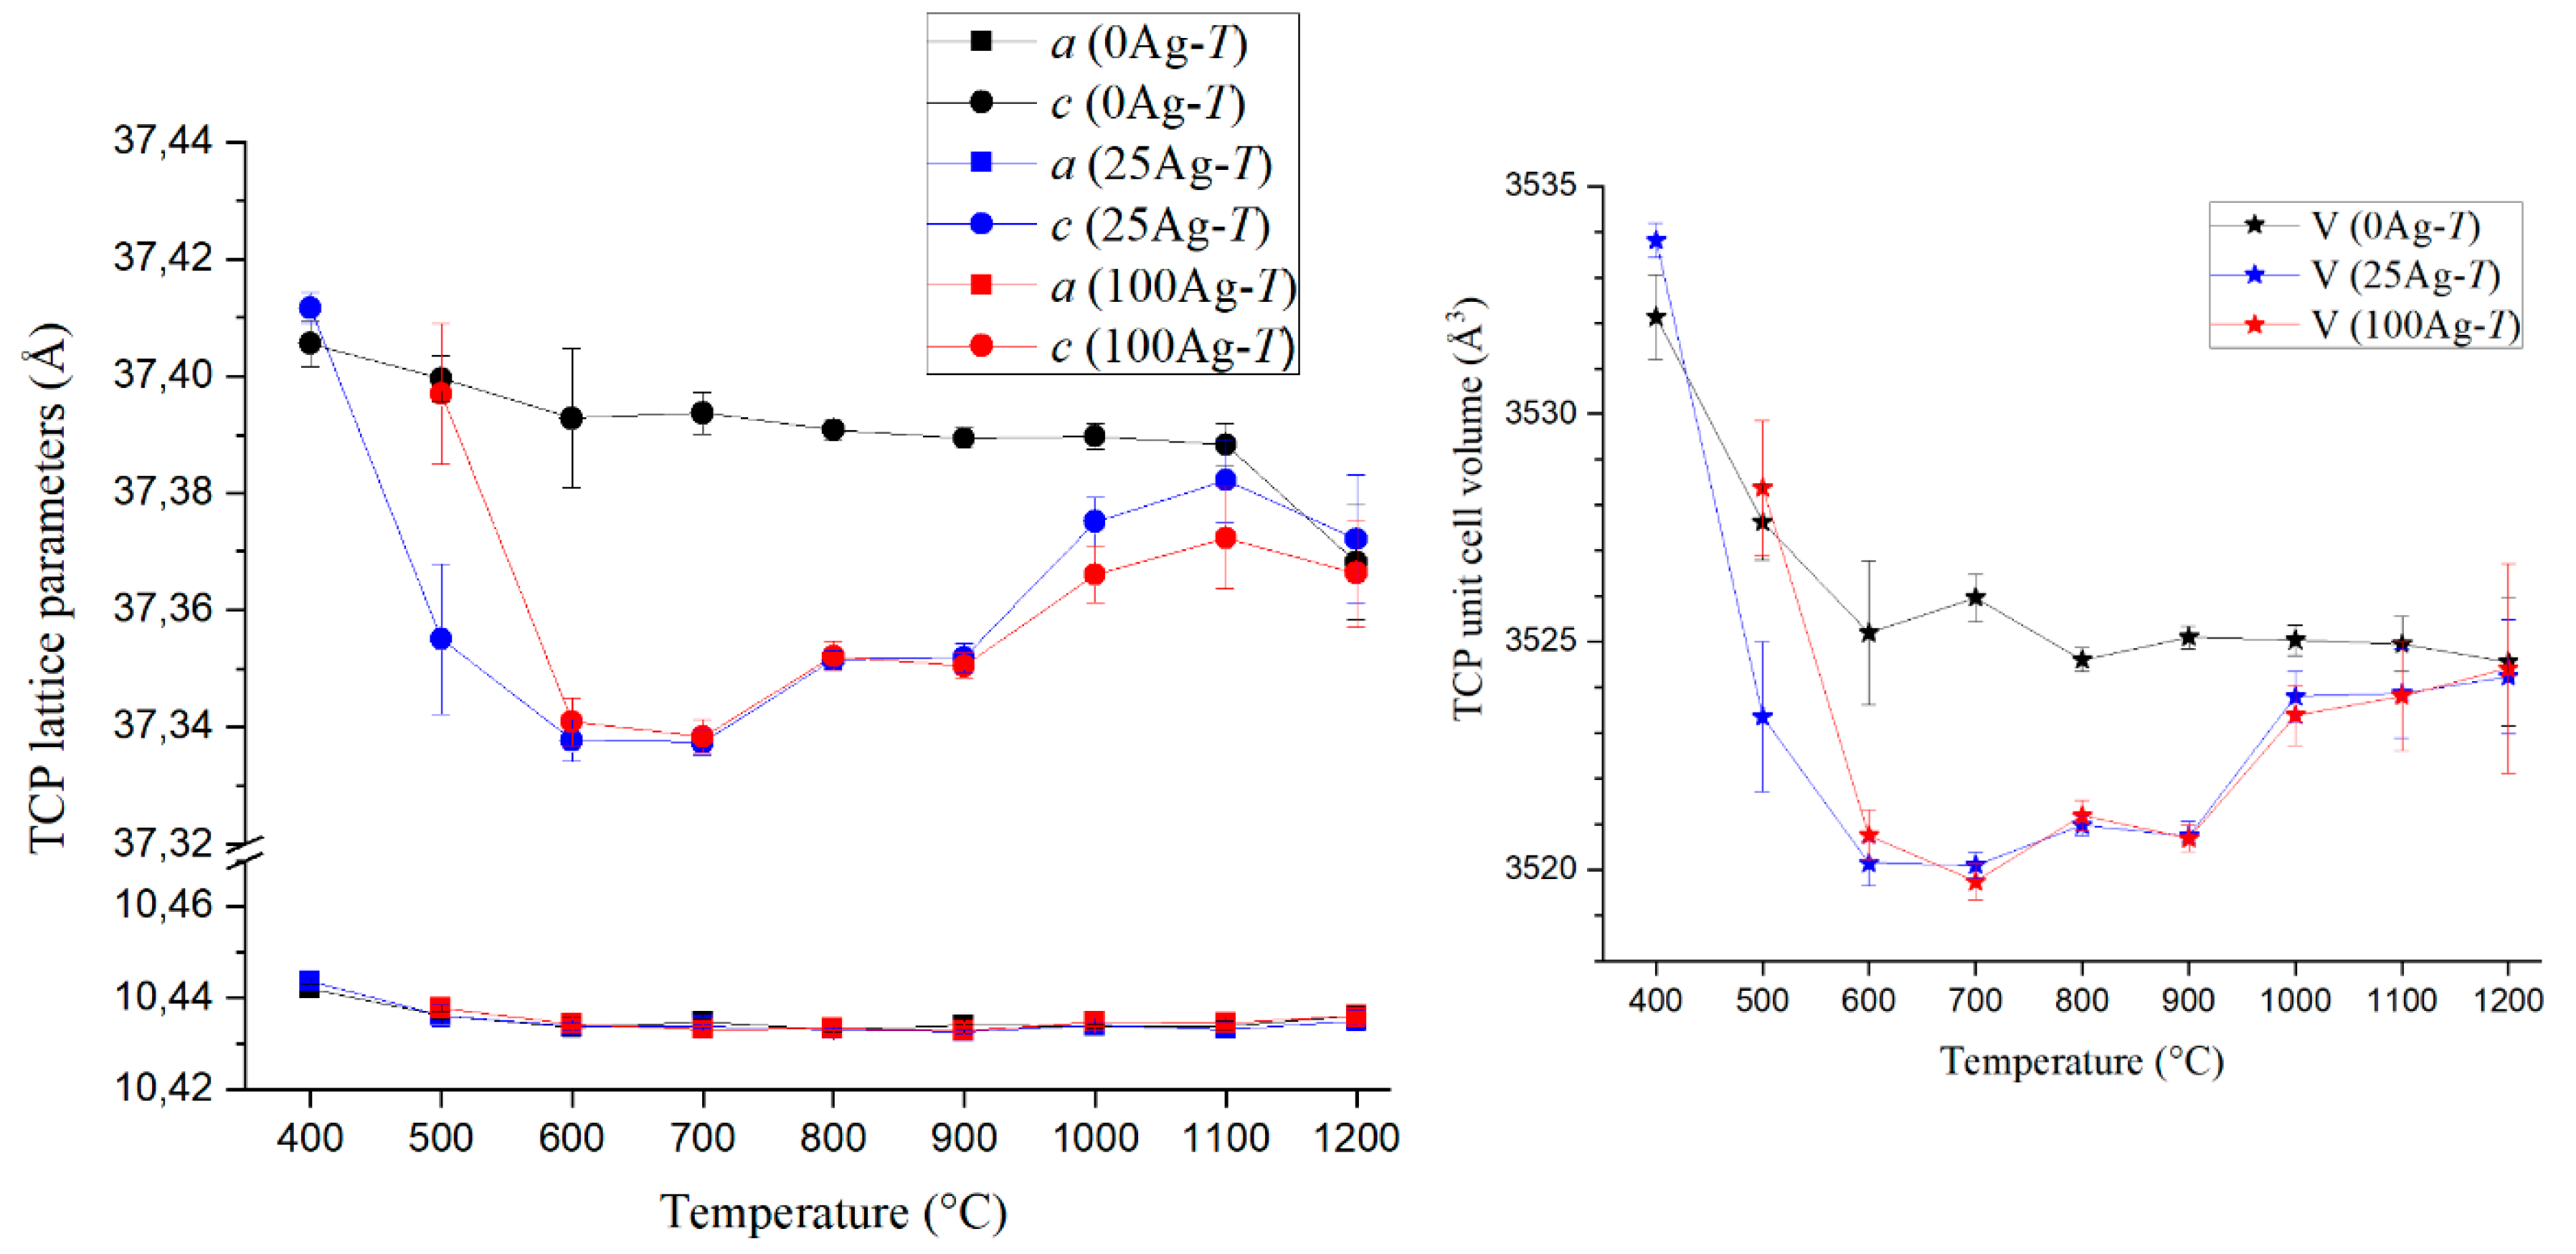
Thermal variations in the TCP lattice parameters, shown in Figure 4 and collated in Table S2 (Supplementary Materials), are very different from those presented above for HAp. The basal a lattice parameter remained constant whatever the synthesis series and heat treatment temperature. On the other hand, variations in the axial c lattice parameter provide interesting information. The c lattice parameter—and consequently the unit cell volume-for the two silver-doped series is below the value refined for the undoped series, except for the temperature of TCP appearance (400 °C for the 25Ag-T series and 500 °C for the 100Ag-T series) and for the higher temperatures (1100 °C and 1200 °C). It corresponds to the formation of the ordered calcium-to-silver substitution in β-TCP that leads to the AgCa10(PO4)7 compound. This compound is isotypic to β-TCP (trigonal R3c space group, 18 independent atomic positions) with its half-occupied Ca4 site (at the special 6a Wyckoff site [56]) fully filled by Ag+ cations [55]. The content of the unit cell is then Ag6Ca60(PO4)42; i.e., AgCa10(PO4)7 corresponding to Ca3−xAg2x(PO4)2 with x = 0.143. This ordered substitution mechanism, leading to a definite compound, is accompanied by a decrease in the axial c lattice parameter despite the larger size of Ag+: 37.403 Å for β-TCP [56] against 37.338 Å for AgCa10(PO4)7 [55]. Thus, the value of the c axial lattice parameter allows us to determine whether the present TCP phase corresponds to the undoped β-TCP phase or the silver-containing AgCa10(PO4)7 phase. Table S2 (Supplementary Materials) indicates the TCP phase attribution for each sample; either β-TCP (implied undoped Ca3(PO4)2) or AgCa10(PO4)7 (called Ag+: TCP here).
3.4. Ag Location Studied by SEM Analyses
SEM analyses were used to evaluate the silver amount and location in selected samples from the doped series. Results from elemental quantifications made with EDS spectroscopy are summarized in Table 2. The calculated Ca/P ratio indicates that results should be considered as semi-quantitative only because of large deviations from the expected values as well as large variations within a single series. This must be connected to the unpolished surface state of the pellets and the use of internal calibration lines in the software. However, interesting additional information is provided by these analyses.
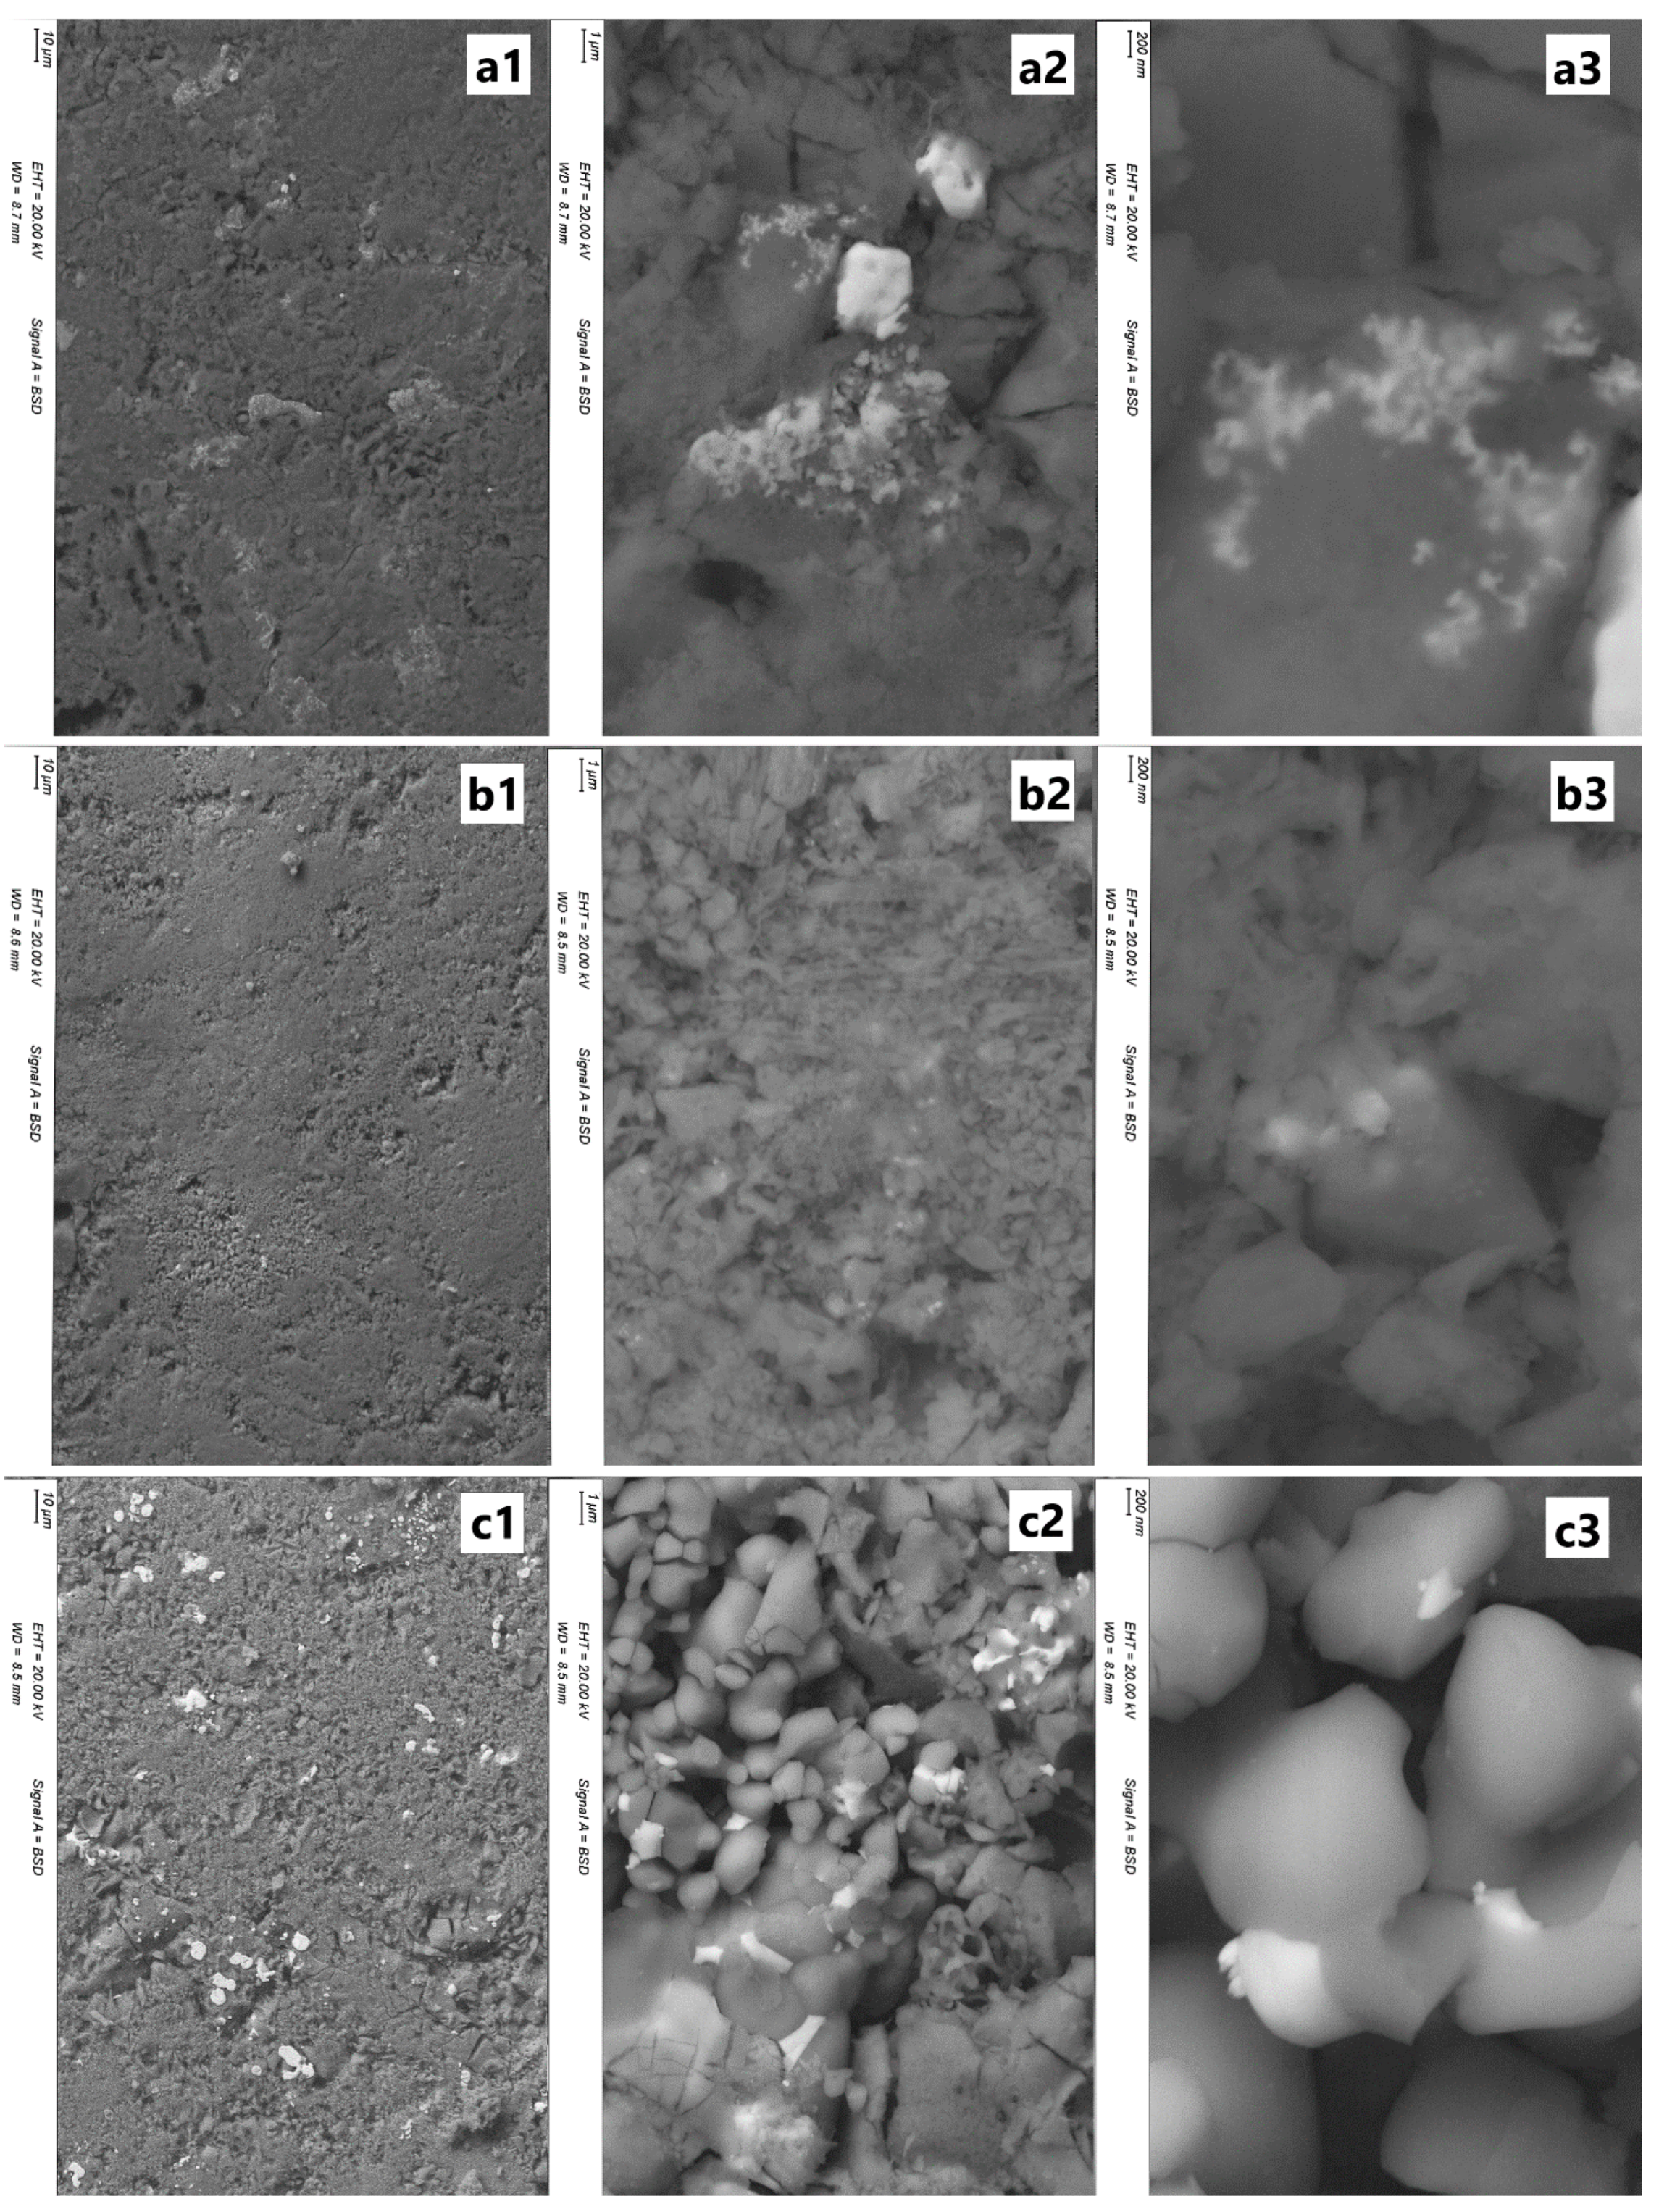
First, results from Table 2 confirm the complete disappearance of silver in doped series after heat treatment at 1200 °C. We can conclude that above the melting point of silver, not only did the metallic Ag° particles leave the sample, but the calcium phosphate phases were also completely free of Ag+ cations. The chemical contrast imaging performed with the backscattered electron detector makes it possible to highlight the notion of Ag° particles (Figure 5). The use of low magnifications shows the presence of large, micrometric particles (already present in the 25Ag-400 sample, and in large quantities in the 100Ag-700 sample). Then, thanks to higher magnifications, it is possible to visualize nanometric particles of small size. Figure 5a3 evidences the presence of silver particles of less than 100 nm diameter in 25Ag-400. These particles merged on heating to reach diameters of 200–400 nm in the 25Ag-700 sample (Figure 5b3) and 500–1000 nm in the 100Ag-700 sample (Figure 5c3). Images from Figure 5 clarify the composite feature of the samples.
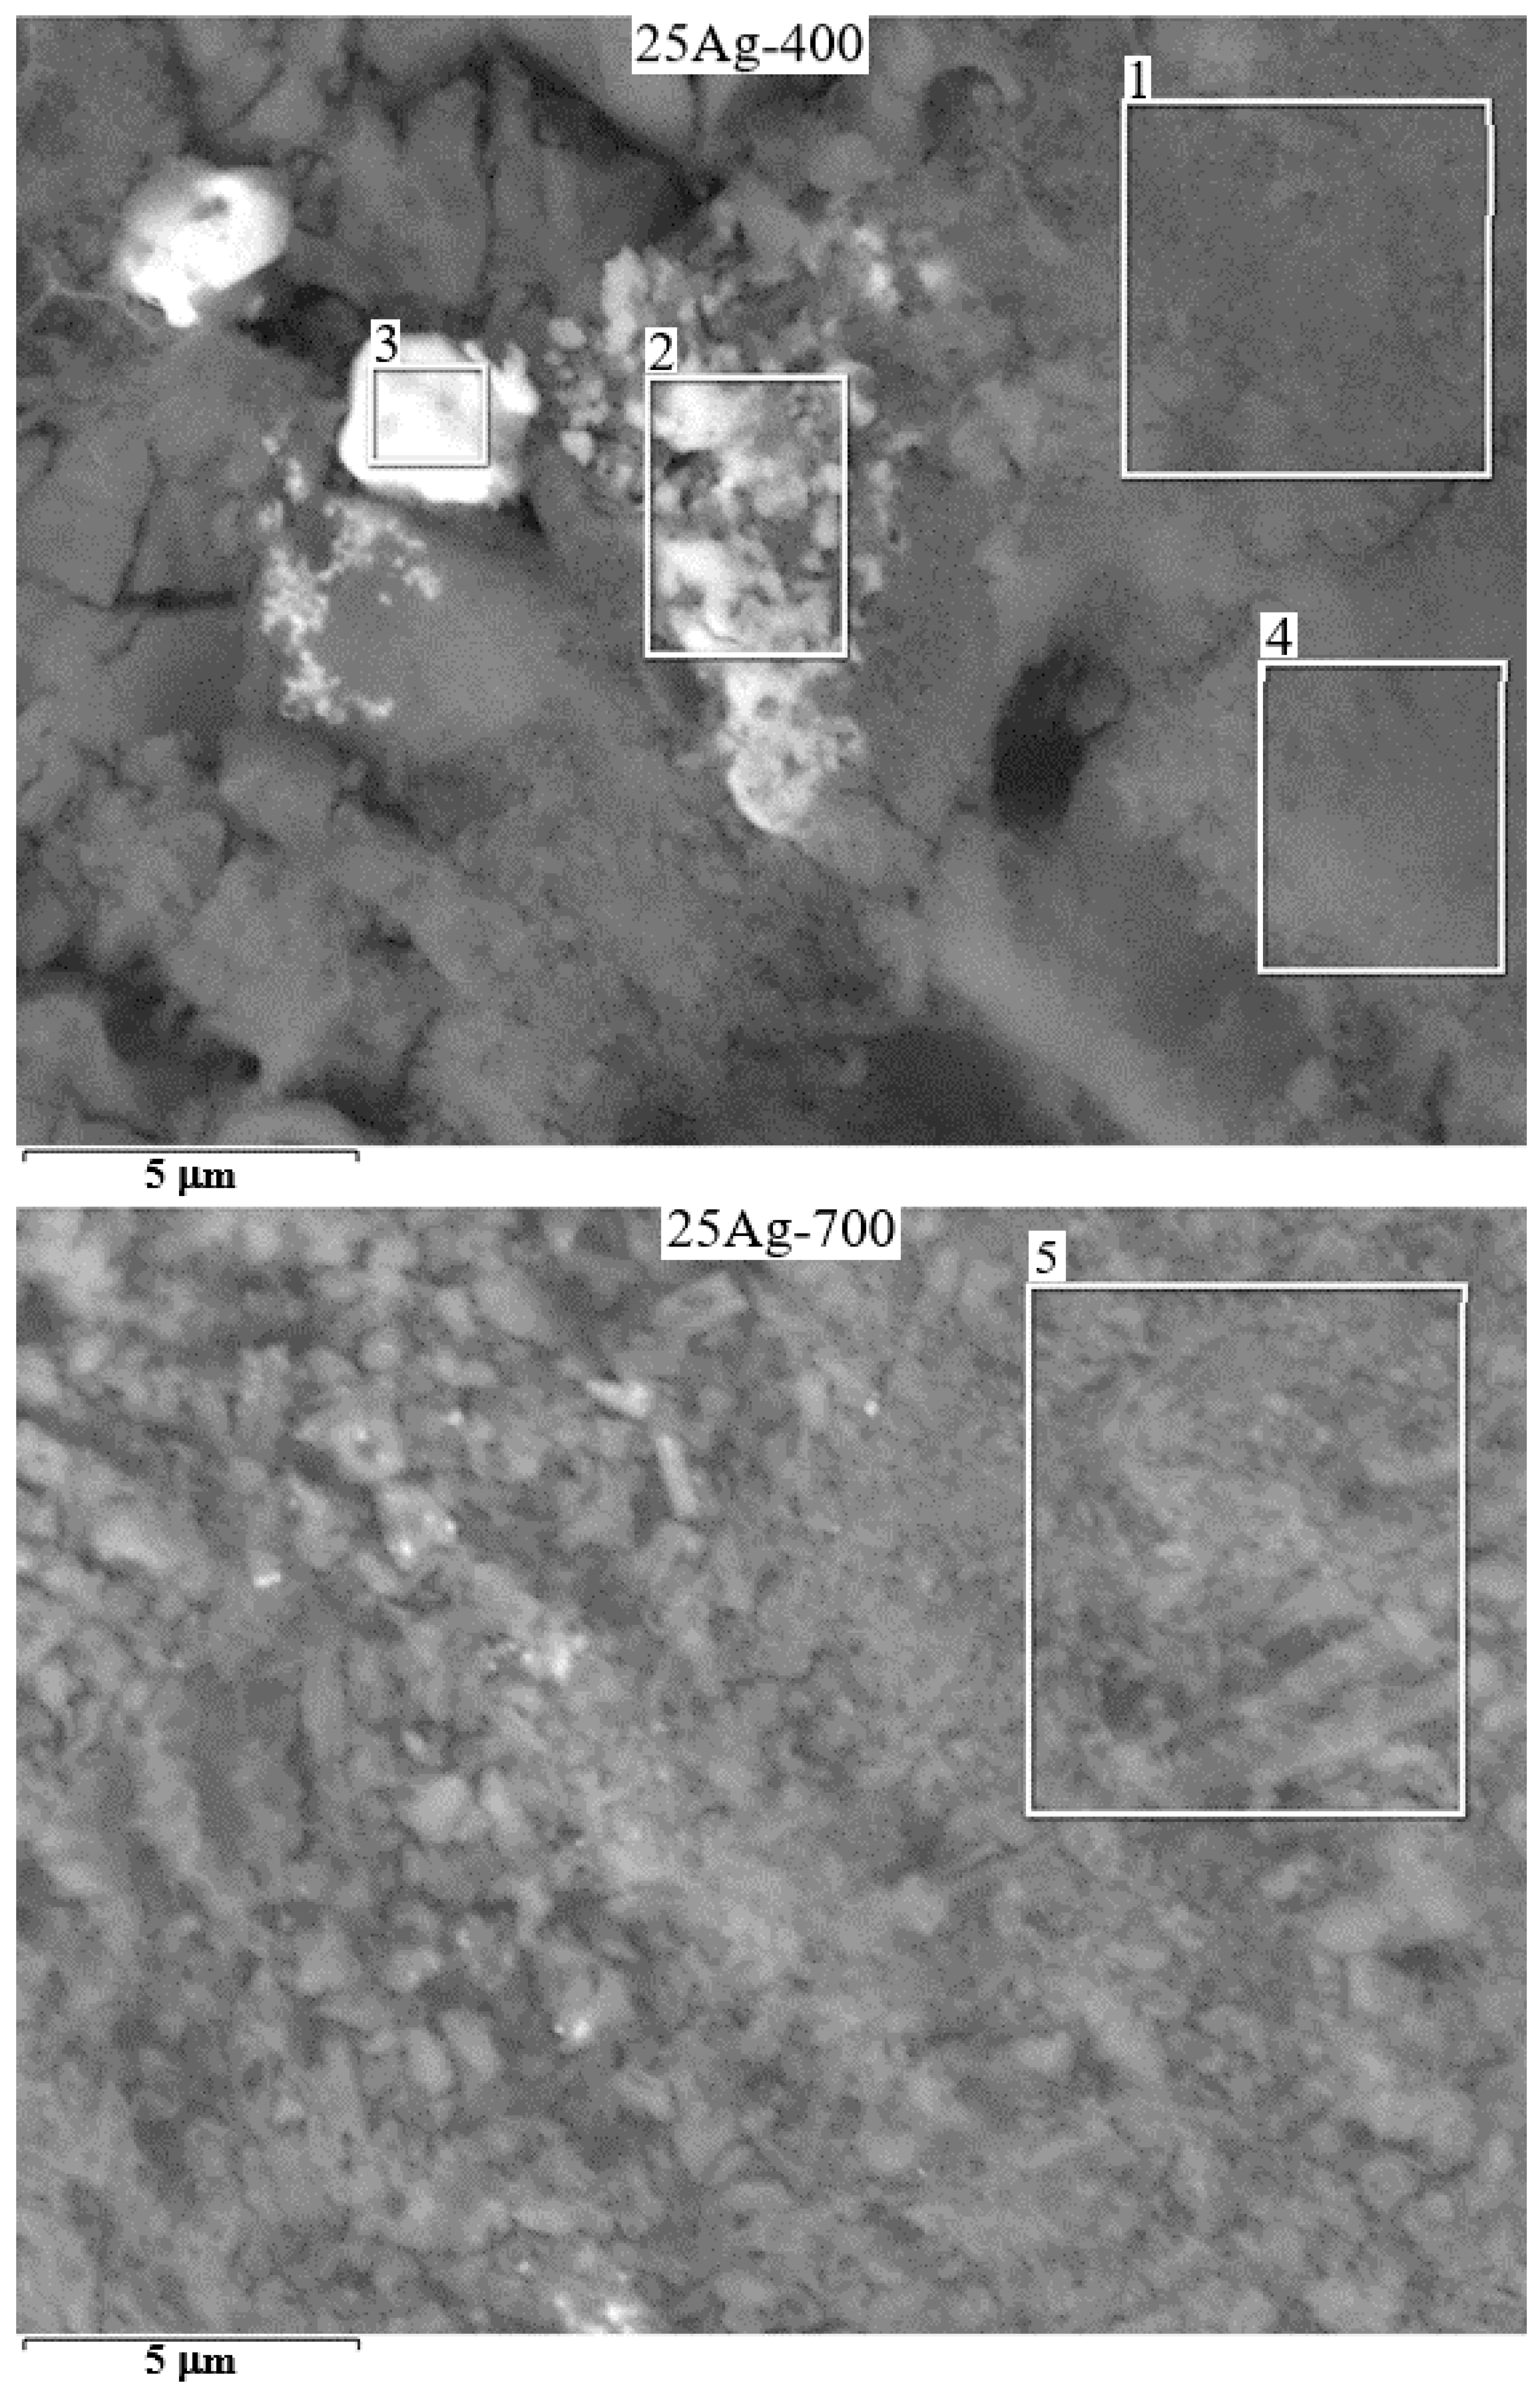
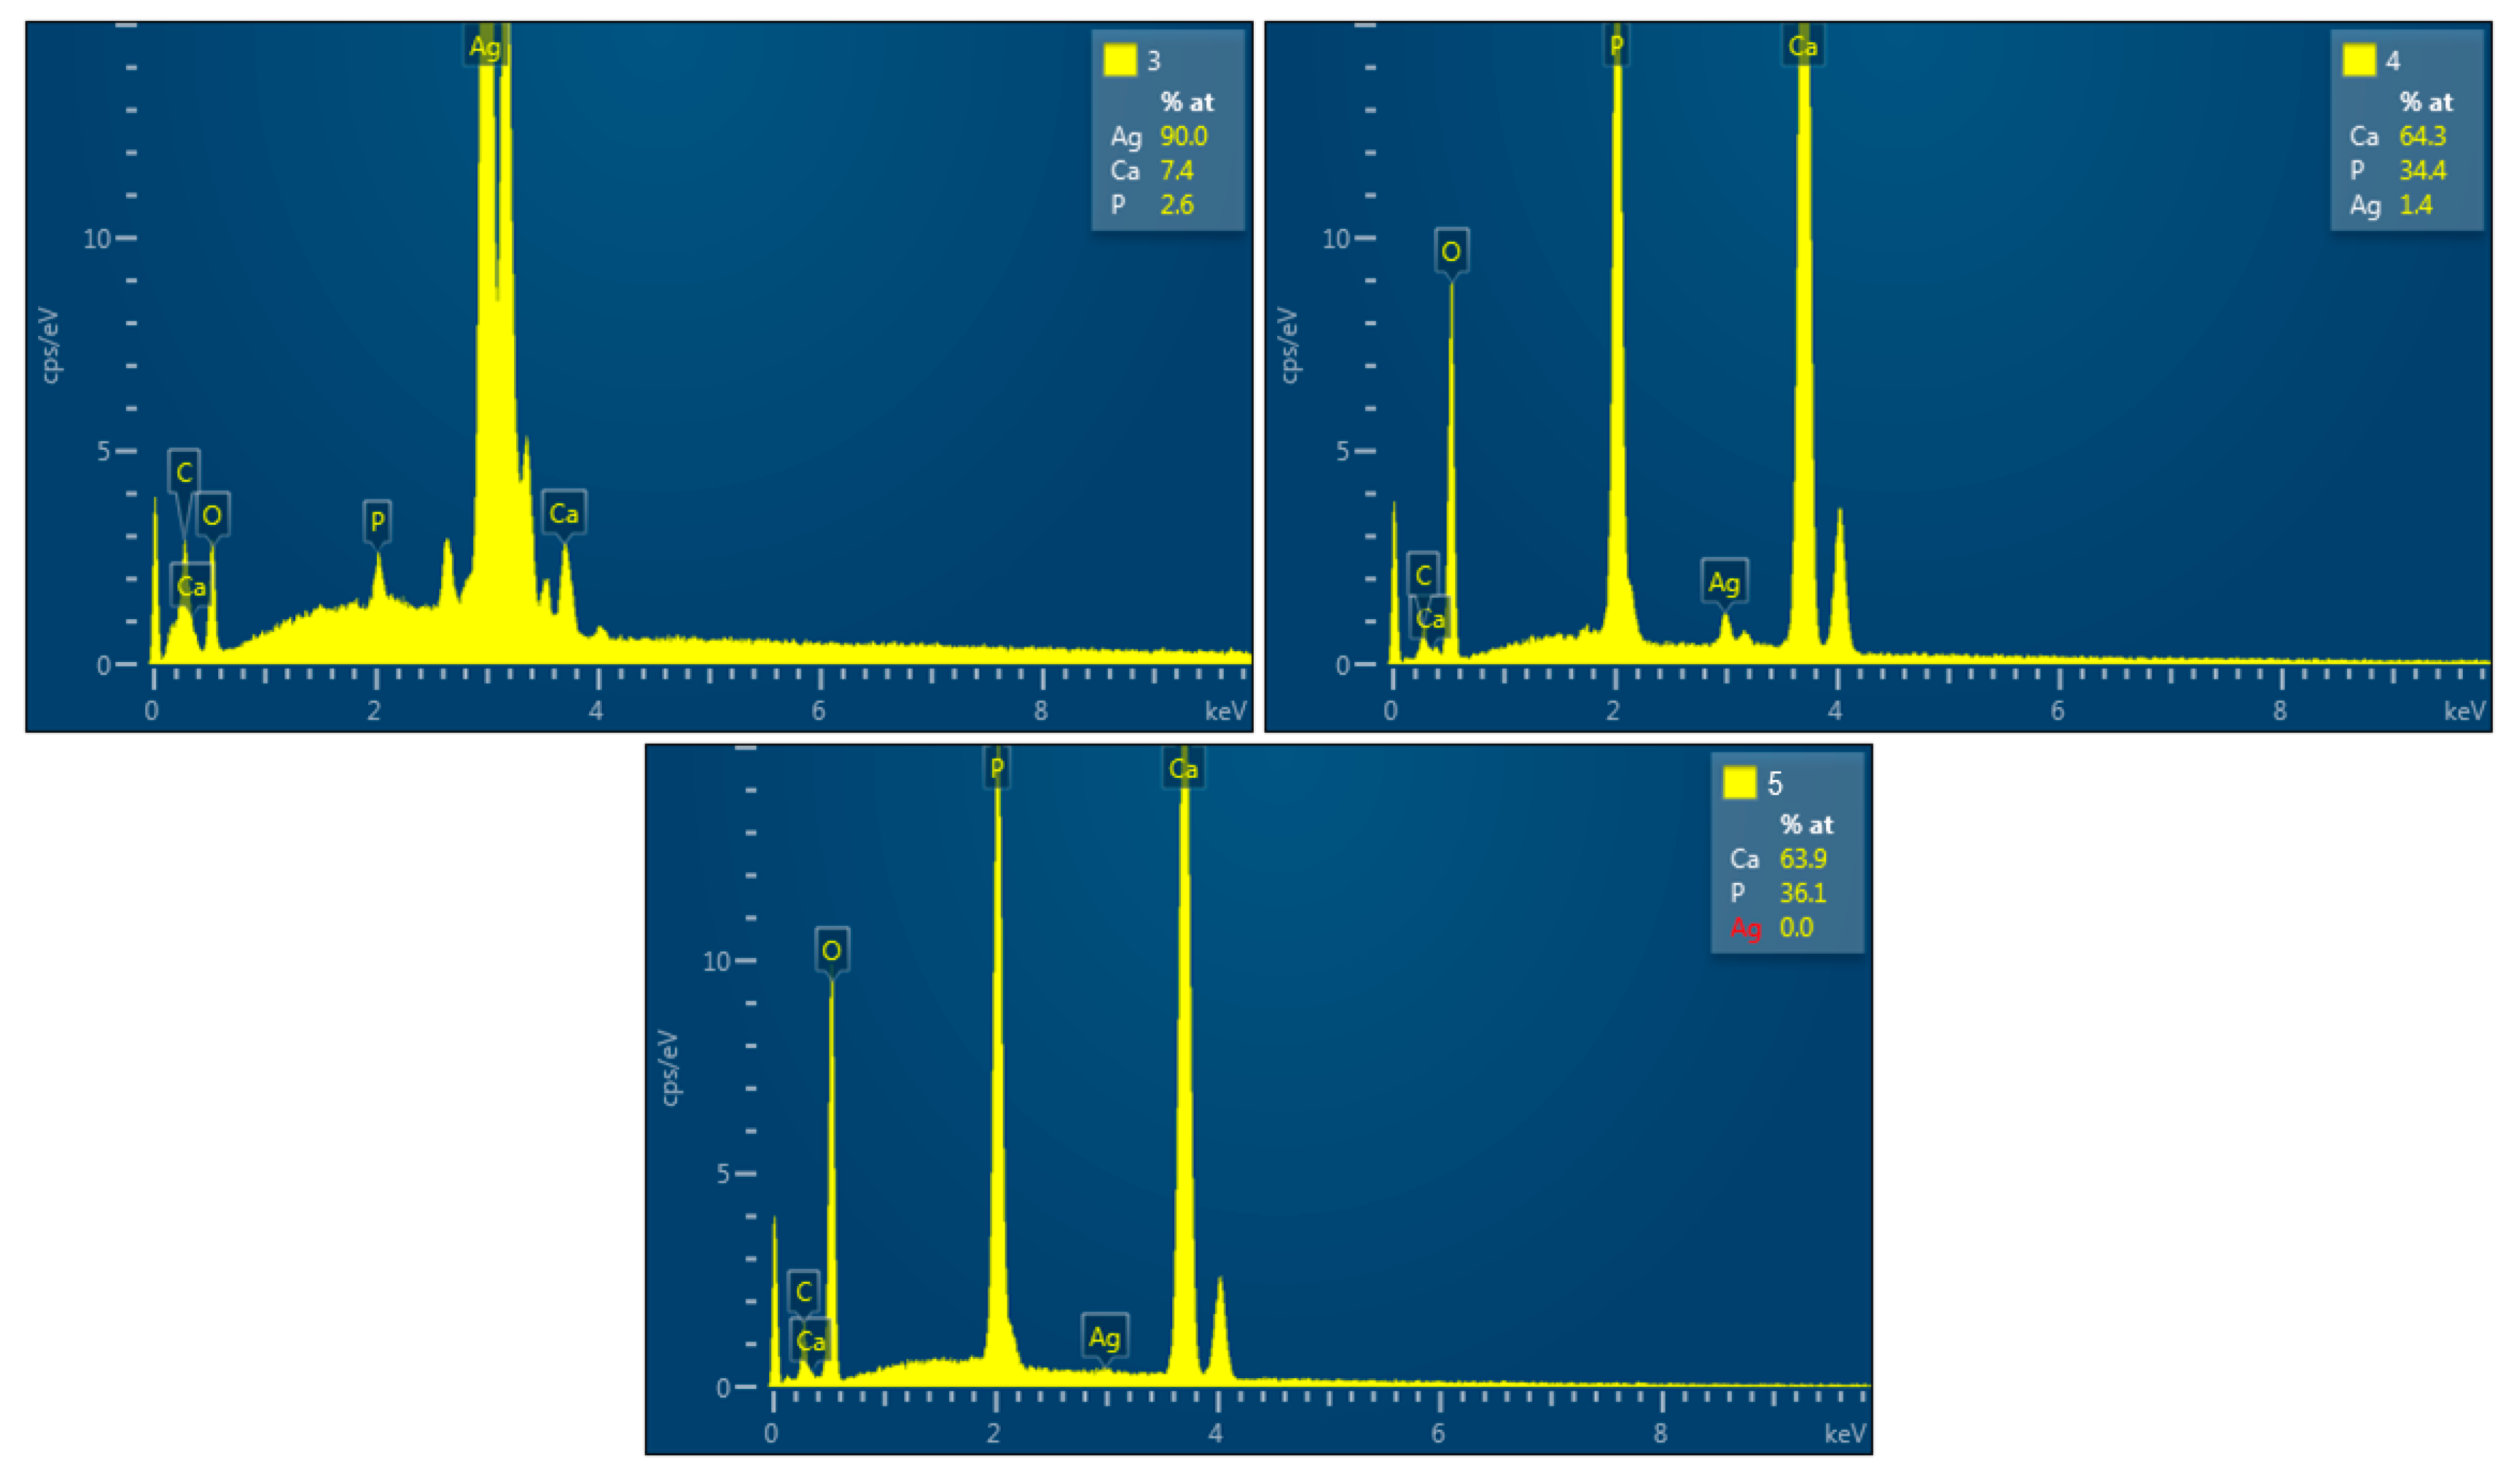
Finally, local elemental analyses were performed to conclude the SEM characterization (see selected zones in Figure 6). Results from selected areas (EDS shown in Figure 7) are presented in Table 2 for the 25Ag-T series. These results confirm that nanoparticles were exclusively composed of silver: metallic Ag° as shown in area 3 (and also area 2) in the 25Ag-400 sample. Indeed, the results from the local zone ‘3’ are in favor of particles containing only the silver element (the minor Ca and P contents come from the not really punctual electron beam), and therefore of a metallic nature (i.e., Ag° particles). These results also confirm the presence of silver in the phosphate calcium phases for the lowest heat treatment temperatures. Areas 1 and 4 indicate the presence of small amounts of silver, in combination with large amounts of calcium and phosphor at 400 °C, corresponding to an Ag+:doped HAp phase. This is no longer true at 700 °C, where the calcium and phosphorus elements are completely separated from the silver element; area 5 in sample 25Ag-700 is only composed of Ca and P corresponding to undoped calcium phosphate compounds (Figure 7 and Table 2).
4. Discussion
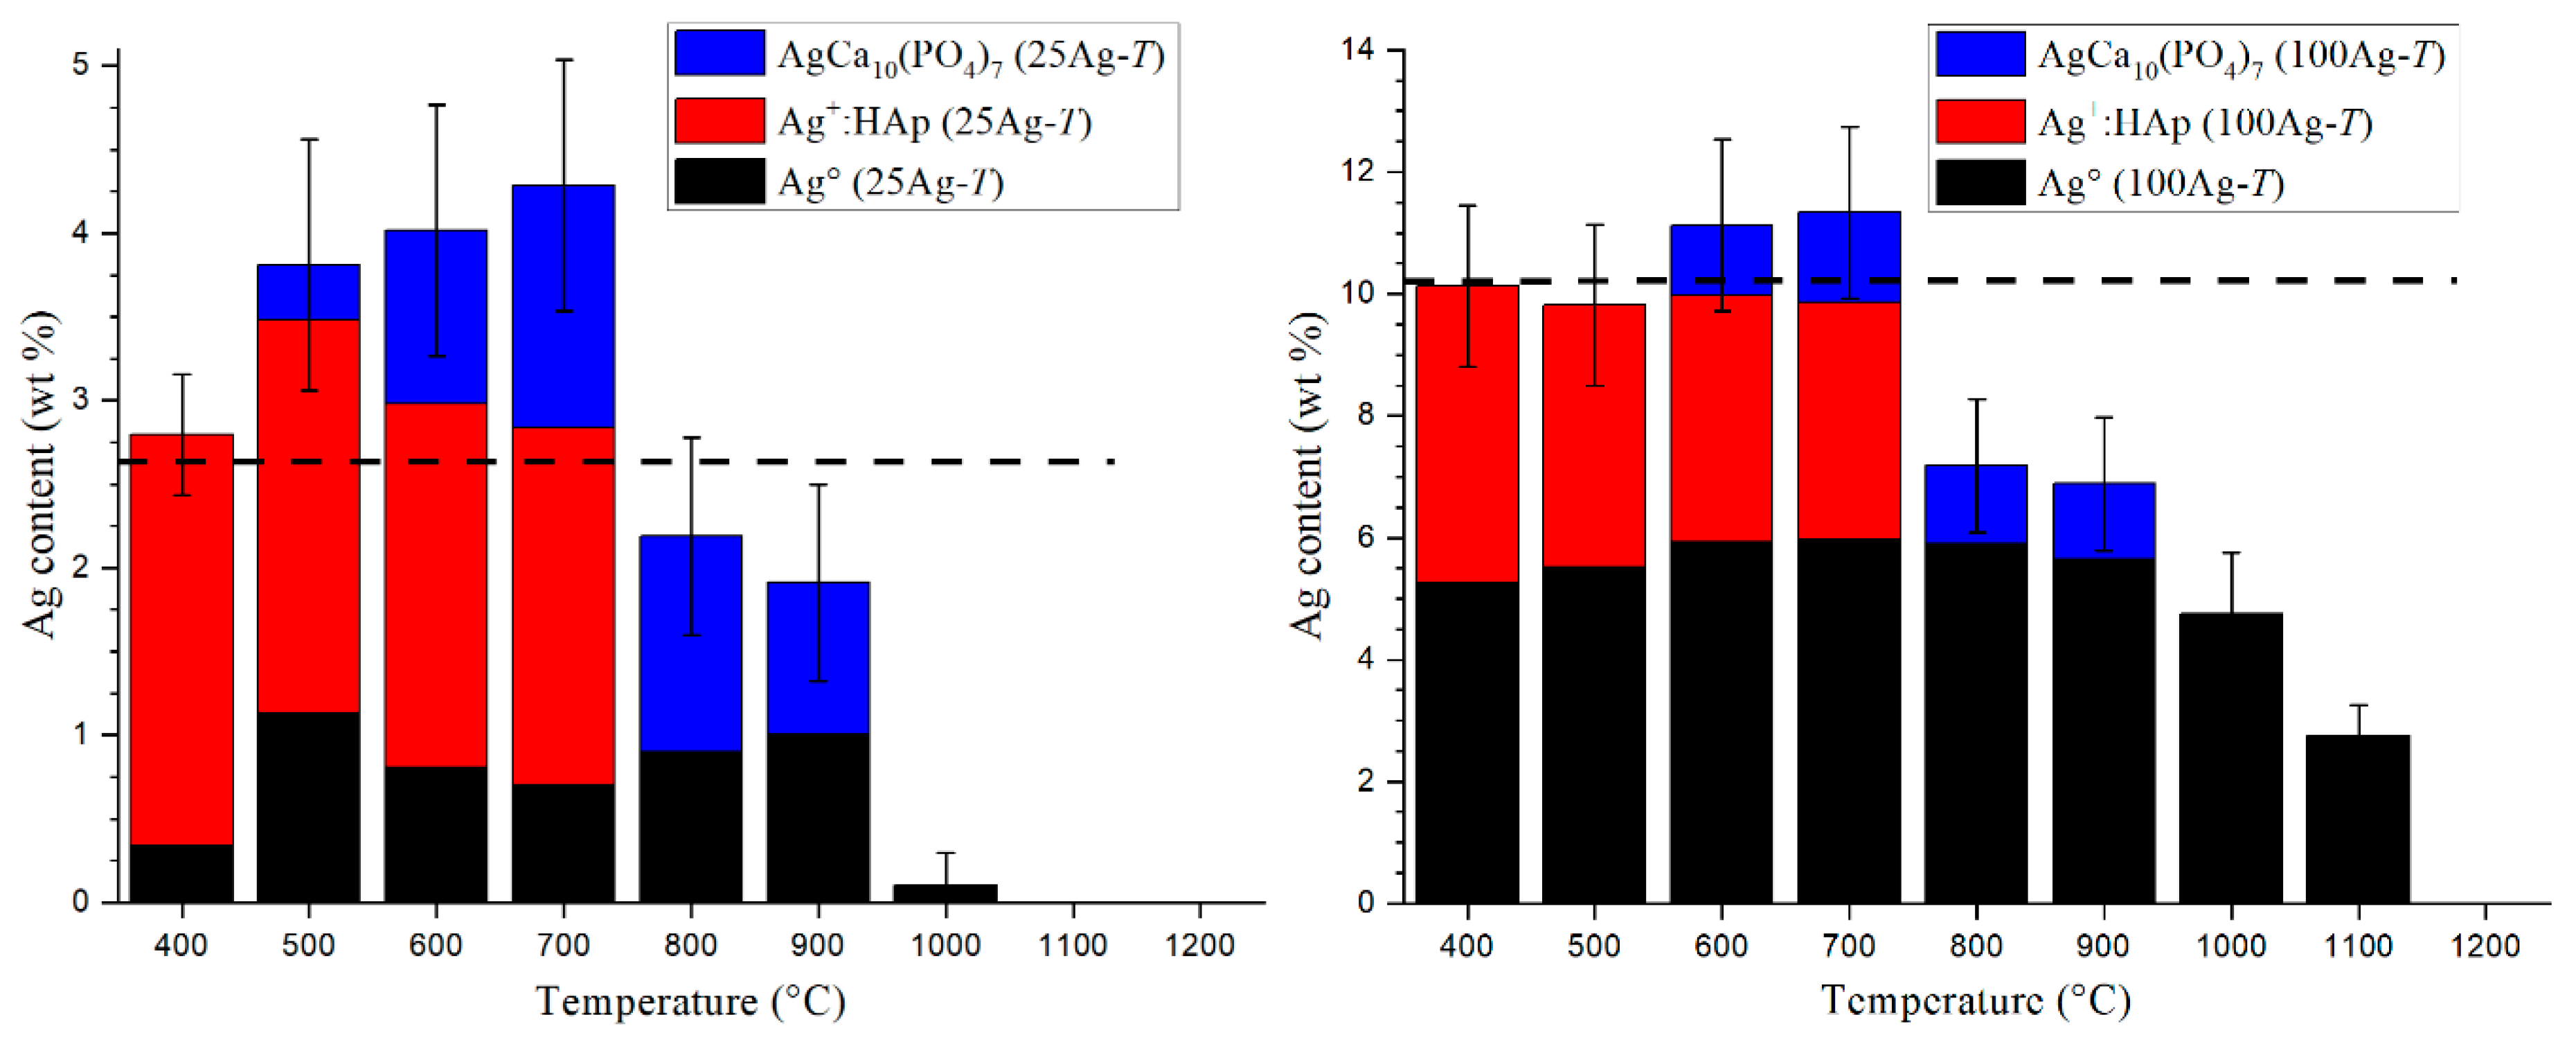
The results presented above evidence three distinct locations for silver atoms in the synthesized BCP samples, including two distinct chemical states (metallic and ionic). A part of the introduced silver cations is found in the metallic state, in the form of nanoparticles, already present at 400 °C. The remainder is in the cationic form in substitution for calcium cations, either in the HAp phase (at low temperatures: from 400 °C to 600 °C) or in the TCP phase (at the following temperatures and up to 1000 °C). From 1000 °C silver leaves the samples, especially because of the melting point of Ag° (962 °C). The cumulative amounts of located silver atoms are shown in Figure 8 for both the 25Ag-T and 100Ag-T doped series. It appears that calculations for the lowest (400 °C) temperature are in good agreement with the nominal introduced amounts (i.e., 2.67 wt % for the 25Ag-T series and 10.22 wt % for the 100Ag-T series). We then observe an overestimation of the silver content up to 600 °C, before seeing it start to plummet at 700 °C. These fluctuations around the expected values indicate that the amount of silver in the HAp phase is overestimated above 500 °C, and conversely the amount of silver in substitution in β-TCP is certainly underestimated from 800 °C upwards.
Nanoparticles of metallic silver therefore formed very quickly in our samples by the autogenous reduction of silver nitrate. The set of samples can thus be considered as an Ag°/BCP composite. However, at low temperatures, we also observe the formation of a silver-doped Ag+: HAp phase whose composition is close to the nominal composition (i.e., Ca9.75Ag0.25(PO4)6(OH)1.75 for the 25Ag-T series and Ca9Ag1(PO4)6(OH) for the 100Ag-T series). Beyond 400 °C, this doped Ag+: HAp phase persists while gradually lowering its doping element content. The drop in the doping rate was notably predictable by observing the variations in the HAp lattice parameters between 400 °C and 700 °C (Figure 3). Both a and c lattice parameters of the Ag+: HAp phase are vastly superior to those from the undoped series at 400 °C. This difference fades at 500 °C and disappears at 700 °C. SEM analyses confirmed the presence of dopant in the calcium phosphate phase at 400 °C, followed by its exclusion at 700°C. Concomitantly, cationic Ag+ substitutes calcium cations into the β-TCP phase, which stabilizes around 700 °C. First, the AgCa10(PO4)7 definite compound is formed; it is distinguishable from the undoped β-TCP phase thanks to the smaller c lattice parameter (Figure 4). The underestimation of silver content from 800 °C upwards suggests that the Ag+ amount in the TCP phase continues to increase; however, no experimental proof has been brought to support this.
The characterization of the doped Ag+: HAp phase with increased lattice parameters, by comparison with an undoped HAp lattice, has already been reported in the literature. This is notably the case in the study of Geng et al. [32], where the Ca10−xAg2x(PO4)6(OH)2 doped composition was considered. This nominal composition suggests two kinds of doping mechanisms: only half of the silver cations (x value) can substitute calcium cations into the Ca1 or Ca2 crystallographic sites of the HAp crystal structure. The second half of silver cations (to reach the 2x doping level) must be located at interstitial sites. Our crystallographic study, based on Rietveld refinement, did not enable us to highlight the presence of silver cations at interstitial crystallographic sites, not to mention that this situation is not preponderant for large cations like Ag+. For these reasons we preferred to note the chemical composition of the doped Ag+: HAp phase as follows: Ca10−xAgx(PO4)6(OH)2−x, in which only the substitution mechanism was considered in agreement with the paper by Badrour et al. [61]. However, we must admit that our Rietveld refinements did not make it possible to clearly quantify the silver substitution rates at both the Ca1 and Ca2 crystallographic sites in the HAp structure.
5. Conclusions
During the past decade, several studies have been devoted to silver incorporation in HAp (or BCP) samples due to their high potential for biomaterial applications, namely because of the well-known bactericide properties of silver. Unanimously, the results have shown a very interesting bactericidal effect following the doping of calcium phosphates with silver. However, the material aspect of the samples studied in the literature showed some disparities, in particular due to a lack of understanding of the doping mechanism. Some works mention metallic silver nanoparticles; others focus on cationic substitution in phosphate phases. The results presented in the present paper are especially devoted to the description of the mechanism by which silver is incorporated into BCP samples. This work follows the experience previously acquired on the BCP doping mechanism of the first-row transition elements. It appears that both electronic states are simultaneously present in the silver-doped samples: metallic Ag° and cationic Ag+. Synthesized samples are composites comprising closely-mixed Ag° nanoparticles and Ag+: doped calcium phosphate phases. At the lowest temperature (400 °C), it is the HAp phase which presents a silver-to-calcium substitution leading to the doped Ca10−xAgx(PO4)6(OH)2−x compounds. Then, by increasing the temperature (above 600 °C) the Ag+ cations migrate to the β-TCP phase to form the definite Ca10Ag(PO4)7 compound corresponding to Ca3−xAg2x(PO4)2 with x = 0.143 (i.e., Ca2.857Ag0.286(PO4)2). Finally, the composite aspect of the prepared samples disappears above 1000 °C because of the relatively low melting point of silver (962 °C). In the light of these results, it appears important for the study of biological properties to distinguish the behavior in biological conditions of metallic silver nanoparticles from that of substituted cationic Ag+, particularly in terms of bactericidal power and release rate/kinetics in the human body.
Supplementary Materials
The following are available online at https://0-www-mdpi-com.brum.beds.ac.uk/2073-4352/9/7/326/s1, Figure S1: Rietveld plot (conventional Rietveld agreement factors: Rp = 0.048, Rwp = 0.053, χ2 = 2.26) of the powder pattern of the 25Ag-600 sample with experimental data (red circles), simulated pattern (black line), difference curve (blue line) and Bragg peak position for the six phases present: HAp, Ag°, β-TCP, CDP, CaO and CaCO3. Table S1: HAp structural parameters refined by Rietveld analyses on the 27 samples; standard deviations are indicated in brackets. Table S2: TCP lattice parameters refined by Rietveld analyses on the 27 samples; standard deviations are indicated in brackets.
Author Contributions
Conceptualization, G.R. and A.J.; methodology, G.R. and A.J.; software, G.R. and A.J.; validation, G.R. and A.J.; formal analysis, G.R., A.J., M.G. and A.D.; investigation, G.R., A.J., M.G. and A.D.; resources, G.R., A.J., M.G. and A.D.; data curation, G.R., A.J., M.G. and A.D.; writing-original draft preparation, G.R.; writing—review and editing, G.R.; visualization, G.R.; supervision, G.R.; project administration, G.R.”, please turn to the CRediT taxonomy for the term explanation.
Acknowledgments
The authors warmly thank Anne-Marie Gelineau for the electron microscopy performed at 2MATech–Clermont-Ferrand, a few days before her retirement. Reviewers and guest editor, Francesco Capitelli, are also grateful for their questions and comments that have improved the content and understanding if this paper.
Conflicts of Interest
The authors declare no conflict of interest.
References
- Dorozhkin, S.V. Biocomposites and hybrid biomaterials based on calcium orthophosphates. Biomaterials 2011, 1, 3–56. [Google Scholar] [Green Version]
- Dahl, S.G.; Allain, P.; Marie, P.J.; Mauras, Y.; Boivin, G.; Ammann, P.; Tsouderos, Y.; Delmas, P.D.; Christiansen, C. Incorporation and distribution of strontium in bone. Bone 2001, 8, 446–453. [Google Scholar] [CrossRef]
- Lagier, R.; Baud, C.A. Magnesium whitlockite, a calcium phosphate crystal of special interest in pathology. Pathol. Res. Pract. 2003, 199, 329–335. [Google Scholar] [CrossRef] [PubMed]
- Lee, R.S.; Kayser, M.V.; Ali, S.Y. Calcium phosphate microcrystal deposition in the human intervertebral disc. J. Anat. 2006, 208, 13–19. [Google Scholar] [CrossRef] [PubMed]
- Rey, C.; Combes, C.; Drouet, C.; Glimcher, M.J. Bone mineral: Update on chemical composition and structure. Osteoporos. Int. 2009, 20, 1013–1021. [Google Scholar] [CrossRef] [PubMed]
- Cazalbou, S.; Combes, C.; Eichert, D.; Rey, C. Adaptative physico-chemistry of bio-related calcium phosphates. J. Mater. Chem. 2004, 14, 2148–2153. [Google Scholar] [CrossRef]
- Elliot, J.C. Structure and Chemistry of the Apatite and Other Calcium Orthophosphates; Elsevier: Amsterdam, The Netherlands, 1994. [Google Scholar]
- Turkoz, M.; Atilla, A.O.; Evis, Z. Silver and fluoride doped hydroxyapatite: Investigation by microstructure, mechanical and antibacterial properties. Ceram. Int. 2013, 39, 8925–8931. [Google Scholar] [CrossRef]
- Diaz, M.; Zia, R.; Sameemi, F.; Ikram, H.; Bashir, F. In vitro antimicrobial activity of ZnO based glass-ceramics against pathogenic bacteria. J. Mater. Sci. Mater. Med. 2015, 26, 268. [Google Scholar]
- Khan, M.S.; ur Rehman, S.; Ali, M.A.; Sultan, B.; Sultan, S. Infection in orthopedic implant surgery, its risk factors and outcome. J. Ayub Med. Coll. Abbottabad 2008, 20, 23–25. [Google Scholar]
- Cremet, L.; Corvec, S.; Bemer, P.; Bret, L.; Lebrun, C.; Lesimple, B.; Miegeville, A.F.; Reynaud, A.; Lepelletier, D.; Caroff, N. Orthopaedic-implant infection by Escherichia coli: Molecular and phenotypic analysis of the causative strains. J. Infect. 2012, 64, 169–175. [Google Scholar] [CrossRef]
- Salwiczek, M.; Qu, Y.; Gardiner, J.; Strugnell, R.A.; Lithgow, T.; McLean, K.M.; Thissen, H. Emerging rules for effective antimicrobial coatings. Trends Biotechnol. 2014, 32, 82–90. [Google Scholar] [CrossRef] [PubMed]
- Nasser, S. Prevention and treatment of sepsis in total hip replacement surgery. Orthop. Clin. N. Am. 1992, 23, 265–277. [Google Scholar]
- Li, P.L.; Zamora, J.; Bentley, G. The results at ten years of the Insall-Burstein II total knee replacement: Clinical, radiological and survivorship studies. J. Bone Joint Surg. Br. 1999, 81, 647–653. [Google Scholar] [CrossRef] [PubMed]
- Hendriks, J.G.E.; van Horn, J.R.; van der Mei, H.C.; Busscher, H.J. Background of antibiotic-loaded bone cement and prosthesis-related infection. Biomaterials 2004, 25, 545–556. [Google Scholar] [CrossRef]
- Fan, J.C.H.; Hung, H.H.; Fung, K.Y. Infection in primary total knee replacement. Hong Kong Med. J. 2008, 14, 40–45. [Google Scholar] [PubMed]
- Sygnatowicz, M.; Keyshar, K.; Tiwari, A. Antimicrobial properties of silver-doped hydroxyapatite nano-powders and thin films. Biol. Biomed. Mater. 2010, 62, 65–70. [Google Scholar] [CrossRef]
- Rauschmann, M.A.; Wichelhaus, T.A.; Stirnal, V.; Dingeldein, E.; Zichner, L.; Schnettler, R.; Alt, V. Nanocrystalline hydroxyapatite and calcium sulphate as biodegradable composite carrier material for local delivery of antibiotic in bone infections. Biomaterials 2005, 26, 2677–2684. [Google Scholar] [CrossRef]
- Baradari, H.; Damia, C.; Dutreih-Colas, M.; Laborde, E.; Pecout, N.; Champion, E.; Chulia, D.; Viana, M. Calcium phosphate porous pellets as drug delivery systems: Effect of drug carrier composition on drug loading and in vitro release. J. Eur. Ceram. Soc. 2012, 32, 2679–2690. [Google Scholar] [CrossRef]
- Clement, J.L.; Jarrett, P.S. Antibacterial silver. Metal. Based Drugs 1994, 1, 467–482. [Google Scholar] [CrossRef]
- Marambio-Jones, C.; Hoek, E.M.V. A review of the antibacterial effects of silver nanomaterials and potential implications for human health and the environment. J. Nano Res. 2010, 12, 1531–1551. [Google Scholar] [CrossRef]
- Iqbal, N.; Kadir, A.R.M.; Malek, N.N.A.N.; Mahmood, H.N.; Murali, R.M.; Kamarul, T. Rapid microwave assisted synthesis and characterization of nanosized silver-doped hydroxyapatite with antibacterial properties. Mater. Lett. 2012, 89, 118–122. [Google Scholar] [CrossRef]
- Ning, C.; Wang, X.; Li, L.; Zhu, Y.; Li, M.; Yu, P.; Zhou, L.; Zhou, Z.; Chen, J.; Tan, G.; et al. Concentration ranges of antibacterial cations for showing the highest antibacterial efficacy but the least cytotoxicity against mammalian cells: Implications for a new antibacterial mechanism. Chem. Res. Toxicol. 2015, 28, 1815–1822. [Google Scholar] [CrossRef] [PubMed]
- Kim, T.N.; Feng, Q.L.; Kim, J.O.; Wu, J.; Wang, H.; Chen, G.C.; Cui, F.Z. Antimicrobial effects of metal ions (Ag+, Cu2+, Zn2+) in hydroxyapatite. J. Mater. Sci. Mater. Med. 1998, 8, 129–134. [Google Scholar] [CrossRef]
- Feng, Q.L.; Wu, J.; Chen, G.Q.; Cui, F.Z.; Kim, T.N. A mechanistic study of the antibacterial effect of silver ions on Escherichia coli and staphylococcus aureus. J. Biomed. Mater. Res. 2000, 52, 662–668. [Google Scholar] [CrossRef]
- Rameshbabu, N.; Sampath Kumar, T.S.; Prabhakar, T.G.; Sastry, V.S.; Murty, K.V.G.K.; Prasad Rao, K. Antibacterial nanosized silver substituted hydroxyapatite: Synthesis and characterization. J. Biomed. Mater. Res. A 2007, 80, 581–591. [Google Scholar] [CrossRef] [PubMed]
- Klasen, H.J. Historical review of the use of silver in the treatment of burns: I. Early uses. Burns 2000, 26, 117–130. [Google Scholar] [CrossRef]
- Gosheger, G.; Hardes, J.; Ahrens, H.; Streitburger, A.; Buerger, H.; Erren, M.; Gunsel, A.; Kemper, F.H.; Winkelmann, W.; von Eiff, C. Silver-coated megaendoprostheses in a rabbit model—An analysis of the infection rate and toxicological side effects. Biomaterials 2004, 25, 5547–5556. [Google Scholar] [CrossRef] [PubMed]
- Ciobanu, C.S.; Iconaru, S.L.; Pasuk, I.; Vasile, B.S.; Lupu, A.R.; Hermenean, A.; Dinischiotu, A.; Predoi, D. Structural properties of silver doped hydroxyapatite and their biocompatibility. Mater. Sci. Eng. C 2013, 33, 1395–1402. [Google Scholar] [CrossRef]
- Jadalannagari, S.; Deshmukh, K.; Ramanan, S.R.; Kowshik, M. Antimicrobial activity of hemocompatible silver doped hydroxyapatite nanoparticles synthesized by modified sol-gel technique. Appl. Nanosci. 2014, 4, 133–141. [Google Scholar] [CrossRef]
- Fu, C.; Zhang, X.; Savino, K.; Gabrys, P.; Gao, Y.; Chaimayo, W.; Miller, B.L.; Yates, M.Z. Antimicrobial silver-hydroxyapatite composite coating through two-stage electrochemical synthesis. Surf. Coat. Technol. 2016, 301, 13–19. [Google Scholar] [CrossRef]
- Geng, Z.; Cui, Z.; Li, Z.; Zhu, S.; Liang, Y.; Liu, Y.; He, X.; Yu, X.; Wang, R.; Yang, W. Strontium incorporation to optimize the antibacterial and biological characteristics of silver-substituted hydroxyapatite coating. Mater. Sci. Eng. C 2016, 58, 467–477. [Google Scholar] [CrossRef] [PubMed]
- Gokcekaya, O.; Webster, T.J.; Ueda, K.; Narushima, T.; Ergun, C. In vitro performance of Ag-incorporated hydroxyapatite and its adhesive porous coating deposited by electrostatic spaying. Mater. Sci. Eng. C 2017, 77, 556–564. [Google Scholar] [CrossRef] [PubMed]
- Wang, J.; Gong, X.; Hai, J.; Li, T. Synthesis of silver-hydroxyapatite composite with improved antibacterial properties. Vacuum 2018, 152, 132–137. [Google Scholar] [CrossRef]
- Riaz, M.; Zia, R.; Ijaz, A.; Hussain, T.; Mohsin, M.; Malik, A. Synthesis of monophasic Ag doped hydroxyapatite and evaluation of antibacterial activity. Mater. Sci. Eng. C 2018, 90, 308–313. [Google Scholar] [CrossRef] [PubMed]
- Dubnika, A.; Loca, D.; Rudovica, V.; Parekh, M.B.; Berzina-Cimdina, L. Functionalized silver-doped hydroxyapatite scaffolds for controlled simultaneous silver ion and drug delivery. Ceram. Int. 2017, 43, 3698–3705. [Google Scholar] [CrossRef]
- Zhang, X.; Chaimayo, W.; Yang, C.; Yao, J.; Miller, B.L.; Yates, M.Z. Silver-hydroxyapatite composite coatings with enhances antimicrobial activities through heat treatment. Surf. Coat. Technol. 2017, 325, 39–45. [Google Scholar] [CrossRef]
- Gokcekaya, O.; Ueda, K.; Narushima, T.; Ergun, C. Synthesis and characterization of Ag-containing calcium phosphates with various Ca/P ratios. Mater. Sci. Eng. C 2015, 53, 111–119. [Google Scholar] [CrossRef] [PubMed]
- Iqbal, N.; Kadir, M.R.A.; Mahmood, N.H.; Salim, N.; Froemming, G.R.A.; Balaji, H.R.; Kamarul, T. Characterization, antibacterial and in-vitro compatibility of zinc-silver doped hydroxyapatite nanoparticles prepared through microwave synthesis. Ceram. Int. 2014, 40, 4507–4513. [Google Scholar] [CrossRef]
- Kaygili, O.; Keser, S.; Dorozhkin, S.V.; Yakuphanoglu, F.; al-Ghamdi, A.A.; Kirbag, S.; Sertkaya, D.; Ates, T.; Gursoy, N.C. Structural and dielectrical properties of Ag- and Ba-substituted hydroxyapatites. J. Inorg. Organomet. Polym. 2014, 24, 1001–1008. [Google Scholar] [CrossRef]
- Liu, X.; Mou, Y.; Wu, S.; Man, H.C. Synthesis of silver-incorporated hydroxyapatite nanocomposites for antimicrobial implant coatings. Appl. Surf. Sci. 2013, 273, 748–757. [Google Scholar] [CrossRef]
- Chen, Y.; Zheng, X.; Xie, Y.; Ji, H.; Ding, C.; Li, H.; Dai, K. Silver release from silver-containing hydroxyapatite coatings. Surf. Coat. Technol. 2010, 205, 1892–1896. [Google Scholar] [CrossRef]
- Chen, W.; Oh, S.; Ong, A.P.; Oh, N.; Liu, Y.; Courtney, H.S.; Appleford, M.; Ong, J.L. Antibacterial and osteogenic properties of silver-containing hydroxyapatite coatings produced using sol-gel process. J. Biomed. Mater. Res. A 2007, 82, 899–906. [Google Scholar] [CrossRef] [PubMed]
- Vukomanovic, M.; Bracko, I.; Poljansek, I.; Uskokovic, D.; Skapin, S.D.; Suvorov, D. The growth of silver nanoparticles and their combination with hydroxyapatite to form composites via a sonochemical approach. Cryst. Growth Des. 2011, 11, 3802–3812. [Google Scholar] [CrossRef]
- Chen, W.; Liu, Y.; Courtney, H.S.; Bettenga, M.; Agrawal, C.M.; Bumgardner, J.D.; Ong, J.L. In vitro anti-bacterial and biological properties of magnetron co-sputtered silver-containing hydroxyapatite coating. Biomaterials 2006, 27, 5512–5517. [Google Scholar] [CrossRef] [PubMed]
- Feng, Q.L.; Kim, T.N.; Wu, J.; Park, E.S.; Kim, J.O.; Lim, D.Y.; Cui, F.Z. Antibacterial effects of Ag-HAp thin films on alumina substrates. Thin Solid Films 1998, 335, 214–219. [Google Scholar] [CrossRef]
- Shirkhanzadeh, M.; Azadegan, M.; Liu, G.Q. Bioactive delivery systems for the slow release of antibiotics: Incorporation of Ag+ ions into micro-porous hydroxyapatite coatings. Mater. Lett. 1995, 24, 7–12. [Google Scholar] [CrossRef]
- Renaudin, G.; Gomes, S.; Nedelec, J.-M. First-row transition metal doping in calcium phosphate bioceramics: A detailed crystallographic study. Materials 2017, 10, 92. [Google Scholar] [CrossRef]
- Gomes, S.; Nedelec, J.-M.; Renaudin, G. On the effect of temperature on the insertion of zinc into hydroxyapatite. Acta Biomater. 2012, 8, 1180–1189. [Google Scholar] [CrossRef] [Green Version]
- Gomes, S.; Kaur, A.; Nedelec, J.-M.; Renaudin, G. X-ray Absorption Spectroscopy shining (synchrotron) light onto the insertion of Zn2+ in calcium phosphate ceramics and its influence on their behaviour in biological conditions. J. Mater. Chem. B 2014, 2, 536–545. [Google Scholar] [CrossRef]
- Gomes, S.; Nedelec, J.-M.; Jallot, E.; Sheptyakov, D.; Renaudin, G. Unexpected mechanism of Zn2+ insertion in calcium phosphate bioceramics. Chem. Mat. 2011, 23, 3072–3085. [Google Scholar] [CrossRef]
- Gomes, S.; Kaur, A.; Grenèche, J.-M.; Nedelec, J.-M.; Renaudin, G. Atomic scale modeling of iron-doped biphasic calcium phosphate bioceramics. Acta Biomater. 2017, 50, 78–88. [Google Scholar] [CrossRef] [PubMed]
- Gomes, S.; Vichery, C.; Descamps, S.; Martinez, H.; Kaur, A.; Jacobs, A.; Nedelec, J.-M.; Renaudin, G. Cu-doping of calcium phosphate bioceramics: From mechanism to the control of cytotoxicity. Acta Biomater. 2018, 65, 462–474. [Google Scholar] [CrossRef] [PubMed]
- Rodriguez-Carvajal, J. PROGRAM FullProf.2k—Version 3.20; Laboratoire Léon Brillouin (CEA-CNRS): Saclay, France, 2005; FullProf.2k Manual; Available online: http://www-llb.cea.fr/fullweb/fp2k/fp2k_divers.htm (accessed on 24 June 2019).
- Strutynska, N.Y.; Zatovsky, I.V.; Ogorodnyk, I.V.; Slobodyanik, N.S. Rietveld refinement of AgCa10(PO4)7 from X-ray powder data. Acta Cryst. E 2013, 69, i23. [Google Scholar] [CrossRef] [PubMed]
- Yashima, M.; Sakai, A.; Kamiyama, T.; Hoshikawa, A. Crystal structure analysis of beta-tricalcium phosphate Ca3(PO4)2 by neutron powder diffraction. J. Sol. State Chem. 2003, 175, 272–277. [Google Scholar] [CrossRef]
- Owen, E.A.; Yates, E.L. Precision measurement of crystal parameters. Philos. Mag. 1933, 15, 472–488. [Google Scholar]
- Mocanu, A.; Furtos, G.; Rapuntean, S.; Horovitz, O.; Flore, C.; Garbo, C.; Danisteanu, A.; Rapuntean, G.; Prejmerean, C.; Tomoaia-Cotisel, M. Synthesis; characterization and antimicrobial effects of composites based on multi-substituted hydroxyapatite and silver nanoparticles. Appl. Surf. Sci. 2014, 298, 225–235. [Google Scholar] [CrossRef]
- Singh, B.; Dubey, A.K.; Kumar, S.; Saha, N.; Basu, B.; Gupta, R. In vitro biocompatibility and antimicrobial activity of wet chemically prepared Ca10−xAgx(PO4)6(OH)2 (0.0 ≤ x ≤ 0.5) hydroxyapatites. Mater. Sci. Eng. C 2011, 31, 1320–1329. [Google Scholar] [CrossRef]
- Shannon, R.D. Revised effective ionic radii and systematic studies of interatomic distances in halides and chalcogenides. Acta Cryst. A 1976, 32, 751–767. [Google Scholar] [CrossRef]
- Badrour, L.; Sadel, A.; Zahir, M.; Kimakh, L.; el Hajbi, A. Synthesis and physical and chemical characterization of Ca10−xAgx(PO4)6(OH)2−xx apatites. Ann. Chim. Sci. Mat. 1998, 23, 61–64. [Google Scholar] [CrossRef]
Figure 1.
Powder X-ray diffraction (PXRD) patterns from the 25Ag-T series. Scattering signals are mainly those from the hydroxyapatite (HAp) phase, and other phases are identified thanks to their intense diffraction peaks (*: Ag°, #: CaO, ¤: CaCO3, and $: tricalcium phosphate (β-TCP)).
Figure 1.
Powder X-ray diffraction (PXRD) patterns from the 25Ag-T series. Scattering signals are mainly those from the hydroxyapatite (HAp) phase, and other phases are identified thanks to their intense diffraction peaks (*: Ag°, #: CaO, ¤: CaCO3, and $: tricalcium phosphate (β-TCP)).

Figure 2.
Thermal variation in (a) the two main phase contents (squares: HAp; circles: TCP) from the biphasic calcium phosphates (BCP) samples and (b) the metallic silver amount (stars) for the undoped 0Ag-T series (black symbols), the 25Ag-T series (blue symbols), and 100Ag-T series (red symbols). Dotted lines indicate the nominal silver amounts, and lines are only guides for the eyes.

Figure 3.
Thermal variation in the HAp lattice parameters for the three series of samples. (Left): a (squares) and c (circles) hexagonal lattice parameters; (right): unit cell volume (stars). Lines are guides for the eyes only.
Figure 3.
Thermal variation in the HAp lattice parameters for the three series of samples. (Left): a (squares) and c (circles) hexagonal lattice parameters; (right): unit cell volume (stars). Lines are guides for the eyes only.

Figure 4.
Thermal variation in TCP lattice parameters for the three series of samples. (Left): a (squares) and c (circles) trigonal lattice parameters; (right): unit cell volume (stars). Lines are guides for the eyes only.
Figure 4.
Thermal variation in TCP lattice parameters for the three series of samples. (Left): a (squares) and c (circles) trigonal lattice parameters; (right): unit cell volume (stars). Lines are guides for the eyes only.

Figure 5.
Electron backscattered SEM images showing the metallic silver particles in the samples. (a) 25Ag-400; (b) 25Ag-700, and (c) 100Ag-700 samples using 1: ×500, 2: ×5000, and 3: ×20000 magnifications.
Figure 5.
Electron backscattered SEM images showing the metallic silver particles in the samples. (a) 25Ag-400; (b) 25Ag-700, and (c) 100Ag-700 samples using 1: ×500, 2: ×5000, and 3: ×20000 magnifications.

Figure 6.
Electron backscattered SEM photographs used for local elemental analyses (presented in Table 2) of the 25Ag-400 and 25Ag-700 samples.
Figure 6.
Electron backscattered SEM photographs used for local elemental analyses (presented in Table 2) of the 25Ag-400 and 25Ag-700 samples.

Figure 7.
Selected local EDS analyses (presented in Table 2) from zones ‘3’ and ‘4’ of the 25Ag-400 sample and from zone ‘5’ of the 25Ag-700 sample (shown in Figure 6).

Figure 8.
Cumulative silver amount taken from metallic Ag° (black), substituted HAp (red), and AgCa10(PO4)7 (or substituted TCP, blue) for the 25Ag-T series (left) and the 100Ag-T series (right). Dotted lines indicate the nominal silver amounts, and error bars correspond to cumulative standard deviation considering the three phases.


Table 1.
Quantitative phase analysis (wt %) of the 27 samples; standard deviations are indicated in brackets (CDP: Ca2P2O7 and ‘Eq. CaO’ considers both the CaO and CaCO3 amounts).
Table 1.
Quantitative phase analysis (wt %) of the 27 samples; standard deviations are indicated in brackets (CDP: Ca2P2O7 and ‘Eq. CaO’ considers both the CaO and CaCO3 amounts).
| Sample | Phase Composition (wt %) | ||||
|---|---|---|---|---|---|
| HAp | TCP | CDP | Eq. CaO | Ag° | |
| 0Ag-400 | 97.1 (2.0) | 2.9 (1.0) | / | / | / |
| 0Ag-500 | 94.8 (2.0) | 1.5 (0.5) | 2.1 (0.5) | 1.6 (0.5) | / |
| 0Ag-600 | 91.8 (2.0) | 3.3 (1.0) | 3.8 (1.0) | 1.2 (0.5) | / |
| 0Ag-700 | 85.8 (2.0) | 9.3 (1.0) | 3.1 (1.0) | 1.9 (0.5) | / |
| 0Ag-800 | 81.9 (2.0) | 16.0 (1.0) | / | 2.1 (0.5) | / |
| 0Ag-900 | 81.4 (2.0) | 16.7 (1.0) | / | 1.9 (0.5) | / |
| 0Ag-1000 | 85.8 (2.0) | 13.6 (1.0) | / | 0.6 (0.5) | / |
| 0Ag-1100 | 92.5 (2.0) | 7.1 (1.0) | / | 0.4 (0.2) | / |
| 0Ag-1200 | 96.0 (2.0) | 3.8 (1.0) | / | 0.2 (0.2) | / |
| 25Ag-400 | 92.7 (2.0) | 2.5 (0.5) | 3.1 (1.0) | 1.2 (0.5) | 0.3 (0.2) |
| 25Ag-500 | 88.5 (2.0) | 3.6 (1.0) | 4.1 (1.0) | 2.6 (0.5) | 1.1 (0.5) |
| 25Ag-600 | 81.9 (2.0) | 11.3 (1.0) | 3.5 (1.0) | 2.4 (0.5) | 0.8 (0.5) |
| 25Ag-700 | 80.4 (2.0) | 15.8 (1.0) | 1.1 (0.5) | 2.2 (0.5) | 0.7 (0.5) |
| 25Ag-800 | 82.9 (2.0) | 14.0 (1.0) | / | 2.2 (0.5) | 0.9 (0.5) |
| 25Ag-900 | 87.1 (2.0) | 19.9 (1.0) | / | 2.0 (0.5) | 1.0 (0.5) |
| 25Ag-1000 | 93.1 (2.0) | 5.3 (1.0) | / | 1.5 (0.5) | 0.1 (0.2) |
| 25Ag-1100 | 96.8 (2.0) | 2.0 (0.5) | / | 1.2 (0.5) | / |
| 25Ag-1200 | 99.0 (2.0) | 0.5 (0.2) | / | 0.5 (0.2) | / |
| 100Ag-400 | 92.3 (2.0) | / | / | 2.4 (0.5) | 5.3 (1.0) |
| 100Ag-500 | 81.4 (2.0) | 7.4 (1.0) | 2.3 (0.5) | 3.4 (1.0) | 5.5 (1.0) |
| 100Ag-600 | 76.8 (2.0) | 12.5 (1.0) | 1.8 (0.5) | 3.0 (1.0) | 5.9 (1.0) |
| 100Ag-700 | 73.8 (2.0) | 16.1 (1.0) | 1.0 (0.5) | 3.2 (1.0) | 6.0 (1.0) |
| 100Ag-800 | 77.3 (2.0) | 13.9 (1.0) | / | 2.9 (0.5) | 5.9 (1.0) |
| 100Ag-900 | 79.4 (2.0) | 13.5 (1.0) | / | 1.4 (0.5) | 5.6 (1.0) |
| 100Ag-1000 | 85.5 (2.0) | 8.7 (1.0) | / | 1.1 (0.5) | 4.8 (1.0) |
| 100Ag-1100 | 92.2 (2.0) | 4.7 (1.0) | / | 0.4 (0.2) | 2.8 (0.5) |
| 100Ag-1200 | 96.8 (2.0) | 3.0 (1.0) | / | 0.1 (0.2) | / |
Table 2.
Quantitative elemental analyses performed by EDS/SEM.
| Sample | Analysis | Atomic Composition (%) | Calculated Ratio | Expected Ratio | ||||
|---|---|---|---|---|---|---|---|---|
| Ca | Ag | P | Ag/Ca | Ca/P | Ag/Ca | Ca/P | ||
| 0Ag-400 | global | 65.63 | 0.00 | 34.37 | 0.00 | 1.91 | 0.00 | 1.67 |
| 0Ag-700 | global | 59.80 | 0.00 | 40.20 | 0.00 | 1.49 | ||
| 0Ag-1200 | global | 68.02 | 0.00 | 31.98 | 0.00 | 2.13 | ||
| 25Ag-400 | global | 66.47 | 2.17 | 31.37 | 0.03 | 2.12 | 0.03 | 1.62 |
| 25Ag-700 | global | 60.14 | 1.43 | 38.43 | 0.02 | 1.56 | ||
| 25Ag-1200 | global | 65.48 | 0.00 | 34.52 | 0.00 | 1.90 | ||
| 100Ag-400 | global | 62.39 | 3.94 | 33.68 | 0.06 | 1.85 | 0.11 | 1.50 |
| 100Ag-700 | global | 62.35 | 3.03 | 34.61 | 0.05 | 1.80 | ||
| 100Ag-1200 | global | 60.59 | 0.00 | 39.41 | 0.00 | 1.54 | ||
| 25Ag-400 (*) | local_1 local_2 local_3 local_4 | 65.21 40.26 7.40 64.25 | 1.24 24.64 89.95 1.39 | 33.55 35.11 2.65 34.36 | 0.019 n.c. (**) n.c. 0.022 | 1.94 n.c. n.c. 1.87 | 0.03 | 1.62 |
| 25Ag-700 (*) | local_5 | 63.88 | 0.00 | 36.12 | 0.00 | 1.77 | ||
(*) corresponding images are shown in Figure 6. (**) non-calculated ratio because the analyzed area did not correspond to a calcium phosphate.
© 2019 by the authors. Licensee MDPI, Basel, Switzerland. This article is an open access article distributed under the terms and conditions of the Creative Commons Attribution (CC BY) license (http://creativecommons.org/licenses/by/4.0/).
Share and Cite
MDPI and ACS Style
Jacobs, A.; Gaulier, M.; Duval, A.; Renaudin, G. Silver Doping Mechanism in Bioceramics—From Ag+:Doped HAp to Ag°/BCP Nanocomposite. Crystals 2019, 9, 326. https://0-doi-org.brum.beds.ac.uk/10.3390/cryst9070326
AMA Style
Jacobs A, Gaulier M, Duval A, Renaudin G. Silver Doping Mechanism in Bioceramics—From Ag+:Doped HAp to Ag°/BCP Nanocomposite. Crystals. 2019; 9(7):326. https://0-doi-org.brum.beds.ac.uk/10.3390/cryst9070326
Chicago/Turabian StyleJacobs, Aurélie, Morgane Gaulier, Alexis Duval, and Guillaume Renaudin. 2019. "Silver Doping Mechanism in Bioceramics—From Ag+:Doped HAp to Ag°/BCP Nanocomposite" Crystals 9, no. 7: 326. https://0-doi-org.brum.beds.ac.uk/10.3390/cryst9070326
Note that from the first issue of 2016, this journal uses article numbers instead of page numbers. See further details here.