Article

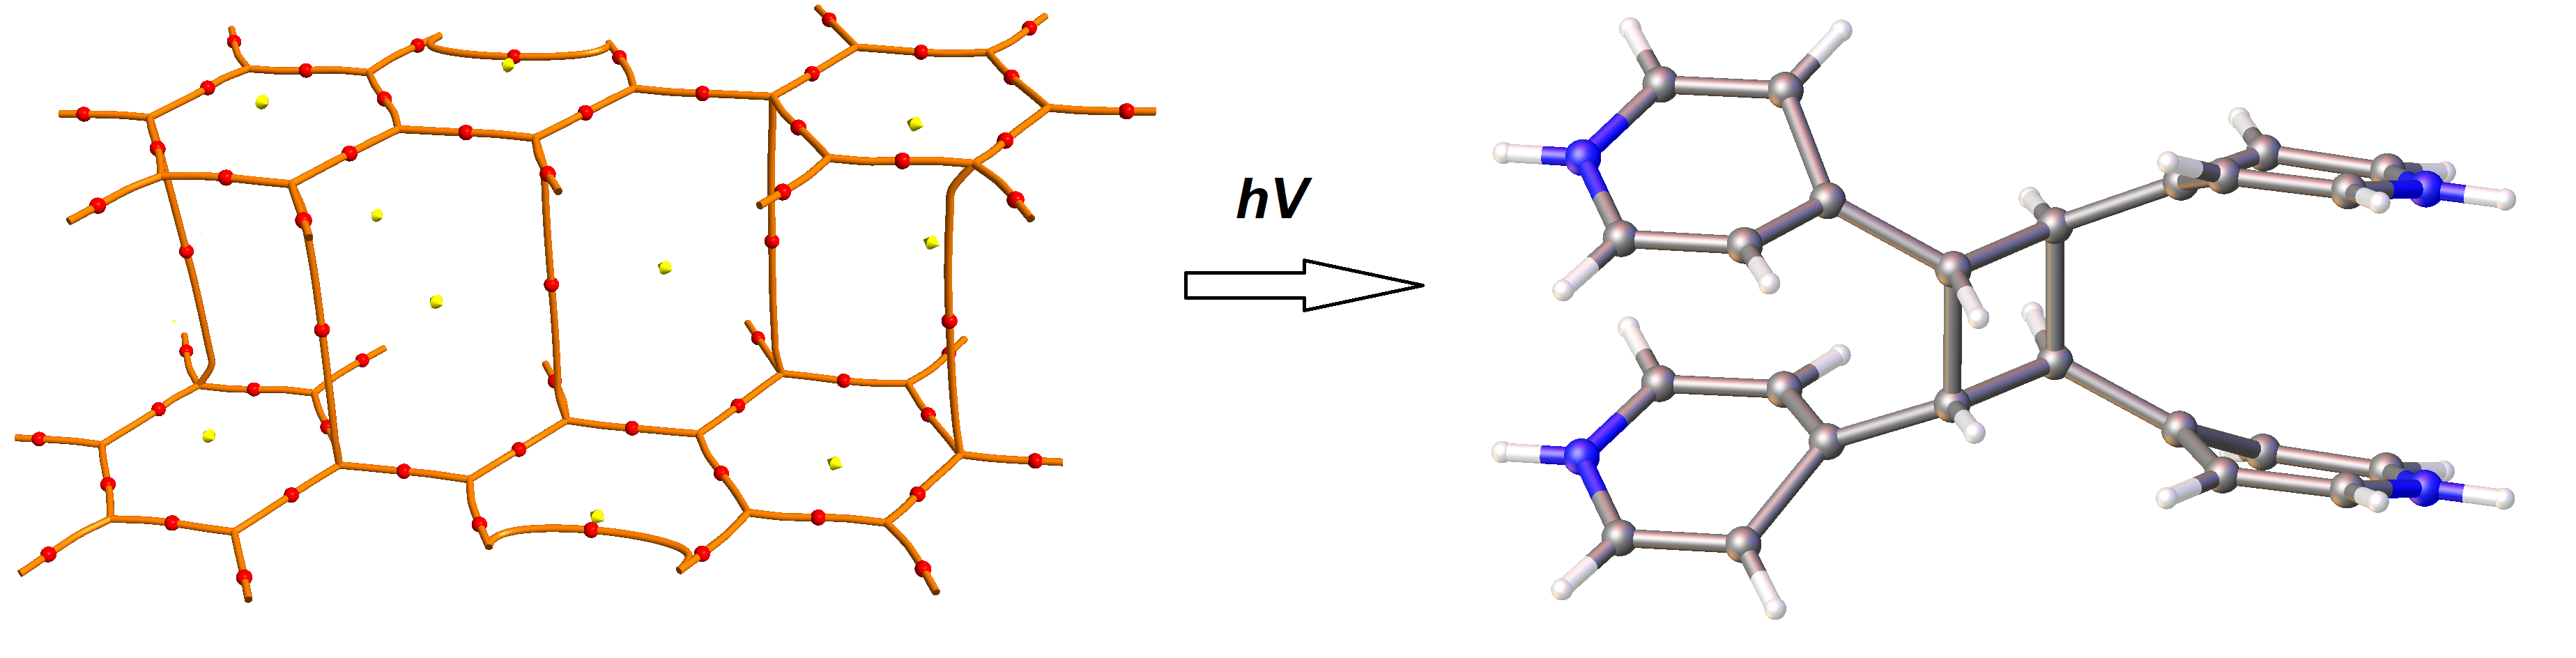
Solid-State Photoinitiated Cycloaddition Reaction of 4,4′-(Ethene-1,2-diyl)bis(pyridinium) Dinitrate: Charge-Density Perspective on Initial Stage of the Reaction

by
Anna V. Vologzhanina
1,*,
Dmitry Yu. Aleshin
1,
Alexander D. Volodin
1,
Anton V. Savchenkov
2,
Ivan E. Ushakov
1 and
Alexander A. Korlyukov
1
1
A. N. Nesmeyanov Institute of Organoelement Compounds, RAS. 28 Vavilova str. 119991 Moscow, Russia
2
Department of Inorganic Chemistry, Samara National Research University, 1 acad. Pavlova str., 443011 Samara, Russia
*
Author to whom correspondence should be addressed.
Submission received: 6 November 2019 / Revised: 20 November 2019 / Accepted: 21 November 2019 / Published: 23 November 2019

Abstract

:
Solid-state photoinitiated [2 + 2] cycloaddition reaction 2(H2bpe)(NO3)2 → (H4tpcb)(NO3)4 (bpe = 1,2-bis(pyrid-4-yl)ethylene; tpcb = 1,2,3,4-tetrakis(pyrid-4-yl)cyclobutane) was carried out in a single-crystal-to-single-crystal manner. The reaction product was characterized by means of X-ray diffraction and 1H NMR spectroscopy. Only the rctt-isomer of tpcb was found as the reaction product. Intermolecular interactions in a single crystal of (H2bpe)(NO3)2 were studied within the QTAIM approach. Although sum energy of strong and weak hydrogen bonds dominates in total packing energy, contribution of π…π stacking interactions to the packing energy is also prominent. At solid (H2bpe)(NO3)2, stacking of photoreactive H2bpe2+ cations is realized via N…C, C…C and C–H…C bonding, although no four-membered cycles formed by these bond paths was found in molecular graph representation. Reduced density gradient (RDG) surfaces and molecular Voronoi surfaces clearly demonstrate accumulation of charge density between olefin groups prone to take part in photoinitiated cycloaddition reactions. Good correlation between description of hydrogen bonding in terms of QTAIM and Voronoi approaches was demonstrated. The Voronoi approach confirmed that during the photoreaction the system of hydrogen bonds remained almost unchanged.

Graphical Abstract

1. Introduction

Solid-state photoinitiated cycloaddition reactions are a convenient single-step path to cyclobutane derivatives [1,2,3], photosensitive functional materials [4,5] and crystalline polymers [6,7,8]. In contrast with reactions that proceed in solutions, solid-state reactions do not require any solvents and catalysts and typically allow obtaining only one of stereoisomers. The possibility of a reaction to occur, and the structure of a reaction product depend on mutual disposition of reactive fragments that can be fixed in reactive positions with coordination bonds [9,10] and intermolecular interactions (hydrogen and halogen bonds, argentophilic interactions, etc.) [11,12]. One of the first documented examples of this effect was described by Schmidt [13]. He demonstrated that only two of three polymorphs of cinnamic acid are photoreactive, and reaction product, a α-truxillic acid or a β-truxillic acid can be obtained from, respectively, α and β polymorphs of cinnamic acid. He also demonstrated that the photocycloaddition typically occurs in solids with parallel disposition of olefin fragments situated at r < 4.2 Å. However, numerous exceptions from this rule [14,15,16] indicate that some additional criteria for the reaction to occur would be of practical meaning.
X-ray diffraction (XRD) is widely used to characterize the initial stage of such solid-state reactions, so that a conclusion about potential of a solid to take part in the reaction can be done. The reaction product can sometimes also be characterized by means of the XRD techniques, both after recrystallization or in the course of the single-crystal-to-single-crystal (SCSC) and single-crystal-to-powder processes. For SCSC reactions the structure of the product and reaction yield can be derived from X-ray data. High-resolution X-ray diffraction gives also opportunity to investigate peculiarities of intermolecular interactions and to derive experimental charge density distribution for crystalline solids. Berkovitch-Yellin and Leiserovits experimentally demonstrated on the example of butatrienes that photocycloaddition occurs only between π-overlapped molecules [17]. Thus, intermolecular interactions act as a path of charge redistribution in the course of solid-state reactions. However, more detailed charge density analysis of intermolecular bonding between olefin fragments in photoreactive solids is to our knowledge limited with experimental charge density analysis of trans-cinnamic acid and coumarin-3-carboxyllic acid [18] and periodic DFT calculations of two photoreactive zinc complexes [19]. It was demonstrated that photoreactive groups in these solids are connected by a bond path as concluded from analysis of charge density distribution in terms of R.F.W. Bader QTAIM theory [20]. Nevertheless, for neither the parallel, no criss-cross alignment of ethylene fragments any four-membered cycles formed by neighboring olefin fragments were observed. Instead, π…π stacking was supported by intermolecular bonding of aromatic fragments. Thus, charge distribution in other photosensitive solids is also of interest.
Herein we publish experimental charge density distribution and analysis of intermolecular bonding in monoclinic C polymorph of (H2bpe)(NO3)2 (1). For this compound three polymorphs were obtained to date: the triclinic [21], the monoclinic one crystallized at space group C 2/c [21,22] (denoted below as monoclinic C) and the monoclinic one crystallized at P 21/c space group (denoted below as monoclinic P) [23]. Only the monoclinic C polymorph was reported to undergo full conversion to (H4tpcb)(NO3)4 (2, tpcb = 1,2,3,4-tetrakis(pyrid-4-yl)cyclobutane) at irradiation [22]. Singh and Sun confirmed molecular structure of the reaction product using 1H NMR spectroscopy and solid-state XRD of the recrystallized 2. We succeeded to carry out the reaction in the SCSC manner, and to characterize reaction product 2 using X-ray diffraction.

2. Experimental Part

Initial compound (H2bpe)(NO3)2 (1) was obtained as described elsewhere [21]. 1H NMR spectrum of solution of 1 in NC-C[D3] after solid-state reaction was recorded on a Bruker Avance-300 spectrometer (Bruker AXS, Inc., Karlsruhe, Germany) at a frequency of 300 MHz without an external standard.

2.1. Synthesis

A single crystal of 1 was obtained from reaction mixture and characterized using single-crystal X-ray diffraction (XRD) as described below. Then the same single crystal was irradiated for two hours (Xe lamp, λ = 365 nm, 200 W source used at 40% of the full intensity) and characterized using single-crystal XRD technique. Solid sample 1 was additionally irradiated at similar conditions (room temperature, on air, 8 hours) and characterized using powder XRD before and after irradiation. The irradiated powder was studied with 1H NMR measurements.

2.2. Single-Crystal X-ray Diffraction

The X-ray diffraction data were collected at 100 K on a Bruker Apex II Duo diffractometer (Bruker AXS, Inc. Madison, WI, USA) equipped with an Oxford Cryostream cooling unit and a graphite monochromated Mo anode (λ = 0.71073 Å).
Independent atom model (IAM) refinement. Crystal structures were solved using the SHELXT [24] program and refined with SHELXL [25] using OLEX2 (OlexSys Ltd., Durham, UK) [26] software using a full-matrix least-square procedure based on F2. The H(N), H2 and H4 atoms were located on difference Fourier maps, positions of other H(C) atoms were calculated. All hydrogen atoms were refined isotropically with Uiso(H) = 1.2Ueq(X). The position of the H1(N1) atom was freely refined, and positions of H2(C2) and H4(C4) atoms in salt 2 were refined using DFIX instruction. The structure of 1 was the same as the one described elsewhere [21,22]. After irradiation, the space group of the single crystal remained unchanged, however, crystal parameters similar with 1 were observed for I 2/a space group settings. We used this space group (Table 1) to simplify comparison of unit cells of 1 and 2. Besides, after irradiation the residual density peaks indicated presence of the C6 atom disordered over three positions corresponding to H2bpe2+ and H4tpcb4+ cations. Free refinement of major and minor position occupancies gives the ratio H2bpe2+:H4tpcb4+ = 0.87:0.13, but in the final refinement corresponding values were fixed at 0.9:0.1. Positions of the C3 atoms were also disordered using the same occupancies. Atoms C3A, C3B and C3 were refined in isotropic approximation. EADP instructions were used for refinement of disordered carbon atoms. Experimental details and convergence factors are listed in Table 1, asymmetric units of 1 and 2 are depicted on Figure 1.
Multipole refinement. The charge distribution for a single crystal of 1 was obtained by applying the multipole formalism [27] as implemented in the XD package [28] with the core and valence electron density derived from wave functions fitted to a relativistic Dirac-Fock solution. For refinement, all data were truncated to sin(θ)/λ > 1.1Å. In the first step, the scale factor was refined on all data. After that a high-order refinement (sin(θ)/λ > 0.6Å) of atomic positions and atomic displacement parameters of all non-hydrogen atoms was employed followed by refinement of hydrogen atoms positions, with the C–H and N–H distances fixed at values taken from neutron diffraction [29]. Then, the atomic displacement parameters for hydrogen atom were estimated using the SHADE3 program [30]. All multipoles were refined for the non-hydrogen atoms. For the hydrogen atoms, only the monopole and the dipole populations in the bond directions were refined. κ and κ’ were kept fixed to the theoretical values for the H atoms [31]. Individual κ and κ’ parameters were refined for the nitrogen atoms of the pyridine and nitrate moieties and for the several carbon atoms (for example ipso-atoms of the Ph rings). In total, 8 κ parameters were utilized. At the final stage of refinement, all multipole parameters, positions and thermal parameters of all non-hydrogen atoms and monopoles were refined. All bonded pairs of atoms satisfy the Hirshfeld criterion. Parameters of experiment and refinement are listed in Table 1. To evaluate the quality of the model, the residual electron density maps, analysis of the residual density according to Meindl and Henn [32] and the DRK-plot [33] obtained via the WinGX suite [34] are given and discussed in the Supplementary Materials.

3. Results and Discussion

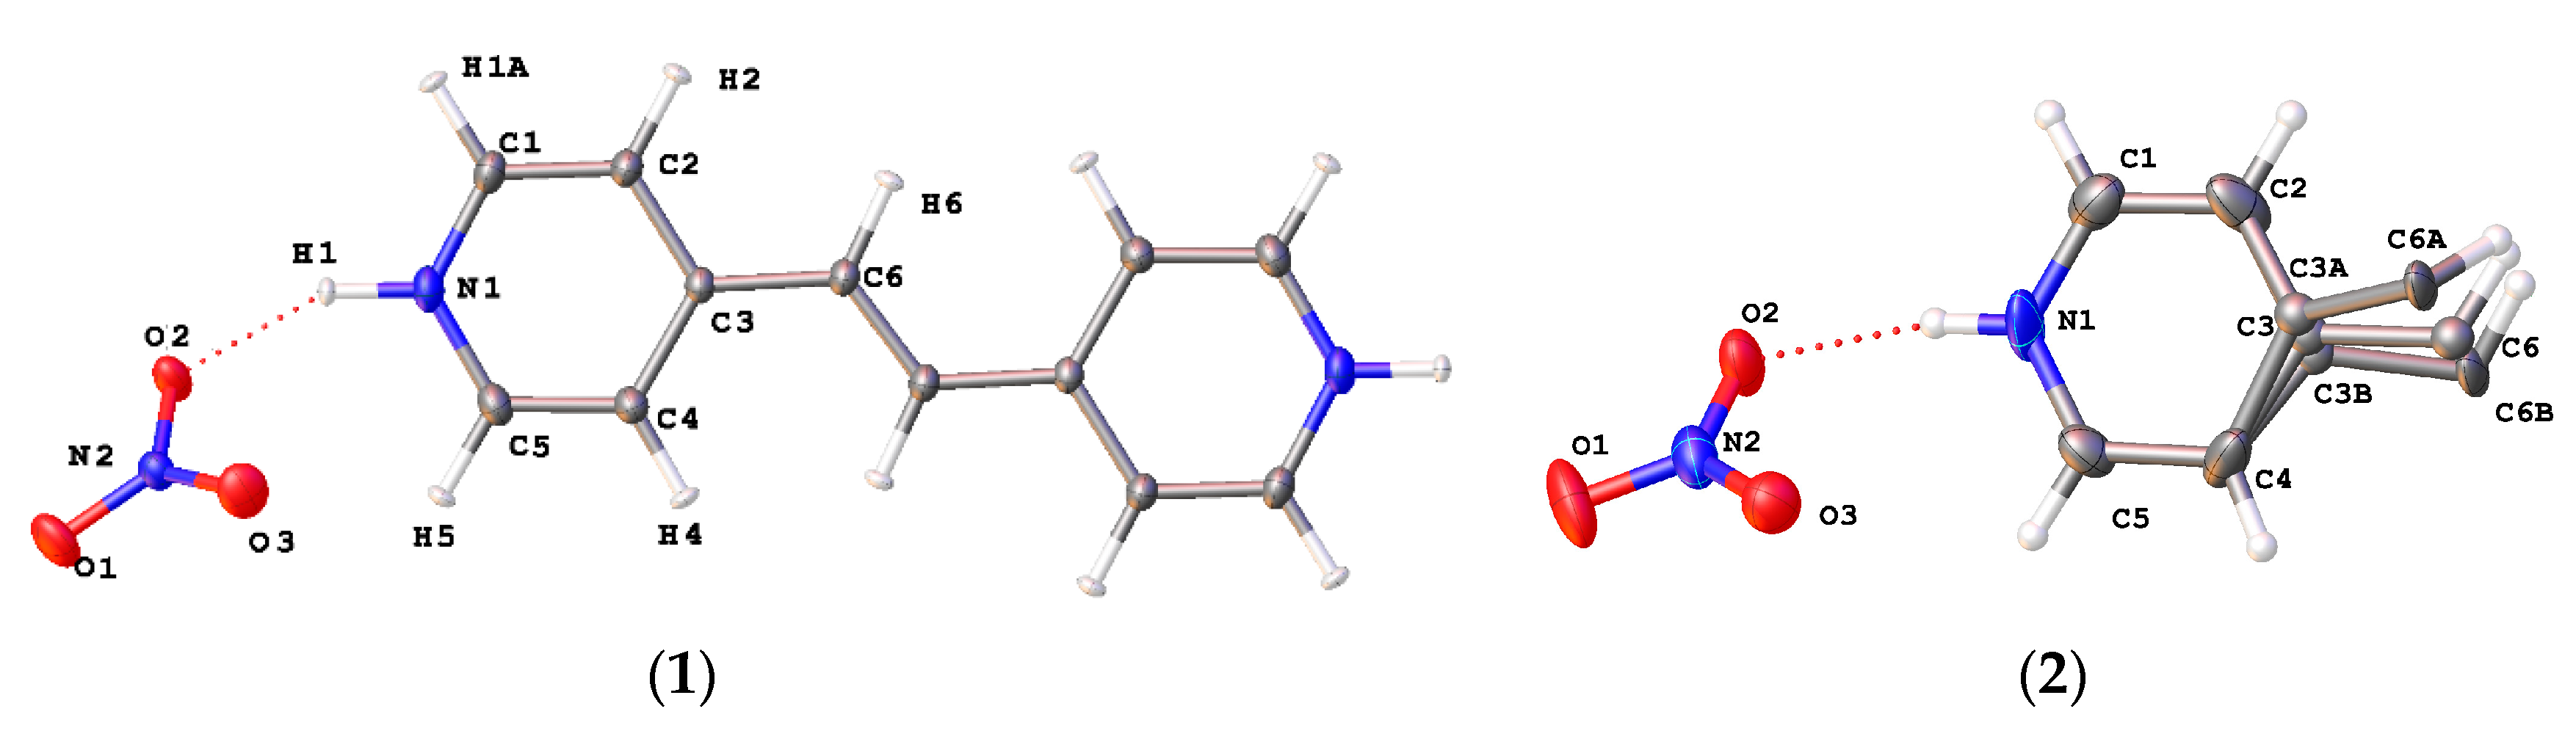
3.1. Solid-State Potocycloaddition Reaction 1 → 2

As we mentioned above, salt 1 has three polymorphs X-rayed to date. All compounds have nearly planar H2bpe2+ cations, contain only half of the cation and half of the anion in the asymmetric unit, and their crystal packings demonstrate various combinations of strong N–H…O, weak C–H…O hydrogen bonds and π…π interactions. For all polymorphs the former interactions are expected to be the strongest, and in each solid H2bpe2+ cations interact with two anions via N–H…O H-bonds characterized with r(N…O) distances as short as 2.73–2.76 Å. However, in the crystal of the monoclinic C polymorph infinite chain motifs formed by strong hydrogen bonds can be found, while two other polymorphs contain discrete N–H…O bonded architectures (Figure 2).
The role of other interactions and differences in crystal packing of the polymorphs can be visualized using the Crystal Packing Similarity tool of the Mercury package [35] as described in Refs. [36,37]. On Figure 3 the triclinic (green) and the monoclinic P (blue) polymorphs were compared with the monoclinic C (red) one. It is clearly seen that both monoclinic polymorphs form stacks of cations via π…π interactions (Figure 3b), but these stacks are packed in different ways due to various sets of C–H…O and N–H…O bonds between cations and anions. However, one can expect that the monoclinic P polymorph should be photo-sensitive due to similar disposition of olefin fragments with that in the photo-reactive monoclinic C polymorph. In the triclinic polymorph, the stacks of cations are separated by anions, thus, it should be photoinert.
After irradiation of the single crystal of the monoclinic C polymorph of 1, the volume of the unit cell increased. This increase should be accounted for elongation of the a unit cell parameter, while b and c parameters shortened. Moreover, similar crystal parameters could be found only when the I 2/a settings of the space group was taken for the reaction product. This change can also be demonstrated from powder XRD data, where significant redistribution in intensities of reflections was observed (Figure S6, Electronic Supporting Information). Quality of the single crystal decreased after irradiation, however it was good enough to derive crystal structure of the reaction product. On the first stage of refinement, two residual density peaks corresponding to a cyclobutane ring were located from difference Fourier maps. Free refinement of their occupancies gives occupancy value 0.44(1) indicating the presence of some unreacted molecules. Indeed, on the next step of refinement a residual density peak corresponding to unreacted cations was located. Free refinement of its’ occupancy gives 0.13(1), but for the final refinement the values of occupancies for a disordered cyclobutane ring (C6A and C6B atoms on Figure 1b) and ethylene group (C6 atom) were fixed at 0.45:0.45:0.10, and composition of this salt was assumed to be (H4tpcb)0.9(H2bpe)0.2(NO3)4 (2). The unit cell volume that goes to one formula unit is equal to 670 Å3. Corresponding value for pure (H4tpcb)(NO3)4 (triclinic polymorph [22]) obtained by recrystallization of irradiated 1 (682 Å3) is somewhat higher than for monoclinic salt 2 obtained by means of the SCSC process. Note that Singh and Sun succeeded to achieve full conversion [22], while we failed to achieve it in the SCSC manner even after additional irradiation of the single crystal for 24 hours. Based on 1H NMR data of the irradiated bulk sample, the conversion was 86% (Figure S7). This value perfectly agreed with that obtained from single-crystal XRD data. (See Supplementary Materials)

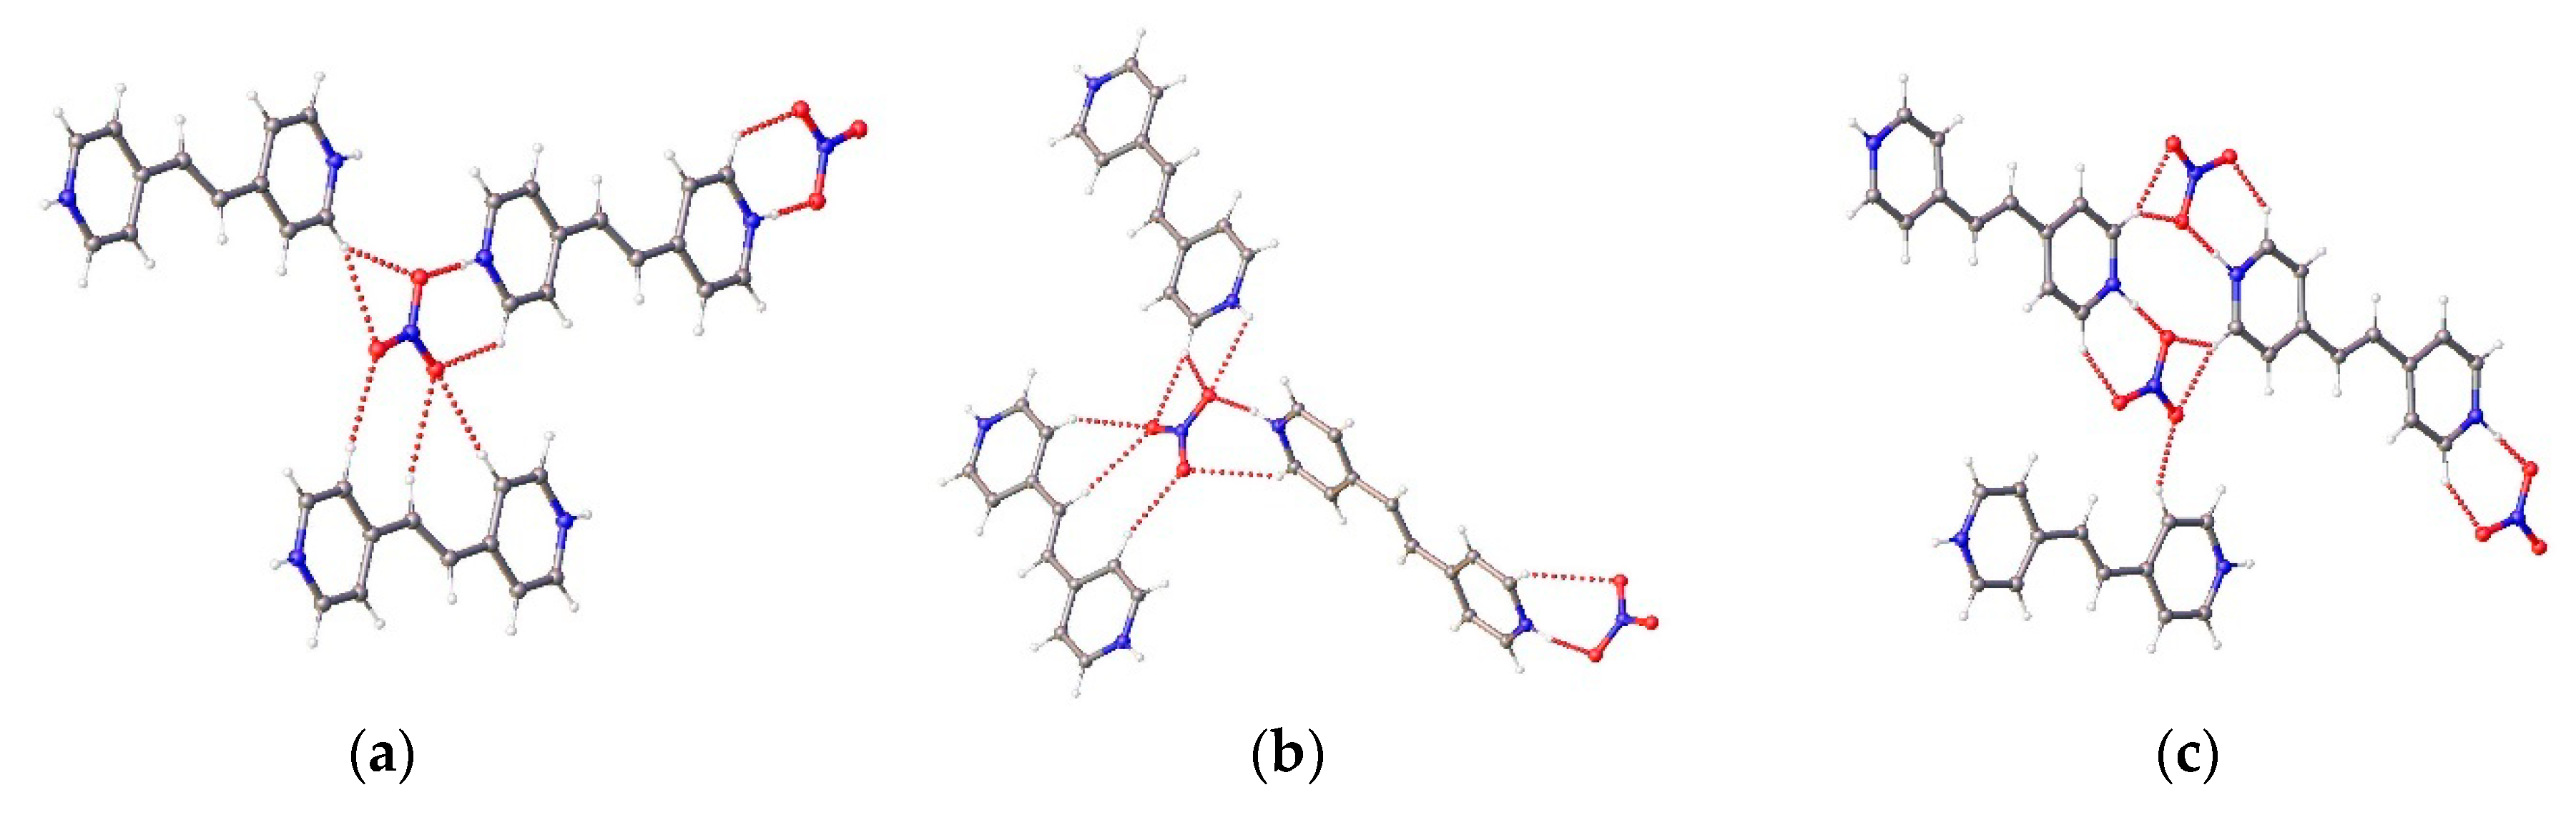
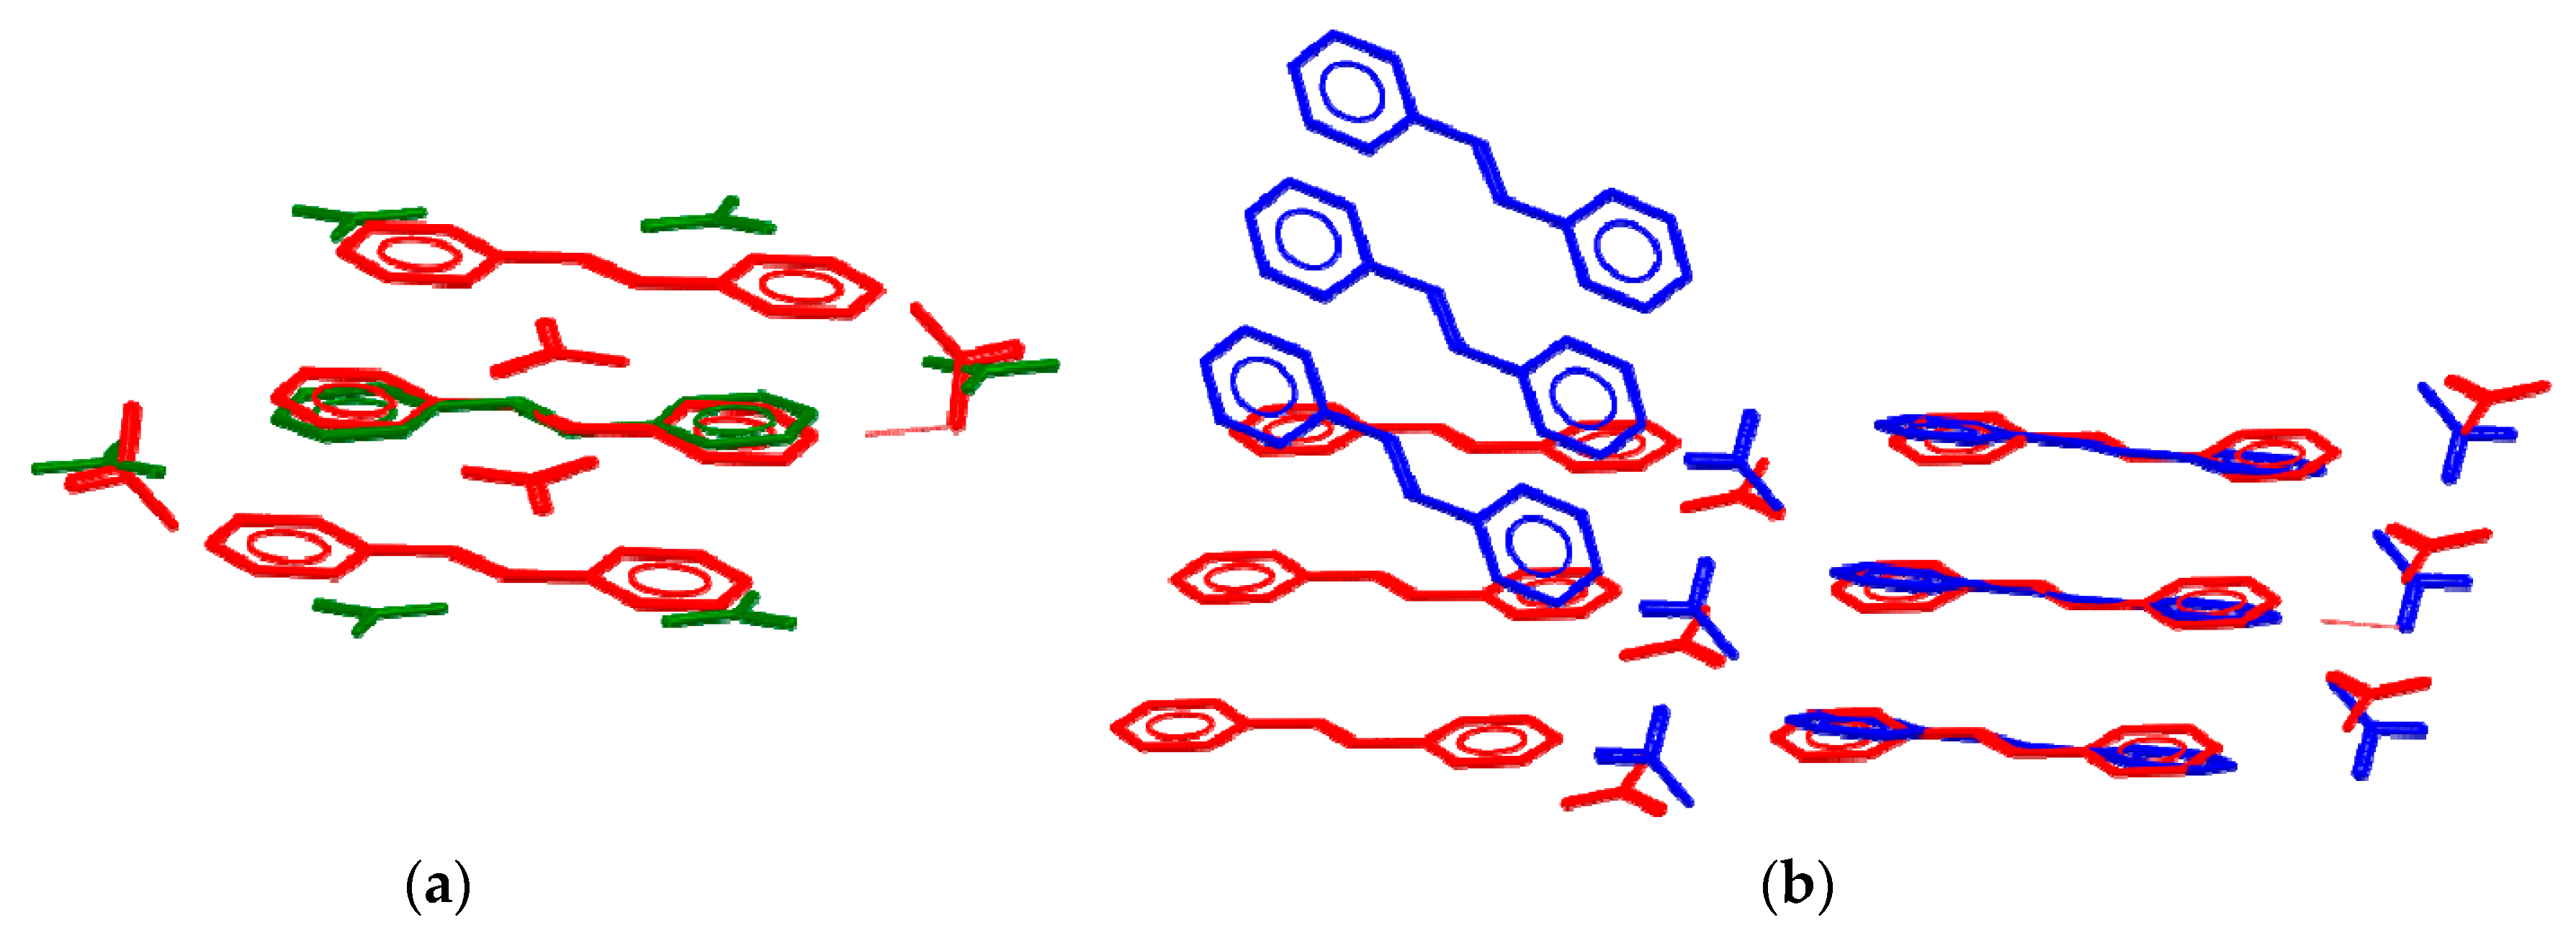
3.2. Charge-Density Analysis of Intermolecular Bonding in 1

Intra- and intermolecular bonding in crystals of 1 were investigated within QTAIM theory. As expected, the values of charge density (ρ(r)), its Laplacian (∇2ρ(r)) and bond ellipticity at bond critical points (bcps) are in agreement with the bond order evaluated from corresponding bond lengths. All expected intramolecular bcps were found. The information about bond critical points is summarized as a column diagram (Figure 4) and in Table S4 (see the Electronic Supporting Information). All bcps corresponding to chemical bonds are characterized by negative sign of Laplacian that is typical for the covalent bonds formed by C, N and O atoms in organic compounds. The static deformation density (DED) maps (Figure 5) demonstrate the concentration of charge density along all covalent bonds, and presence of two lone pairs in the plane of the nitrate anion for each of its’ three oxygen atoms. The shift of charge density from carbon atoms to more electronegative N1 atom, as well as more prominent concentration on C=C bond as compared with neighboring C−C ones were visible.
Charge distribution in the region of all expected intermolecular interactions was also investigated, and their energies were estimated based on the approach suggested by E. Espinosa, E. Mollins and C. Lecomte (EML, [38]) as Ebond = −0.5V(r). Descriptors of hydrogen N–H…O and C–H…O interactions are listed in Table 2. Intermolecular interactions found in the regions of the anion and cation were depicted on Figure 6 as molecular graphs. The values of ρ(r) and ∇2ρ(r) in bcps for hydrogen bonds were in the same range as those reported for trans-cinnamic acid and coumarin-3-carboxillic acid, and the values of ρ(r) and ∇2ρ(r) at bcps for π…π stacking was lower [18]. The N–H…O hydrogen bond is, indeed, the strongest of all intermolecular interactions in 1. Its energy was 12.0 kJ mol−1, while energies of other hydrogen bonds did not exceed 2.8 kJ mol−1. The total energy of intermolecular interactions estimated from EML correlation was equal to 269.1 kJ mol−1. Although this solid contained charged species, this value was very close to the value of 267.8 kJ mol−1 obtained for the total packing energy calculated using the ‘UNI’ force-field [39,40]. This energy estimated within the EML approach/the ‘UNI’ field consisted of 55.5/49.4 kJ mol−1 corresponding to π…π interactions within stacks of cations, 2.0/0.9 kJ mol−1 goes to anion…anion interactions, 0.8/0.4—to C–H…H–C interactions between neighboring stacks, and the rest goes to cation….anion interactions. No four-membered cycles formed by the C6 atoms of olefin groups were found. Instead, the π…π interaction manifested itself as a bonding path between closest atoms of olefin groups additionally supported with C…C and N…C interactions of pyridyl rings. Besides, there were found two H6…C6 bonds (Table 2) in the region of olefin…olefin interactions. Sum energy of ethylene…ethylene pairwise interactions (19) and (20) was equal to 1.05 kJ mol−1. Although neither previously reported QTAIM data for photoreactive compounds [18,19], none of our results demonstrated the presence of a four-membered cycles between reactive groups, it is worth mentioning that the reaction took place in the excited state, while the QTAIM analysis was performed for a ground state of molecules and their associates.
Thus, we found three bcps between olefin groups of neighboring molecules that prove that a bonding path could act as a channel of charge redistribution in the course of a photoreaction. Although there was no four-membered cycle formed by bond paths, it should be mentioned that bond paths corresponding to weak interactions, especially in the region of flat electron density distribution, should be regarded as a secondary phenomenon towards intermolecular bonding in accord with Dunitz and Gavezzotti’s [41] suggestion. Other methods describing intermolecular interactions in terms of common intermolecular surface can be useful in this case. For example, application of the NCI (non-covalent interaction) method [42,43] based on the dimensionless RDG (reduced density gradient) function related to the magnitude of λ2 eigenvalue (signλ2ρ) allows us to distinguish attractive and repulsive, weak and strong interactions [44,45,46]. Three-dimensional isosurfaces of RDG function in the regions of these interactions colored according to the sign of λ2 multiplied by ρ(r) visualize these differences. As a rule, the maxima for rather strong intermolecular interactions like classic hydrogen bonds (O–H…O or N–H…O) are small and they have a discoidal shape. The sign of λ2 is mainly negative that is an indicative for attractive nature of classic hydrogen bonds. On the contrary, the maxima for weak H…H interactions are characterized by a rather large area and they had no definite shape. On Figure 7, the 3D isosurface of RDG for stacking cations is depicted. The interactions of π-systems (Ph and ethylene bridges) according to the sign of λ2 had both an attractive and repulsive character. The area of the latter interaction was the largest one, the sign of λ2 changed from slightly positive to negative. The latter fact is indicative for the fact that all carbon atoms participate in cation–cation bonding rather than several atoms shown on the molecular graph (Figure 6).
A more rough approximation of intermolecular and interatomic bonding presence can be carried out within the Voronoi tessellation. Within this approach an atom in crystal space is approximated by its Voronoi polyhedron (a convex polyhedron formed by points of crystal space that are closer to this atom than to any other), and a molecular Voronoi polyhedron is constructed as a sum of atomic Voronoi polyhedra [47,48,49,50]. The volumes of the anion and cation obtained within the Voronoi and the QTAIM approaches (respectively, 52.5 and 44.8 Å3 for NO3, 232.4 and 214.0 Å3 for H2bpe2+) were very close that confirms that the Voronoi polyhedron represents well atomic and molecular domains.
Although this model clearly underestimated the molecular surface that goes to C…C interactions, the sum value of the molecular surface common between olefin groups (5 Å2, Figure 7b) indicates the possibility of a solid-state reaction to occur. Within the Voronoi tessellation approach the majority of hydrogen bonds can be distinguished from the non-bonding contacts based on the high value of the Voronoi polyhedron face common for two atoms (typically >10% of the full solid angle of 4π steradian, Table 2). Bonding inter- and intramolecular H…H interactions can also be found within this approximation. This result in accord with previously reported comparison of QTAIM and Voronoi approaches to describe chemical bonding in crystals [51,52,53,54]. Possibility to automatically distinguish bonding interactions among the whole set of contacts can be very helpful for comparison of bonding sets at initial and final stages of a solid-state reaction. Thus, Mahon et al. proposed that photoreactions that require disruption of strong intermolecular interactions may be prohibited or proceed with crystal degradation [55]. In Table 2 bond distances and solid angles for intra and intermolecular interactions (1)–(23) after irradiation are given. Atomic movement caused by shortening of the (19) C6…C6 interactions has broken planarity of cation stacks, and the majority of C…H, C…C and C…N interactions disappeared. This fact manifests itself as absence of a common interatomic Voronoi surface or presence of indirect contacts (for which a shortest interatomic line does not intersect a common surface). At the same time, the N–H…O bond descriptors remain unchanged within the Voronoi approach. Weak hydrogen and dihydrogen bonds are all elongated in 2 as compared with 1, nevertheless, the majority of them had Ω > 10%. Thus, we could conclude that the system of hydrogen bonds remained almost unchanged after irradiation in accord with Mahon et al. assumption.

4. Conclusions

Here, we presented a charge density study of a photo-sensitive (H2bpe)(NO3)2 salt with the aim of exploring charge density descriptors of intermolecular bonding suitable for analysis of photoreactive compounds and investigation of channels of charge redistribution in the course of a photoreaction. We confirmed that the single-crystal studied undergoes the [2 + 2] photoinitiated cycloaddition in a single crystal-to-single-crystal manner with partial crystal degradation. High conversion (90%) of H2bpe2+ to H4tpcb4+ was confirmed for both a single crystal (based on XRD data) and a bulk sample (based on 1H NMR data). Although molecular graph confirmed the charge concentration between reactive C=C fragments, we observed no expected four-membered cycles. The NCI approach instead demonstrated flat RDG surfaces that were common for weak interactions of π-systems where attractive contribution was comparable to the repulsive one. In our opinion, all necessary conditions for photoreaction to occur were met that was clearly shown by charge density study and the Voronoi tessellation. More advanced studies of wide range of photoactive and photoinert crystal structures could provide more information about applicability of methods utilized herein. However, it should be emphasized that (i) QTAIM approach was applied to the ground state of a molecule, and (ii) immanence of any photoreaction was defined by evaluation of the reaction mechanism and as a consequence barrier. The latter is impossible for most of solids. Thus, charge density and the Voronoi tessellation studies proved to be reliable methods for prediction of photoreactions.

Supplementary Materials

CCDC 1963483, 1963856 and 1963484 contain, respectively, IAM and MM refinements for 1 and IAM refinement for 2. Crystallographic information files are available from the Cambridge Crystallographic Data Center upon request (http://www.ccdc.cam.ac.uk/structures). Results of MM refinement of 1, residual density analysis, description of the Voronoi approach, powder XRD data and 1H NMR spectrum are available online at https://0-www-mdpi-com.brum.beds.ac.uk/2073-4352/9/12/613/s1.

Author Contributions

A.V.S. synthesized salt 1 and obtained its single crystals. A.V.V. and A.A.K. conceived the single-crystal XRD experiments, collected data for charge density analysis. D.Y.A. collected and analyzed 1H NMR data. I.E.U. and A.D.V. carried out the photoreaction and made powder XRD analysis of 1 and 2. Multipole refinement was carried out by A.V.V. A.A.K. provided analysis of charge density. A.V.V. and A.A.K. wrote the paper.

Funding

This work was supported by the Russian Science Foundation (grant No. 17-13-01442) and Ministry of Science and Higher Education of the Russian Federation (project numbers 4.5037.2017/8.9 and 0777-2017-0008).

Acknowledgments

The solid-state reaction was investigated with financial support of the Russian Science Foundation. Single-crystal and powder X-ray diffraction data were measured using the equipment of the Center for Molecular Studies of INEOS RAS. AVS is indebted to the Ministry of Science and Higher Education of the Russian Federation for financial support within the base part of the government mandate.

Conflicts of Interest

The authors declare no conflict of interest.

References

  1. Cohen, M.D.; Schmidt, G.M.J. 383. Topochemistry. Part I. A survey. J. Chem. Soc. 1964, 1996–2000. [Google Scholar] [CrossRef]
  2. Huang, S.-L.; Hor, T.S.A.; Jin, G.-X. Photodriven single-crystal-to-single-crystal transformation. Coord. Chem. Rev. 2017, 346, 112–122. [Google Scholar] [CrossRef]
  3. Volodin, A.D.; Korlyukov, A.A.; Zorina-Tikhonova, E.N.; Chistyakov, A.S.; Sidorov, A.A.; Eremenko, I.L.; Vologzhanina, A.V. Diastereoselective solid-state crossed photocycloaddition of olefins in a 3D Zn(II) coordination polymer. Chem. Commun. 2018, 54, 13861–13864. [Google Scholar] [CrossRef] [PubMed]
  4. Hu, F.; Shi, Y.-X.; Chen, H.-H.; Lang, J.-P. A Zn(II) coordination polymer and its photocycloaddition product: Syntheses, structures, selective luminescence sensing of iron(III) ions and selective absorption of dyes. Dalton Trans. 2015, 44, 18795–18803. [Google Scholar] [CrossRef] [PubMed]
  5. Sato, H.; Matsuda, R.; Mir, M.H.; Kitagawa, S. Photochemical cycloaddition on the pore surface of a porous coordination polymer impacts the sorption behavior. Chem. Commun. 2012, 48, 7919–7921. [Google Scholar] [CrossRef] [PubMed]
  6. Park, I.-H.; Medishetty, R.; Lee, H.-H.; Mulijanto, C.E.; Quah, H.S.; Lee, S.S.; Vittal, J.J. Formation of a Syndiotactic Organic Polymer Inside a MOF by a [2 + 2] Photo-Polymerization Reaction. Angew. Chem. Int. Ed. Engl. 2015, 54, 7313–7317. [Google Scholar] [CrossRef] [PubMed]
  7. Park, I.-H.; Chanthapally, A.; Lee, H.-H.; Quah, H.S.; Lee, S.S.; Vittal, J.J. Solid-state conversion of a MOF to a metal-organo polymeric framework (MOPF) via [2 + 2] cycloaddition reaction. Chem. Commun. 2014, 50, 3665–3667. [Google Scholar] [CrossRef] [PubMed]
  8. Pathigoolla, A.; Sureshan, K.M. Synthesis of Triazole-linked Homonucleoside Polymers through Topochemical Azide–Alkyne Cycloaddition. Angew. Chem. Int. Ed. Engl. 2014, 53, 9522–9525. [Google Scholar] [CrossRef]
  9. Nagarathinam, M.; Vittal, J.J. A Rational Approach to Crosslinking of Coordination Polymers Using the Photochemical [2 + 2] Cycloaddition Reaction. Macromol. Rap. Commun. 2006, 27, 1091–1099. [Google Scholar] [CrossRef]
  10. He, W.-W.; Li, S.-L.; Lan, Y.-Q. Liquid-free single-crystal to single-crystal transformations in coordination polymers. Inorg. Chem. Front. 2018, 5, 279–300. [Google Scholar] [CrossRef]
  11. Nagarathinam, M.; Peedikakkal, A.M.P.; Vittal, J.J. Stacking of double bonds for photochemical [2 + 2] cycloaddition reactions in the solid state. Chem. Commun. 2008, 42, 5277–5288. [Google Scholar] [CrossRef] [PubMed]
  12. Kuz’mina, L.G.; Vedernikov, A.I.; Gromov, S.P.; Alfimov, M.V. Crystallographic Approach to the [2 + 2] Photocycloaddition Topochemical Reactions of Unsaturated Compounds with Single Crystal Retention. Crystallogr. Rep. 2019, 64, 691–712. [Google Scholar] [CrossRef]
  13. Schmidt, G.M.J. Photodimerization in the solid state. Pure Appl. Chem. 1971, 27, 647–678. [Google Scholar] [CrossRef]
  14. Kaupp, G. Photodimerization of Cinnamic Acid in the Solid State: New Insights on Application of Atomic Force Microscopy. Angew. Chem. Int. Ed. Engl. 1992, 31, 592–595. [Google Scholar] [CrossRef]
  15. Kaupp, G.; Schmeyers, J.; Hangen, U.D. Anisotropic molecular movements in organic crystals by mechanical stress. J. Phys. Org. Chem. 2002, 15, 307–313. [Google Scholar] [CrossRef]
  16. Mishra, M.K.; Mukherjee, A.; Ramamurty, U.; Desiraju, G.R. Crystal chemistry and photomechanical behavior of 3,4-dimethoxycinnamic acid: Correlation between maximum yield in the solid-state topochemical reaction and cooperative molecular motion. IUCrJ 2015, 2, 653–660. [Google Scholar] [CrossRef]
  17. Berkovitch-Yellin, Z.; Leiserowitz, L. Electron density distribution in cumulenes: An X-ray study of tetraphenylbutatriene at 20 °C and −160 °C. Acta Crystallogr. B 1977, 33, 3657–3669. [Google Scholar] [CrossRef]
  18. Howard, J.A.K.; Mahon, M.F.; Raithby, P.R.; Sparkes, H.A. Trans-cinnamic acid and coumarin-3-carboxylic acid: Experimental charge-density studies to shed light on [2 + 2] cycloaddition reactions. Acta Crystallogr. B 2009, 65, 230–237. [Google Scholar] [CrossRef]
  19. Vologzhanina, A.V.; Zorina-Tikhonova, E.N.; Chistyakov, A.S.; Sidorov, A.A.; Korlyukov, A.A.; Eremenko, I.L. Analysis of intermolecular interactions in crystals of photosensitive zinc(II) coordination compounds. Rus. J. Coord. Chem. 2018, 44, 733–737. [Google Scholar] [CrossRef]
  20. Bader, R.F.W. Atoms in Molecules. A Quantum Theory; Clarendon Press: Oxford, UK, 1990. [Google Scholar]
  21. Felloni, M.; Blake, A.J.; Hubberstey, P.; Wilson, C.; Schröder, M. Hydrogen-bonding interactions between linear bipyridinium cations and nitrate anions. CrystEngComm 2002, 4, 483–495. [Google Scholar] [CrossRef]
  22. Singh, A.S.; Sun, S.-S. Recyclable nitrate-templated photochemical [2 + 2] cycloaddition reaction promoted by a tripodal receptor. Chem. Commun. 2013, 49, 10070–10072. [Google Scholar] [CrossRef] [PubMed]
  23. Yan, G.-B. 4,4′-(Ethene-1,2-diyl)dipyridinium dinitrate. Acta Crystallogr. E 2006, 62, o4942–o4943. [Google Scholar] [CrossRef]
  24. Sheldrick, G.M. SHELXT—Integrated space-group and crystal-structure determination. Acta Crystallogr. 2015, A71, 3–8. [Google Scholar] [CrossRef] [PubMed]
  25. Sheldrick, G.M. Crystal structure refinement with SHELXL. Acta Crystallogr. 2015, C71, 3–8. [Google Scholar]
  26. Dolomanov, O.V.; Bourhis, L.J.; Gildea, R.J.; Howard, J.A.K.; Puschmann, H. OLEX2: A complete structure solution, refinement and analysis program. J. Appl. Crystallogr. 2009, 42, 339–341. [Google Scholar] [CrossRef]
  27. Hansen, N.K.; Coppens, P. Testing aspherical atom refinements on small-molecule data sets. Acta Crystallogr. 1978, A34, 909–921. [Google Scholar] [CrossRef]
  28. Koritsansky, T.S.; Howard, S.T.; Richter, T.; Macchi, P.; Volkov, A.; Gatti, C.; Mallinson, P.R.; Farrugia, L.J.; Su, Z.; Hansen, N.K. XD—A Computer Program Package for Multipole Refinement and Topological Analysis of Charge Densities from Diffraction Data; Buffalo: New York, NY, USA, 2006. [Google Scholar]
  29. Allen, F.H.; Bruno, I.J. Bond lengths in organic and metal-organic compounds revisited: X–H bond lengths from neutron diffraction data. Acta Crystallogr. Sect. B 2010, 66, 380–386. [Google Scholar] [CrossRef]
  30. Madsen, A.Ø. SHADE web server for estimation of hydrogen anisotropic displacement parameters. J. Appl. Crystallogr. 2006, 39, 757–758. [Google Scholar] [CrossRef]
  31. Volkov, A.; Abramov, Y.A.; Coppens, P. Density-optimized radial exponents for X-ray charge-density refinement from ab initio crystal calculations. Acta Crystallogr. Sect. A 2001, 57, 272–282. [Google Scholar] [CrossRef]
  32. Henn, J.; Meindl, K. More about systematic errors in charge-density studies. Acta Crystallogr. Sect. A 2014, 70, 499–513. [Google Scholar] [CrossRef]
  33. Zhurov, V.V.; Zhurova, E.A.; Pinkerton, A.A. Optimization and evaluation of data quality for charge density studies. J. Appl. Crystallogr. 2008, 41, 340–349. [Google Scholar] [CrossRef]
  34. Farrugia, L.J. WinGX and ORTEP for Windows: An update. J. Appl. Crystallogr. 2012, 45, 849–854. [Google Scholar] [CrossRef]
  35. Macrae, C.F.; Bruno, I.J.; Chisholm, J.A.; Edgington, P.R.; McCabe, P.; Pidcock, E.; Rodriguez-Monge, L.; Taylor, R.; van de Streek, J.; Wood, P.A. Mercury CSD 2.0—New features for the visualization and investigation of crystal structures. J. Appl. Crystallogr. 2008, 41, 466–470. [Google Scholar] [CrossRef]
  36. Childs, S.L.; Wood, P.A.; Rodríguez-Hornedo, N.; Reddy, L.S.; Hardcastle, K.I. Analysis of 50 Crystal Structures Containing Carbamazepine Using the Materials Module of Mercury CSD. Cryst. Growth Des. 2009, 9, 1869–1888. [Google Scholar] [CrossRef]
  37. Vologzhanina, A.V. Intermolecular Interactions in Functional Crystalline Materials: From Data to Knowledge. Crystals 2019, 9, 478. [Google Scholar] [CrossRef] [Green Version]
  38. Espinosa, E.; Molins, E.; Lecomte, C. Hydrogen bond strengths revealed by topological analyses of experimentally observed electron densities. Chem. Phys. Lett. 1998, 285, 170–173. [Google Scholar] [CrossRef]
  39. Gavezzotti, A. Are Crystal Structures Predictable? Acc. Chem. Res. 1994, 27, 309–314. [Google Scholar] [CrossRef]
  40. Gavezzotti, A.; Filippini, G. Geometry of the Intermolecular X-H…Y (X, Y = N, O) Hydrogen Bond and the Calibration of Empirical Hydrogen-Bond Potentials. J. Phys. Chem. 1994, 98, 4831–4837. [Google Scholar] [CrossRef]
  41. Dunitz, J.D.; Gavezzotti, A. Molecular Recognition in Organic Crystals: Directed Intermolecular Bonds or Nonlocalized Bonding? Angew. Chem. Int. Ed. 2005, 44, 1766–1787. [Google Scholar] [CrossRef]
  42. Johnson, E.R.; Keinan, S.; Mori-Sánchez, P.; Contreras-García, J.; Cohen, A.J.; Yang, W. Revealing Noncovalent Interactions. J. Am. Chem. Soc. 2010, 132, 6498–6506. [Google Scholar] [CrossRef] [Green Version]
  43. Saleh, G.; Gatti, C.; Lo Presti, L. Non-covalent interaction via the reduced density gradient: Independent atom model vs experimental multipolar electron densities. Compt. Theor. Chem. 2012, 998, 148–163. [Google Scholar] [CrossRef]
  44. Baggioli, A.; Cavallotti, C.A.; Famulari, A. Exploring short intramolecular interactions in alkylaromatic substrates. Phys. Chem. Chem. Phys. 2016, 18, 29616–29628. [Google Scholar] [CrossRef] [PubMed] [Green Version]
  45. Hey, J.; Leusser, D.; Kratzert, D.; Fliegl, H.; Dieterich, J.M.; Mata, R.A.; Stalke, D. Heteroaromaticity approached by charge density investigations and electronic structure calculations. Phys. Chem. Chem. Phys. 2013, 15, 20600–20610. [Google Scholar] [CrossRef] [PubMed]
  46. Arkhipov, D.E.; Lyubeshkin, A.V.; Volodin, A.D.; Korlyukov, A.A. Molecular Structures Polymorphism the Role of F…F Interactions in Crystal Packing of Fluorinated Tosylates. Crystals 2019, 9, 242. [Google Scholar] [CrossRef] [Green Version]
  47. Peresypkina, E.V.; Blatov, V.A. Topology of molecular packings in organic crystals. Acta Crystallogr. Sect. B 2000, 56, 1035–1045. [Google Scholar] [CrossRef] [Green Version]
  48. Blatova, O.A.; Blatov, V.A.; Serezhkin, V.N. A new set of molecular descriptors. Acta Crystallogr. Sect. B 2002, 58, 219–226. [Google Scholar] [CrossRef] [Green Version]
  49. Serezhkin, V.N.; Serezhkina, L.B.; Vologzhanina, A.V. Voronoi-Dirichlet tesselation as a tool for investigation of polymorphism in molecular crystals with CwHxNyOz composition and photochromic properties. Acta Crystallogr. Sect. B 2012, 68, 305–312. [Google Scholar] [CrossRef]
  50. Serezhkin, V.N.; Savchenkov, A.V. Application of the Method of Molecular Voronoi–Dirichlet Polyhedra for Analysis of Noncovalent Interactions in Crystal Structures of Flufenamic Acid—The Current Record-Holder of the Number of Structurally Studied Polymorphs. Cryst. Growth Des. 2015, 15, 2878–2882. [Google Scholar] [CrossRef]
  51. Vologzhanina, A.V.; Savchenkov, A.V.; Dmitrienko, A.O.; Korlyukov, A.A.; Bushmarinov, I.S.; Pushkin, D.V.; Serezhkina, L.B. Electronic Structure of Cesium Butyratouranylate(VI) as Derived from DFT-assisted Powder X-ray Diffraction Data. J. Phys. Chem. A 2014, 118, 9745–9752. [Google Scholar] [CrossRef]
  52. Vologzhanina, A.V.; Kats, S.V.; Penkova, L.V.; Pavlenko, V.A.; Efimov, N.N.; Minin, V.V.; Eremenko, I.L. Combined analysis of chemical bonding in a CuII dimer using QTAIM, Voronoi tessellation and Hirshfeld surface approaches. Acta Crystallogr. Sect. B 2015, 71, 543–554. [Google Scholar] [CrossRef]
  53. Vologzhanina, A.V.; Lyssenko, K.A. Interatomic interactions in the crystal of (C4H11N2)2(C4H12N2)[Mo(CN)8]: Comparison of two approaches. Rus. Chem. Bull. 2013, 62, 1786–1792. [Google Scholar] [CrossRef]
  54. Lyssenko, K.A.; Vologzhanina, A.V.; Torubaev, Y.V.; Nelyubina, Y.V. A comparatie study of a mixed-ligand copper(II) complex by the theory of atoms in molecules and the Voronoi tessellation. Mendeleev Commun. 2014, 24, 216–218. [Google Scholar] [CrossRef]
  55. Mahon, M.F.; Raithby, P.R.; Sparkes, H.A. Investigation of the factors favouring solid state [2 + 2] cycloaddition reactions; the [2 + 2] cycloaddition reaction of coumarin-3-carboxylic acid. CrystEngComm 2008, 10, 573–576. [Google Scholar] [CrossRef]
Figure 1. Molecular view of (1) and asymmetric unit of (2) depicted in thermal ellipsoids (p = 80% and 50%, respectively). Only symmetrically independent atoms are labeled.
Crystals 09 00613 g001
Figure 2. N–H…O bonded architectures and the closest environment of anions in (a) triclinic, (b) monoclinic P and (c) monoclinic C polymorphs of 1. H-bonds are depicted with dotted lines.
Crystals 09 00613 g002
Figure 3. Comparison of crystal packing of (a) triclinic (green) and monoclinic C 2/c (red) polymorph, and (b) monoclinic P 21/n (blue) and monoclinic C 2/c (red) polymorphs of 1. Hydrogen atoms are omitted for clarity.
Crystals 09 00613 g003
Figure 4. The values of electron density (upper diagram) and its Laplacian (lower diagram) at bond critical points (bcps) in 1 (atomic units). Symmetry code X3: 1 − x, −y, 1 − z.
Crystals 09 00613 g004
Figure 5. Deformation density maps in the sections of (a) O1, O2 and O3, and (b) C1, C5 and C6 atoms. The contour levels of DED maps are drawn each ±0.1 e Å−3; the positive contours are shown with solid red line, the negative contours are dashed blue.
Crystals 09 00613 g005
Figure 6. Molecular graph of intermolecular interactions found (a) between cations, and (b) between a cation and anions from charge density analysis. Some ring and cage critical points are omitted for clarity. Red balls and yellow diamonds depict bond and cage critical points. Intermolecular bcps are enumerated as in Table 2.
Crystals 09 00613 g006
Figure 7. (a) Three-dimensional surface of the reduced density gradient (RDG; 0.6 a.u.) colored according to the sign λ2ρ function in 1 illustrating π-overlap within cation stacks. (b) The molecular Voronoi surface common for two olefin groups in 1.
Crystals 09 00613 g007
Table 1. Experimental details and crystallographic information for IAM and multipole refinement of 1 and IAM of 2.
Identification Code12
FormulaC12H12N4O6C24H24N8O12
Formula weight308.26616.51
Space groupC 2/cI 2/a
a (Å)17.4543(4)19.143(10)
b (Å)3.6714(1)3.6089(19)
c (Å)20.0021(5)19.428(17)
β (°)93.832(1)93.539(5)
V (Å3)1278.90(6)1339.6(12)
Z42
µ (mm−1)0.1310.125
dcalc (g cm−1)1.6001.528
F(000)640640
Crystal size (mm)0.35 × 0.19 × 0.160.35 × 0.19 × 0.16
Tmin, Tmax0.931, 0.9620.932, 0.960
No. of measured, independent and observed [I > 2σ(I)] reflections182,334, 5992, 51697208, 2291, 1284
Rint0.0300.055
Refinement method IAM/multipole model
No. of parameters100/385117/-
Goodness-of-fit (on F2/on F)1.05/0.930.99/-
Final R(F) indices (all data)
Spherical atom model (on F2)R1 = 0.048, wR2 = 0.100R1 = 0.135, wR2 = 0.180
Multipole atom model (on F/F2)R1 = 0.031/0.033
Final R(F) indices (I > 2σ(I))
IAM model (on F2)R1 = 0.042, wR2 = 0.098R1 = 0.081, wR2 = 0.158
Multipole atom model (on F/F2)R1 = 0.024/0.031, wR2 = 0.027/0.053
Δρmax, Δρmin (eÅ−3)
IAM model (all data)0.77, −0.250.67, −0.34
Multipole atom model (all data)0.18, −0.19
Table 2. Characteristics of intermolecular interactions in 1 and 2 a.
1 2
Atom1Atom2R, Åρ(r), e Å−32ρ(r), e Å−5V(r), a.u.Ebond, kJ mol−1Ω, %R, ÅΩ, %
Intramolecular
1H4H61.9800.8651.2−0.0082.5617.92.1148.9
Intermolecular cation…anion
2O1H1A a2.2630.0491.2−0.006−1.8714.72.54012.1
3 H2 b2.3070.0711.2−0.007−2.1814.32.40311.9
4 H6 b2.4790.0370.7−0.003−1.0711.42.10712.1
5 H6 c2.7770.0410.5−0.003−0.9510.92.3147.0
6 H1A d2.8290.0350.5−0.003−0.897.82.7549.6
7O2H11.8020.3101.2−0.038−11.9719.61.80122.0
8 H1A a2.4770.0661.0−0.006−1.919.42.50211.7
9 O2 d2.5650.0560.6−0.004−1.3211.23.1353.7
10 N1 d3.0590.0350.7−0.003−1.031.6#3.252#0.2
11O3H4 e2.2560.0671.4−0.009−2.8016.02.4679.4
12 H5 f2.4730.0480.8−0.004−1.3313.92.7529.7
13 H52.5900.0550.8−0.005−1.4911.02.79712.2
14 C4 g2.9840.0320.4−0.002−0.736.4#3.213#0.1
Intermolecular cation…cation
15C2C3 f3.3320.0330.3−0.002−0.613.5#3.619#0.8
16 H2 h3.5570.0160.2−0.008−2.432.03.3302.8
17 H1A h3.5940.0120.1−0.001−0.191.9#3.799#0.2
18C4H4 f3.3570.0170.2−0.008−2.643.7#3.691#0.6
19C6C6 i3.3100.0260.3−0.002−0.532.11.63515.7
20 H6 i3.5150.0160.2−0.001−0.261.8--
21N1C5 f3.3200.0220.2−0.001−0.392.9--
22H2H2 j2.8240.0210.3−0.001−0.438.73.0055.2
23H5H5 f2.5070.0130.3−0.001−0.3311.92.67812.8
R—interatomic distance; ρ(r), ∇2ρ(r) and V(r)—charge density, its Laplacian and potential energy density in bcp; Ebond—energy of an interaction estimated as 0.5V(r); Ω—solid angle of an atomic surface of a Voronoi polyhedron common for two atoms (in % of 4π steradian). Sign # denotes non-direct contacts. Symmetry codes: a) 3/2 − x, −½ + y, 1/2 − z; b) x, 1 − y, −1/2 + z; c) x, −y, −1/2 + z; d) 3/2 − x, 1/2 + y, 1/2 − z; e) 1 − x, 1 + y, 1/2 − z; f) x, 1 + y, z; g) 1 − x, y, 1/2 − z; h) x, −1 + y, z; i) 1 − x, 1 − y, 1 − z; j) 3/2 − x, 1/2 − y, 1 − z.

