Article

Transcriptomic Landscape of Lower Grade Glioma Based on Age-Related Non-Silent Somatic Mutations

1
Institute Department of Biomedical Science, College of Life Science, CHA University, Seongnam 13488, Korea
2
Department of Neurosurgery, Bundang CHA Medical Center, CHA University College of Medicine, Seongnam 13496, Korea
3
Global Research Supporting Center, Bundang CHA Medical Center, CHA University College of Medicine, Seongnam 13496, Korea
4
Department of Pathology, Dong-A University College of Medicine, Dong-A University, Busan 49201, Korea
5
Department of Neurosurgery, Dong-A University Hospital, Dong-A University College of Medicine, Busan 49201, Korea
*
Authors to whom correspondence should be addressed.
These authors contributed equally as co-first authors.
These authors contributed equally as co-last authors.
Submission received: 10 May 2021 / Revised: 6 June 2021 / Accepted: 16 June 2021 / Published: 19 June 2021
(This article belongs to the Section Neuro-Oncology)

Abstract

:
Glioma accounts for 80% of all malignant brain tumours and is the most common adult primary brain tumour. Age is an important factor affecting the development of cancer, as somatic mutations accumulate with age. Here, we aimed to analyse the significance of age-dependent non-silent somatic mutations in glioma prognosis. Histological tumour grade depends on age at diagnosis in patients with IDH1, TP53, ATRX, and EGFR mutations. Age of patients with wild-type IDH1 and EGFR increased with increase in tumour grade, while the age of patients with IDH1 or EGFR mutation remained constant. However, the age of patients with EGFR mutation was higher than that of patients with IDH1 mutation. The hierarchical clustering of patients was dominantly separated by IDH1 and EGFR mutations. Furthermore, patients with IDH1 mutation were dominantly separated by TP53 and ATRX double mutation and its double wild-type counterpart. The age of patients with ATRX and TP53 mutation was lower than that of patients with wild-type ATRX and TP53. Patients with the double mutation showed poorer prognosis than those with the double wild type genotype. Unlike IDH1 mutant, IDH1 wild-type showed upregulation of expression of epithelial mesenchymal transition associated genes.

1. Introduction

Glioma, accounting for 80% of all malignant brain tumours, is the most common primary brain tumour in adults [1], and is usually treated using radiation therapy and using Temozolomide treatment after maximal safe resection [2]. Histologically, gliomas are classified as lower grade glioma (LGG) “[World Health Organization (WHO) grade 2 (G2) and 3 (G3)]” and glioblastoma (GBM) “[WHO grade 4 (G4)]”. LGG has a better prognosis than GBM, and the efficacy of treatment depends on the molecular subtype of LGG in perspective of overall survival (OS) and progression free survival. In contrast, GBM has poor prognosis, and the development of new treatment methods based on its molecular characteristics is difficult because of infiltrative and integrative characteristics of normal brain tissues [3,4].
Age is an important factor affecting the development of cancer. Most adult cancers develop exponentially with age [5], owing to the accumulation of somatic mutations [5,6,7]. However, all accumulated mutations do not contribute to cancer development. A mutation that contributes to the development of cancer is called a driver; a driver undergoes positive selection in the tissue microenvironment and leads to the development of cancer cell characteristics, such as cell growth [7,8]. There are four subtypes of glioma according to the transcriptome patterns, namely, proneural, neural, classical, and mesenchymal. The proneural subtype is associated with early onset compared with the other subtypes. The mesenchymal subtype has the worst prognosis in elderly patients [9].
Since 2016, the histological method of subtype classification has been changed to one based on molecular parameter standards, according to which, lower-grade gliomas with the IDH1 mutation and TP53 mutation or ATRX loss are classified as diffuse astrocytoma (IDH1 mutant), gliomas with the IDH1 mutation and 1p/19q co-deletion are classified as oligodendroglioma, and those with IDH1 wild-type are classified as diffuse astrocytoma [10].
Previous studies have reported that the IDH1 mutation is associated with proneural subtype of GBM which shows early onset with better prognosis [9]. GBMs with abnormal EGFR and NF1 expression are classified as classical and mesenchymal subtypes [9]. In addition, the onset age of secondary glioblastoma in patients with the IDH1 and TP53 mutations is earlier than that of primary glioblastoma [11], and age-specific mutation frequency varies among different age groups [12]. Although, there are several studies on the relationship between age and somatic mutations, potential biological mechanisms or pathways according to transcriptomic patterns with age-related somatic mutations are not clear. In this study, we investigated the effects of age at which non-silent somatic mutations occurred on patient prognosis and analysed their transcriptomic significance and their biological mechanisms or pathways using The Cancer Genome Atlas (TCGA) transcriptomic landscape of glioma.

2. Results

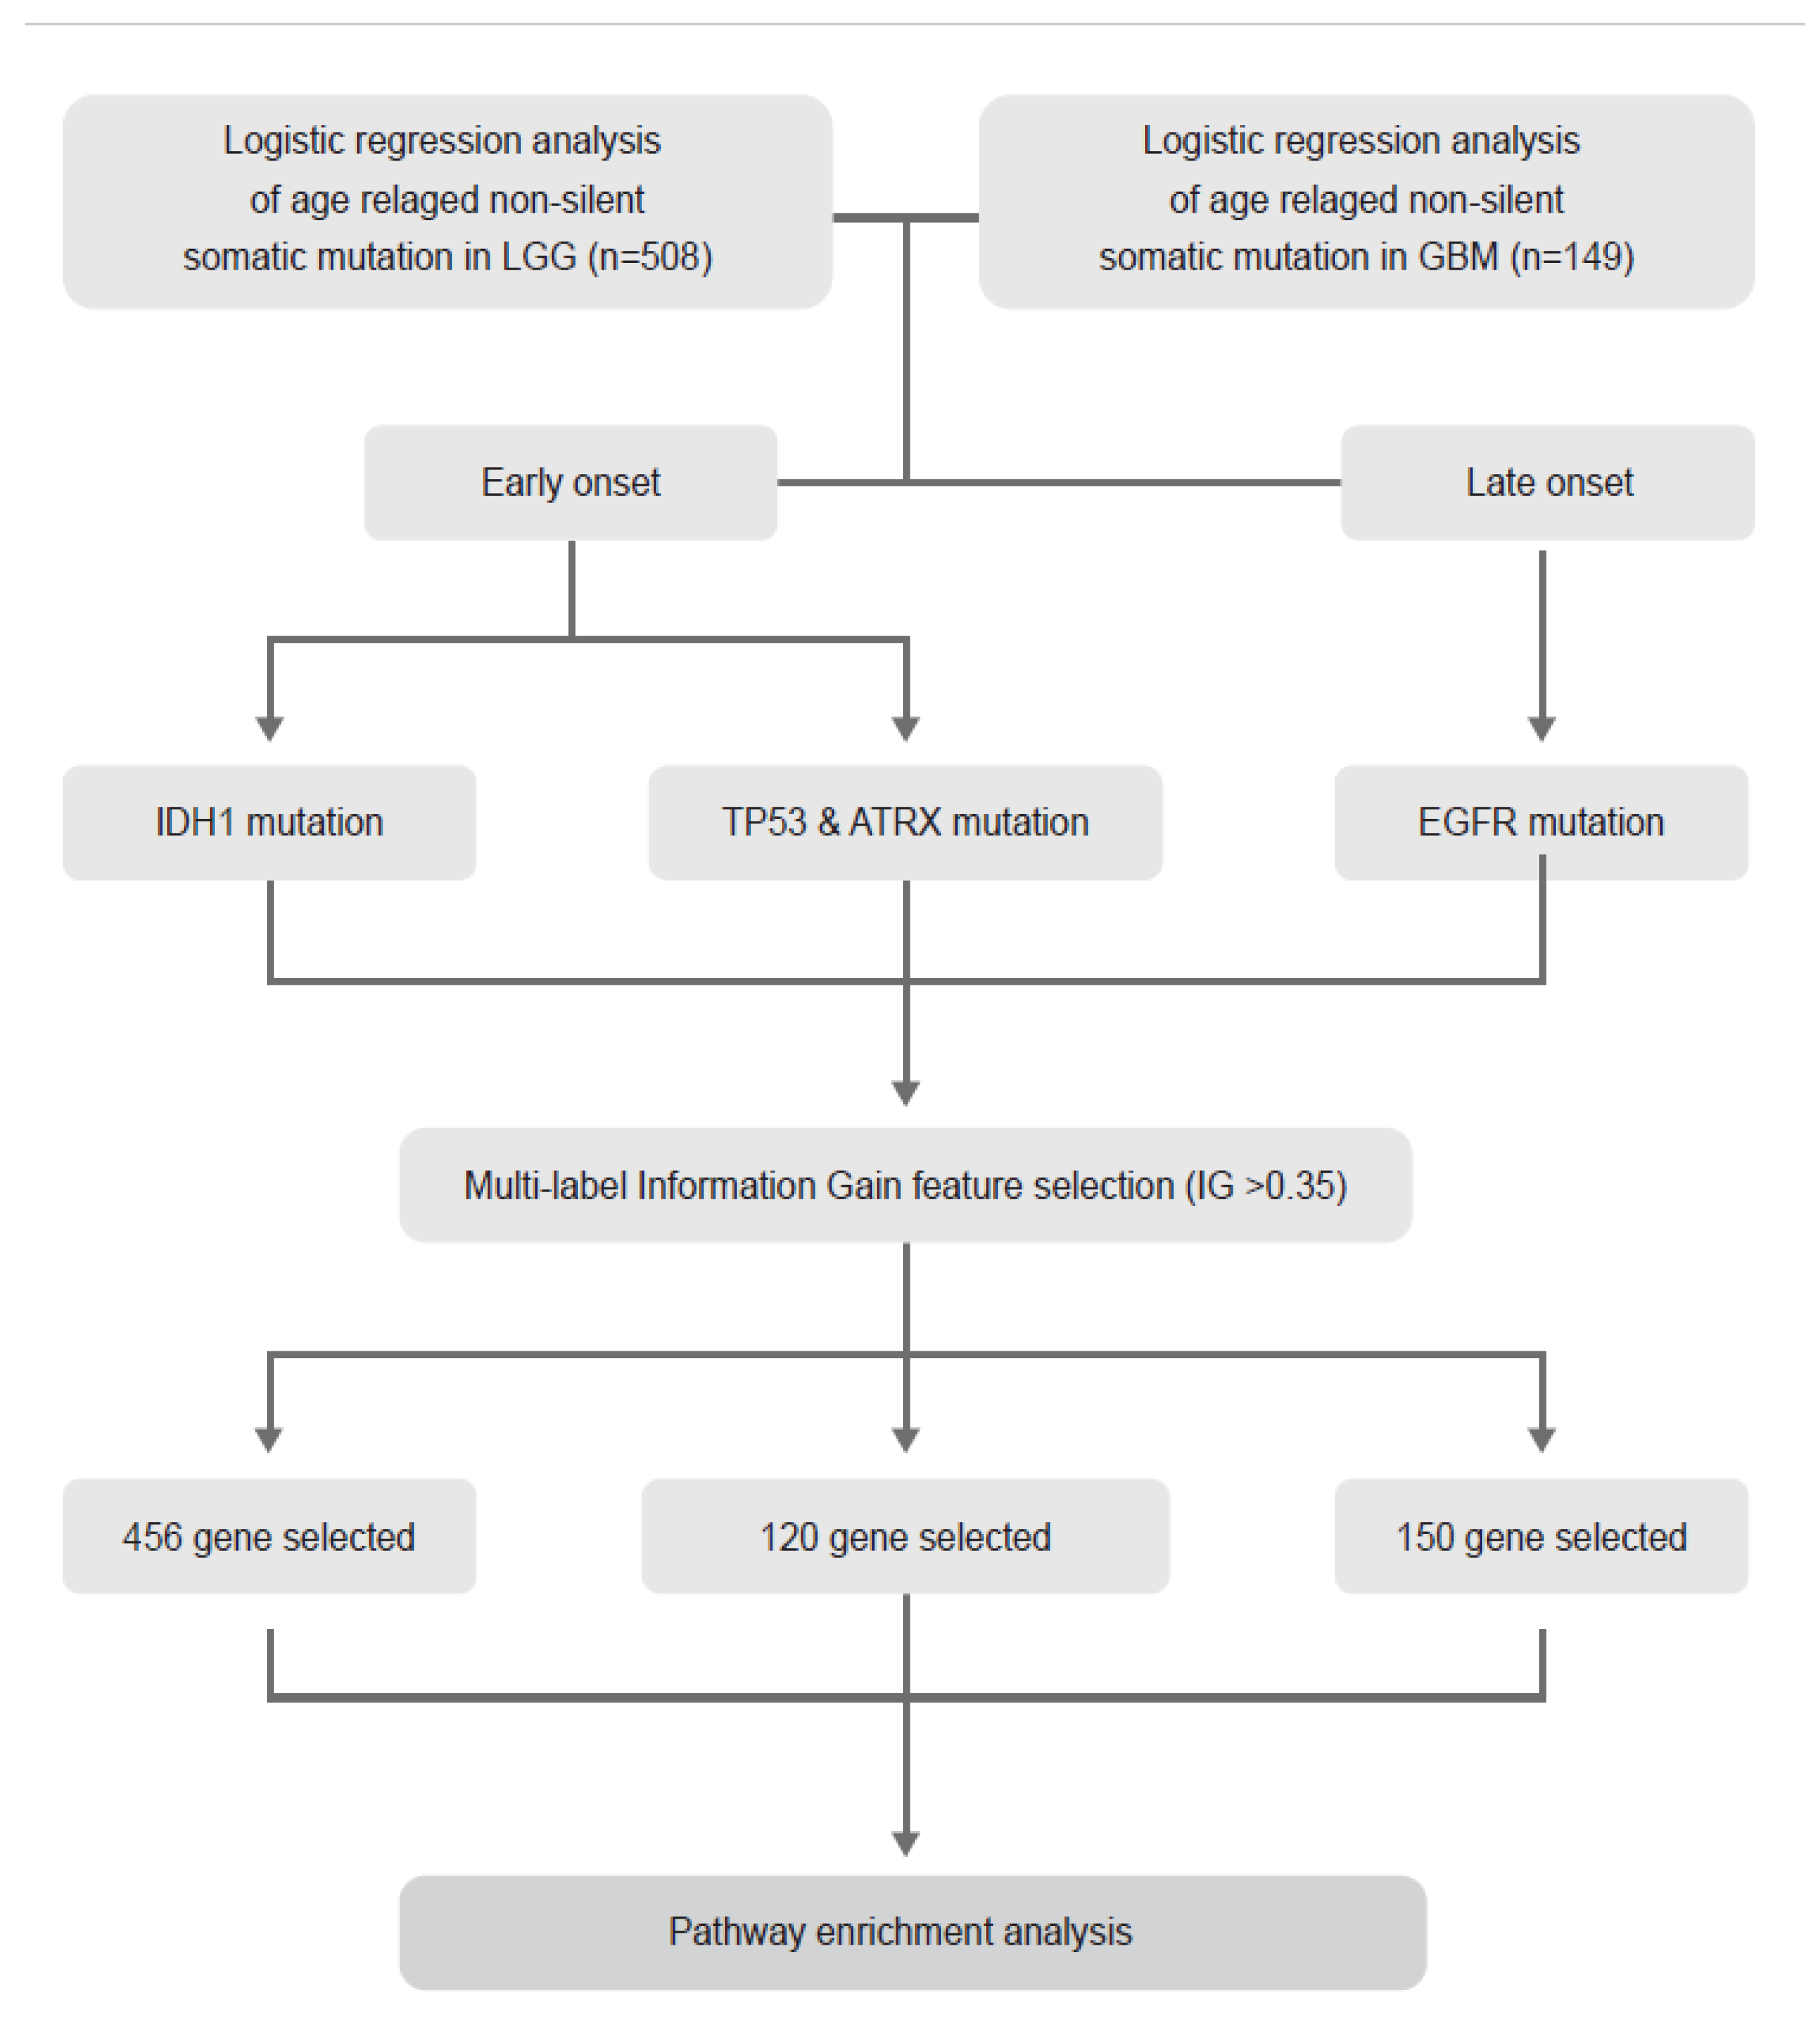
2.1. Identification of Age-Related Non-Silent Mutations in Lower Grade Glioma (LGG) and Glioblastoma (GBM)

Clinical data and non-silent somatic mutation data by multi-centre mutation calling (MC3) from TCGA were used to identify somatic mutations associated with age. Using logistic regression analysis, we analysed whether age at diagnosis affects somatic mutations in LGG (Table S1) and GBM (Table S2). Results showed that, in patients with LGG, IDH1, ATRX, and TP53 were less likely to mutate with aging, while EGFR acquired more mutations with aging (p-value < 0.05 after Bonferroni correction) (Figure 1a). Similar to LGG, ATRX was less likely to mutate with age in GBM (p-value < 0.05 after Bonferroni correction) (Figure 1b). Additional mutations information of four genes was included in supplementary Table S3. To investigate the effect of the compounding factor, additional analysis in control models was performed and the results were presented in Supplementary Table S4.

2.2. Histological Tumour Grade Depends on Age at Diagnosis in the IDH1 Wild-Type Group but Not in the Mutant Group

The patterns of age and IDH1 mutations were analysed according to histological tumour grade. Results showed that, in patients with IDH1 wild-type, as the histologic tumour grade increased, the onset age of glioma was increased (Figure 2a). However, in IDH1 mutant patients, despite the rising histologic tumour grade of cancer, the onset age of glioma was constant (Figure 2a). In patients with G2 and G3 tumours, OS differed significantly between patients with and without IDH1 mutation (log-rank p-value in G2: 0.002; in G3: 1E-11; in G4; 0.02) (Figure 2b and Table S5). In particular, the OS of patients with IDH1 wild-type and LGG did not differ significantly from that of patients with IDH1 mutation in GBM patients, but median survival was lower (median survival; IDH1 wild-type in LGG: 758 and IDH1 mutant in GBM: 1024) (Figure 2b).

2.3. Transcriptomic Landscape of Tumours of Different Histological Grades Harbouring IDH1 Mutations

To determine the transcriptomic landscape of tumours of different histological grades harbouring IDH1 mutation, we performed a multi-label information gain (IG)-based feature selection of genes that possess discriminatory power according to combinations of histological tumour grades and IDH1 mutation statuses (Table S6). As a result, a hierarchical tree of patients dominantly separated by LGG and GBM was generated (Figure 3a). Interestingly, the gene expression pattern of IDH1 wild-type of G3 was similar to IDH1 wild-type of G4. In the IDH1 wild-type of G4 and G3-rich cluster, genes involved in the mitotic cell cycle and degradation of the extracellular matrix that are associated with malignancy of tumour in the Reactome 2020 database were more highly expressed than in LGG (Figure 3).

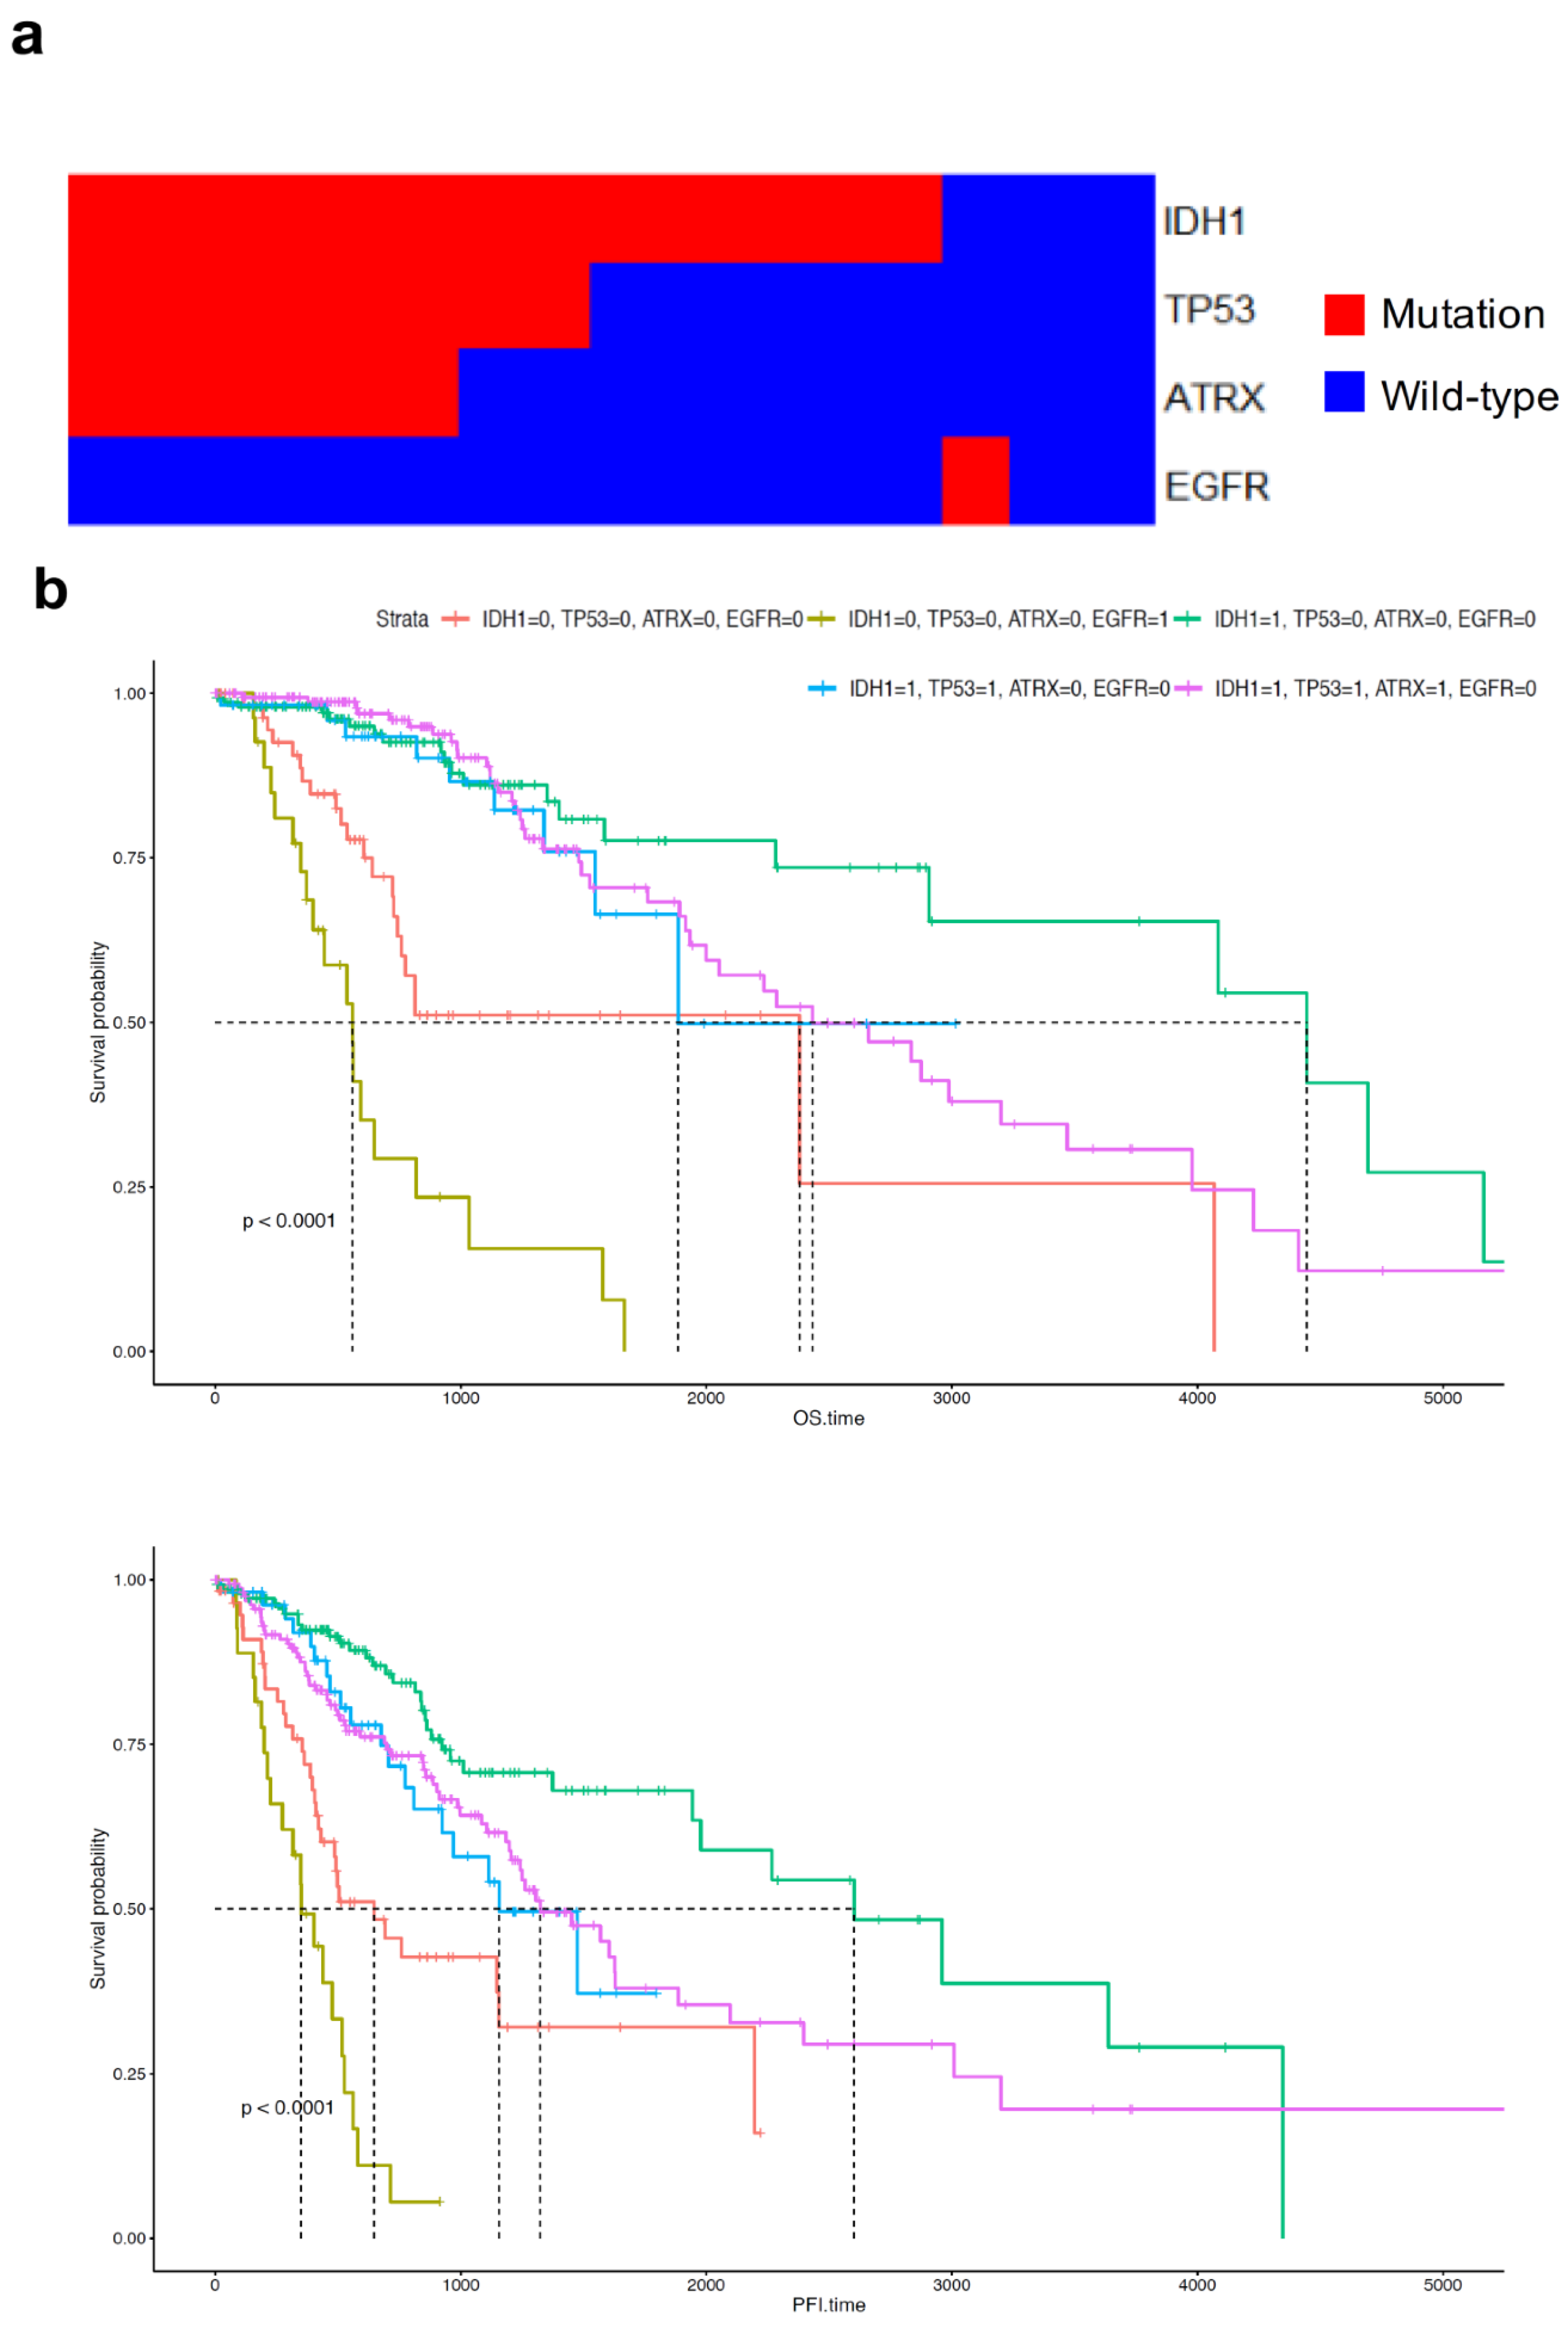
2.4. Distribution and Prognosis of Age-Dependent Non-Silent Somatic Mutations in LGG

Among several somatic mutations of four genes associated with pathological onset age in LGG, mutation pattern analysis revealed that ATRX and TP53 mutations occurred predominantly in patients with IDH1 mutations. The EGFR mutations dominantly occurred in patients with IDH1 wild-type (Figure 4a). This analysis included major mutations with over 5 percent incidence among all LGG patients. The proportion of patients divided by mutation status is suggested in supplementary Table S7. The group with EGFR mutations had the worst prognosis, in terms of both OS and progression-free interval (PFI) (Figure 4b and Table S8). Among patients with IDH1 mutations, those with ATRX and TP53 mutations showed poorer PFI than those with the wild-type genes (Figure 4b).

2.5. ATRX and TP53 Mutation Occurred in Patients with Early Onset Age of G2 and G3 Glioma and IDH1 Mutation, and the Gene Expression Patterns of Mutant ATRX and TP53 in LGG Differed from Those of Their Wild-Type Counterpart

ATRX and TP53 mutations were common in patients with IDH1 mutation and were associated with the age of onset of LGG (Figure 4a). Therefore, we analysed whether ATRX and TP53 mutations were directly related to the early age of onset of patients with IDH1 mutation. Results showed that both ATRX and TP53 mutations occurred in patients with early onset age of G2 and G3 tumours (Figure 5a). In the transcriptomic analysis, the hierarchical tree of patients primarily clustered by ATRX and TP53 double mutations and their double wild-type versions rather than by histological grade (Figure 5b). In total, 121 genes passed the IG-based feature selection. Among these 121 genes, the telomere extension-related Reactome term was significantly enriched in the gene enrichment test. This term contained only TERT (Figure 5c, Table S9).

2.6. Telomerase Reverse Transcriptase (TERT) Expression Was Suppressed in LGG and GBM with ATRX Non-Silent Mutations

We observed that TERT expression which is only significant in cluster 2 was related to ATRX and TP53 double mutation in the IDH1 wild-type subgroup in LGG (Figure 5b). In addition, TERT expression was highly suppressed in ATRX and TP53 double mutant patients in the IDH1 mutation subgroup in LGG (Figure 6a). Figure 4a shows that the ATRX and TP53 mutation patterns were similar. Therefore, we compared TERT expression with the ATRX or TP53 mutation status and tumour grade. TERT expression was highly suppressed in patients with ATRX mutation for all histological tumour grades, but not in those with TP53 mutation of G4 (Figure 6b). It indicated that the TERT expression was tightly regulated by ATRX but not TP53 mutation.

2.7. EGFR Mutation Occurred at Late Onset Age in Patients with G3 Tumour and Was Associated with Poor Prognosis of GBM Patients but Not Was Not Clustered in Transcriptomic Analysis

Unlike ATRX, TP53, and IDH1 mutations, EGFR mutations were more frequent in older patients. Age at initial pathologic diagnosis of patients with wild-type EGFR was positively correlated with tumour grade. Interestingly, in G2 and G3 patients who have relatively early onset age, the patients with EGFR mutation had tumour occurrence at old age as well as G4. In addition, despite having LGG, patients with EGFR mutations in G3 showed poor prognosis similar to those of GBM patients (Figure 7b). In the transcriptomic analysis, the hierarchical tree of patients was dominantly divided into LGG and GBM, but not by EGFR mutation status (Figure 7c, Table S10). Most of the significant pathways in the pathway enrichment analysis were related to the regulation of the cell cycle and were downregulated in GBM (Figure 7d).

3. Discussion

Cancer is highly related with the occurrence of somatic mutations, which accumulate with age [13,14]. In this study, we deeply investigated characteristics of biological mechanisms or pathways according to gene expression patterns of age-related somatic mutations in glioma.
In the IDH1 mutation group, cell-cycle-related genes are down-regulated in contrast to IDH1 wild-type group (Figure 3a,b). However, hypermethylation of TP53 occurs in IDH1 mutant, owing to the accumulation of 2-HG [15]. In contrast, regulation of TP53 expression via methylation does not occur against the IDH1 wild-type background. Hypermethylation of DNA in IDH1 mutants results in the formation of the oncometabolite, 2-HG [16]. In short, most patients of grade 2 and 3 tumours with IDH1 mutation show suppression of cell growth and high methylation of TP53, resulting in the downregulation of TP53 transcription in younger glioma patients. In contrast, promotion of cell growth and low methylation of TP53 are observed in most patients of grade 4 and a few of grade 3 tumours with IDH1 wild-type in older patients. Cell migration Reactome terms were also included in the analysis. In the IDH1 wild-type background, degradation of keratan sulphate, which can interact with neuroregulatory ligands, dissolution of fibrin clot, and crosslinking of collagen fibrils, which are important for tumour cell and T cell migration, were higher than those in the IDH1 mutant [17,18,19]. Activation of NIMA kinases, which induce premature mitosis, is highly activated in tumours with IDH1 wild-type [20,21]. Phosphorylation of early mitotic inhibitor (Emi1), which inhibits the anaphase-promoting complex/cyclosome (APC/C), is necessary for degradation of cyclins in mitosis [22]. APC/C with Cdc20 degrades type B cyclin and Nek2A and facilitates arrest of mitotic division [22,23,24] Activity of Emi is lower for the IDH1 wild-type background; in contrast, activation of APC/C is higher for the IDH1 mutant background. In short, mitosis is suppressed more in tumours with IDH1 mutation than in tumours with IDH1 wild-type. Advanced glycosylation end product receptor signalling, which regulates cell proliferation, survival, differentiation, migration, and binding of formyl peptide receptors to formyl peptides and many other ligands, thereby regulating angiogenesis, cell proliferation and anti-apoptotic activities, is also higher in tumours with IDH1 wild-type [25,26]. As a result, negatively regulated MET pathway-related genes were significantly enriched in the IDH1 mutation-rich cluster (Figure 3b). In cancer, the MET pathway plays an important role in epithelial-mesenchymal transition (EMT) and cancer stemness [27]. In gliomas, the activation of MET promotes the proliferation of tumour and reduces cell death induced by cisplatin, taxol, and gamma irradiation [28]. BMP signalling induces the activation of AKT1 and inhibits cell migration by inhibiting EMT [29]. Retrograde neurotrophin signalling activates PI3K/AKT signalling, which is strongly associated with EMT [30,31]. Foxo1 is a key mediator in ERK2-induced EMT [32]. In the IDH1 wild-type group, these regulations of EMT-associated terms were down-regulated. The proneuronal, proliferative, and mesenchymal subtypes are identified as WHO grade II and III astrocytomas, and the mesenchymal subtype has a poorer prognosis [33,34].
Unsupervised clustering revealed that mutations in IDH1, TP53, and ATRX occur simultaneously (Figure 4a). Onset of mutations in TP53 and ATRX occur earlier in life, similar to onset of the IDH1 mutation (Figure 5a,b). In a previous study, ATRX and TP53 mutations with IDH mutation were needed in glioma formation in mice model. Genetic changes of primary glioblastoma whose majority cases were IDH wild-type were mutation of TERT, TP53, and amplification of EGFR [35]. Using unsupervised clustering of gene set extracted via multi-label IG, patients were divided on the basis of TP53 and ATRX double mutation and TP53 and ATRX wild-type with IDH1 mutation (Figure 5c). PTEN regulation, negative control of transcription by E2F, and regulation of TP53 via acetylation were upregulated in the double mutation group. However, telomere extension by telomerase was promoted in the double wild-type group. Interestingly, the level of TERT expression in patients with double mutation was almost zero (Figure 6a). After separating the mutations of TP53 and ATRX, every patient with ATRX mutation showed a low level of TERT expression; however, TERT expression in patients with TP53 mutation and a grade 4 tumour did not differ from that in the wild-type patients. Recent studies have reported that TERT expression prevents extension of telomeres by alternative lengthening of telomeres (ALT), which increases loss of ATRX; conversely, decrease in TERT expression, which is linked to the hypomethylation of TERT promoter, precedes ALT in zebrafish [36,37]. Another study reported that TERT expression is downregulated in cells with ALT [38]. In short, ATRX loss resulting from ATRX mutation induces an increase in ALT and reduces TERT expression in hypomethylation of the TERT promoter. The lack of TP53 induces an increase in TERT expression [39]. ATRX and TP53 mutations differentially affect TERT expression, although we can infer that the impact of ATRX mutation is more than that of the TP53 mutation on prognosis of patients (Figure 6b). Regarding the relationship between TERT expression and ATRX mutation, we inferred that patients with ALT, which can occur due to loss of ATRX, have poorer prognosis than patients who have higher TERT expression.
EGFR signalling induces proliferation, which is one of the common events in various types of cancer [40]. EGFR fusion and deletion variants were presented in nearly half of GBM patients, and these alterations induced differential biological process and/or response to targeted inhibitor [41]. Interestingly, the occurrence of EGFR mutation increased with aging and was independent of its occurrence with IDH1, TP53, and ATRX mutations (Figure 1a, Figure 4a and Figure 7c). Unlike in patients with GBM, EGFR mutation occurred frequently in older patients with LGG. Patients with LGG harbouring EGFR mutation showed poor prognosis for both grade 2 and 3; however, EGFR mutation in GBM did not affect prognosis (Figure 7a). After conducting multi-label IG and pathway enrichment analysis, most of the related pathways were found to be involved in the regulation of the cell cycle and cell signalling. Cell-cycle related pathways were downregulated and transcriptional regulation by VENTX was upregulated in grade 3 glioma and GBM. Detoxification of reactive oxygen species and interleukin-12 (IL-12) signalling, which exert an anti-tumour effect on tumours, including glioma and glioblastoma, were downregulated in grade 3 glioma and GBM [42,43,44,45].

4. Materials and Methods

4.1. Description of TCGA Data and Entire Analysis Process

Transcriptome sequencing and clinical data of GBM and LGG were downloaded from the UCSC Xena database. The tumour statuses were LGG (n = 508) and GBMLGG (n = 657), and all the samples of the GBMLGG dataset were primary tumours (n = 657). All samples used in this study have clinical data, survival data, non-silent somatic mutation data, and transcriptomic data. The description of entire analysis process is provided as a flow chart (Figure 8).

4.2. Extraction of Candidate Somatic Mutations Related to Age

Candidate somatic mutations related to ages were selected based on a somatic mutation rate of at least 5% from somatic mutation data from multi-centre mutation calling (MC3). Somatic mutation rate is calculated by individual who has mutation/all individuals. Logistic regression analysis was performed to identify somatic mutations related to age. Bonferroni correction was conducted to correct the p-value of logistic regression. Logistic regression analysis was conducted by binomial and corrected p-value which is 0.05 and 95 percent confidence intervals. The somatic mutation rate and results of logistic regression were visualised using forest plot v 1.10 (a package in R, A Language and Environment for Statistical Computing, R Core Team, R Foundation for Statistical Computing, Vienna, Austria).

4.3. Comparing Age with Mutation Status and Grade

The relationship between non-silent somatic mutations selected by logistic regression analysis and onset age are validated by comparing age at initial pathologic diagnosis with each mutation and grade. These results are visualised by ggpubr v 0.4.0 (a package in R, A Language and Environment for Statistical Computing, R Core Team, R Foundation for Statistical Computing, Vienna, Austria).

4.4. Survival Analysis

Pairwise log-rank tests with Benjamini-Hochberg corrections were performed to compare prognoses between the groups, which were divided via agglomerative clustering with whole genes; Kaplan-Meier plots were generated in all survival analyses. Survival analysis was conducted using survival v 3.2 (a package in R, A Language and Environment for Statistical Computing, R Core Team, R Foundation for Statistical Computing, Vienna, Austria), and the survival plot was visualised using survminer v 0.4.8 (a package in R, A Language and Environment for Statistical Computing, R Core Team, R Foundation for Statistical Computing, Vienna, Austria), both of which are R packages.

4.5. Multi-Label IG Based Feature Selection

Multi-labels, based on the histological grade and presence of somatic mutations in specific genes, were allotted to each individual. IG using multi-label individual and gene-level expression data was performed using FSlector v 0.31 (a package in R, A Language and Environment for Statistical Computing, R Core Team, R Foundation for Statistical Computing, Vienna, Austria) [46,47]. IG more than 0.35 was used as the feature selection threshold for the grade-mutation statuses of IDH1, ATRX, TP53, and EGFR.

4.6. Hierarchical Clustering and Heatmap with Annotations of Information

Hierarchical clustering of patients was performed by the gene expression levels of the gene set with an IG over 0.35. Visualisation of hierarchical clustering data was performed using a Complex heatmap with annotation, which has information regarding tumour grade and genotype (mutant or wild-type) [48].

4.7. Pathway Enrichment Analysis

Reactome pathway enrichment analysis was performed using the ClueGo software, and significant pathways with Benjamini-Hochberg correction < 0.05 were extracted in Cytoscape [49]. p-values of the enriched pathways are presented as −log10 (p-value).

5. Conclusions

Mutations of IDH1, TP53, and ATRX occur in early-onset glioma, whereas EGFR mutation is associated with late-onset glioma. Interestingly, the age of patients was increased with histological grade in the presence of wild-type of every gene. In IDH1 wild-type, patients of G3 and G4 showed similar transcriptomic characteristics involved in mitotic cell cycle. Interestingly, TP53 and ATRX double mutations were predominant in IDH1 mutation and their prognosis was worse than that of double wild-type. A comparison of the transcriptomic landscape of glioma with wild-type and mutated IDH1 revealed that the cell cycle- and EMT-related terms were significantly enriched. In TP53 and ATRX double mutation, TERT expression was highly suppressed. Suppression of TERT expression was caused by ATRX mutation. In EGFR mutation, hierarchical tree was dominantly separated into LGG and GBM, but EGFR mutation status was not. Patients with EGFR mutation had the poorest prognosis, whereas those with only IDH1 mutation had the best prognosis. In IDH1 mutation, patients with the TP53 and ATRX double mutation showed poorer prognosis than those with the double wild type genotype.

Supplementary Materials

The following are available online at https://0-www-mdpi-com.brum.beds.ac.uk/article/10.3390/curroncol28030210/s1, Table S1. The results of logistic regression with gene mutations of which frequency is over 5 percent and age in the lower grade glioma. OR is odds ratio. 2.50% and 97.50% is boundary value of 95 percent confidence interval. Table S2. The results of logistic regression with gene mutations of which frequency is over 5 percent and age in the glioblastoma. OR is odds ratio. 2.50% and 97.50% is boundary value of 95 percent confidence interval. Table S3. The position of mutation. Table S4. Multiple logistic regression analysis between age and age-dependent somatic mutations with adjusted gender and KPS. Table S5. The log-rank p-value in Grade and IDH1 mutation. Grade compares groups of IDH1 mutation and IDH1 wild-type in each grade. Mutation compares groups of grades in IDH1 mutation and IDH1 wild-type. Table S6. The results of multi-label feature selection information gain of IDH1 and grade. Table S7. The proportion of patients divided by mutation status. The mutation status information is suggested as IDH1-TP53-ATRX-EGFR. WT is wild-type. MT is mutation. Table S8. The log-rank p-value in each four age-related mutation. OS is overall survival. PFI is progression free interval. Table S9. The results of multi-label feature selection information gain of ATRX, TP53, and grade. Table S10. The results of multi-label feature selection information gain of EGFR and grade.

Author Contributions

Y.P., J.P. and J.L. contributed to the study conceptualisation, study analysis, manuscript writing with the feedback from S.-H.H. and K.S.S., Y.P., J.P., J.W.A., S.K. and J.M.S. processed genome data curation for public data base and performed bioinformatic analyses. S.J.K. assisted in visualisation and genome data curation. S.J.H., S.-H.H., K.S.S. and J.L. contributed to clinical data interpretation. J.L. and K.S.S. supervised the entire project and approved the final manuscript submission. All authors have read and agreed to the published version of the manuscript.

Funding

Basic Science Research Program through the National Research Foundation of Korea (NRF), funded by the Korea Government (MSIT) (Grant No. 2018R1C1B5086460).

Institutional Review Board Statement

We used public data from TCGA (https://xenabrowser.net/, accessed on 6 August 2020) in this study, so not applicable.

Informed Consent Statement

We used public data from TCGA (https://xenabrowser.net/, accessed on 6 August 2020) in this study, so not applicable.

Data Availability Statement

The data used in this study can find at https://xenabrowser.net/ (accessed on 6 August 2020).

Acknowledgments

The authors thank the National Research Foundation of Korea (NRF).

Conflicts of Interest

The authors declare no conflict of interest.

References

  1. Goodenberger, M.L.; Jenkins, R.B. Genetics of adult glioma. Cancer Genet. 2012, 205, 613–621. [Google Scholar] [CrossRef]
  2. Friedman, H.S.; Kerby, T.; Calvert, H. Temozolomide and treatment of malignant glioma. Clin. Cancer Res. 2000, 6, 2585–2597. [Google Scholar]
  3. Ceccarelli, M.; Barthel, F.P.; Malta, T.M.; Sabedot, T.S.; Salama, S.R.; Murray, B.A.; Morozova, O.; Newton, Y.; Radenbaugh, A.; Pagnotta, S.M. Molecular profiling reveals biologically discrete subsets and pathways of progression in diffuse glioma. Cell 2016, 164, 550–563. [Google Scholar] [CrossRef] [Green Version]
  4. Clarke, J.; Butowski, N.; Chang, S. Recent advances in therapy for glioblastoma. Arch. Neurol. 2010, 67, 279–283. [Google Scholar] [CrossRef] [Green Version]
  5. White, M.C.; Holman, D.M.; Boehm, J.E.; Peipins, L.A.; Grossman, M.; Henley, S.J. Age and cancer risk: A potentially modifiable relationship. Am. J. Prev. Med. 2014, 46, S7–S15. [Google Scholar] [CrossRef] [Green Version]
  6. Vijg, J. Somatic mutations, genome mosaicism, cancer and aging. Curr. Opin. Genet. Dev. 2014, 26, 141–149. [Google Scholar] [CrossRef] [Green Version]
  7. Martincorena, I.; Campbell, P.J. Somatic mutation in cancer and normal cells. Science 2015, 349, 1483–1489. [Google Scholar] [CrossRef]
  8. Yates, L.R.; Campbell, P.J. Evolution of the cancer genome. Nat. Rev. Genet. 2012, 13, 795–806. [Google Scholar] [CrossRef] [Green Version]
  9. Verhaak, R.G.; Hoadley, K.A.; Purdom, E.; Wang, V.; Qi, Y.; Wilkerson, M.D.; Miller, C.R.; Ding, L.; Golub, T.; Mesirov, J.P.; et al. Integrated genomic analysis identifies clinically relevant subtypes of glioblastoma characterized by abnormalities in PDGFRA, IDH1, EGFR, and NF1. Cancer Cell 2010, 17, 98–110. [Google Scholar] [CrossRef] [Green Version]
  10. Louis, D.N.; Perry, A.; Reifenberger, G.; von Deimling, A.; Figarella-Branger, D.; Cavenee, W.K.; Ohgaki, H.; Wiestler, O.D.; Kleihues, P.; Ellison, D.W. The 2016 World Health Organization classification of tumors of the central nervous system: A summary. Acta Neuropathol. 2016, 131, 803–820. [Google Scholar] [CrossRef] [Green Version]
  11. Ohgaki, H.; Kleihues, P. The definition of primary and secondary glioblastoma. Clin. Cancer Res. 2013, 19, 764–772. [Google Scholar] [CrossRef] [Green Version]
  12. Jean-Quartier, C.; Jeanquartier, F.; Ridvan, A.; Kargl, M.; Mirza, T.; Stangl, T.; Markaĉ, R.; Jurada, M.; Holzinger, A. Mutation-based clustering and classification analysis reveals distinctive age groups and age-related biomarkers for glioma. BMC Med Inform. Decis. Mak. 2021, 21, 1–14. [Google Scholar] [CrossRef] [PubMed]
  13. Greenman, C.; Stephens, P.; Smith, R.; Dalgliesh, G.L.; Hunter, C.; Bignell, G.; Davies, H.; Teague, J.; Butler, A.; Stevens, C. Patterns of somatic mutation in human cancer genomes. Nature 2007, 446, 153–158. [Google Scholar] [CrossRef] [PubMed] [Green Version]
  14. Grist, S.; McCarron, M.; Kutlaca, A.; Turner, D.; Morley, A. In vivo human somatic mutation: Frequency and spectrum with age. Mutat. Res. Fundam. Mol. Mech. Mutagenesis 1992, 266, 189–196. [Google Scholar] [CrossRef]
  15. Modrek, A.S.; Golub, D.; Khan, T.; Bready, D.; Prado, J.; Bowman, C.; Deng, J.; Zhang, G.; Rocha, P.P.; Raviram, R. Low-grade astrocytoma mutations in IDH1, P53, and ATRX cooperate to block differentiation of human neural stem cells via repression of SOX2. Cell Rep. 2017, 21, 1267–1280. [Google Scholar] [CrossRef]
  16. Mu, L.; Long, Y.; Yang, C.; Jin, L.; Tao, H.; Ge, H.; Chang, Y.E.; Karachi, A.; Kubilis, P.S.; De Leon, G. The IDH1 mutation-induced oncometabolite, 2-hydroxyglutarate, may affect DNA methylation and expression of PD-L1 in gliomas. Front. Mol. Neurosci. 2018, 11, 82. [Google Scholar] [CrossRef] [PubMed] [Green Version]
  17. Nicolas-Boluda, A.; Vaquero, J.; Barrin, S.; Kantari-Mimoun, C.; Ponzo, M.; Renault, G.; Deptula, P.; Pogoda, K.; Bucki, R.; Cascone, I.; et al. Tumor stiffening reversion through collagen crosslinking inhibition improves T cell migration and anti-PD-1 treatment. BioRxiv 2020. [Google Scholar] [CrossRef]
  18. Kwaan, H.C.; Lindholm, P.F. Fibrin and fibrinolysis in cancer. Semin. Thromb. Hemost. 2019, 45, 413–422. [Google Scholar] [CrossRef]
  19. Melrose, J. Keratan sulfate (KS)-proteoglycans and neuronal regulation in health and disease: The importance of KS-glycodynamics and interactive capability with neuroregulatory ligands. J. Neurochem. 2019, 149, 170–194. [Google Scholar] [CrossRef] [Green Version]
  20. O’regan, L.; Blot, J.; Fry, A.M. Mitotic regulation by NIMA-related kinases. Cell Div. 2007, 2, 1–12. [Google Scholar] [CrossRef] [Green Version]
  21. Osmani, S.A.; Pu, R.T.; Morris, N.R. Mitotic induction and maintenance by overexpression of a G2-specific gene that encodes a potential protein kinase. Cell 1988, 53, 237–244. [Google Scholar] [CrossRef]
  22. Machida, Y.J.; Dutta, A. The APC/C inhibitor, Emi1, is essential for prevention of rereplication. Genes Dev. 2007, 21, 184–194. [Google Scholar] [CrossRef] [Green Version]
  23. Qiao, R.; Weissmann, F.; Yamaguchi, M.; Brown, N.G.; VanderLinden, R.; Imre, R.; Jarvis, M.A.; Brunner, M.R.; Davidson, I.F.; Litos, G. Mechanism of APC/CCDC20 activation by mitotic phosphorylation. Proc. Natl. Acad. Sci. USA 2016, 113, E2570–E2578. [Google Scholar] [CrossRef] [Green Version]
  24. Boekhout, M.; Wolthuis, R. Nek2A destruction marks APC/C activation at the prophase-to-prometaphase transition by spindle-checkpoint-restricted Cdc20. J. Cell Sci. 2015, 128, 1639–1653. [Google Scholar] [CrossRef] [Green Version]
  25. Huang, J.S.; Guh, J.Y.; Chen, H.C.; Hung, W.C.; Lai, Y.H.; Chuang, L.Y. Role of receptor for advanced glycation end-product (RAGE) and the JAK/STAT-signaling pathway in AGE-induced collagen production in NRK-49F cells. J. Cell. Biochem. 2001, 81, 102–113. [Google Scholar] [CrossRef]
  26. Cattaneo, F.; Guerra, G.; Ammendola, R. Expression and signaling of formyl-peptide receptors in the brain. Neurochem. Res. 2010, 35, 2018–2026. [Google Scholar] [CrossRef] [PubMed]
  27. Jeon, H.-M.; Lee, J. MET: Roles in epithelial-mesenchymal transition and cancer stemness. Ann. Transl. Med. 2017, 5. [Google Scholar] [CrossRef] [PubMed] [Green Version]
  28. Li, Y.; Lal, B.; Kwon, S.; Fan, X.; Saldanha, U.; Reznik, T.E.; Kuchner, E.B.; Eberhart, C.; Laterra, J.; Abounader, R. The scatter factor/hepatocyte growth factor: C-met pathway in human embryonal central nervous system tumor malignancy. Cancer Res. 2005, 65, 9355–9362. [Google Scholar] [CrossRef] [Green Version]
  29. Gao, S.P.; Kiliti, A.J.; Zhang, K.; Vasani, N.; Mao, N.; Jordan, E.; Wise, H.C.; Bhattarai, T.S.; Hu, W.; Dorso, M. AKT1 E17K inhibits cancer cell migration by abrogating β-catenin signaling. Mol. Cancer Res. 2021, 19, 573–584. [Google Scholar] [CrossRef] [PubMed]
  30. Ginty, D.D.; Segal, R.A. Retrograde neurotrophin signaling: Trk-ing along the axon. Curr. Opin. Neurobiol. 2002, 12, 268–274. [Google Scholar] [CrossRef]
  31. Xu, W.; Yang, Z.; Lu, N. A new role for the PI3K/Akt signaling pathway in the epithelial-mesenchymal transition. Cell Adhes. Migr. 2015, 9, 317–324. [Google Scholar] [CrossRef] [Green Version]
  32. Shin, S.; Buel, G.R.; Nagiec, M.J.; Han, M.-J.; Roux, P.P.; Blenis, J.; Yoon, S.-O. ERK2 regulates epithelial-to-mesenchymal plasticity through DOCK10-dependent Rac1/FoxO1 activation. Proc. Natl. Acad. Sci. USA 2019, 116, 2967–2976. [Google Scholar] [CrossRef] [PubMed] [Green Version]
  33. Mellai, M.; Caldera, V.; Annovazzi, L.; Schiffer, D. The distribution and significance of IDH mutations in gliomas. In Evolution of the Molecular Biology of Brain Tumors and Therapeutic Implications; InTech: London, UK, 2013; pp. 299–342. [Google Scholar]
  34. Phillips, H.S.; Kharbanda, S.; Chen, R.; Forrest, W.F.; Soriano, R.H.; Wu, T.D.; Misra, A.; Nigro, J.M.; Colman, H.; Soroceanu, L. Molecular subclasses of high-grade glioma predict prognosis, delineate a pattern of disease progression, and resemble stages in neurogenesis. Cancer Cell 2006, 9, 157–173. [Google Scholar] [CrossRef] [PubMed] [Green Version]
  35. Jovčevska, I. Sequencing the next generation of glioblastomas. Crit. Rev. Clin. Lab. Sci. 2018, 55, 264–282. [Google Scholar] [CrossRef] [PubMed]
  36. Oppel, F.; Tao, T.; Shi, H.; Ross, K.N.; Zimmerman, M.W.; He, S.; Tong, G.; Aster, J.C.; Look, A.T. Loss of atrx cooperates with p53-deficiency to promote the development of sarcomas and other malignancies. PLoS Genet. 2019, 15, e1008039. [Google Scholar] [CrossRef] [PubMed] [Green Version]
  37. Idilli, A.I.; Cusanelli, E.; Pagani, F.; Berardinelli, F.; Bernabé, M.; Cayuela, M.L.; Poliani, P.L.; Mione, M.C. Expression of tert prevents ALT in zebrafish brain tumors. Front. Cell Dev. Biol. 2020, 8, 65. [Google Scholar] [CrossRef]
  38. Lafferty-Whyte, K.; Cairney, C.J.; Will, M.B.; Serakinci, N.; Daidone, M.-G.; Zaffaroni, N.; Bilsland, A.; Keith, W.N. A gene expression signature classifying telomerase and ALT immortalization reveals an hTERT regulatory network and suggests a mesenchymal stem cell origin for ALT. Oncogene 2009, 28, 3765–3774. [Google Scholar] [CrossRef] [Green Version]
  39. Chen, R.-J.; Wu, P.-H.; Ho, C.-T.; Way, T.-D.; Pan, M.-H.; Chen, H.-M.; Ho, Y.-S.; Wang, Y.-J. P53-dependent downregulation of hTERT protein expression and telomerase activity induces senescence in lung cancer cells as a result of pterostilbene treatment. Cell Death Dis. 2017, 8, e2985. [Google Scholar] [CrossRef] [Green Version]
  40. Hatanpaa, K.J.; Burma, S.; Zhao, D.; Habib, A.A. Epidermal growth factor receptor in glioma: Signal transduction, neuropathology, imaging, and radioresistance. Neoplasia 2010, 12, 675–684. [Google Scholar] [CrossRef] [PubMed] [Green Version]
  41. Brennan, C.W.; Verhaak, R.G.; McKenna, A.; Campos, B.; Noushmehr, H.; Salama, S.R.; Zheng, S.; Chakravarty, D.; Sanborn, J.Z.; Berman, S.H. The somatic genomic landscape of glioblastoma. Cell 2013, 155, 462–477. [Google Scholar] [CrossRef] [PubMed]
  42. Liou, G.-Y.; Storz, P. Reactive oxygen species in cancer. Free Radic. Res. 2010, 44, 479–496. [Google Scholar] [CrossRef] [PubMed] [Green Version]
  43. Singer, E.; Judkins, J.; Salomonis, N.; Matlaf, L.; Soteropoulos, P.; McAllister, S.; Soroceanu, L. Reactive oxygen species-mediated therapeutic response and resistance in glioblastoma. Cell Death Dis. 2015, 6, e1601. [Google Scholar] [CrossRef] [PubMed] [Green Version]
  44. Kim, S.H.; Kwon, C.H.; Nakano, I. Detoxification of oxidative stress in glioma stem cells: Mechanism, clinical relevance, and therapeutic development. J. Neurosci. Res. 2014, 92, 1419–1424. [Google Scholar] [CrossRef] [PubMed]
  45. Weiss, T.; Puca, E.; Silginer, M.; Hemmerle, T.; Pazahr, S.; Bink, A.; Weller, M.; Neri, D.; Roth, P. Immunocytokines are a promising immunotherapeutic approach against glioblastoma. Sci. Transl. Med. 2020, 12. [Google Scholar] [CrossRef]
  46. Cheng, T.; Wang, Y.; Bryant, S.H. FSelector: A Ruby gem for feature selection. Bioinformatics 2012, 28, 2851–2852. [Google Scholar] [CrossRef] [Green Version]
  47. Romanski, P.; Kotthoff, L.; Kotthoff, M.L. Package ‘FSelector’. 2013. Available online: http://cran/r-project.org/web/packages/FSelector/index.html (accessed on 12 September 2020).
  48. Gu, Z.; Eils, R.; Schlesner, M. Complex heatmaps reveal patterns and correlations in multidimensional genomic data. Bioinformatics 2016, 32, 2847–2849. [Google Scholar] [CrossRef] [Green Version]
  49. Bindea, G.; Mlecnik, B.; Hackl, H.; Charoentong, P.; Tosolini, M.; Kirilovsky, A.; Fridman, W.-H.; Pagès, F.; Trajanoski, Z.; Galon, J. ClueGO: A Cytoscape plug-in to decipher functionally grouped gene ontology and pathway annotation networks. Bioinformatics 2009, 25, 1091–1093. [Google Scholar] [CrossRef] [Green Version]
Figure 1. Frequencies of mutated and wild-type genes and logistic regression results showing the relationship of mutations with age in patients with lower grade glioma (a) and glioblastoma (b). Genes shown have mutation rates >5%. OR, odds ratio; *, significant.
Curroncol 28 00210 g001
Figure 2. Comparison of tumour grades of patients with IDH1 wild-type and IDH1 mutation with respect to age at initial pathologic diagnosis. p-value <0.0001 are indicated by ****. ns is not significant (a). Survival analysis comparing patients with IDH1 wild-type or IDH1 mutation in each tumour grade. 0 indicates wild-type; 1 indicates mutation. Time up to which 50% patients survived is shown by the dotted line in every type. The unit of overall survival (OS) time is day (b).
Curroncol 28 00210 g002
Figure 3. Heatmap with hierarchical tree of patients by gene expression pattern with information gain (IG) over 0.35. The top annotations show tumour grade and mutation status (IDH1 mutant or wild-type). WT indicates wild-type; MT indicates mutation (a). Statistically significant results of the pathway enrichment analysis of gene clusters in the IDH1 hierarchical group (b).
Curroncol 28 00210 g003
Figure 4. Mutational patterns of IDH1, TP53, ATRX, and EGFR in the hierarchical tree (a). Survival analysis of patients with mutant or wild-type genes in terms of overall survival and progression-free survival (b). 0 indicates wild-type; 1 indicates mutation.
Curroncol 28 00210 g004
Figure 5. Comparison of patients harbouring ATRX and TP53 wild-type and mutation with age of glioma onset at initial pathological diagnosis in the background of IDH1 mutation. p-values less than 0.001 and 0.0001 are shown by *** and ****, respectively. As the number of glioblastoma (GBM) patients with IDH1 mutation is few, GBM is excepted in analysis (a,b). Heatmap with the hierarchical tree of patients by gene expression pattern with information gain (IG) over 0.35. The top annotations show the grade and mutational status (mutant or wild-type) of ATRX and TP53. WT indicates wild-type; MT indicates mutation (c). Statistically significant results of pathway enrichment analysis of gene clusters in the ATRX and TP53 hierarchical group (d).
Curroncol 28 00210 g005
Figure 6. Variation in TERT expression level with the mutation statuses of ATRX and TP53 in tumours with IDH1 mutation (a). TERT expression level in tumours with IDH1 mutation with separated mutation statuses of ATRX and TP53 for each grade. WT indicates wild-type; MT indicates mutation. p-values < 0.0001 are shown as ****. ns is not significant (b).
Curroncol 28 00210 g006
Figure 7. Comparison of ages at initial pathological diagnosis of tumours with EGFR wild-type and those with EGFR. p-values <0.0001 are shown as ****. p-values <0.01 are shown as **. ns is not significant (a). Survival analysis comparing EGFR mutant or wild-type and each grade with overall survival. 0 indicates wild-type; 1 indicates mutation. The unit of overall survival time is day (b). Heatmap with hierarchical tree of patients based on gene expression pattern with IG over 0.35. Top annotations show tumour grade and genotype (mutant or wild-type) of EGFR. WT indicates wild-type; MT indicates mutation (c). Statistically significant results of pathway enrichment analysis of gene clusters in the EGFR hierarchical group (d).
Curroncol 28 00210 g007
Figure 8. The flow chart of entire process of analysis.
Curroncol 28 00210 g008
Publisher’s Note: MDPI stays neutral with regard to jurisdictional claims in published maps and institutional affiliations.

