Article

Lichen Responses to Disturbance: Clues for Biomonitoring Land-use Effects on Riparian Andean Ecosystems

by
Leiddy Chuquimarca
1,
Fernando P. Gaona
2,3,
Carlos Iñiguez-Armijos
1,2 and
Ángel Benítez
1,*
1
Sección de Ecología y Sistemática, Departamento de Ciencias Biológicas, Universidad Técnica Particular de Loja, San Cayetano s/n, 1101608 Loja, Ecuador
2
Laboratorio de Ecología Tropical y Servicios Ecosistémicos (EcoSs-Lab), Universidad Técnica Particular de Loja, San Cayetano s/n, 1101608 Loja, Ecuador
3
Maestría en Biología de la Conservación y Ecología Tropical, Universidad Técnica Particular de Loja, San Cayetano s/n, 1101608 Loja, Ecuador
*
Author to whom correspondence should be addressed.
Submission received: 4 April 2019 / Revised: 23 April 2019 / Accepted: 27 April 2019 / Published: 5 May 2019
(This article belongs to the Special Issue Lichen Diversity and Biomonitoring)

Abstract

:
The transformation of natural ecosystems due to anthropogenic land use is considered one of the main causes of biodiversity loss. Lichens, due to their poikilohydric nature, are very sensitive to natural and anthropogenic disturbances. Therefore, lichen communities have been widely used as bioindicators of climatic and environmental changes. In this study, we evaluated how the species richness and community composition of epiphytic lichens respond to land-use intensity in riparian ecosystems of the Andes in southern Ecuador. Additionally, we evaluate how the richness of six functional traits (photobiont type, growth form, and reproductive strategy) changed across the different land-use intensity. We selected 10 trees in twelve sites for a total de 120 trees, equally divided into four riparian land-use intensities (forest, forest-pasture, pasture and urban). We recorded a total of 140 lichen species. Species richness was highest in the forest sites and decreased towards more anthropogenic land uses. Lichen community composition responded to land-use intensity, and was explained by microclimate variables (e.g., precipitation, percentage forested area) and distance to the forest. Richness of functional traits of lichens also differed significantly among the four land-use intensity and decreased from forests to urban land-use. Taxonomic diversity and functional traits can be effectively applied as bioindicators to assess and monitor the effects of land-use changes in the riparian ecosystems of tropical montane regions.

1. Introduction

Ecosystem transformation due to anthropogenic disturbances such as land-use change is considered one of the main drivers of biodiversity loss [1,2,3,4]. Several studies state that current land-use practices will generate major impacts on the structure and functioning of ecosystems at different geographic scales [5,6,7], modifying biotic and abiotic conditions, increasing replacement rates and affecting local extinction [4,5,6,7,8]. Most of the tropical primary forests (e.g., montane Andean forests) were transformed to secondary forests, pastures, cropland, and urbanized areas to satisfy human needs [2,6,9]. In consequence, the diversity of plants, lichens, birds, arthropods, fish, reptiles and mammals has been diminished because of land use [4,10,11,12].
Epiphytic lichens are an essential component of tropical humid forests because of their important role in water and nutrient cycles [13]. Therefore, they are key organisms facilitating crucial ecosystem processes [10,14,15]. Epiphytic lichens are poikilohydric, thus they lack an active regulation of the loss and absorption of water [16], which in turn increases their sensitivity to environmental disturbances [17,18]. For these reasons, several biological traits of lichens as such as photobiont type, growth, reproduction, and development can be affected by environmental changes [19,20,21,22]. In this manner, these functional traits can be used as a complementary approach to better understand ecosystems because they allow us to assess the biodiversity and their relationship with ecosystem functioning [23,24].
As a general pattern, microclimatic variables (e.g., light, humidity, and temperature) that change in response to ecosystem transformation have been considered as constraining factors over the taxonomic and functional diversity of epiphytic lichens [21,25]. Therefore, several studies have used both taxonomic and functional diversity (e.g., richness of each functional trait) as indicators of land-use change [20,22,26,27], forest disturbance [14,21,28], global warming [29] and air quality [19,30,31,32].
In temperate ecosystems, most of the research has been focused on assessing the effects of different land uses on taxonomic and functional diversity of lichens [5,20,26,27]. Whereas in the tropics, studies have been restricted to determine the effects of disturbance and atmospheric pollution on lichen diversity [21,25,33,34]. This research is the first in Ecuador to quantify the response of taxonomic diversity and functional traits of epiphytic lichens to different land-use intensities along the riparian ecosystems of southern Andean streams. This area is affected by rapid forest transformation [9,35] and its riparian zones present a high degree of alteration [12,36,37]. Furthermore, we demonstrate, as in other regions (e.g., [20]), the complementary application of lichen’s taxonomic and functional traits to detect and monitor changes in the structure and functioning of tropical Andean ecosystems. We predicted that intensive land-use can decrease the taxonomical diversity of species (richness and composition) and functional traits, and that these changes are related to alterations in the microclimate. Specifically, we addressed the following questions: 1) how does the species richness and community composition respond to land-use intensity? And 2) how does the richness of each functional trait respond to land-use intensity?

2. Materials and Methods
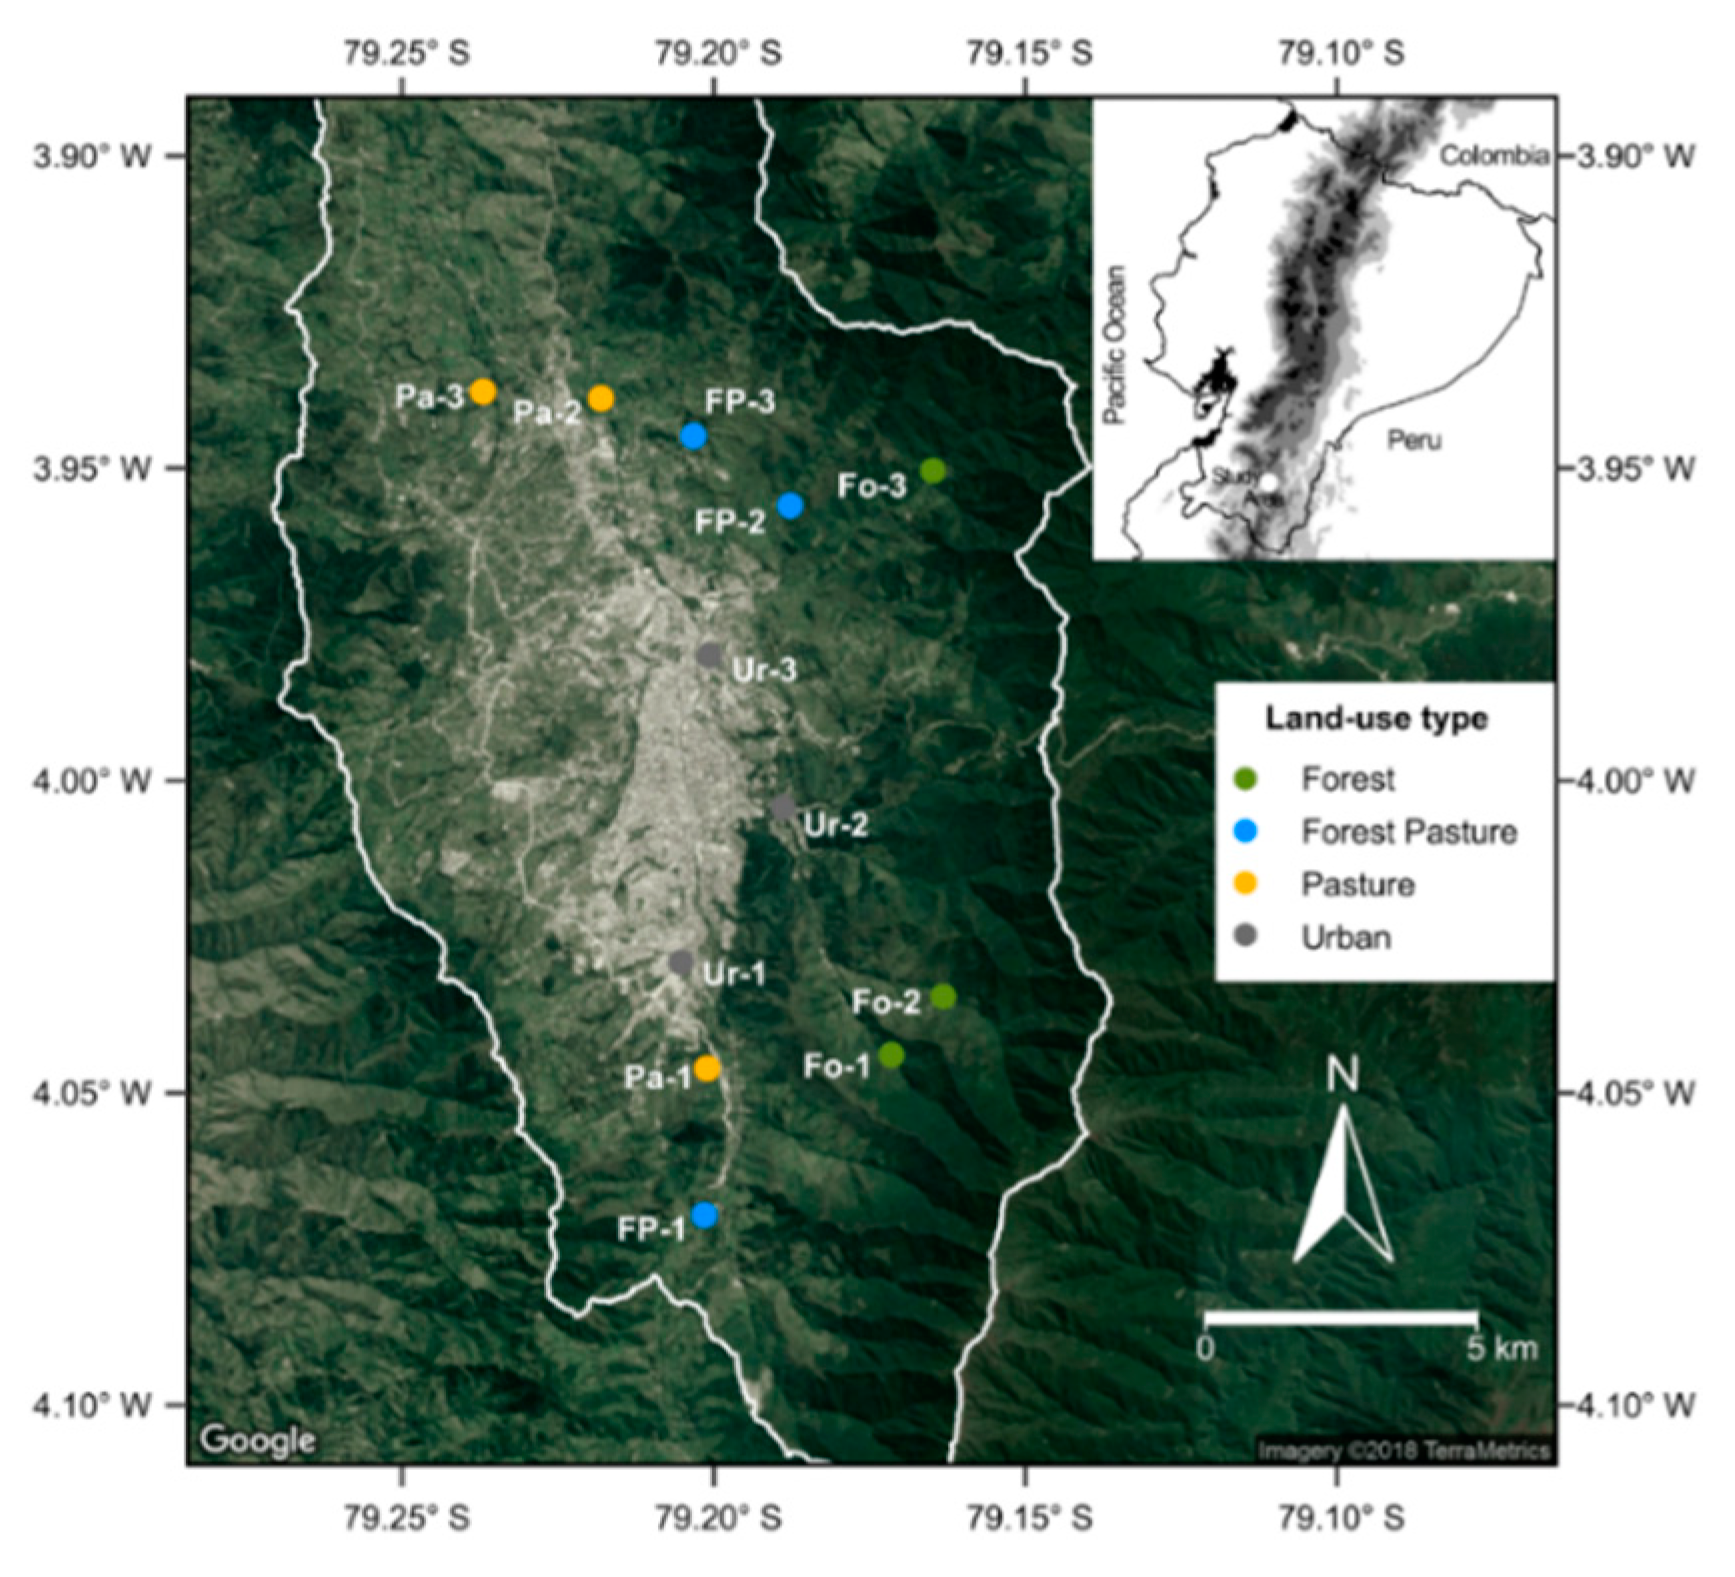
2.1. Study Area

This study was conducted around the city of Loja (180,000 inhabitants) in the southern Ecuadorian Andes, at altitudes between 2200 and 2400 masl (Figure 1). The climate is humid tropical with a mean annual temperature between 7–20 °C, and annual rainfall between 800–2500 mm [38].
Since the 1960s, these native forests have been transformed into agricultural and urbanized land [31,36,37]. In this study, we distinguished four different land uses, i.e., forest, a combination of forest and pasture, pasture, and urban land use, where we established 12 sampling sites located in riparian margins influenced by those land uses mentioned before. Forest sites (Fo) are characterized by a dense canopy layer of evergreen montane tropical vegetation (ca. 72%–78% coverage). The upper canopy is composed of native trees of the genera Croton, Hedyosmum, Clusia, Morella, and Juglans. Forest-Pasture sites (FP) are characterized by a semidense canopy layer (ca. 52%–60% coverage). The disturbed forests are mixed with pastures dominated by planted trees of Alnus acuminata and Eucalyptus globulus. Pasture sites (Pa) are affected by deforestation. The canopy layer is ca. 31%–34% in coverage, mainly composed of planted trees of the genera Inga and Eucalyptus. Urban sites (Ur) are characterized by a very uniform structure and dominate sections of grassland with planted trees of Salix spp. The open canopy layer is ca. 31%–34% in coverage.

2.2. Data Collection

In each site (n = 12), we selected 10 mature trees with similar bark structure and diameter at breast height (DBH) over 20 cm within each site (120 trees total). They were selected about five meters from the river bank. We determined the occurrence of epiphytic lichens on 120 trees in total (10 trees per site). We used 20 × 50 cm quadrat on the bark of each selected tree, at the cardinal point with the most lichen abundance to 1.5 m above the ground. The sampling quadrat (20 × 50 cm) was divided into ten grids of a 10 cm × 10 cm, and the cover of each species in each grid was estimated as the proportion of the ten grids occupied by it. Lichen species cover was used as a surrogate of species abundance. For species identification, we used taxonomic and floristic papers [39,40,41,42]. In addition, we tested for specific secondary compounds using spot tests based on thallus fluorescence under ultraviolet light, with K (10% water solution of potassium hydroxide), Cl (bleach) and para-phenylenediamine (Pd). For the nomenclature of the species we followed mainly MycoBank. Finally, the specimens are stored in the Herbarium of Universidad Técnica Particular de Loja (HUTPL).
We evaluated six traits to perform the analysis of functional traits: (1) photobiont type; (2) growth form; (3) size; (4) reproduction type; (5) type of reproductive structure; and (6) thallus color (Table 1). The functional traits were selected based on previous studies, due to their relation to ecosystem functioning and land uses [5,19,21,22,25]. For instance, photobiont type and growth form (thallus morphology) are related with light, temperature and water requirements for the processes of photosynthesis and respiration [23,43,44,45], and with water uptake and loss [21,44]. Finally, reproductive strategy and reproductive structure are related to dispersion ability and establishment [22,25].

2.3. Environmental Variables

We quantified aerial forests cover (%) for each site from a 2016 land uses map obtained in other study from high-resolution (0.30–2 m) imagery (pers. comm.). Land use was classified into forest, pasture, crops, urban, bare surface. In a GIS, we extracted the land use information for all sites, and the area (m2 and %) covered by forest was calculated. Also, we calculated the distance to forests for each site. Forest cover and distance to forests were obtained using the open source GIS software Quantum GIS 1.7.4 (QGIS). Light conditions were recorded by measuring canopy openness (%) using four digital hemispherical photographs per site. Digital photographs were always taken on overcast days and at breast height (1.3 meter), with a horizontally leveled digital camera and using a fish-eye lens. Photographs were analyzed using the software Gap Light Analyzer ver. 2.0 [46]. In addition, the following variables were measured: mean precipitation (mm) from the interpolated data of the meteorological stations located around the study area and tree diameter (DBH).

2.4. Data Analysis

Species richness of epiphytic lichens was defined as the total number of species found in each tree. We calculated sampling completeness with the rarefaction curves (95 % confidence intervals) and the Chao 2 species richness estimator. For the calculation of the rarefaction curves and species richness estimators, we used the R package ‘vegan’. Similarly, the species richness of each functional trait category was calculated as the total number of species with each trait category found in each tree. Thus, the effects of land use, % forests, distance to forest, precipitation, DBH and tree high on the species richness and the richness of each functional trait at the tree level were modeled by generalized linear mixed models (GLMMs) using Poisson distribution [47]. This modeling approach was chosen because our data present a hierarchical structure with sites nested within land use and trees nested within sites. Predictors were included as explanatory variables (fixed factors), and sites were included as random sources of variation. We used a logistic transformation for canopy openness and % forests variables [48]. Following this, we performed a stepwise best-model selection using a stepwise regression backwards, with predictors variables scaled and centered (mean = 0, SD = 1). Canopy openness was omitted in the model selection due to collinearity with % forests and precipitation. For GLMMs, the minimal adequate model was selected based on Akaike’s Information Criterion (AIC) provided for the model selection procedure. We used the package ‘nlme’ with lme function [49] for the mixed-effect model analyses in R environment [50].
Shifts in lichen species composition were evaluated through a canonical correspondence analysis (CCA) based on chi-square distances. CCA analysis was applied to an abundance matrix square-root transformed. Land-use intensity was established as the covariate and remaining variables were used as explicative variables. Prior to the analysis, we applied a logistic transformation to explanatory variables % forest and distance to the forest; and a square-root transformation to precipitation.
Variation in lichen species composition at the tree level in relation with measured environmental variables was explored by constrained ordinations [51]. As the first step, our data set (120 trees × 140 species) was subjected to a detrended correspondence analysis (DCA) to determine the most appropriate constrained ordination. Due to the length of the first DCA axis was 7.84 standard deviation units, we used a canonical correspondence analysis (CCA) to test the null hypothesis that species composition is independent of environmental variables [52]. CCA analyses were conducted between environmental variables and the epiphytic lichens abundances (square-root transformed). Land-use intensity was established as a covariate and remaining variables were used as explicative variables. Prior to the analysis, we applied a logistic transformation to explanatory variables % forest and distance to a forest; and a square-root transformation to precipitation. The model selection for the ordination was determined with a stepwise procedure based on a permutation test (using the ordistep function and 999 permutations). Then, the significance of explanatory variables on ordination was evaluated with ANOVA-like permutation test for Canonical Correspondence Analysis (using anova.cca function and 999 permutations). Additionally, the Pearson correlation coefficient of the explanatory continuous variables with the first two axes of the ordination (CCA1 and CCA2) was calculated. Also, in order to identify characteristic species in each ordination axis and relate them to predictor variables, we extracted the scores of the lichen species that were found at the end of the axes. For ordination analysis we used the ‘vegan3d’ package [53].
The IndVal function in the labdsv package [54] were used for indicator species analysis (ISA) [55] to determine individual species that are mainly associated with one land-use intensity. The indicator value ranges from 0 (one species was absent from one land-use intensity) to 1 (one species occurred in all trees of one land-use intensity and was absent from other trees). The significance was tested using a Monte Carlo permutation test with 1000 replicates.

3. Results

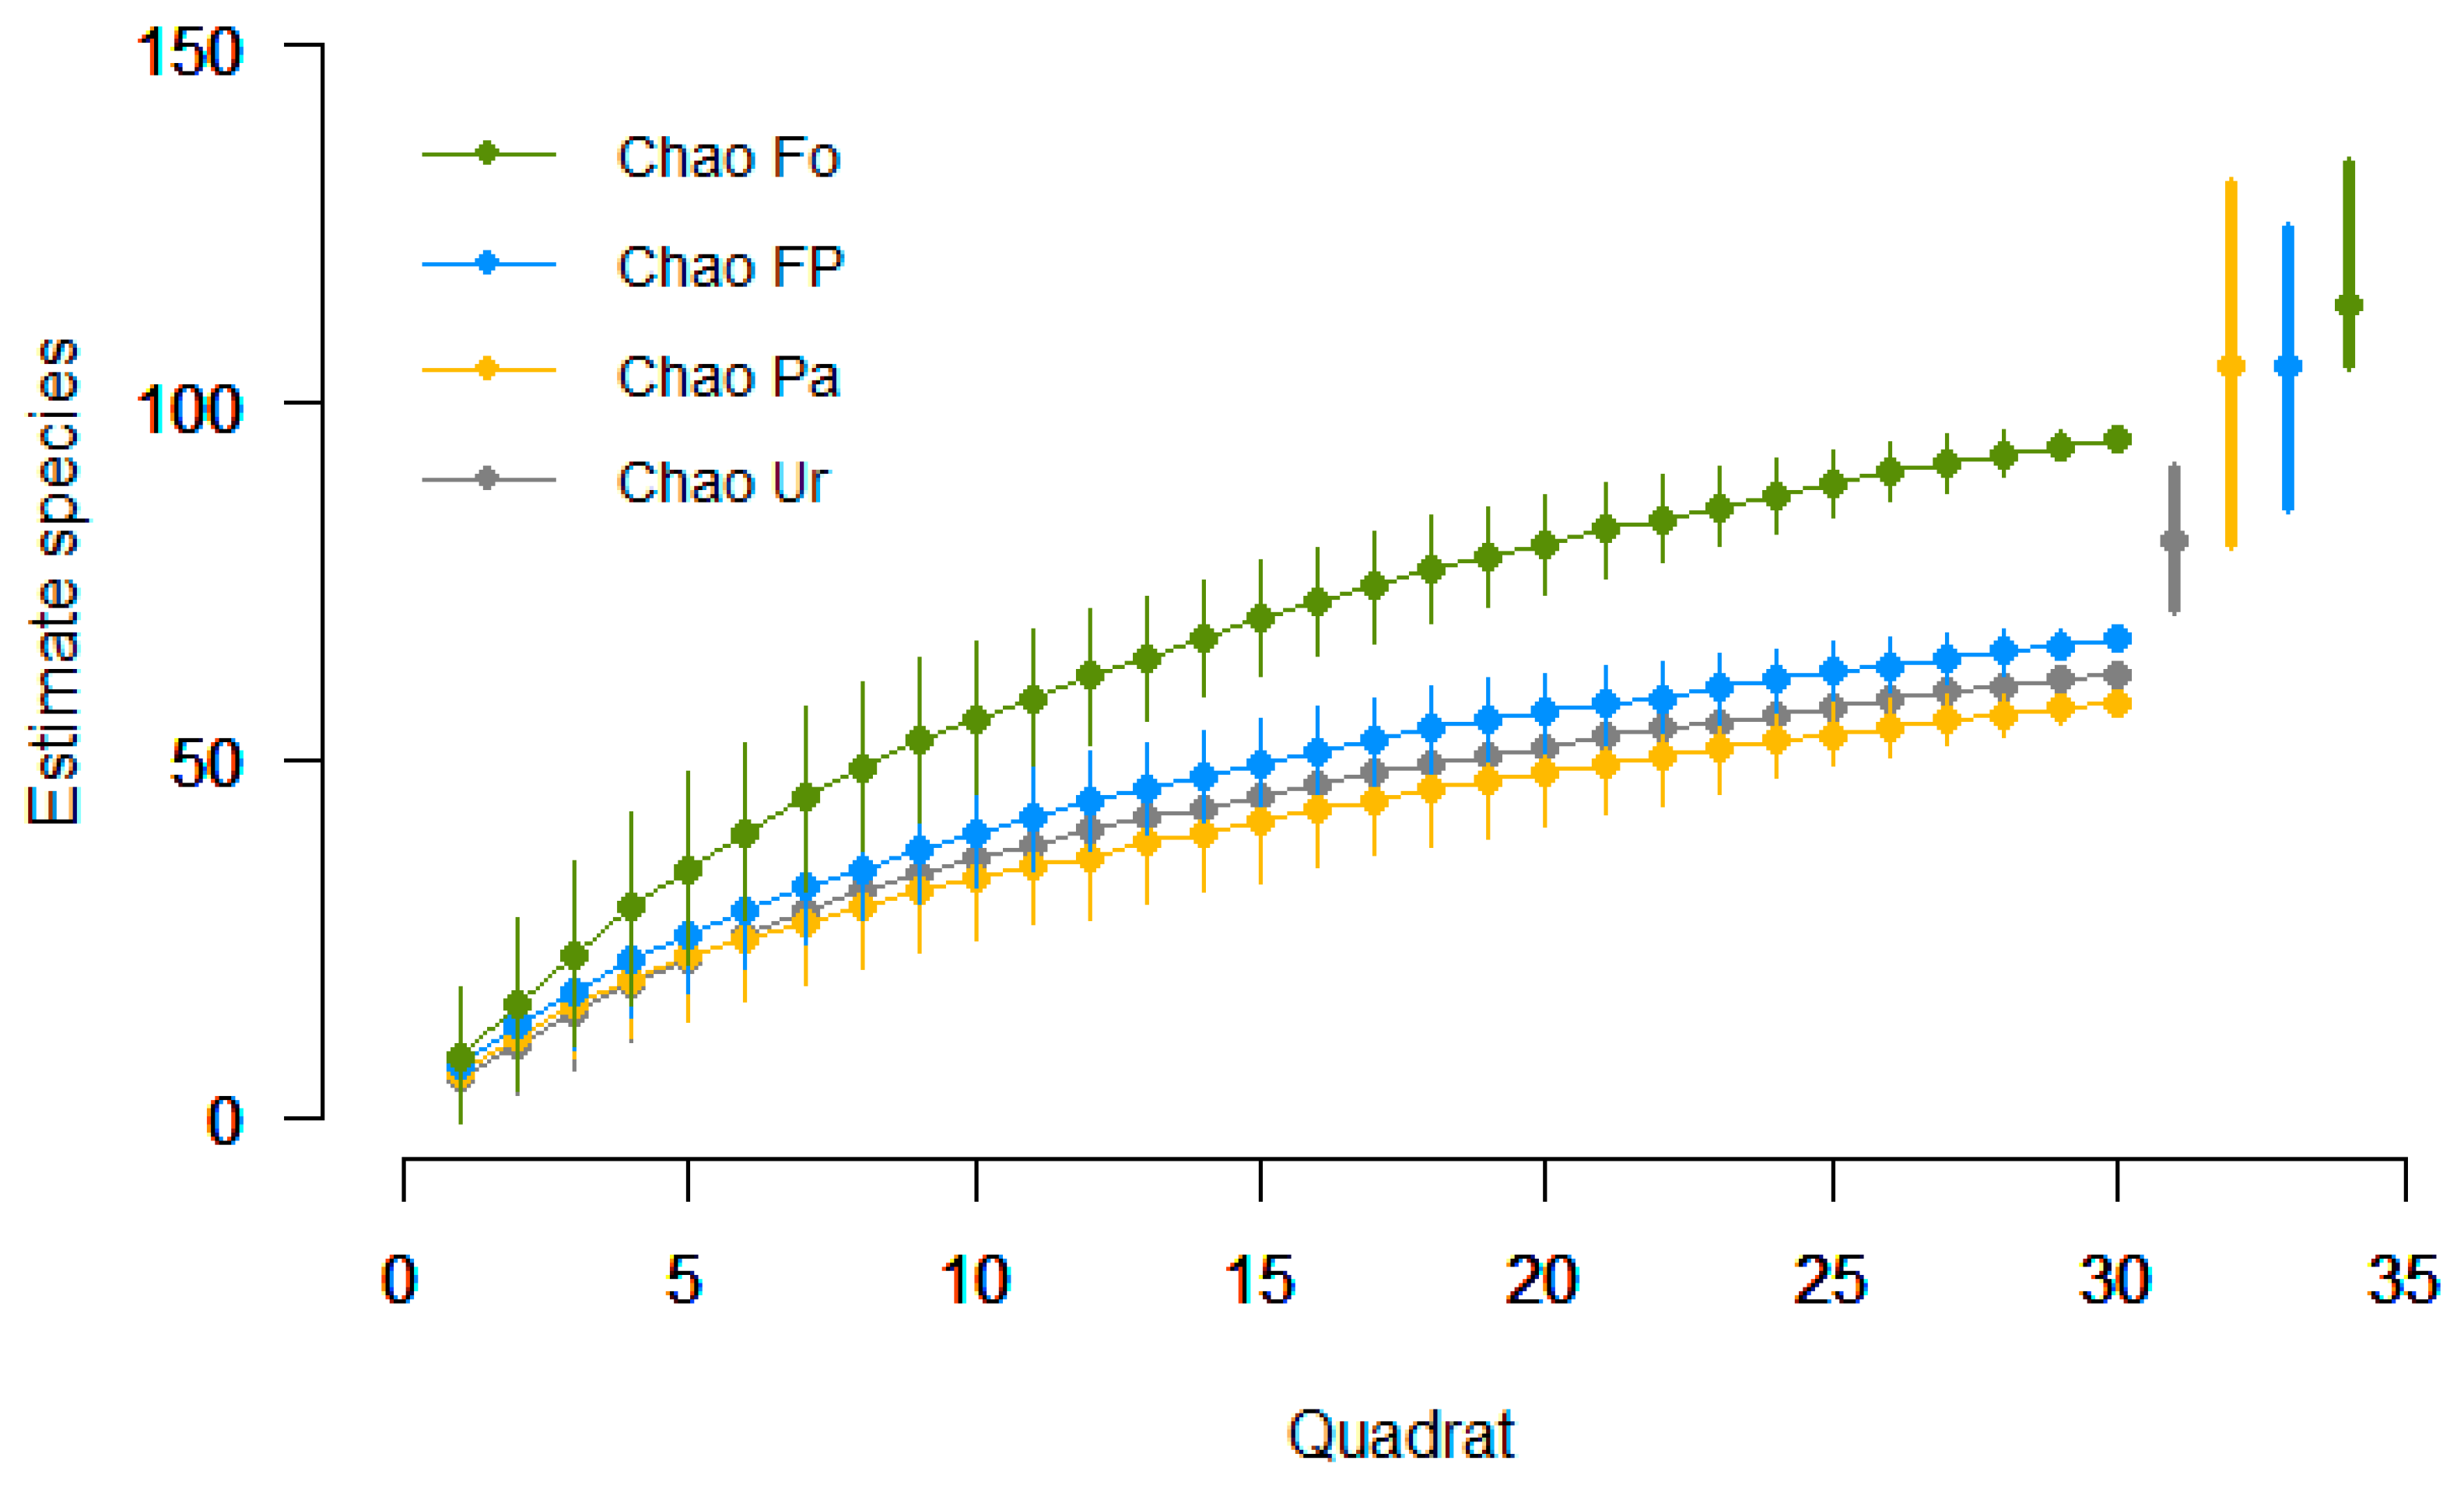
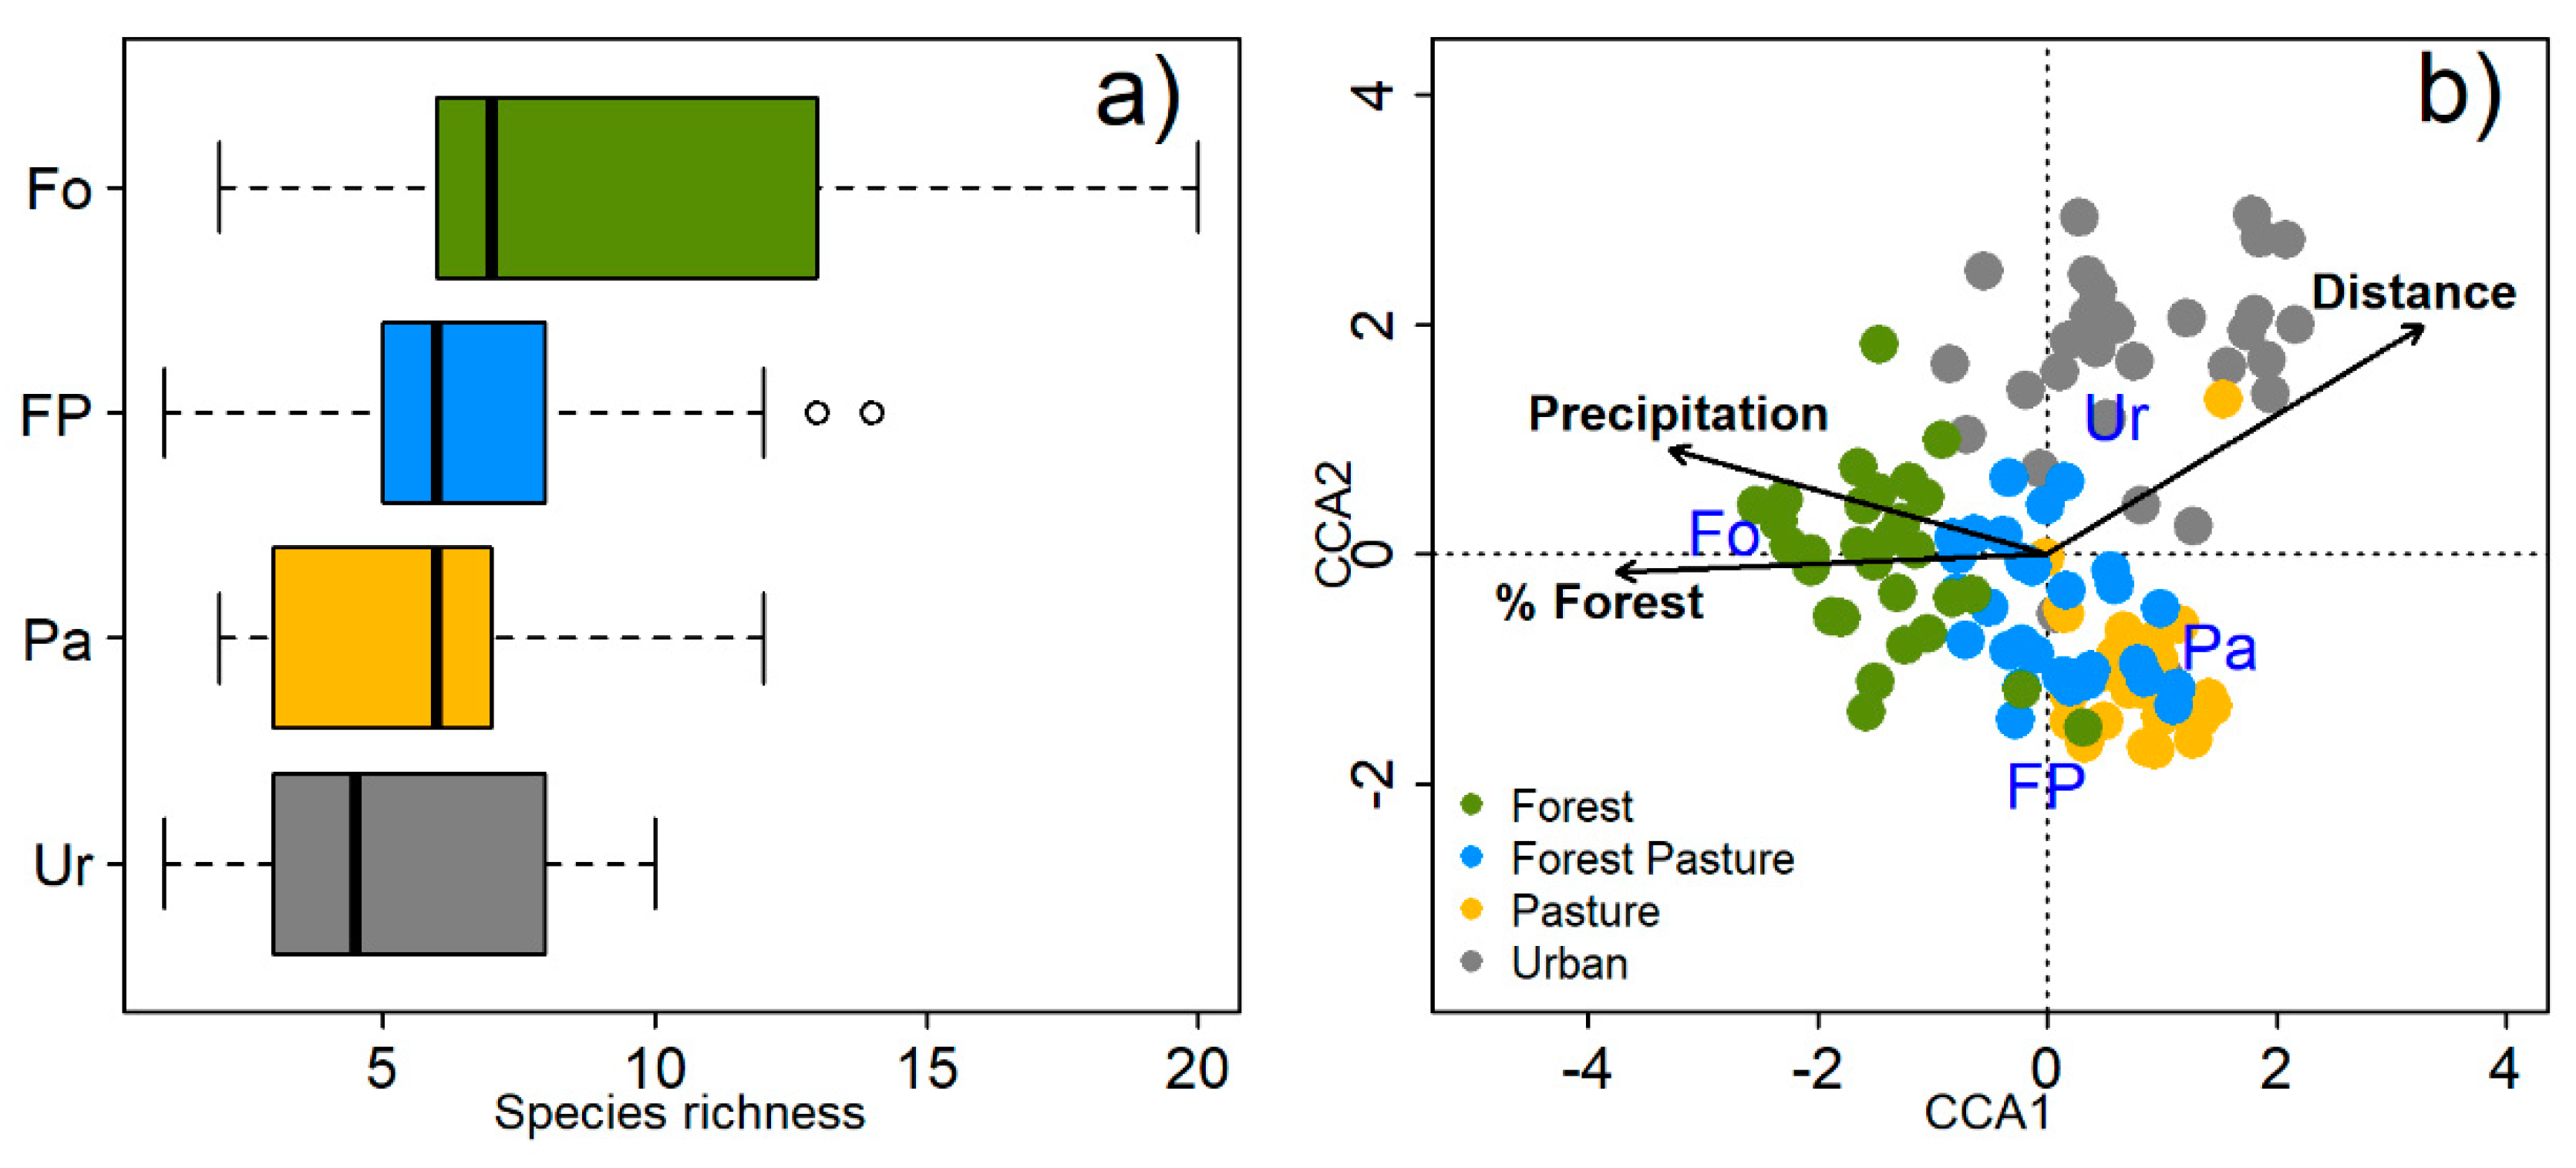
3.1. Species Richness and Community Composition

We recorded a total of 140 species of epiphytic lichens on 120 trees, distributed in 36 genera and 22 families. A total of 94 species were found in forest sites, 66 species in forest-pasture, 57 species in pasture, and 61 in urban sites. The Chao-2 richness estimator, confirming a high number of species estimated in forest, followed by forest-pasture, urban and pasture (Figure 2). Species richness of epiphytic lichen decreased along the land-use intensity, i.e., from forest to urban (Table 2; Figure 3a).
Results GLMMs showed that lichen richness was lower in land uses with more intensity, i.e., forest-pasture, pasture and urban sites had a negative correlation with lichen richness. Conversely, distance to forests and forest land use showed a positive correlation (Table 2). The mean tree diameter (DBH) was not significant in any case (Table 2).
CCA indicated that precipitation, distance to forest and % forest were important factors to distinguish the taxonomic composition of the epiphytic lichen community among land uses (Figure 3b; Table 3). Together, these variables explained a total variation of 10%. The % forest and precipitation were negatively correlated to axis 1, while distance to forest was positively correlated (Figure 3b, Table S1). Only distance to forest and precipitation were positively correlated to CCA axis 2. Across CCA axis 1, the lichen species Heterodermia leucomela, Dirinaria picta, Parmotrema arnoldi and Physcia aipolia showed more preference for disturbed sites (pasture and urban site) with less canopy cover, low humidity and more light availability. Conversely, lichen species such as Leptogium millegranum, Leptogium diffractum, Puntelia rudecta, Sticta fuliginosa and Sticta tomentosa preferred the conditions of more humidity and closed canopy provided by the forest sites. Similarly, across CCA axis 2 the lichen species Cococarpia palmicola., Leptogium coralloideum, Leptogium laceroides, Lobaria subexornata and Sticta fuliginosa were related to sites with closed canopy and high humidity; whereas, Heterodermia diademata, Heterodermia leucomela, Physcia aipolia, Physcia crispa, Telochistes exilis and Ramalina celastri were related to open canopy sites and less humidity (Figure 3b).
Eighteen species were the best indicators of forests land-use intensity, followed by forest-pasture with seven species and six and four species for urban and pasture respectively (Appendix A).

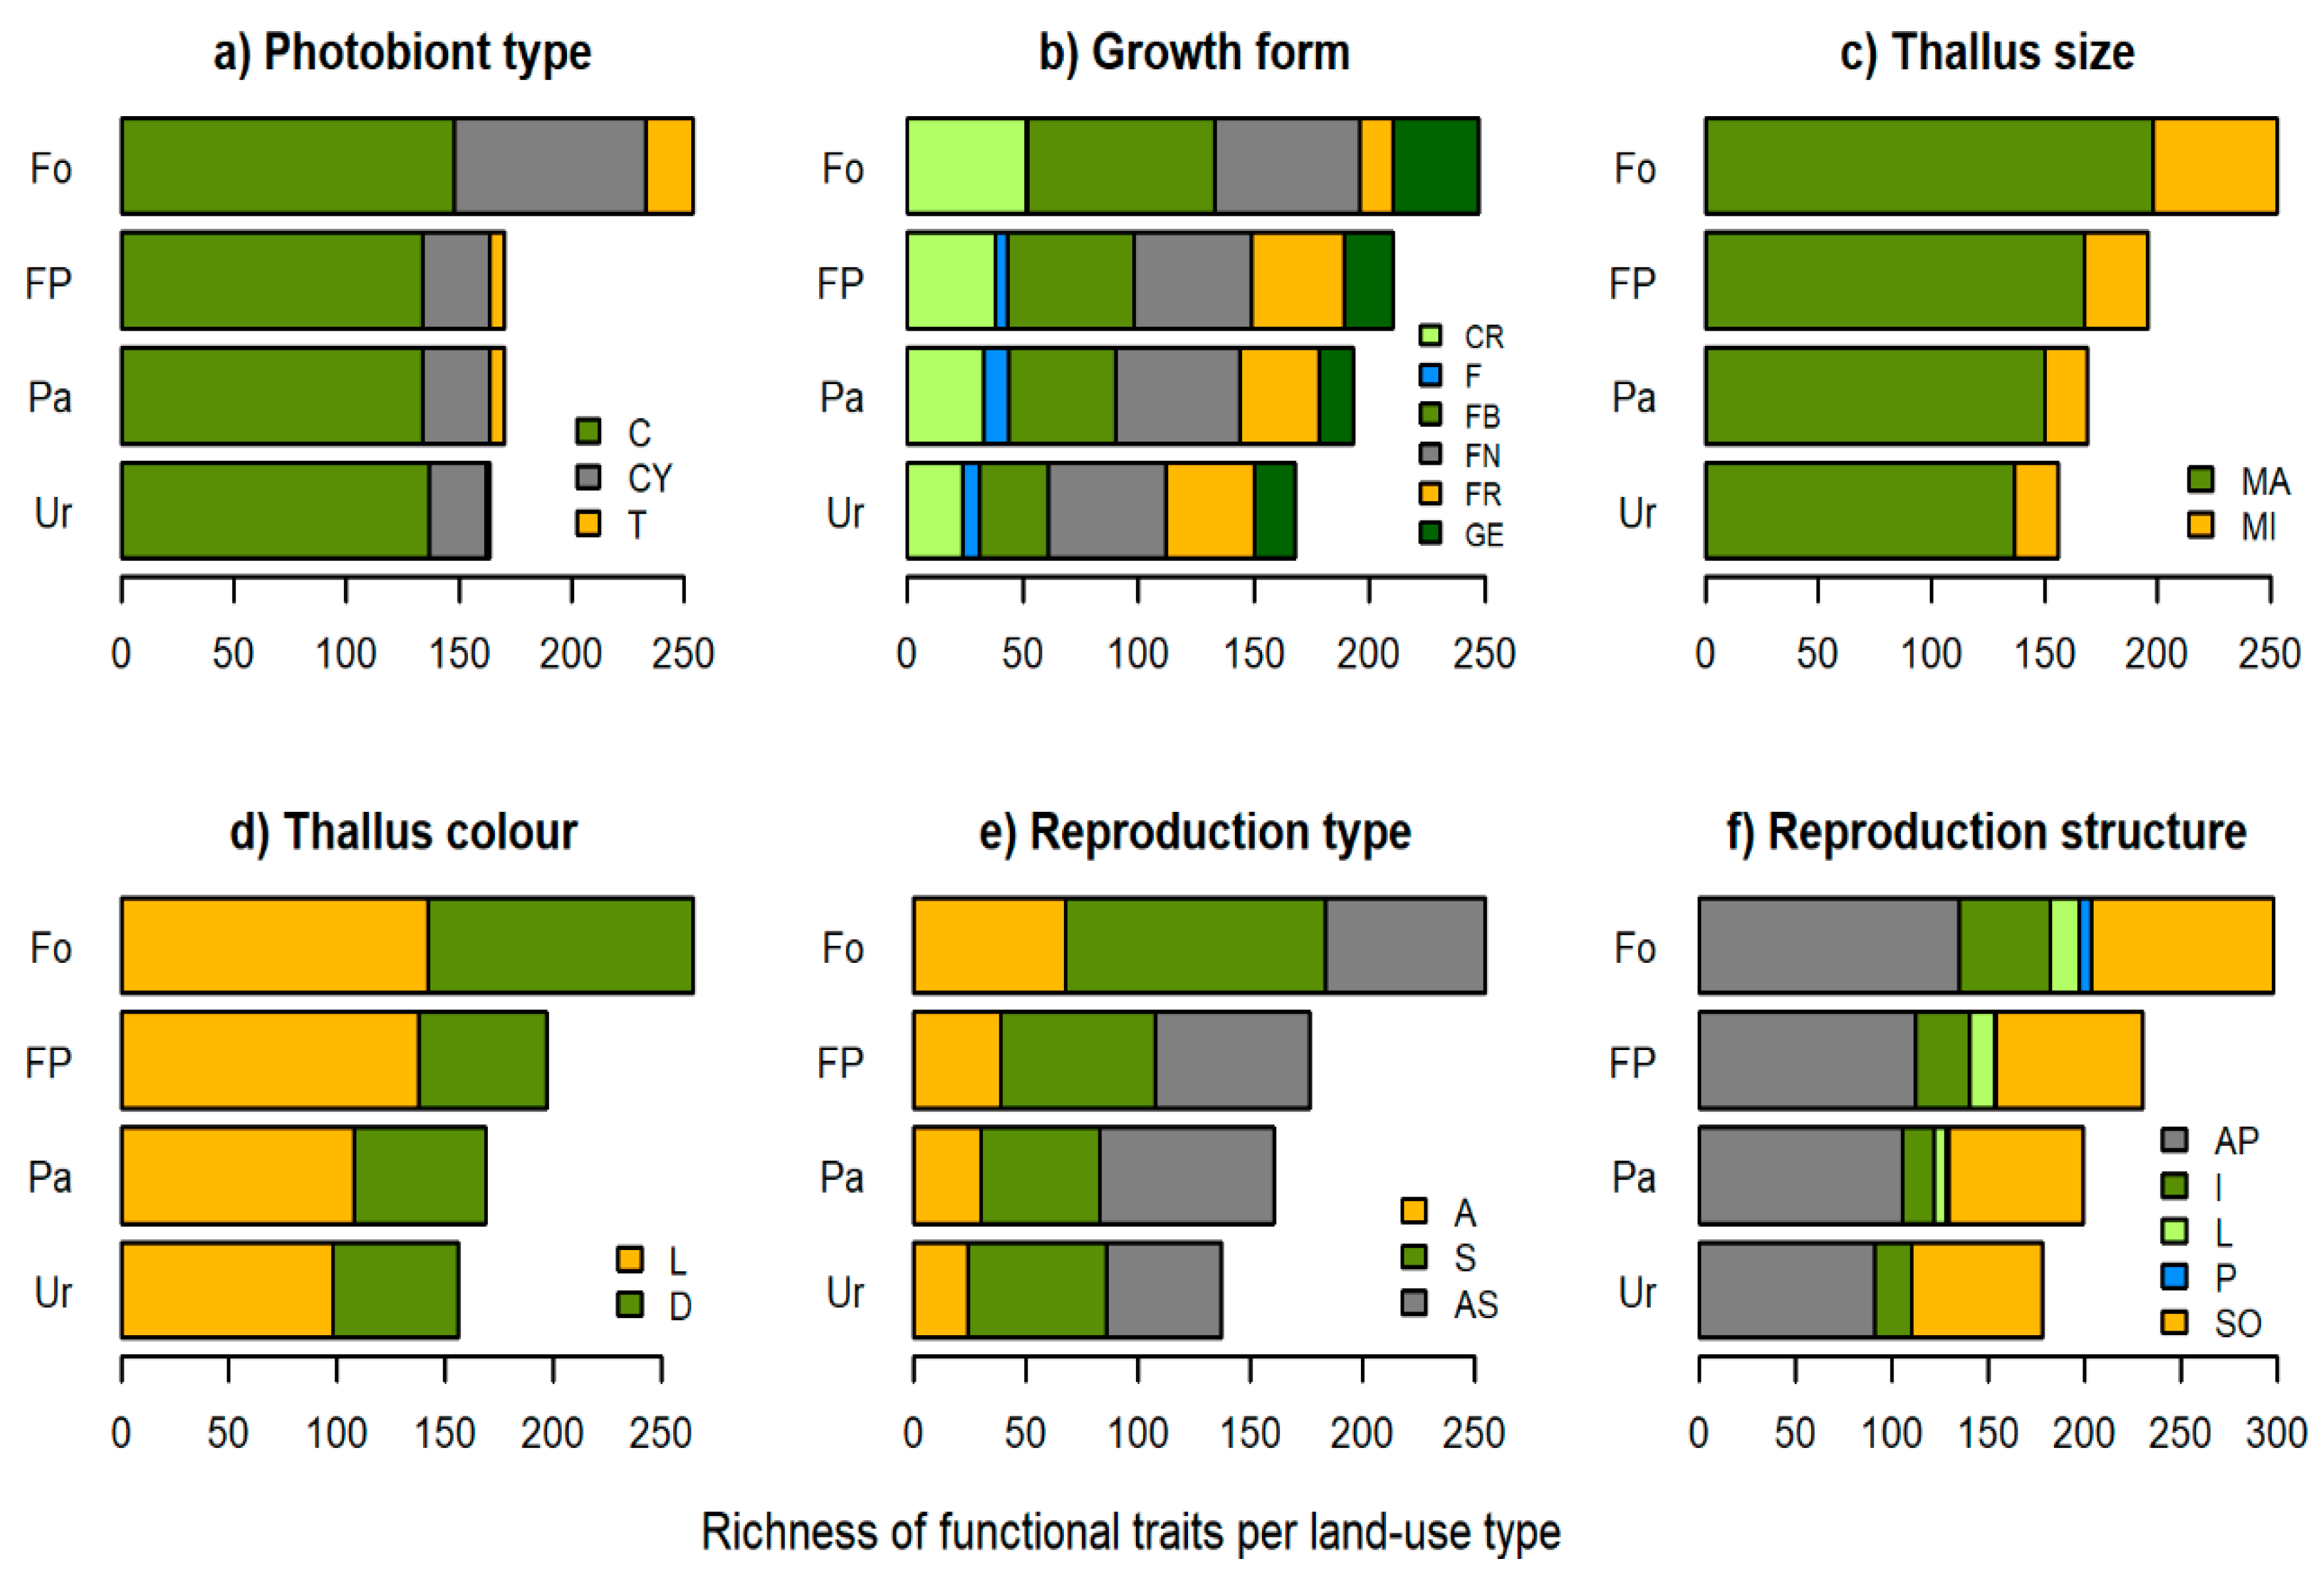
3.2. Functional Traits

Species richness of lichens with cyanobacteria and trentepohlia decreased from forest sites to urban sites (Figure 4a). A similar pattern was observed in the growth form, thus, crustose, foliose with broad lobes and gelatinose lichen species decreased along the land-use intensity (Figure 4b). Macrolichens with dark thallus decreased in pasture or urban sites (Figure 4b–d). Conversely, lichen with fruticulose growth form were more abundant in disturbed sites (Figure 4b). Lichens with sexual and asexual reproduction; and with apothecia, isidia and soredia as reproductive structure decreased in land use gradient (Figure 4e–f).
The GLMMs models showed that the most relevant predictor for richness of functional traits of lichens was land-use intensity (Table 4). The land-use intensity forest, % forests, and distance to forest (correlated with canopy cover and precipitation) showed a positive correlation on lichen species with cyanobateria as photobiont, and gelatinose and foliose with broad lobes growth forms and macrolichens (Table 4). Conversely, forest-pasture, pasture and urban land use showed positive correlation with lichens species with frutiulose thallus. Lichens with dark colour, apothecia, soredia and isidia reproductive structure were correlated positively with forest (Table 4). The tree diameter (DBH) showed a positive effect on isidia as reproductive structure (Table 4).

4. Discussion

4.1. Species Richness, Functional Traits and Community Composition

Our findings reveal a negative effect of land-use intensity on several metrics of taxonomic diversity and functional traits of the epiphytic lichen communities across riparian buffers in the Andes of southern Ecuador. There was a decrease in species richness and changes in community composition from forest to urban sites, as in other studies [5,20,56,57,58,59]. Similarly, the richness of functional traits such as photobiont type and growth form of epiphytic lichens diminished along the land-use intensity. Other studies have also demonstrated that land-use change has affected the functional traits of lichens [5,15,19,21,22,25,27,60]. Following this pattern for richness of functional traits Pinho et al. [20], Benitez et al. [21] and Koch et al. [22], showed that forest disturbance and urbanization have a strong correlation on the richness of functional traits of the epiphytic lichen communities. This phenomenon associated with species richness and functional traits can be explained by the ecological and physiological requirements related to water availability. Thus, a greater richness of sensitive species (e.g., Leptogium), species with cyanobacteria and gelatinose growth were present in forest sites with a closed canopy [5,14,18,19,61,62,63,64] than in pasture and urban sites. This is because they are intolerant to light and strongly depend on atmospheric humidity, in some cases they even need liquid water to do photosynthesis [65].
On the other hand, the highest occurrence of heliophytic lichen species with green algae and cortical pigments, microlichens, lichens with narrow lobes, light and fruticose thallus were related to sites with a more anthropogenic land use (e.g., forest-pasture, pasture and urban zones). These species show a higher tolerance to lower humidity and more light intensity promoted positively by an open canopy [5,14,18,19,20,23,63,64]. In our case, heliophytic lichen species (e.g., Parmotrema, Teloschistes, and Usnea), species with narrow lobes such as Physcia, Heterodermia and Hypotrachyna, and fruticose species (e.g., Usnea and Teloschistes) were present in more anthropogenic areas because these sites present high levels of solar radiation and water stress [22,63]. These lichen species can hydrate very fast, as well as rapidly lose water, because they occupy more surface and a have broad fixation structure to substrate [25,56]. In addition, most of the recorded species present secondary metabolites (i.e., atranorine or usnic acid) that provide protection against solar radiation typical in altered zones [21,22]. In the disturbed sites we also observed an increase of lichen species with chlorococcoid green algae. An explanation to this finding is that green algae species are better adapted to open forests because they avoid the photoinhibition by using a minimum amount of water in their thallus during photosynthesis [5,20,21,22,56,63].
Epiphytic lichen community composition was also influenced by the differences in land-use intensity. A forest cover reduction leads to less humidity and more intensity of light, thus lichen species restricted to undisturbed forests (shade epiphytes) are more affected [10,19,63]. In our study, the forest sites were dominated by species of the genera Leptogium, Sticta and Lobaria, which are species with cyanobacteria as a photobiont with high needs of water and forest cover [26,62,66]. These species are strictly associated with forest and can be considered good indicators of land-use intensity. On the other hand, another group of species were favored by the disturbance gradient, because they are capable of tolerating more light intensity and low humidity [10,14]. Thus, forest-pasture, pasture, and urban sites were dominated by xerophytic species (sun epiphytes) of the genera Heterodermia, Parmotrema, Physcia, Teloschistes and Usnea [15,22,59]. The adaptive advantage of sun epiphytes against shade epiphytes is their secondary metabolites that make them tolerant to high levels of radiation [21]. Both indicators and some non-indicator species have important ecological implications in the riparian ecosystems of the southern Ecuadorian Andes. For instance, most species of the genus Leptogium (e.g., L. burgesii, L. cochleatum, L. coralloideum, L. corticola, L. laceroides and L. marginellum), Lobaria (L. subexornata) and Sticta (S. ferax, S. fuliginosa and S. tomentosa); are associated with forest land use intensity and can be considered as good indicators of riparian forests with closed canopy and higher humidity [10]. Heterodermia hypoleuca, H. leucomela, Physcia aipolia and Ramalina celastri are the best indicators for urbanization, whereas that Dirinaria picta and Flavopunctelia flaventior for pasture. In accordance with other studies, the presence of these species indicates exposed conditions and can be considered a good indicator of the effects of land-use changes [10,20,21,22,28].

4.2. Application in Biomonitoring

Along our disturbance gradient, our measures of epiphytic lichen species richness, community composition, and functional traits richness, performed well when detecting the negative effect of land use intensity. However, functional traits have an advantage over community structure and species richness, of providing evidence of potential alterations in the biodiversity-ecosystem functioning relationships [21,22,24]. In this context, photobiont type and growth form of epiphytic lichens are easily measured and could be suitable indicators for detecting land-use intensity along riparian margins in Andean ecosystems. Likewise, growth form is a more sensitive indicator to changes in canopy cover facilitating a quantification of the effects of riparian forest disturbance, and potentially to assess the success of forest management in riparian buffers that promote and enhance the ecosystem health of Andean streams [36]. This first study in Ecuador, which assesses the suitability of a set of taxonomic and functional metrics of the epiphytic lichen community could be used as a complementary approach to understand the structure and functioning of riparian ecosystems in the tropical Andes. Therefore, these metrics could be effective indicators of land-use transformation in tropical Andes. Furthermore, the information provided here can contribute to better management practices in riparian margins of montane ecosystems in general.

Supplementary Materials

The following are available online at https://0-www-mdpi-com.brum.beds.ac.uk/1424-2818/11/5/73/s1, Table S1: Lichen species contribution to CCA axes using abundance data per tree and land-use intensity (covariate) precipitation, distance to forest and percentage of forest (predictors).

Author Contributions

Conceptualization, A.B.; L.C. and C.I.-A.; Methodology, L.C., A.B., F.P.G. and C.I.-A.; formal analysis, L.C., F.P.G. and A.B.; Investigation, L.C. and A.B.; Resources, L.C., A.B. and C.I.-A.; Data curation, L.C.; A.B. and F.P.G.; Writing—original draft preparation, L.C.; F.P.G.; C.I.-A. and A.B.

Funding

This research was funded by the “Universidad Técnica Particular de Loja” (PROJECT_CCNN_941) and the “Secretaría Nacional de Educación Superior, Ciencia, Tecnología e Innovación” of Ecuador.

Acknowledgments

We thank the Ministerio del Ambiente del Ecuador for granting access to the field sites and the necessary collecting permits.

Conflicts of Interest

The authors declare no conflict of interest.

Appendix A

Table A1. Indicator species analysis found in forest, forest-pasture, pasture and urban.
TaxaLand-use IntensityIndicator Valuep-value
Bacidia sp.Forest3.31.000
Bacidia sp. 1Pasture1.71.000
Bacidia sp. 2Forest3.31.000
Bacidia sp. 3Forest-pasture3.31.000
Byssoloma subdiscordans (Nyl.) P. JamesPasture4.80,3211
Candelaria concolor (Dickson) SteinUrban6.70.2438
Candelaria sp.Forest3.60.6059
Canomaculina pilosa (Stizenb.) Elix & HalePasture6.20.2464
Chapsa aff. dilatata (Müll. Arg.) KalbForest1.91.00
Chapsa aff. diploschistoides (Zahlbr.) FrischForest3.31.000
Chapsa sp. Forest-pasture5.30.4695
Chrysothrix candelaris (L.) JR LaundonUrban10.70.0494
Cladonia coniocraea (Flörke) SprengelForest23.30.0008
Coccocarpia palmicola (Spreng.) Arv. & D.J. GallowayForest3.31.000
Coccocarpia pellita (Ach.) Müll. Arg.Forest6.70.2368
Coenogonium linkii EhrenbForest200.0016
Coenogoium pineti (Ach.) Lücking & LumbschForest-pasture3.31.000
Dirinaria picta (Sw.) Clem. & SchearPasture100.0444
Flavopunctelia flaventior (Stirt.) HalePasture31.70.0012
Graphis sp.Forest6.70.2272
Graphis sp. 1 Forest3.31.000
Graphis sp. 2Forest3.31.000
Graphis sp. 3Forest3.31.000
Heterodermia albicans (Pers.) Swinscow & KrogForest-pasture3.30.7986
Heterodermia andina MobergUrban5.70.2745
Heterodermia comosa (Eschw.) Follmann & RedónPasture3.31.000
Heterodermia corallophora (Taylor) SkorepaPasture15.10.0162
Heterodermia diademata (Taylor) D.D. AwasthiForest3.31.000
Heterodermia galactophylla (Tuck.) W.L. Culb.Pasture5.40.4147
Heterodermia hypoleuca (Mühl.) Trevis.Urban180.0026
Heterodermia isidiophora (Nyl.) D.D. AwasthiForest14.10.0468
Heterodermia japonica (M. Satô) Swinscow & KrogPasture12.20.0714
Heterodermia leucomela (L.) PoeltUrban15.50.0084
Heterodermia pseudospeciosa (Kurok.) Culb.Forest30.6067
Heterodermia sitchensis Goward & NoblePasture14.80,2697
Heterodermia squamulosa (Degel.) CulbForest-pasture130.0086
Heterodermia spathulifera Moberg & PurvisForest21.80.0006
Heterodermia speciosa (Wulfen) TrevisanPasture21.000
Heterodermia sp. Forest3.31.000
Hypotrachyna costaricensis (Nyl.) HaleForest-pasture6.70.2446
Hypotrachyna revoluta (Flörke) HaleForest4.60.2931
Hypotrachyna rockii (Zahlbr.) HaleForest340.0002
Hypotrachyna reducens (Nyl.) HalePasture15.70.1236
Hypotrachyna sinuosa (Sm.) HaleForest2.21.000
Lecanora chlarotera Nyl.Urban100.0566
Lecanora helva Stizenb.Urban3.31.000
Lecanora sp. Urban3.31.000
Lepraria sp.Forest3.80.7365
Leptogium austroamericanum (Malme) CW DodgeForest6.30.1882
Leptogium azureum (Sw.) Mont.Urban7.40.2442
Leptogium burgesii (L.) Mont.Forest200,0004
Leptogium burnetii DodgeForest-pasture3.31.000
Leptogium cochleatum (Dicks.) P.M. Jørg. & P. JamesForest24.10.0002
Leptogium coralloideum (Meyen & Flot.) Vain.Forest11.10.0388
Leptogium corticola (Taylor) Tuck.Forest15.90.0036
Leptogium cyanescens (Rabh.) Körb.Forest-pasture5.70.3835
Leptogium diaphanum (Sw.) Nyl.Forest-pasture20.30,019
Leptogium laceroides B. de Lesd.Forest100.0466
Leptogium marginellum (Sw.) GrayForest100.0468
Leptogium millegranum SierkUrban9.80.0558
Leptogium olivaceum (Hook.) Zahlbr.Forest6.70,2388
Leptogium phyllocarpum (Pers.) Mont.Urban6.70.2442
Leptogium sp.Forest13.30.025
Lobaria erosa (Eschw.) Nyl.Forest2,81.000
Lobaria subexornata (Yoshim.) Yoshim.Forest16.70.0024
Megalospora melanodermia (Müll. Arg.) Zahlbr.Forest13.30.0134
Normandina pulchella (Borrer) Nyl.Forest13.30.0134
Parmotrema arnoldii (Du Rietz) HaleForest-pasture4.60.8822
Parmotrema austrosinense (Zahlbr.) HalePasture13.80.067
Parmotrema chinense (Osbeck) Hale y AhtiUrban5.60.3569
Parmotrema conferendum HaleForest-pasture70.2651
Parmotrema cristiferum (Taylor) HaleForest8.10.1466
Parmotrema exquisitum (Kurok.) DePriest & B.W. HaleForest-pasture4.70.5609
Parmotrema peralbidum (Hale) HaleForest-pasture3.11.000
Parmotrema subtinctorium (Zahlbr.) HaleForest2.50.6121
Parmotrema sp.Forest-pasture12.40.0242
Pannaria conoplea (Ach.) BoryForest-pasture21.30.0042
Pertusaria sp.Forest3.31.000
Pertusaria sp. 1Forest6.70.242
Pertusaria sp. 2Urban6.80.1912
Pertusaria sp. 3Forest6.70.2442
Pertusaria sp. 4Forest6.70.232
Pertusaria sp. 5Forest-pasture3.31.000
Pertusaria sp. 6Forest-pasture1,71.000
Phaeographis brasiliensis (A. Massal.) Kalb & Matthes-LeichtForest8.80.0598
Phaeographis decipiens Müll. Arg.Pasture3.31.000
Phaeographis dendritica (Ach.) Müll.Arg.Forest-pasture2.31.000
Phaeographis intricans (Nyl.) Vain.Forest6.70,2476
Phaeographis inusta (Ach.) Müll. Arg.Pasture3.31.000
Phaeographis quadrifera (Nyl.) StaigerForest-pasture15,40,0052
Phaeographis punctiformis (Eschw.) Müll. Arg.Forest3.31.000
Phaeographis subtigrina (Vain.) Zahlbr.Forest-pasture2.30.9884
Phaeophyscia aff. limbata (Poelt) Kashiw.Pasture9.20.1222
Phaeophyscia sp. Forest11.10.2202
Phyllopsora isidiotyla (Vain.) RiddlePasture30.90.0002
Physcia aipolia (Ehrh. Ex Humb.) Fürnr.Urban120.0372
Physcia atrostriata MobergPasture3.31.000
Physcia crispa Nyl.Urban10.90.0638
Physcia endochrysea (Nyl.) HampeUrban14.90.0088
Physcia poncinsii HueUrban6.70.2446
Physcia sorediosa (Vain.)Urban6.70.248
Physcia sp.Urban3.30.6163
Physcia sp. 1Urban3.31.000
Physcia sp. 2Pasture5.20.2494
Pseudocyphellaria aurata (Ach.) Vain.Forest-pasture11.90.0144
Pseudocyphellaria crocata (L.) Vain.Pasture10.30.0998
Punctelia aff. crispa Marcelli, Jungbluth & ElixForest-pasture3.31.000
Punctelia reddenda (Stirt.) KrogForest-pasture100.0616
Punctelia rudecta (Ach.) KrogForest4.20.6065
Punctelia subrudecta (Nyl.) KrogForest14.90.0088
Punctelia sp. Forest2.01.000
Punctelia sp. 1Forest3.31.000
Punctelia sp. 2Forest-pasture2.10.912
Pyrenula spForest-pasture10.00.053
Pyrenula sp1.Forest-pasture11.90.0932
Pyxine cocoës (Sw.) Nyl.Forest10.00.0616
Ramalina celastri (Spreng.) Krog & SwinscowUrban12.80,0132
Ramalina cochlearis Zahlbr.Urban2.21.000
Ramalina peruviana Ach.Forest-pasture4.00.6189
Rimelia reticulata (Taylor) Hale Forest-pasture2.11.000
Rimelia subisidiosa (Müll. Arg.) Hale Pasture3.70,7261
Rinodina sp.Forest11.40,033
Sticta andensis (Nyl.) Trevis.Forest3.31.000
Sticta ferax Müll. Arg.Forest16.70.0028
Sticta fuliginosa (Dicks.) Ach.Forest39.80.0002
Sticta humboldtii Hook. f.Forest6.70.2488
Sticta tomentosa (Sw.) Ach.Forest200.0008
Sticta sp. Pasture13.30.015
Teloschistes flavicans (Sw.) NormanUrban6.90.1842
Teloschistes chrysophthalmus (L.) Beltr.Pasture2.50.8224
Teloschistes exilis (Michaux) Vain.Forest-pasture9.60.5153
Teloschistes hypoglaucus (Nyl.) Zahlbr.Urban1.71.000
Usnea sp.Forest-pasture14.90.0336
Usnea sp. 1Urban2.41.000
Usnea sp. 2Pasture8.20.3405
Usnea sp. 3Urban16.40.0188
Usnea sp. 4Urban9.00.1246
Usnea sp. 5Urban5.30.4397
Usnea sp. 6Forest-pasture3.90.6755
Usnea sp. 7Urban6.00.2809

References

  1. Turner, W.; Nakamura, T.; Dinetti, M. Global Urbanization and the Separation of Humans from Nature. BioScience 2004, 54, 585. [Google Scholar] [CrossRef] [Green Version]
  2. Gibson, L.; Lee, T.M.; Koh, L.P.; Brook, B.W.; Gardner, T.A.; Barlow, J.; Sodhi, N.S. Primary forests are irreplaceable for sustaining tropical biodiversity. Nature 2011, 478, 378. [Google Scholar] [CrossRef] [PubMed]
  3. Cui, L.; Shi, J. Urbanization and its environmental effects in Shanghai, China. Urban Clim. 2012, 2, 1–15. [Google Scholar] [CrossRef] [Green Version]
  4. Newbold, T.; Hudson, L.N.; Hill, S.L.; Contu, S.; Lysenko, I.; Senior, R.A.; Day, J. Global effects of land use on local terrestrial biodiversity. Nature 2015, 520, 45. [Google Scholar] [CrossRef]
  5. Stofer, S.; Bergamini, A.; Aragon, G.; Carvalho, P.; Coppins, B.J.; Davey, S.; Lökös, L. Species richness of lichen functional groups in relation to land use intensity. Lichenologist 2006, 38, 331–353. [Google Scholar] [CrossRef]
  6. Liira, J.; Sepp, T.; Parrest, O. The forest structure and ecosystem quality in conditions of anthropogenic disturbance along productivity gradient. For. Ecol. Manag. 2007, 250, 34–46. [Google Scholar] [CrossRef]
  7. Gowda, J.H.; Kitzberger, T.; Premoli, A.C. Landscape responses to a century of land use along the northern Patagonian forest-steppe transition. Plant Ecol. 2012, 213, 259–272. [Google Scholar] [CrossRef]
  8. Mckinney, M. Urbanization, Biodiversity, and Conservation: The impacts of urbanization on native species are poorly studied but educating a highly urbanized human population about these impacts can greatly improve species conservation in all ecosystems. Bioscience 2002, 52, 883–890. [Google Scholar] [CrossRef]
  9. Tapia-Armijos, M.F.; Homeier, J.; Espinosa, C.I.; Leuschner, C.; de la Cruz, M. Deforestation and forest fragmentation in South Ecuador since the 1970s–losing a hotspot of biodiversity. PLoS ONE 2015, 10, e0133701. [Google Scholar] [CrossRef]
  10. Benítez, Á.; Prieto, M.; González, Y.; Aragón, G. Effects of tropical montane forest disturbance on epiphytic macrolichens. Sci. Total Environ. 2012, 441, 169–175. [Google Scholar] [CrossRef] [PubMed]
  11. Alberti, M. Eco-evolutionary dynamics in an urbanizing planet. Trends Ecol. Evol. 2015, 30, 114–126. [Google Scholar] [CrossRef] [PubMed]
  12. Iñiguez-Armijos, C.; Hampel, H.; Breuer, L. Land-use effects on structural and functional composition of benthic and leaf-associated macroinvertebrates in four Andean streams. Aquat. Ecol. 2018, 52, 77–92. [Google Scholar] [CrossRef]
  13. Holz, I.; Gradstein, R.S. Cryptogamic epiphytes in primary and recovering upper montane oak forests of Costa Rica–species richness, community composition and ecology. Plant Ecol. 2005, 178, 89–109. [Google Scholar] [CrossRef]
  14. Nöske, N.M.; Hilt, N.; Werner, F.A.; Brehm, G.; Fiedler, K.; Sipman, H.J.; Gradstein, S.R. Disturbance effects on diversity of epiphytes and moths in a montane forest in Ecuador. Basic. Appl. Ecol. 2008, 9, 4–12. [Google Scholar] [CrossRef]
  15. Hauck, M.; Lkhagvadorj, D. Epiphytic lichens as indicators of grazing pressure in the Mongolian forest-steppe. Ecol. Indic. 2013, 32, 82–88. [Google Scholar] [CrossRef]
  16. Gauslaa, Y.; Solhaug, K.A.; Longinotti, S. Functional traits prolonging photosynthetically active periods in epiphytic cephalolichens during desiccation. Environ. Exp. Bot. 2017, 141, 83–91. [Google Scholar] [CrossRef]
  17. Giordani, P. Variables influencing the distribution of epiphytic lichens in heterogeneous areas: A case study for Liguria, NW Italy. J. Veg. Sci. 2006, 17, 195–206. [Google Scholar] [CrossRef]
  18. Benítez, Á.; Prieto, M.; Aragón, G. Large trees and dense canopies: Key factors for maintaining high epiphytic diversity on trunk bases (bryophytes and lichens) in tropical montane forests. For. J. For. Res 2015, 88, 521–527. [Google Scholar] [CrossRef]
  19. Giordani, P.; Brunialti, G.; Bacaro, G.; Nascimbene, J. Functional traits of epiphytic lichens as potential indicators of environmental conditions in forest ecosystems. Ecol. Indic. 2012, 18, 413–420. [Google Scholar] [CrossRef]
  20. Pinho, P.; Bergamini, A.; Carvalho, P.; Branquinho, C.; Stofer, S.; Scheidegger, C.; Maguas, C. Lichen functional groups as ecological indicators of the effects of land-use in Mediterranean ecosystems. Ecol. Indic. 2012, 15, 36–42. [Google Scholar] [CrossRef]
  21. Benítez, A.; Aragón, G.; González, Y.; Prieto, M. Functional traits of epiphytic lichens in response to forest disturbance and as predictors of total richness and diversity. Ecol. Indic. 2018, 86, 18–26. [Google Scholar] [CrossRef]
  22. Koch, N.M.; Matos, P.; Branquinho, C.; Pinho, P.; Lucheta, F.; de Azevedo Martins, S.M.; Vargas, V.M.F. Selecting lichen functional traits as ecological indicators of the effects of urban environment. Sci. Total Environ. 2019, 654, 705–713. [Google Scholar] [CrossRef]
  23. Merinero, S.; Martínez, I.; Rubio-Salcedo, M.; Gauslaa, Y. Epiphytic lichen growth in Mediterranean forests: Effects of proximity to the ground and reproductive stage. Basic. Appl. Ecol. 2015, 16, 220–230. [Google Scholar] [CrossRef]
  24. Giordani, P.; Rizzi, G.; Caselli, A.; Modenesi, P.; Malaspina, P.; Mariotti, M.G. Fire affects the functional diversity of epilithic lichen communities. Fungal Ecol. 2016, 20, 49–55. [Google Scholar] [CrossRef]
  25. Koch, N.M.; de Azevedo Martins, S.M.; Lucheta, F.; Müller, S.C. Functional diversity and traits assembly patterns of lichens as indicators of successional stages in a tropical rainforest. Ecol. Indic. 2013, 34, 22–30. [Google Scholar] [CrossRef]
  26. Hauck, M.; de Bruyn, U.; Leuschner, C. Dramatic diversity losses in epiphytic lichens in temperate broad-leaved forests during the last 150 years. Biol. Conserv. 2013, 157, 136–145. [Google Scholar] [CrossRef]
  27. Zarabska-Bożejewicz, D.; Kujawa, K. The effect of land use on taxonomical and functional diversity of lichens in an agricultural landscape. Fungal Ecol. 2018, 33, 72–79. [Google Scholar] [CrossRef]
  28. Aragón, G.; Martínez, I.; Hurtado, P.; Benítez, Á.; Rodríguez, C.; Prieto, M. Using Growth Forms to Predict Epiphytic Lichen Abundance in a Wide Variety of Forest Types. Diversity 2019, 11, 51. [Google Scholar] [CrossRef]
  29. Gauslaa, Y. Rain, dew, and humid air as drivers of morphology, function and spatial distribution in epiphytic lichens. Lichenologist 2014, 46, 1–16. [Google Scholar] [CrossRef] [Green Version]
  30. Llop, E.; Pinho, P.; Matos, P.; Pereira, M.J.; Branquinho, C. The use of lichen functional groups as indicators of air quality in a Mediterranean urban environment. Ecol. Indic. 2012, 13, 215–221. [Google Scholar] [CrossRef]
  31. Ochoa, D.; Cueva, A.; Prieto, M.; Aragón, G.; Benitez, A. Cambios en la composición de líquenes epifitos relacionados con la calidad del aire en la cuidad de Loja (ECUADOR). Caldasia 2015, 37, 333–343. [Google Scholar] [CrossRef]
  32. Benítez, Á.; Medina, J.; Vásquez, C.; Loaiza, T.; Luzuriaga, Y.; Calva, J. Lichens and Bromeliads as Bioindicators of Heavy Metal Deposition in Ecuador. Diversity 2019, 11, 28. [Google Scholar] [CrossRef]
  33. Käffer, M.I.; de Azevedo, S.M.; Alves, C.; Pereira, V.C.; Fachel, J.; Vargas, V.M.F. Corticolous lichens as environmental indicators in urban areas in southern Brazil. Ecol. Indic. 2011, 11, 1319–1332. [Google Scholar] [CrossRef]
  34. Koch, N.M.; Branquinho, C.; Matos, P.; Pinho, P.; Lucheta, F.; Martins, S.M.; Vargas, V.M. The application of lichens as ecological surrogates of air pollution in the subtropics: A case study in South Brazil. Environ. Sci. Pollut. Res. 2016, 23, 20819–20834. [Google Scholar] [CrossRef] [PubMed]
  35. Tapia-Armijos, M.F.; Homeier, J.; Draper-Munt, D. Spatio-temporal analysis of the human footprint in South Ecuador: Influence of human pressure on ecosystems and effectiveness of protected areas. Appl. Geogra. 2017, 78, 22–32. [Google Scholar] [CrossRef]
  36. Iñiguez-Armijos, C.L.; Frede, H.G.; Hampel, H.; Breuer, L. Deforestation and benthic indicators: How much vegetation cover is needed to sustain healthy Andean streams? PLoS ONE 2014, 9, e105869. [Google Scholar]
  37. Iñiguez-Armijos, C.; Rausche, S.; Cueva, A.; Sánchez-Rodriguez, A.; Espinosa, C.; Breuer, L. Shifts in leaf litter breakdown along a forest–pasture–urban gradient in Andean streams. Ecol. Evol. 2016, 6, 4849–4865. [Google Scholar] [CrossRef] [PubMed] [Green Version]
  38. Rollenbeck, R.; Bendix, J. Rainfall distribution in the Andes of southern Ecuador derived from blending weather radar data and meteorological field observations. Atmos. Res. 2011, 99, 277–289. [Google Scholar] [CrossRef]
  39. May, P.F.; Brodo, I.M.; Esslinger, T.L. Identifying North American lichens: A Guide to the Literature; Farlow Herbarium, Harvard University: Cambridge, MA, USA, 2002. [Google Scholar]
  40. Sipman, H.J.M. Identification Key and Literature Guide to the Genera of Lichenized Fungi (Lichens) in the Neotropics, Provisional Version. Botanical Garden & Botanical Museum Berlin-Dahlen, Free University of Berlin, 2003. Available online: http://www.bgbm.fu-berlin.de/sipman/keys/neokeyA.htm (accessed on 10 January 2018).
  41. Cáceres, M.E.S.; Lücking, R.; Rambold, G. Phorophyte specificity and environmental parameters as determinants for species composition, richness and area cover in corticolous crustose lichen communities in the Atlantic rainforest of northeastern Brazil. Mycol. Progr. 2007, 6, 117–136. [Google Scholar] [CrossRef]
  42. Moncada, B.; Lücking, R.; Suárez, A. Molecular phylogeny of the genus Sticta (lichenized Ascomycota: Lobariaceae) in Colombia. Fungal Divers. 2014, 64, 205–231. [Google Scholar] [CrossRef]
  43. Lange, O.L.; Kilian, E.; Ziegler, H. Water vapor uptake and photosynthesis of lichens: Performance differences in species with green and blue-green algae as phycobionts. Oecologia 1986, 71, 104–110. [Google Scholar] [CrossRef]
  44. Lakatos, M.; Rascher, U.; Büdel, B. Functional characteristics of corticolous lichens in the understory of a tropical lowland rain forest. New Phytol. 2006, 172, 679–695. [Google Scholar] [CrossRef] [PubMed] [Green Version]
  45. Marini, L.; Nascimbene, J.; Nimis, P.L. Large-scale patterns of epiphytic lichen species richness: Photobiont-dependent response to climate and forest structure. Sci. Total Environ. 2011, 409, 4381–4386. [Google Scholar] [CrossRef] [PubMed]
  46. Frazer, G.W.; Canham, C.D.; Lertzman, K.P. Gap Light Analyzer (GLA), Version 2.0: Imaging Software to Extract Canopy Structure and Gap Light Transmission Indices from True-Colour Fisheye Photographs, Users Manual and Program Documentation; Simon Fraser University: Burnaby, British Columbia; The Institute of Ecosystem Studies: Millbrook, NY, USA, 1999; Volume 36. [Google Scholar]
  47. McCullagh, P.; Nelder, J.P. Generalized Linear Models, 2nd ed.; Chapman and Hall: London, UK, 1989; p. 511. [Google Scholar]
  48. Warton, D.I.; Hui, F.K. The arcsine is asinine: The analysis of proportions in ecology. Ecology 2011, 92, 3–10. [Google Scholar] [CrossRef]
  49. Pinheiro, J.; Bates, D.; DebRoy, S.; Sarkar, D.; Team, R.C. nlme: Linear and Nonlinear Mixed Effects Models. R Package Vers 1.3-5. 2017. Available online: http://CRAN.R-project.org/package=nlme (accessed on 10 January 2018).
  50. R Core Team. R: A Language Environment for Statistical Computing; R Foundation for Statistical Computing: Vienna, Austria, 2015; Available online: https://www.r-project.org/ (accessed on 10 January 2018).
  51. Hill, M.O.; Gauch, H.G. Detrended correspondence analysis: An improved ordination technique. In Classification and Ordination; Springer: Berlin/Heidelberg, Germany, 1980; pp. 47–58. [Google Scholar]
  52. Legendre, P.; Anderson, M.J. Distance-based redundancy analysis: Testing multispecies responses in multifactorial ecological experiments. Ecol. Monogr. 1999, 69, 1–24. [Google Scholar] [CrossRef]
  53. Oksanen, J.; Kindt, R.; Simpson, G.L. Package ‘vegan3d’. 2018. Available online: http://CRAN.R-project.org/package=vegan3d (accessed on 10 January 2018).
  54. Roberts, D.W. Labdsv: Ordination and Multivariate Analysis for Ecology. Version 1.4-1. 2012. Available online: http://CRAN.R-project.org/package=labdsv (accessed on 10 January 2018).
  55. Dufrêne, M.; Legendre, P. Species assemblages and indicator species: The need for a flexible asymmetrical approach. Ecol. Monogr. 1997, 67, 345–366. [Google Scholar] [CrossRef]
  56. Ellis, C.J.; Coppins, B.J. 19th century woodland structure controls stand-scale epiphyte diversity in present-day Scotland. Divers. Distrib. 2007, 13, 84–91. [Google Scholar] [CrossRef]
  57. Baniya, C.B.; Solhøy, T.; Gauslaa, Y.; Palmer, M.W. The elevation gradient of lichen species richness in Nepal. Lichenologist 2010, 42, 83–96. [Google Scholar] [CrossRef]
  58. Aragón, G.; Martínez, I.; Izquierdo, P.; Belinchón, R.; Escudero, A. Effects of forest management on epiphytic lichen diversity in Mediterranean forests. Appl. Veg. Sci. 2010, 13, 183–194. [Google Scholar] [CrossRef] [Green Version]
  59. Ellis, C.J.; Coppins, B.J. Partitioning the role of climate, pollution and old-growth woodland in the composition and richness of lichen epiphytes in Scotland. Lichenologist 2010, 42, 601–614. [Google Scholar] [CrossRef]
  60. Chongbang, T.B.; Keller, C.; Nobis, M.; Scheidegger, C.; Baniya, C.B. From natural forest to cultivated land: Lichen species diversity along land-use gradients in Kanchenjunga, Eastern Nepal. Ecol. Mont 2018, 1, 46–60. [Google Scholar] [CrossRef]
  61. Moning, C.; Werth, S.; Dziock, F.; Bässler, C.; Bradtka, J.; Hothorn, T.; Müller, J. Lichen diversity in temperate montane forests is influenced by forest structure more than climate. For. Ecol. Manag. 2009, 258, 745–751. [Google Scholar] [CrossRef]
  62. Aragón, G.; Martínez, I.; García, A. Loss of epiphytic diversity along a latitudinal gradient in southern Europe. Sci. Total Environ. 2012, 426, 188–195. [Google Scholar] [CrossRef] [PubMed]
  63. Matos, P.; Pinho, P.; Aragon, G.; Martínez, I.; Nunes, A.; Soares, A.M.; Branquinho, C. Lichen traits responding to aridity. J. Ecol. 2015, 103, 451–458. [Google Scholar] [CrossRef] [Green Version]
  64. Leppik, E.; Jueriado, I.; Liira, J. Changes in stand structure due to the cessation of traditional land use in wooded meadows impoverish epiphytic lichen communities. Lichenologist 2011, 43, 257–274. [Google Scholar] [CrossRef]
  65. Lange, O.; Büdel, A.; Meyer, A.; Kilian, E. Further evidence that activation of net photosynthesis by dry cyanobacterial lichens requires liquid water. Lichenologist 1993, 25, 175–189. [Google Scholar] [CrossRef]
  66. Kiebacher, T.; Keller, C.; Scheidegger, C.; Bergamini, A. Epiphytes in wooded pastures: Isolation matters for lichen but not for bryophyte species richness. PLoS ONE 2017, 12, e0182065. [Google Scholar] [CrossRef] [PubMed]
Figure 1. Location of the study area and 12 sampling sites equally distributed in four riparian land uses of Andean streams in southern Ecuador. Codes indicate the land-use intensity (Fo = forest, FP = forest-pasture, Pa = pasture, Ur = urban).
Diversity 11 00073 g001
Figure 2. Rarefaction curves with 95 % confidence intervals and Chao 2 estimator (points in the right of figure) of four study land-use intensity. Forest (Fo); Forest-pasture (FP); Pasture (Pa); and Urban (Ur).
Diversity 11 00073 g002
Figure 3. (a) Variation in species richness of epiphytic lichens in four riparian land uses of Andean streams in southern Ecuador. (b) CCA ordination plot of the lichen community using abundance data per tree and land-use intensity (covariate) precipitation, distance to forest and percentage of forest (predictors). Fo = Forest, FP = Forest Pasture, Pa = Pasture, Ur = Urban.
Diversity 11 00073 g003
Figure 4. Variation in the richness of functional traits of the epiphytic lichen community in four riparian land uses of Andean streams in southern Ecuador. Functional trait and categories evaluated are indicated as follows. Photobiont type (a): C = Chlorococcoid; CY = Cyanobacteria: T = Trentepholia. Growth form (b): CR = Crustose; F = Filamentose; FB = Foliose with broad lobes; FN = Foliose with narrow lobes; FR = Fruticose; G = Gelatinose. Thallus size (c): MA = Macrolichens; MI = Microlichens. Thallus color (d): L = Light; D = Dark. Reproduction type (e): A = Asexual; S = Sexual; AS = Asexual and sexual. Reproductive structure (f): AP = Apothecia; I = Isidia; L = Lirellae; P = Perithecia; SO = Soredia. Fo = Forest; FP = Forest Pasture; Pa = Pasture; y Ur = Urban.
Diversity 11 00073 g004
Table 1. List of the six functional traits and their categories of the epiphytic lichen community in four riparian land uses of Andean streams in southern Ecuador.
Functional TraitCategories
Photobiont typeC = Chlorococcoid; CY = Cyanobacteria: T = Trentepohlia
Growth formCR = Crustose; F = Filamentose; FB = Foliose with broad lobes; FN = Foliose with narrow lobes; FR = Fruticose; G = Gelatinose
Thallus sizeMA = Macrolichens; MI = Microlichens
Thallus colourL = Light; D = Dark
Reproduction typeA = Asexual; S = Sexual; AS = Asexual and sexual
Reproductive structureAP = Apothecia; I = Isidia; L = Lirellae; P = Perithecia; SO = Soredia
Table 2. Summary of the GLMM applied on species richness in four riparian land uses of Andean streams in southern Ecuador. Significant differences at p-value < 0.05. DBH: diameter at breast height.
Source of VariationCoefficientStandard ErrorZ-valuep-value
Forest2.6510.2978.908<0.001
Forest-Pasture−0.6630.286−2.3130.020
Pasture−0.9760.336−2.8990.003
Urban−1.6610.537−3.0930.001
Distance to forest0.4450.1602.7670.005
DBH−0.0040.0560.0780.937
Table 3. Shift in lichen species composition in relation to predictor variables, measured with ANOVAlike permutation test in four riparian land uses of Andean streams in southern Ecuador. Significant differences at p-value (<0.05) are shown in bold. DBH: diameter at breast height.
Source of VariationDegrees of FreedomChi SquareF-statisticp-value
Land use31.1962.3160.001
Precipitation10.2421.4100.003
Distance to forest10.2831.64770.001
% Forest10. 2451.4230.014
Table 4. Summary of the GLMM applied on the functional traits of the epiphytic lichen community in four riparian land uses of Andean streams in southern Ecuador. Coefficient of variation with differences at p-value (<0.05) are indicated in brackets. DBH: diameter at breast height. Fo = Forest; FP = Forest-Pasture; Pa = Pasture; y Ur = Urban. DBH = diameter at breast height, Dist-F = distance to forest; %Fo = percentage of forest.
Functional TraitsLand-use IntensityDBHDist-F%Fo
FoFPPaUr
Photobiont type
Chlorococcoid1.883 (0.004)
Cyanobacteria0.927 (0.001)−0.871 (0.01)−0.953 (0.01)−1.195 (0.002)
Trentepohlia −1.969 (0.03)
Growth form
Crustose1.033 (0.005)−0.704 (0.04)−0.977 (0.02)−1.847 (0.01)
Filamentose −6.699 (0.04) 2.347 (0.02)
Foliose with broad lobes1.277 (0.002) −2.064 (0.01) 0.789 (0.04)
Foliose with narrow lobes0.911 (0.003)
Fruticose −0.844 (0.02)1.007 (0.03) 1.013 (0.04)
Gelatinose −1.028 (0.02)−2.211 (0.01)−2.13 (0.02)
Thallus size
Macrolichens2.112 (0.009)
Microlichens 1.553 (0.01)1.368 (0.006)
Thallus colour
Light1.519 (0.001)
Dark1.818 (0.001)−1.091 (0.02)−1.17 (0.03)
Reproduction type
Asexual1.539 (0.001)−1.263 (0.004)−1.929 (0.002)−2.226 (0.001)
Sexual1.298 (0.001) −0.818 (0.01)−0.622 (0.04)
Asexual and sexual0.775 (0.001)
Reproductive structure
Apothecia1.769 (0.001)
Isidia0.502 (0.006)−0.492 (0.03)−0.98 (0.005)−1.281 (0.008)0.271 (0.02)
Lirellae
Perithecia
Soredia1.099 (0.03)

