Phylogenomic Reconstruction of the Neotropical Poison Frogs (Dendrobatidae) and Their Conservation


1
Department of Zoology, Southern Illinois University, Carbondale, IL 62901, USA
2
Department of Biology, East Carolina University, Greenville, NC 27858, USA
*
Author to whom correspondence should be addressed.
Diversity 2019, 11(8), 126; https://0-doi-org.brum.beds.ac.uk/10.3390/d11080126
Submission received: 10 June 2019
/
Revised: 21 July 2019
/
Accepted: 26 July 2019
/
Published: 29 July 2019
(This article belongs to the Special Issue Systematics and Conservation of Neotropical Amphibians and Reptiles)
Abstract
:The evolutionary history of the Dendrobatidae, the charismatic Neotropical poison frog family, remains in flux, even after a half-century of intensive research. Understanding the evolutionary relationships between dendrobatid genera and the larger-order groups within Dendrobatidae is critical for making accurate assessments of all aspects of their biology and evolution. In this study, we provide the first phylogenomic reconstruction of Dendrobatidae with genome-wide nuclear markers known as ultraconserved elements. We performed sequence capture on 61 samples representing 33 species across 13 of the 16 dendrobatid genera, aiming for a broadly representative taxon sample. We compare topologies generated using maximum likelihood and coalescent methods and estimate divergence times using Bayesian methods. We find most of our dendrobatid tree to be consistent with previously published results based on mitochondrial and low-count nuclear data, with notable exceptions regarding the placement of Hyloxalinae and certain genera within Dendrobatinae. We also characterize how the evolutionary history and geographic distributions of the 285 poison frog species impact their conservation status. We hope that our phylogeny will serve as a backbone for future evolutionary studies and that our characterizations of conservation status inform conservation practices while highlighting taxa in need of further study.
1. Introduction
Neotropical poison frogs, represented by the family Dendrobatidae within Anura, are one of the most charismatic and well-studied groups of amphibians. Popularly known for their powerful skin toxins and extravagant aposematism, dendrobatids have featured in scientific studies for decades in fields as diverse as reproductive behavior [1,2], pharmacology [3,4,5], color evolution [6,7,8], and biogeography [9,10,11], as well as recently fueling important studies in the evolution of monogamy [12] and toxin autoresistance [13,14]. In the context of Anura, Dendrobatidae is moderately diverse, inhabiting a range of habitats and ecological niches throughout Central and South America. Many dendrobatids are unfortunately threatened by a variety of factors including habitat destruction [15,16] and smuggling for the pet trade [17,18], making their conservation an important priority for biologists. Despite heavy popular and scientific interest in dendrobatids, in-depth studies of dendrobatid phylogenetic systematics have become scarce despite the rapid progress of phylogenomics. In this paper, we aim to provide the first evolutionary hypothesis of Dendrobatidae derived from genomic-scale data, to put to rest many of the outstanding questions concerning dendrobatid phylogeny.
The first dendrobatid described was Rana tinctoria by Cuvier in 1797 [19], later transferred to Dendrobates by Wagler in 1830 [20], where it remains to this day. Since then, described dendrobatid diversity has grown significantly, with roughly 198 species in 16 genera as of 2019 (Table 1). Until the 2006 revision of Dendrobatidae by Grant et al. [21], most dendrobatid species were confined to the genera Dendrobates, Phyllobates, Colostethus, Epipedobates, and Minyobates. Phylogenetic estimates constructed during this time from molecular data [22,23,24,25,26,27,28,29,30] generally recovered two main clades of dendrobatids: one composed of mostly aposematic frogs in Phyllobates and Dendrobates, and the other composed of more cryptic frogs in Colostethus and Epipedobates. A third group, which would later be established as the subfamily Hyloxalinae, was generally placed as sister to the Dendrobates clade ([22,23,27], though see [28] for an exception). During this time, the systematics and taxonomy of Dendrobatidae and its sister family Aromobatidae (then regarded as part of Dendrobatidae; this is still the taxonomy used by AmphibiaWeb) were confused and inconsistent. Phylogenies produced during this period were mostly constructed from alignments of a few mitochondrial loci, making them vulnerable to incomplete lineage sorting [31,32].
In 2006, Grant et al. comprehensively revised Dendrobatidae [21], splitting many of the previously paraphyletic genera into a multitude of new, monophyletic ones: Ranitomeya, Adelphobates, and Oophaga from Dendrobates; Ameerega from Epipedobates; and Silverstoneia and Hyloxalus from Colostethus. Most species within Minyobates were absorbed into Ranitomeya, leaving M. steyermarki as the sole member of the now-monotypic genus. The dendrobatid tree was becoming clearer now, with the genera previously in Dendrobates, along with Phyllobates and Minyobates, forming the subfamily Dendrobatinae, Epipedobates, Ameerega, Colostethus, and Silverstoneia forming Colostethinae, and Hyloxalus forming its own subfamily Hyloxalinae, which Grant et al. recovered as sister to Dendrobatinae rather than Colostethinae, conflicting with most previous phylogenies [21]. After this seminal study, dendrobatid taxonomy continued to fragment, with Twomey and Brown erecting the genus Excidobates in 2008 [35], Brown et al. (2011) splitting Andinobates from Ranitomeya [43], and Grant et al. (2017) establishing Leucostethus, a sister genus to Ameerega, as well as Paruwrobates and Ectopoglossus, both members of Hyloxalinae, in another broad systematic review [41].
Since Grant et al.’s 2006 revision, relatively few large-scale phylogenetic studies of dendrobatids have been undertaken [41,44,45]. Santos et al. published a time-calibrated phylogeny of Dendrobatidae in 2009 constructed from ~2400 bp of mitochondrial data [44], and Pyron and Wiens (2011) published an Amphibia supertree constructed via maximum likelihood containing many representatives of Dendrobatidae [45]. Most recently, Grant et al. (2017) published the most comprehensive dendrobatid tree to date [41], constructed using parsimony, and containing representatives of all genera. They provided evidence for the paraphyly of Colostethus, as C. ruthveni is nested within Dendrobatinae. The latter two studies were based on approximately a dozen mitochondrial and nuclear loci, with the addition of morphological data in the case of Grant et al. (2017). All of these studies recover Hyloxalinae as the sister group to Dendrobatinae, not Colostethinae, consistent with many pre-2006 studies [22,23,24,25,26,27,29]. Previous estimates differ with respect to the sister genus of Dendrobates, which is either Oophaga [44] or Adelphobates [41,45]. Finally, the problematic taxon Minyobates steyermarki is recovered in various places throughout the dendrobatine phylogeny, either as sister to Adelphobates [45] or to all other dendrobatines aside from Phyllobates and C. ruthveni [41].
Many dendrobatid frogs are of conservation concern. The International Union for Conservation of Nature Red List of Threatened Species (also known as the IUCN Red List), is one of the world’s most comprehensive inventories of the global conservation status of biological species and has evaluated the status of many dendrobatids. It uses a set of criteria to evaluate the extinction risk of thousands of species globally and is recognized as an authority in the status of biological diversity. Here we present a novel approach for visualizing the relationships between IUCN Red List status, phylogenetic relationships, and spatial distributions. This is a tractable approach for visualizing complex patterns and large quantities of data in relatively simple infographics. These infographics are aimed at summarizing broad patterns, facilitating additional assessment, and complementing more detailed quantitative analyses.
In this study, we attempt to resolve the remaining uncertainties in dendrobatid phylogeny, specifically with regards to relationships between dendrobatid genera and subfamilies. Our primary advance for dendrobatid phylogenetics is the usage of genome-scale molecular markers known as ultraconserved elements (UCEs) [46,47], which provide an order of magnitude more molecular data to work with than previous studies and span the genome across chromosomes [47,48]. UCEs consist of an “ultraconserved” core region with identity or near-identity across the taxon set in question, along with increasingly divergent flanking regions with phylogenetic signal that evidence suggests is greater than in traditional protein-coding loci [49]. UCEs have become popular phylogenomic markers largely thanks to the ease with which thousands of UCE loci can be sequenced from even old museum specimens [50,51]. In recent years, UCEs have been used in many phylogenomic studies of vertebrates, and have been instrumental in resolving difficult phylogenetic problems at both deep and shallow timescales [52,53,54,55,56,57,58]. The use of UCEs in phylogenomic studies is appealing due to UCE loci having little overlap with paralogs [59], being found in genomic regions with few transposons [60], and having low saturation rates that decrease the possibility of homoplasy [58]. A study by Gilbert et al. (2015) showed that UCEs contain considerably more net phylogenetic informativeness than traditional protein-coding nuclear loci [49]. All of these factors led us to use UCE sequence capture as our method of choice for generating a phylogenomic dataset of the dendrobatid poison frogs. Here we provide the first dendrobatid phylogeny constructed from genome-scale data, which we hope will anchor future evolutionary studies of this fascinating amphibian group.
2. Materials and Methods
2.1. Data Collection
We gathered 63 dendrobatoid tissue samples from a combination of museum collections, our own field work, and the collections of collaborators (Table S1). Our sample represents 36 species in 13 dendrobatid genera (the newly erected genera Paruwrobates, Ectopoglossus, and Leucostethus were not included) and includes the aromobatid Allobates femoralis as an outgroup taxon. In many cases, we include multiple representatives of a given species to account for geographic variation.
For each sample, we performed sequence capture of UCEs in the manner of Faircloth et al. [46]. We extracted genomic DNA from each tissue sample with the Qiagen DNeasy Blood and Tissue Kit (Valencia, CA, USA) and performed quality and yield assessment with a Qubit 3 fluorometer (ThermoFisher Scientific). Extracted DNA was sent to RAPiD Genomics (Gainesville, FL, USA), who performed Illumina sequencing of UCEs, enriching the samples with the Tetrapods-UCE-5Kv1 probe set, which contains 5472 probes that target 5060 UCE loci. Raw reads for each sample are available at the NCBI Sequence Read Archive under project number PRJNA547821.
2.2. Bioinformatics Pipeline
We used the software package PHYLUCE v1.5.0 [61] and associated tools to trim, assemble, and align our sequenced reads. We performed quality trimming on raw reads using Illumiprocessor v2.0.6 [62], a Python wrapper for Trimmomatic v0.36 [63]. We then assembled the trimmed reads with Trinity v1.6 [64] as implemented in PHYLUCE. After assembly, we created two separate taxon sets for later analyses: one containing all samples (n = 63, “large dataset”), the other with one sample per species (n = 37, “small dataset”). The purpose of the small dataset was to increase computational efficiency for divergence time estimation. After mapping assembled contigs to UCE loci using PHYLUCE, we retained 2733 loci for the large dataset and 2639 for the small one. We performed individual alignments on each locus using MUSCLE v3.8.31 [65] as implemented in PHYLUCE. We filtered for matrix incompleteness by only retaining loci present in 60% or more of taxa and performed additional filtering by calculating the number of parsimony-informative sites (PIS) with PHYLOCH v1.5-5 [66], implemented in a custom R script, and retaining only loci with 10 < PIS < 120. Our upper limit on PIS was to filter out outlier loci, while our lower limit was to filter out relatively uninformative loci. After both filtering steps, for the large dataset we retained 1719 of the original 2733 loci, and for the small dataset we retained 1706 of the original 2639 loci. This study was conducted in accordance with the Institutional Animal Care and Use Committee of Southern Illinois University (Protocol number: 18-009, Animal Assurance number: D16-00044).
2.3. Phylogenetic Analyses
For both large and small datasets, we performed both maximum likelihood (ML) and multispecies coalescent-consistent phylogenetic analyses. We used IQ-TREE v1.5.5 [67] to perform our ML analyses, using a general time-reversible (GTR) model and assessing support with 10,000 ultrafast bootstrap replicates [68]. ML analyses were performed on an unpartitioned concatenated matrix (large matrix: 787,199 characters; small matrix: 786,510 characters) to increase computational efficiency. As UCEs are usually not protein-coding, it is unclear which partition schemes should be used for them, or whether they should be used at all [55].
We also inferred the dendrobatid species tree using ASTRAL-III v5.6.1 [69], a summary method consistent with the multispecies coalescent. ASTRAL-III accounts for incomplete lineage sorting by summarizing gene trees constructed separately for each locus, rather than effectively assuming the whole set of loci acts as a single gene, as in a concatenated ML analysis. We made individual gene trees for each UCE locus in IQ-TREE with a GTR model and 1000 ultrafast bootstrap replicates. We contracted near-zero branch lengths to polytomies in the gene trees with IQ-TREE’s -czb option, an approach recommended by Persons et al. (2016) [70] to reduce downstream bias. We used the gene trees as input for ASTRAL-III. For the large dataset, we assigned each sample to one of 38 putative species in a mapping file used as input with ASTRAL’s -a option. For the small dataset, we omitted the mapping file so that ASTRAL-III correctly assumed that each sample corresponded to its own species.
2.4. Divergence Time Estimation
We performed divergence time estimation of our dendrobatid phylogeny using BEAST 2 v2.5.0 [71]. Because Bayesian methods are computationally intensive, we reduced our small dataset, consisting of 1706 loci for 37 samples, to four subsets of 50 random loci each for analysis in BEAST, amounting to a total matrix size of 92,742 characters. We analyzed each subset twice in order to ensure that convergence occurred. We concatenated the loci in each subset and did not partition the alignment in order to avoid the intractably long periods of time a partitioned Bayesian analysis can take to converge [72].
We used the utility BEAUti to specify our BEAST settings. We used an HKY model with 4 gamma rate categories, with base frequencies set to “empirical,” avoiding the GTR model because it can lead to overparameterization and subsequently low ESS values [73]. We used a relaxed log-normal clock model with a clock rate prior of 1e-10, the same order of magnitude as an estimate of avian UCE substitution rates from Winker et al. [74]. To further reduce computational demands, we fixed the analysis to our small ASTRAL topology by setting the subtreeSlide, narrowExchange, wideExchange, and wilsonBalding operators to zero, an approach used by Hsiang et al. [75]. We used a Yule tree prior with other priors set to their default values.
For our divergence time calibration, we used an indirect calibration derived from the timetree provided by Santos et al. (2009) [44]. Divergence time estimation in dendrobatids is a difficult problem because they lack a fossil record. Santos et al. calibrated their dendrobatid tree by nesting it within a tree for the whole of Amphibia, which has a voluminous fossil record, and using a combination of paleogeographic, fossil, and molecular clock evidence to date that amphibian tree. For our study, we use Santos et al.’s estimation of the divergence between Dendrobatidae and Aromobatidae (i.e., the node separating Allobates femoralis from the rest of our samples). The average of Santos et al.’s three estimations of this node’s age was 38.534 Ma with σ = 5.151 Ma. Our calibration assigned a normal distribution with these values to this node.
We ran each analysis with an MCMC chain length of 100,000,000 generations, with a log sampling frequency of 100,000 generations and a tree sampling frequency of 10,000 generations. We assessed convergence between runs of each subset and ESS values for each run with Tracer v1.7.1 [76]. We found that all parameters had ESS values over the popular threshold of 200, and that convergence was reached for each subset. We used LogCombiner v2.5.0 [71] to combine the posterior distributions of trees from each of the eight runs, accounting for a burn-in of 10%. We then used TreeAnnotator v2.5.0 [71] to summarize the combined tree files, targeting the maximum clade credibility tree with mean node heights.
2.5. Visualizing Evolutionary History, Conservation Risk, and Spatial Distributions
To better understand how the evolutionary history and the geographic distribution of poison frogs impacts their conservation status and extinction risk, we downloaded IUCN Red List classifications for all surveyed species of Dendrobatidae and its sister family Aromobatidae (n = 285) [77]. For each species, we recorded its population status, Red List status, and its countries of occurrence. The relationships between these factors were visualized in two circular plots created in the R package circlize [78]. The phylogenetic results of this study and those of Grant et al. (2017) [41] characterized the genus-level relationships among all input species.
3. Results
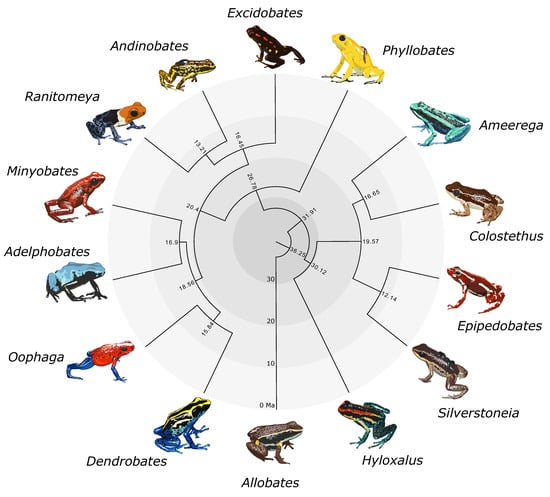
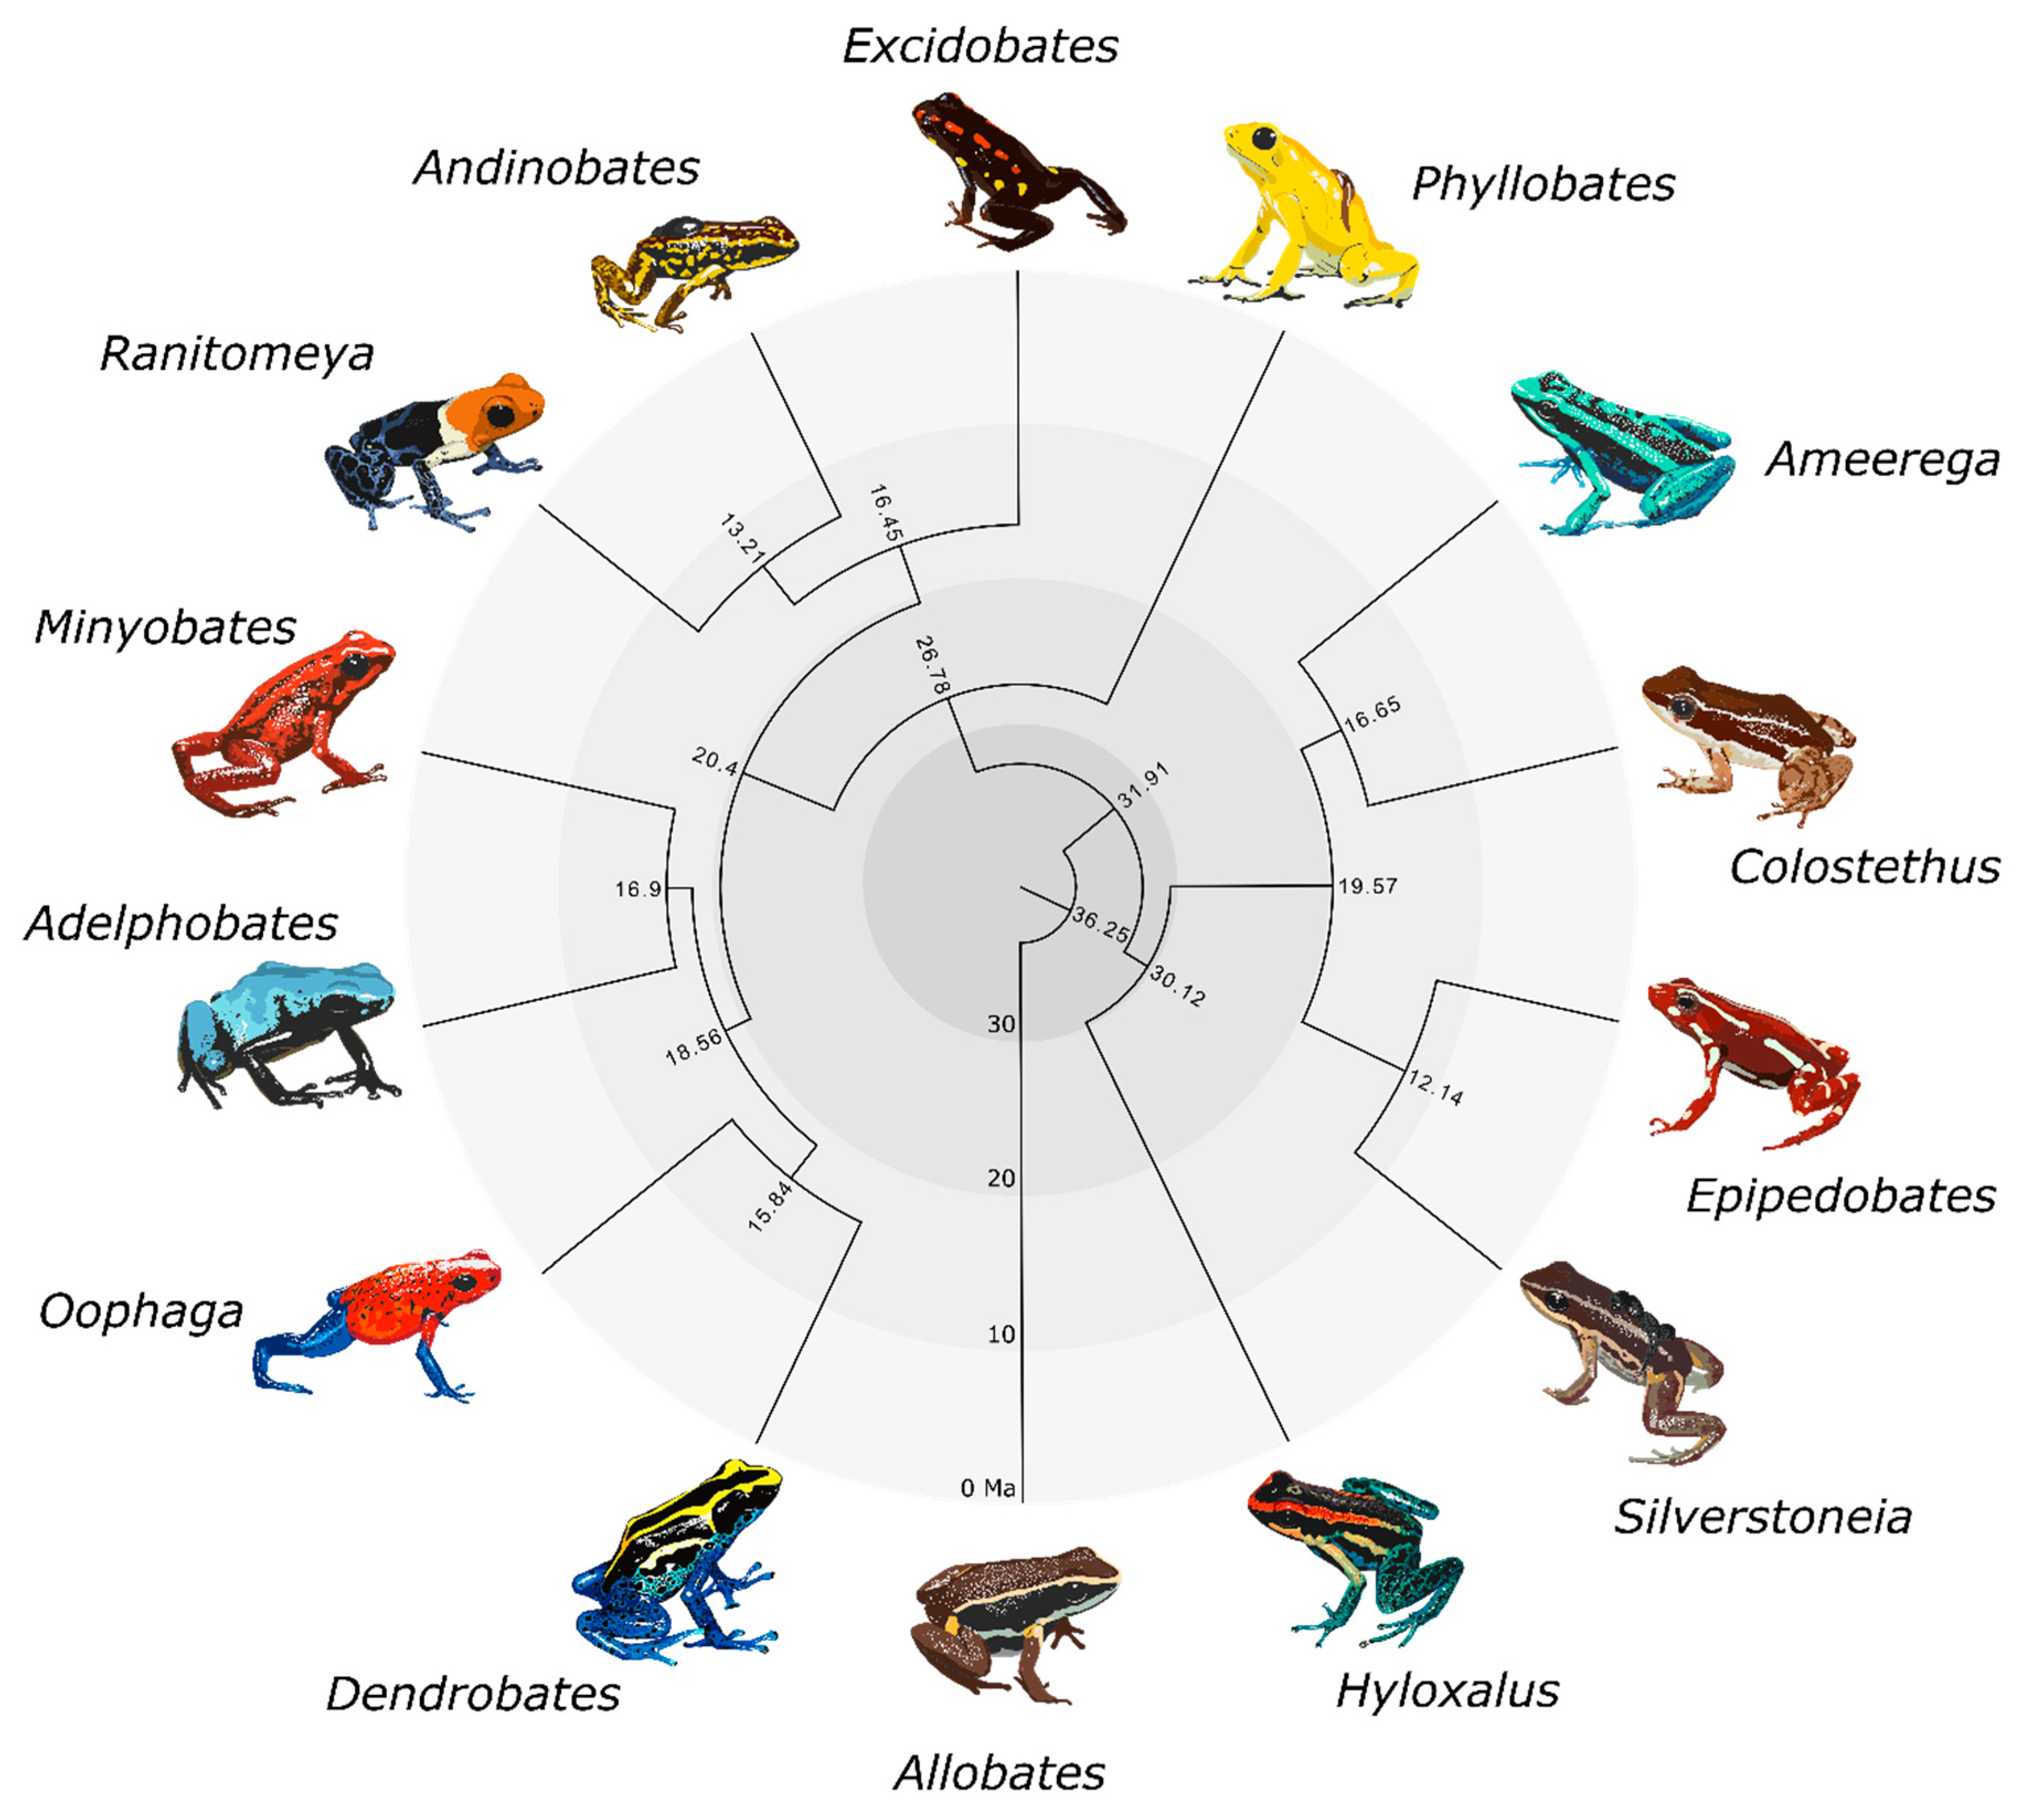
We obtained two maximum likelihood trees from IQ-TREE and two species trees from ASTRAL-III. A summarized genus-level phylogeny with divergence times is shown in Figure 1. The large IQ-TREE phylogeny (Figure S1) and small IQ-TREE phylogeny (Figure S2a) had identical topologies in terms of relationships between species. The large ASTRAL-III phylogeny (where 63 samples were coalesced into 38 species; Figure S2b) was nearly identical to the small ASTRAL-III phylogeny (Figure S2c) and the small IQ-TREE phylogeny (Figure S2a), with the exceptions of the additional unidentified Allobates sp. sample and the rearrangement of several Ameerega species (Figure S2b, gray labels). Topologies for the small IQ-TREE and small ASTRAL-III analyses were also identical (Figure S2), pointing to an overall concordance between methods. In terms of species relationships, the large ASTRAL-III topology differed from the large IQ-TREE topology only in the rearrangement of the three Ameerega species mentioned above. Topologies and support values were extremely similar across trees. Each genus was always monophyletic with high support, as well as the three dendrobatid subfamilies. We found Hyloxalinae sister to Colostethinae rather than Dendrobatinae. In all trees, Oophaga was recovered as sister to Dendrobates, and Minyobates was recovered as sister to Adelphobates (Figure 1). Regarding other generic relationships, we found that the clade containing Oophaga and Dendrobates is sister to the clade containing Adelphobates and Minyobates. Ranitomeya and Andinobates are recovered as sister genera, with Excidobates sister to this clade. Phyllobates is recovered as the sister genus to all other dendrobatines. In Colostethinae, we recovered Epipedobates and Silverstoneia as sister genera, with this clade itself sister to the clade containing Ameerega and Colostethus.
Node age estimates and associated error bars (representing uncertainty in node age estimates) are summarized in Table S2 and visualized in a time-calibrated phylogeny in Figure S3. Uncertainty in node age generally increases with deeper time. Our analyses indicate the subfamilies Colostethinae and Hyloxalinae diverged around 30 ± 10 mya. Dendrobatinae diverged from the common ancestor of Hyloxalinae and Colostethinae around 32 ± 10 mya. Dendrobatidae diverged from its sister family Aromobatidae 36 ± 10 mya.
4. Discussion
Establishing a robust understanding of phylogenetic relationships in Dendrobatidae is crucial for addressing questions about dendrobatid evolution and directing conservation efforts towards areas of diversity in maximum need. While a handful of studies have generated phylogenies of the family in recent years, none has used genomic data in their analyses. We used maximum likelihood and coalescent methods in conjunction with a large matrix of genomic markers to construct the first phylogenomic tree of Dendrobatidae. The usage of ML and coalescent methods in conjunction with genome-scale UCE data is intended to bring the status of dendrobatid phylogenetics more in line with current studies in herpetological phylogenetics, which frequently make use of these techniques [53,54,55,56,57]. Concerns with parsimony, which was used to construct the most recent large-scale phylogenetic analysis of dendrobatids [41], as a statistically-consistent phylogenetic method [79,80,81], and the presence of potential incomplete lineage sorting among large numbers of genes [32,58], also compelled us to use these techniques. Additionally, we estimated divergence times using a Bayesian method, which is currently the most widely-used and accepted type for divergence time estimation [82]. We found that most relationships among dendrobatid genera are largely congruous with the results of past studies, with some exceptions (see below). Our estimated divergence times are very similar to those estimated by Santos et al. (2009), which is to be expected since we used secondary calibrations taken from their study (Figure S3) [44]. However, our divergence time estimation involves different methods (BEAST 2 [71] rather than MULTIDIVTIME [83]) and considerably more genetic data (92,742 characters vs 2380 characters in Santos et al. [44]). Additionally, we recognize that since we used a secondary calibration taken from Santos et al.’s study due to the lack of poison frog fossils, our divergence time estimates may be biased towards younger node dates [84].
Much of our phylogeny is consistent with past phylogenies from mitochondrial and nuclear datasets, but with some key differences. Our analyses place Hyloxalinae sister to Colostethinae rather than Dendrobatinae [22,23], contrary to more recent studies on the family [21,41,44,45]. We also find support for placing the genus Dendrobates sister to Oophaga [21,22,23,35,44], in contrast to previous placements of Dendrobates as sister to Adelphobates [29,41,45], or even the rest of Dendrobatinae [43]. Lastly, we find strong support for placing Minyobates sister to Adelphobates. This problematic taxon has previously been placed anywhere from sister to Excidobates [29], to the rest of Dendrobatinae (excluding Phyllobates) [21,41]. Our conclusion for the placement of Minyobates corroborates placements recovered by more recent analyses that utilized maximum likelihood and Bayesian methods [35,44,45] rather than parsimony [21,41].
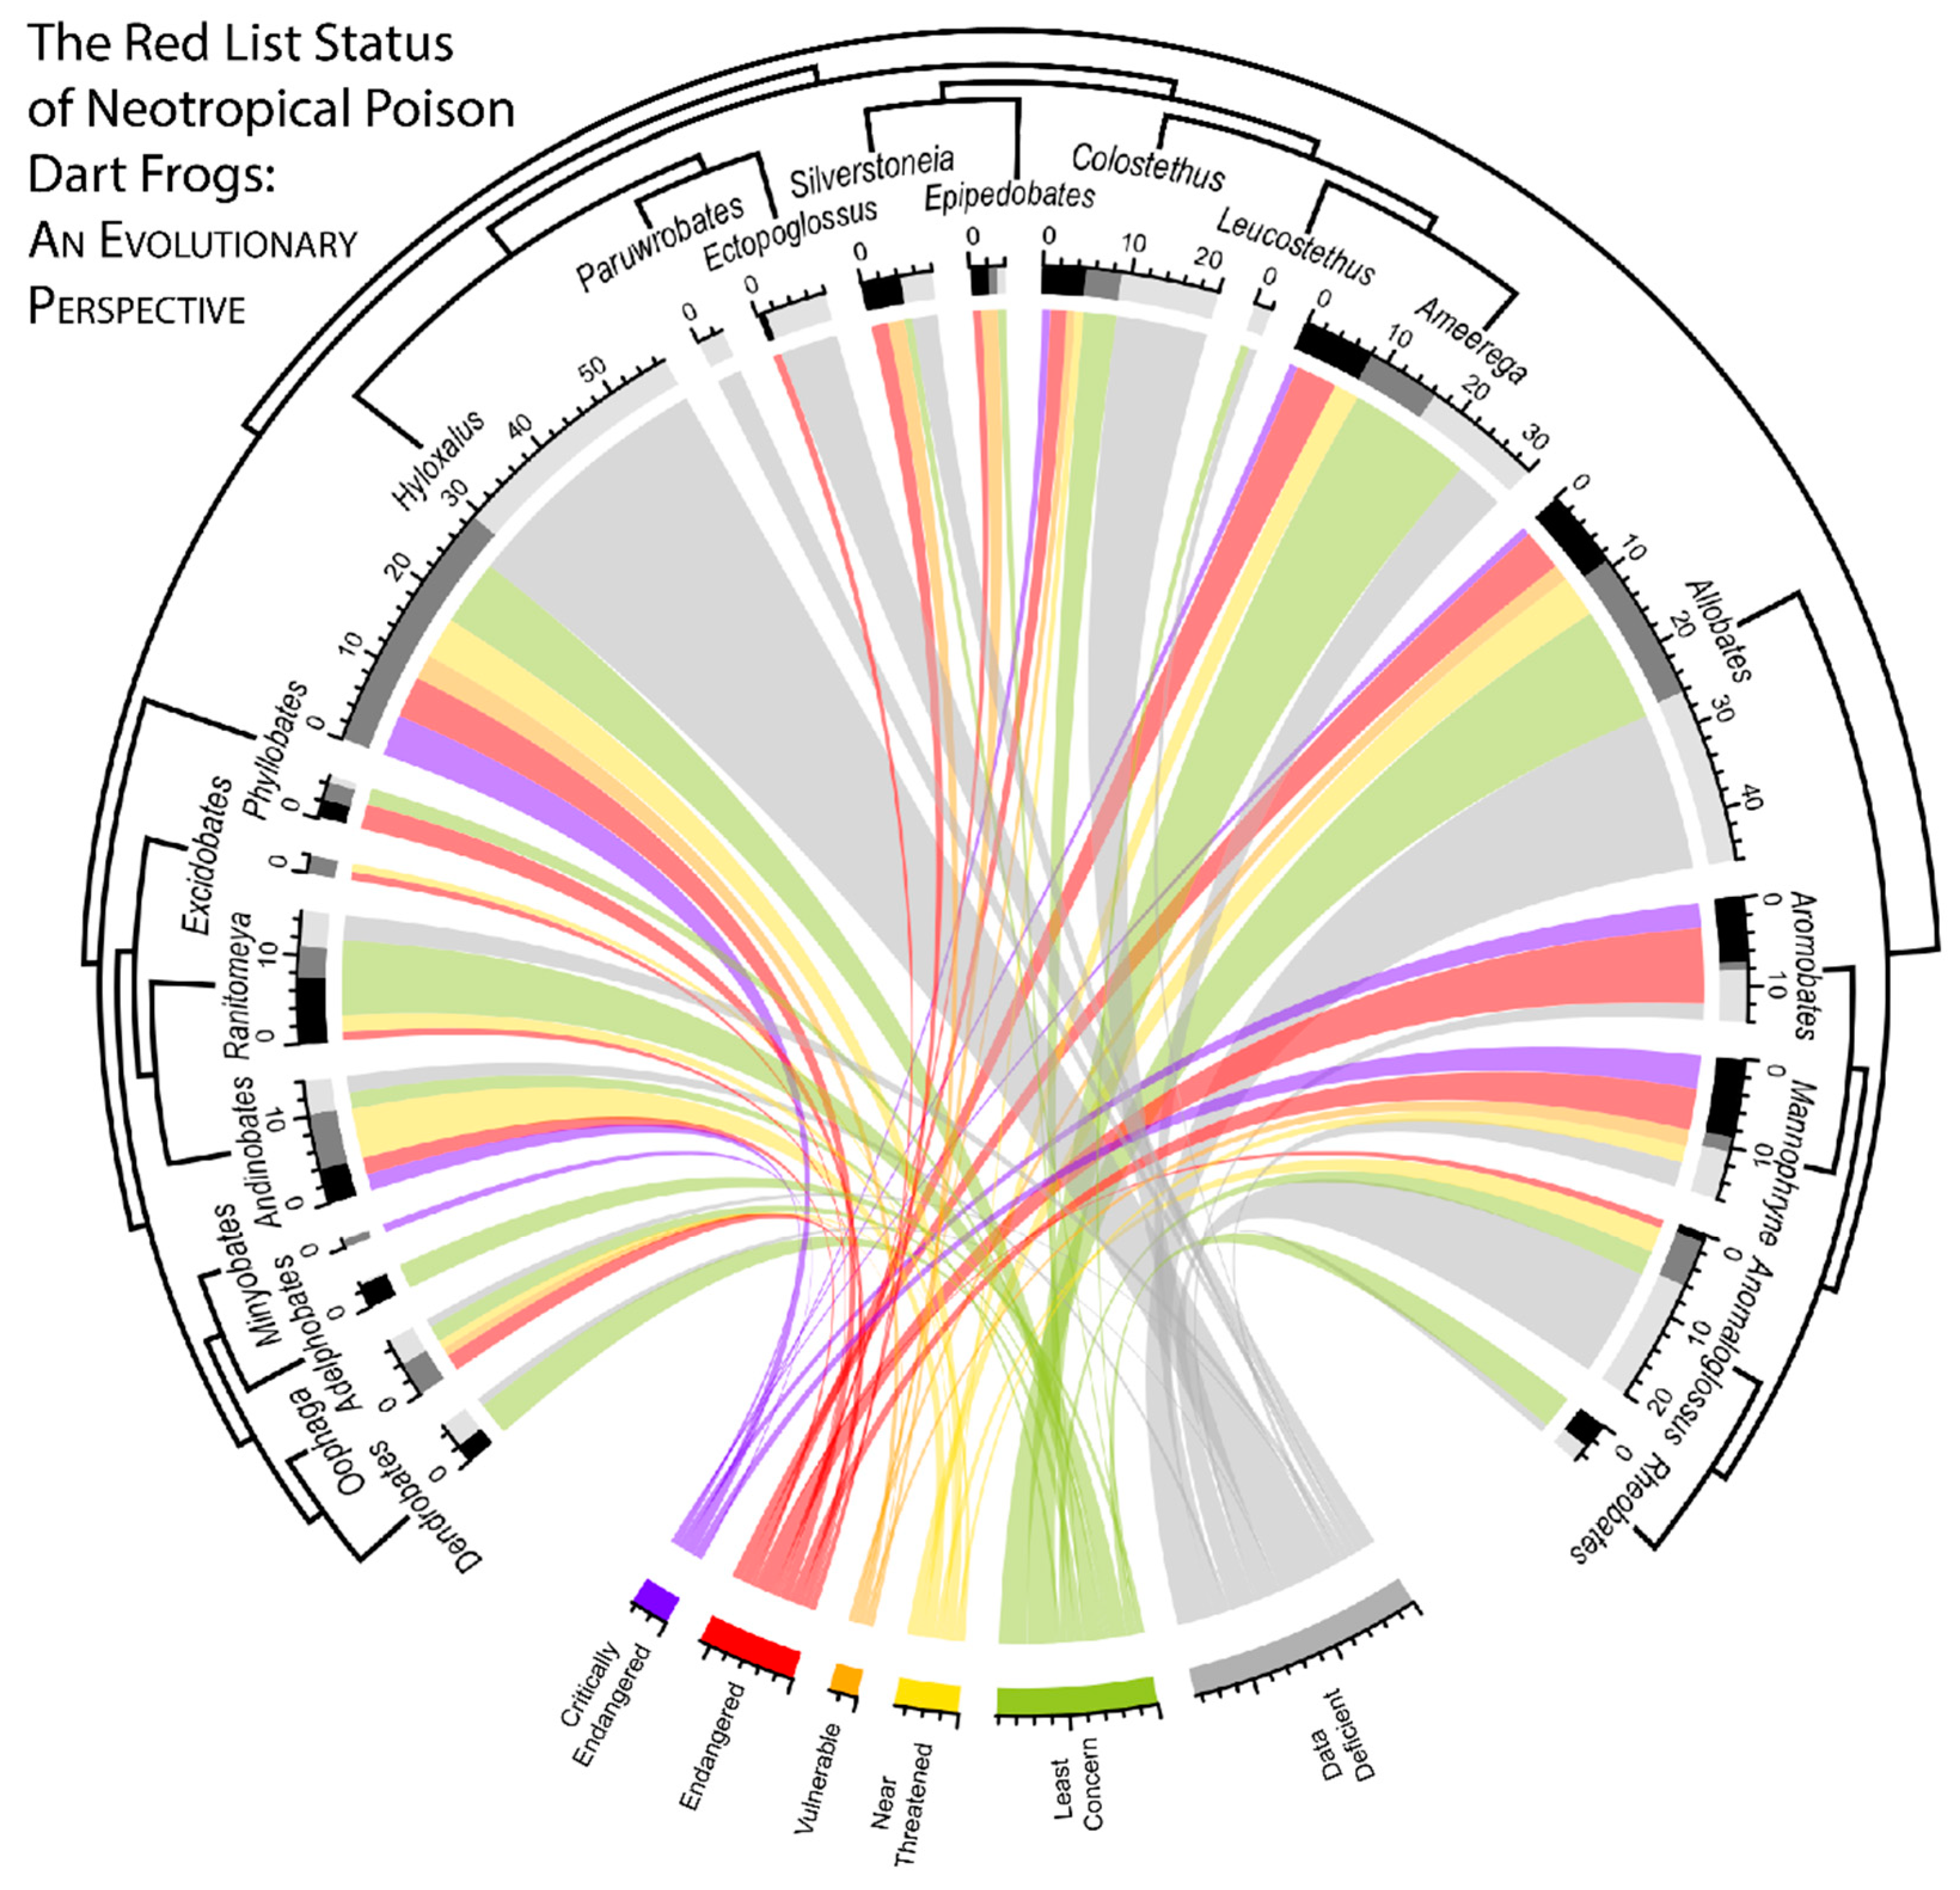
Maximizing efforts to conserve poison frogs (and other species) requires identifying both vulnerable lineages and geographical areas. A crucial step in this process is clarifying the evolutionary relationships of the taxa of interest, followed by the collection of basic population, distributional, and life history data for each taxon. Like many tropical amphibians, poison frogs face threats including habitat destruction [15,16] and smuggling for the pet trade [17,18,43]. Despite being one of the better-studied groups of frogs, a surprising number of poison frog species evaluated by the IUCN were classified as “data deficient” (37.5%, 107 of 285 species), hampering basic aspects of their conservation. Many of these data-deficient taxa belong to understudied genera with mostly cryptic coloration. In particular, the four genera Hyloxalus, Colostethus, Allobates, and Anomaloglossus contain a majority (70.1%, 75 of 107) of the “data deficient” taxa (Figure 2). In addition, though comprised of only a few species, little is known of the genera Paruwrobates and Ectopoglossus, where 3 (of 3) and 7 (of 8) of the contained species are classified as “data deficient”, respectively (Table S3). Further, in Ectopoglossus, the only species not classified as “data deficient” is classified as “endangered,” increasing the urgency for collecting basic life-history data in this group.
Roughly a quarter (22.1%, 63 of 285) of poison frog species were classified as “critically endangered” or “endangered” (18 and 45 species, respectively). Many of these at-risk taxa are concentrated in a few genera, most notably the clade that contains the two Aromobatid genera endemic to the northern Andes, Aromobates and Mannophryne (containing six “critically endangered” and 14 “endangered” species). The genera Allobates, Hyloxalus, and Ameerega contain a majority of the remaining at-risk species, though the proportions of at-risk species are similar to those of other genera. Additional unique evolutionary lineages of concern, though represented by only a few species, are the genera Phyllobates, Excidobates and Minyobates, where most surveyed taxa are at-risk (Table S3).
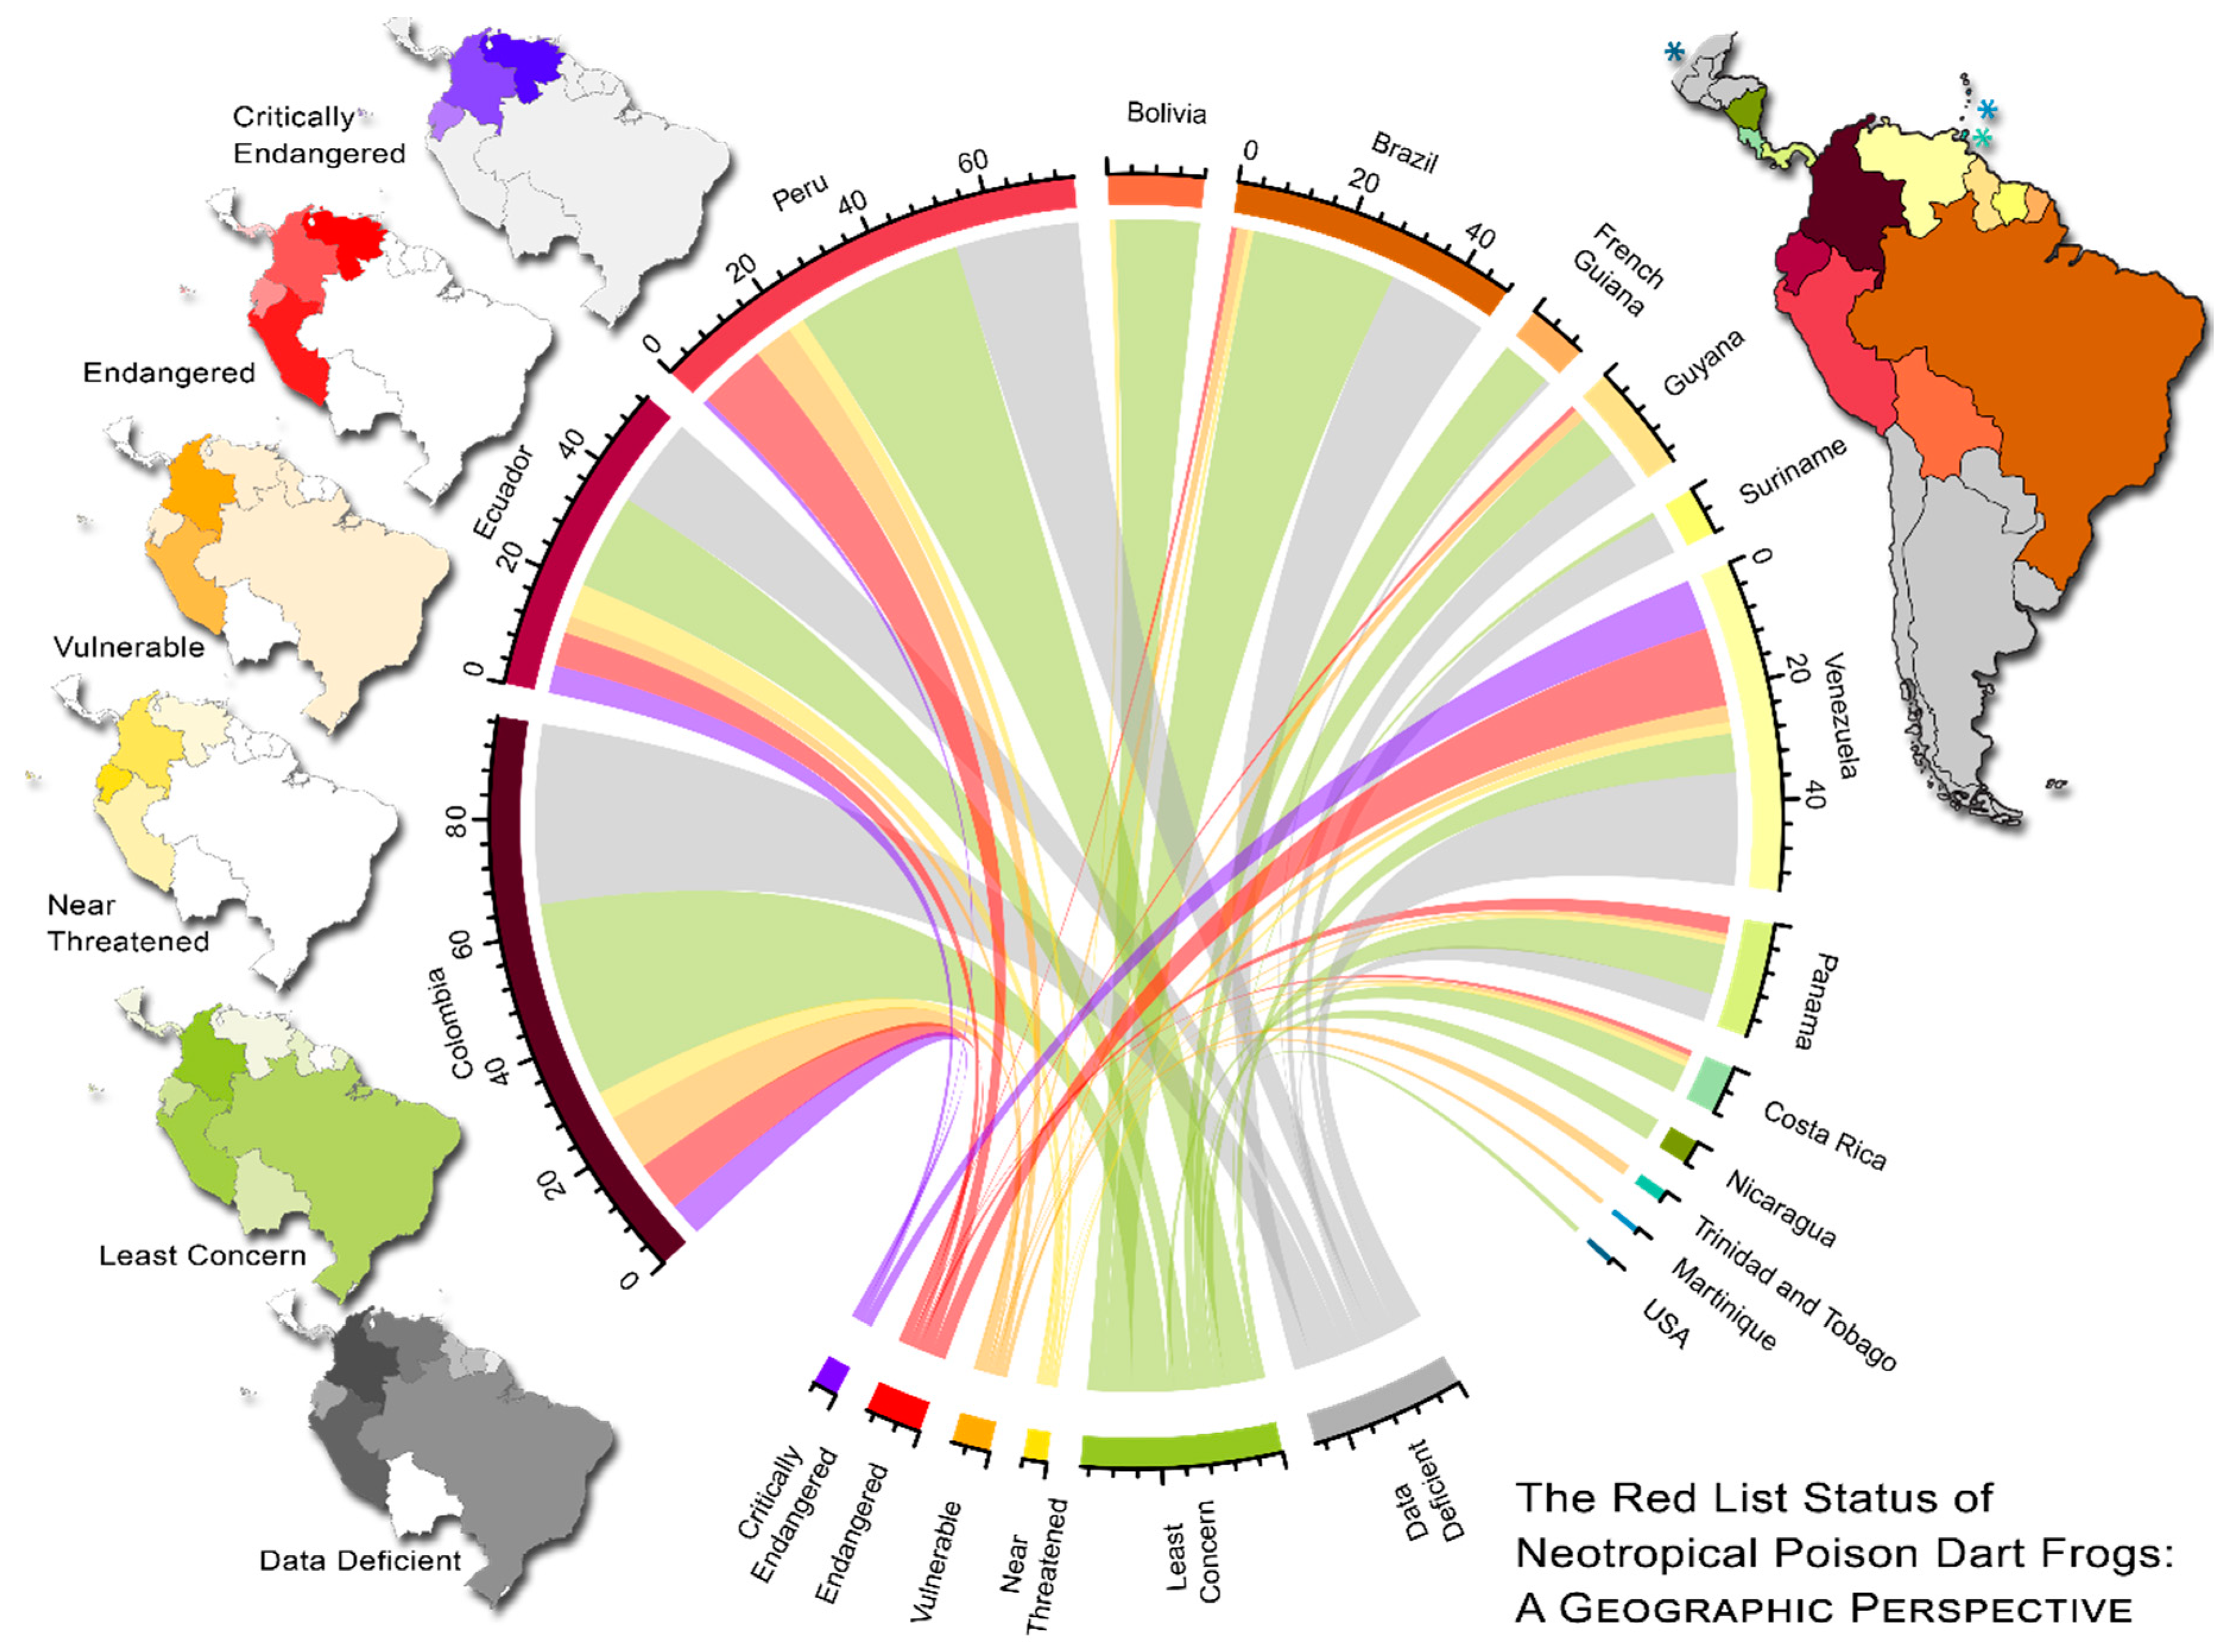
Furthermore, some geographic zones possess much higher at-risk diversity than others (“critically endangered” and ”endangered” in Figure 3). The northern Andean countries possess both the highest species diversity and the highest diversity of at-risk species, especially Colombia, Peru, and Venezuela. (Figure 3). However, only Venezuela’s proportions of ‘at-risk’ species are much greater than the country average, with 25.5% “endangered” and 16.4% “critically endangered” (average of 11.3% and 5.1%, respectively; Table S4). In contrast, countries with mostly lower elevation species (e.g., Brazil or Bolivia) seem to be well below the average of at-risk species (Table S4).
The circular infographics presented here are intended to represent a tractable way to visualize relationships between IUCN Red List categorizations, phylogenetic relationships, and geographic distributions of large numbers of related taxa (here two sister families). It is important to acknowledge that IUCN assessments are updated, on average, every decade. Thus, assessments and population trends represent a coarse temporal grain. Further, the spatial categorization by countries is overly simplistic and does not accurately reflect most species’ actual ranges, as environment transcends political boundaries. However, given that environmental policy often occurs at the country level, this remains a practical spatial scope for summarizing assessment data. Lastly, our visualizations are not intended to replace more detailed quantitative assessments e.g., [85,86], but provide a novel perspective of the widely available IUCN data.
Here, we present the first broad-scale phylogenomic reconstruction of Dendrobatidae, furthering the continual study of poison frog systematics. In the future, we hope to improve taxon sampling, as here we were unable to acquire genetic samples for the newly erected genera Leucostethus, Paruwrobates and Ectopoglossus [41], and so their placement in the dendrobatid phylogeny is still predicated on Grant et al.’s (2017) analysis [41]. We were also unable to corroborate the paraphyly of Colostethus on account of missing genetic data for C. ruthveni. A future phylogenomic reconstruction of this group would benefit from inclusion of these taxa to ensure representation of all groups within Dendrobatidae and its sister family Aromobatidae. Lastly, we hope we have inspired researchers, field biologists, and conservation biologists to help address the highlighted conservation issues in these wonderful amphibians.
Supplementary Materials
Raw reads have been deposited in the NCBI Sequence Read Archive under project number PRJNA547821. The following are available online at https://0-www-mdpi-com.brum.beds.ac.uk/1424-2818/11/8/126/s1, Figure S1: Species-level phylogeny of all 61 samples included in the study, constructed using IQ-TREE (maximum likelihood), Figure S2: Comparison of (a) maximum likelihood tree made using IQ-TREE with the restricted dataset, (b) species tree made using ASTRAL-III with the comprehensive dataset, and (c) species made using ASTRAL-III with the restricted dataset, Figure S3: Species-level chronogram calibrated with BEAST 2 showing node numbers and uncertainty in divergence time estimation, Table S1: List of dendrobatoid samples included in our phylogenomic analyses and associated locality data, Table S2: Summary of divergence time estimation with BEAST 2, Table S3: IUCN Red List categories of dendrobatoids by genus, Table S4: IUCN Red List categories of dendrobatoids by country.
Author Contributions
Conceptualization: W.X.G. and J.L.B. Methodology: W.X.G. and J.L.B. Validation: W.X.G., M.R.M., and J.L.B. Formal Analysis: W.X.G. and M.R.M. Investigation: J.L.B. Resources: J.L.B., K.S. Data Curation: W.X.G. and M.R.M. Writing—Original Draft Preparation: W.X.G., M.R.M., and J.L.B. Writing – Review and Editing: W.X.G., M.R.M., J.L.B., and K.S. Author Contribution List-Maker: M.R.M. Food Stylist: W.X.G. Visualization: W.X.G. and J.L.B. Supervision: J.L.B. Project Administration: J.L.B. Funding Acquisition: J.L.B.
Funding
This research was funded by start-up funding to J.L.B. from Southern Illinois University Carbondale.
Acknowledgments
We are grateful for the continued support of Southern Illinois University, East Carolina University, Servicio Nacional Forestal y de Fauna Silvestre (Peru), and Centro de Ornitología y Biodiversidad (CORBIDI). We thank Ivan Prates and Miguel T. Rodrigues for generously providing several tissue samples. We are thankful to Peter Larson, Ryan Campbell and Anne Yoder for providing inspiration for Figure 2 and Figure 3. M.R.M. and W.X.G. are grateful for support from the Students United in Preserving, Exploring, and Researching Biodiversity (SUPERB) fellowship, funded by the US National Science Foundation (NSF).
Conflicts of Interest
The authors declare no conflict of interest.
References
- Wells, K.D. Behavioral ecology and social organization of a dendrobatid frog (Colostethus inguinalis). Behav. Ecol. Sociobiol. 1980, 6, 199–209. [Google Scholar] [CrossRef]
- Summers, K.; Symula, R.; Clough, M.; Cronin, T. Visual mate choice in poison frogs. Proc. R. Soc. B Biol. Sci. 1999, 266, 2141–2145. [Google Scholar] [CrossRef] [Green Version]
- Daly, J.W.; Myers, C.W. Toxicity of Panamanian poison frogs (Dendrobates): Some biological and chemical aspects. Science 1967, 156, 970–973. [Google Scholar] [CrossRef]
- Daly, J.W.; McNeal, E.T.; Overman, L.E.; Ellison, D.H. A new class of cardiotonic agents: Structure-activity correlations for natural and synthetic analogs of the alkaloid pumiliotoxin B (8-hydroxy-8-methyl-6-alkylidene-1-azabicyclo [4.3.0] nonanes). J. Med. Chem. 1985, 28, 482–486. [Google Scholar] [CrossRef]
- Spande, T.F.; Garraffo, H.M.; Edwards, M.W.; Yeh, H.J.C.; Pannell, L.; Daly, J.W. Epibatidine: A novel (chloropyridyl) azabicycloheptane with potent analgesic activity from an Ecuadoran poison frog. J. Am. Chem. Soc. 1992, 114, 3475–3478. [Google Scholar] [CrossRef]
- Maan, M.E.; Cummings, M.E. Sexual dimorphism and directional sexual selection on aposematic signals in a poison frog. Proc. Natl. Acad. Sci. USA 2009, 106, 19072–19077. [Google Scholar] [CrossRef] [Green Version]
- Wang, I.J.; Shaffer, H.B. Rapid color evolution in an aposematic species: A phylogenetic analysis of color variation in the strikingly polymorphic strawberry poison-dart frog. Evolution 2008, 62, 2742–2759. [Google Scholar] [CrossRef]
- Santos, J.C.; Cannatella, D.C. Phenotypic integration emerges from aposematism and scale in poison frogs. Proc. Natl. Acad. Sci. USA 2011, 108, 6175–6180. [Google Scholar] [CrossRef] [Green Version]
- Brown, J.L.; Twomey, E. Complicated histories: Three new species of poison frogs of the genus Ameerega (Anura: Dendrobatidae) from north-central Peru. Zootaxa 2009, 2049, 38. [Google Scholar] [CrossRef]
- Noonan, B.P.; Gaucher, P. Refugial isolation and secondary contact in the dyeing poison frog Dendrobates tinctorius. Mol. Ecol. 2006, 15, 4425–4435. [Google Scholar] [CrossRef]
- Gehara, M.; Summers, K.; Brown, J.L. Population expansion, isolation and selection: Novel insights on the evolution of color diversity in the strawberry poison frog. Evol. Ecol. 2013, 27, 797–824. [Google Scholar] [CrossRef]
- Young, R.L.; Ferkin, M.H.; Ockendon-Powell, N.F.; Orr, V.N.; Phelps, S.M.; Pogány, Á.; Richards-Zawacki, C.L.; Summers, K.; Székely, T.; Trainor, B.C.; et al. Conserved transcriptomic profiles underpin monogamy across vertebrates. Proc. Natl. Acad. Sci. USA 2019, 116, 1331–1336. [Google Scholar] [CrossRef] [Green Version]
- Tarvin, R.D.; Santos, J.C.; O’Connell, L.A.; Zakon, H.H.; Cannatella, D.C. Convergent substitutions in a sodium channel suggest multiple origins of toxin resistance in poison frogs. Mol. Biol. Evol. 2016, 33, 1068–1081. [Google Scholar] [CrossRef]
- Tarvin, R.D.; Borghese, C.M.; Sachs, W.; Santos, J.C.; Lu, Y.; O’Connell, L.A.; Cannatella, D.C.; Harris, R.A.; Zakon, H.H. Interacting amino acid replacements allow poison frogs to evolve epibatidine resistance. Science 2017, 357, 1261–1266. [Google Scholar] [CrossRef] [Green Version]
- Whitfield, S.M.; Bell, K.E.; Philippi, T.; Sasa, M.; Bolaños, F.; Chaves, G.; Savage, J.M.; Donnelly, M.A. Amphibian and reptile declines over 35 years at La Selva, Costa Rica. Proc. Natl. Acad. Sci. USA 2007, 104, 8352–8356. [Google Scholar] [CrossRef] [Green Version]
- Angulo, A.; von May, R.; Icochea, J. A reassessment of the extinction risk of the critically endangered Oxapampa poison frog Ameerega planipaleae (Dendrobatidae). Oryx 2018, 53, 1–4. [Google Scholar] [CrossRef]
- Auliya, M.; García-Moreno, J.; Schmidt, B.R.; Schmeller, D.S.; Hoogmoed, M.S.; Fisher, M.C.; Pasmans, F.; Henle, K.; Bickford, D.; Martel, A. The global amphibian trade flows through Europe: The need for enforcing and improving legislation. Biodivers. Conserv. 2016, 25, 2581–2595. [Google Scholar] [CrossRef]
- Gorzula, S. The trade in dendrobatid frogs from 1987 to 1993. Herpetol. Rev. 1996, 27, 116–123. [Google Scholar]
- Cuvier, G.L.C.F.D. An VI. In Tableau Élémentaire de l’Histoire Naturelle des Animaux; Baudoin: Paris, France, 1797. [Google Scholar]
- Wagler, J.G. Natürliches System der Amphibien, mit Vorangehender Classification der Säugthiere und Vogel: Ein Neitrag zur Vergleichenden Zoologie; J.G. Cottasche Buchhandlung Nachfolger: Stuttgart, Germany, 1830. [Google Scholar]
- Grant, T.; Frost, D.R.; Caldwell, J.P.; Gagliardo, R.; Haddad, C.F.B.; Kok, P.J.R.; Means, D.B.; Noonan, B.P.; Schargel, W.E.; Wheeler, W.C. Phylogenetic systematics of dart-poison frogs and their relatives (Amphibia: Athesphatanura: Dendrobatidae). Bull. Am. Mus. Nat. Hist. 2006, 299, 1–262. [Google Scholar] [CrossRef]
- Vences, M.; Kosuch, J.; Lötters, S.; Widmer, A.; Jungfer, K.-H.; Köhler, J.; Veith, M. Phylogeny and classification of poison frogs (Amphibia: Dendrobatidae), Based on mitochondrial 16S and 12S ribosomal RNA gene sequences. Mol. Phylogenet. Evol. 2000, 15, 34–40. [Google Scholar] [CrossRef]
- Clough, M.; Summers, K. Phylogenetic systematics and biogeography of the poison frogs: Evidence from mitochondrial DNA sequences. Biol. J. Linn. Soc. 2000, 70, 515–540. [Google Scholar] [CrossRef]
- Widmer, A.; Lötters, S.; Jungfer, K.H. A molecular phylogenetic analysis of the neotropical dart-poison frog genus Phyllobates (Amphibia: Dendrobatidae). Naturwissenschaften 2000, 87, 559–562. [Google Scholar] [CrossRef]
- Summers, K.; Clough, M.E. The evolution of coloration and toxicity in the poison frog family (Dendrobatidae). Proc. Natl. Acad. Sci. USA 2001, 98, 6227–6232. [Google Scholar] [CrossRef] [Green Version]
- La Marca, E.; Vences, M.; Lötters, S. Rediscovery and mitochondrial relationships of the dendrobatid frog Colostethus humilis suggest parallel colonization of the Venezuelan Andes by poison frogs. Stud. Neotrop. Fauna Environ. 2002, 37, 233–240. [Google Scholar] [CrossRef]
- Santos, J.C.; Coloma, L.A.; Cannatella, D.C. Multiple, recurring origins of aposematism and diet specialization in poison frogs. Proc. Natl. Acad. Sci. USA 2003, 100, 12792–12797. [Google Scholar] [CrossRef] [Green Version]
- Vences, M. Convergent evolution of aposematic coloration in Neotropical poison frogs: A molecular phylogenetic perspective. Org. Divers. Evol. 2003, 3, 215–226. [Google Scholar] [CrossRef]
- Roberts, J.L.; Brown, J.L.; von May, R.; Arizabal, W.; Presar, A.; Symula, R.; Schulte, R.; Summers, K. Phylogenetic relationships among poison frogs of the genus Dendrobates (Dendrobatidae): A molecular perspective from increased taxon sampling. 2006, 16, 377–385. 16.
- Frost, D.R.; Grant, T.; Faivovich, J.; Bain, R.H.; Haas, A.; Haddad, C.F.B.; De Sá, R.O.; Channing, A.; Wilkinson, M.; Donnellan, S.C.; et al. The amphibian tree of life. Bull. Am. Mus. Nat. Hist. 2006, 297, 1–291. [Google Scholar] [CrossRef]
- Maddison, W.P. Gene trees in species trees. Syst. Biol. 1997, 46, 523–536. [Google Scholar] [CrossRef]
- Degnan, J.H.; Rosenberg, N.A. Gene tree discordance, phylogenetic inference and the multispecies coalescent. Trends Ecol. Evol. 2009, 24, 332–340. [Google Scholar] [CrossRef]
- Frost, D.R. Amphibian Species of the World 6.0. Available online: http://research.amnh.org/vz/herpetology/amphibia/ (accessed on 19 July 2019).
- Twomey, E.; Brown, J.L.; Amézquita, A.; Mejía-Vargas, D. A taxonomic revision of the Neotropical poison frog genus Ranitomeya (Amphibia: Dendrobatidae). Zootaxa 2011, 3083, 20–39. [Google Scholar]
- Twomey, E.; Brown, J.L. Spotted poison frogs: Rediscovery of a lost species and a new genus (Anura: Dendrobatidae) from northwestern Peru. Herpetologica 2008, 64, 121–137. [Google Scholar] [CrossRef]
- Myers, C.W. New generic names from some neotropical poison frogs (Dendrobatidae). Papéis Avulsos Zool. Mus. Zool. Univ. São Paulo 1987, 36, 301–306. [Google Scholar]
- Bauer, L. New names in the family Dendrobatidae (Anura, Amphibia). RIPA 1994, fall, 1–6. [Google Scholar]
- Bibron, G. pl. 29bis. Type species: Phyllobates bicolor Bibron, 1840, by monotypy. In Atlas de Zoología de Historia Fisica, Politica y Natural de la Isla de Cuba, Segunda Part. Historia Natural; Arthur Bertrand: Paris, France, 1840; p. 8. [Google Scholar]
- Bauer, L. A new genus and a new specific name in the dart poison frog family (Dendrobatidae, Anura, Amphibia). RIPA 1986, 1986, 1–12. [Google Scholar]
- Cope, E.D. Fourth contribution to the herpetology of tropical America. Proc. Acad. Nat. Sci. Phila. 1866, 123–132. [Google Scholar]
- Grant, T.; Rada, M.; Anganoy-Criollo, M.; Batista, A.; Dias, P.H.; Jeckel, A.M.; Machado, D.J.; Rueda-Almonacid, J.V. Phylogenetic systematics of dart-poison frogs and their relatives revisited (Anura: Dendrobatoidea). South. Am. J. Herpetol. 2017, 12, S1–S90. [Google Scholar] [CrossRef]
- Jiménez de la Espada, M. Fauna neotropicalis species quaedam nondum cognitae. J. Sci. Math. Phys. E Nat. 1870, 3, 57–65. [Google Scholar]
- Brown, J.L.; Twomey, E.; Amézquita, A.; de Souza, M.B.; Caldwell, J.P.; Lötters, S.; von May, R.; Melo-Sampaio, P.R.; Mejía-Vargas, D.; Perez-Peña, P.; et al. A taxonomic revision of the Neotropical poison frog genus Ranitomeya (Amphibia: Dendrobatidae). Zootaxa 2011, 3083, 1–120. [Google Scholar] [CrossRef]
- Santos, J.C.; Coloma, L.A.; Summers, K.; Caldwell, J.P.; Ree, R.; Cannatella, D.C. Amazonian amphibian diversity Is primarily derived from late Miocene Andean lineages. PLoS Biol. 2009, 7, e1000056. [Google Scholar] [CrossRef]
- Pyron, A.R.; Wiens, J.J. A large-scale phylogeny of Amphibia including over 2800 species, and a revised classification of extant frogs, salamanders, and caecilians. Mol. Phylogenet. Evol. 2011, 61, 543–583. [Google Scholar] [CrossRef]
- Faircloth, B.C.; McCormack, J.E.; Crawford, N.G.; Harvey, M.G.; Brumfield, R.T.; Glenn, T.C. Ultraconserved elements anchor thousands of genetic markers spanning multiple evolutionary timescales. Syst. Biol. 2012, 61, 717–726. [Google Scholar] [CrossRef]
- Bejerano, G.; Pheasant, M.; Makunin, I.; Stephen, S.; Kent, W.J.; Mattick, J.S.; Haussler, D. Ultraconserved elements in the human genome. Science 2004, 304, 1321–1325. [Google Scholar] [CrossRef]
- Siepel, A.; Bejerano, G.; Pedersen, J.S.; Hinrichs, A.S.; Hou, M.; Rosenbloom, K.; Clawson, H.; Spieth, J.; Hillier, L.W.; Richards, S.; et al. Evolutionarily conserved elements in vertebrate, insect, worm, and yeast genomes. Genome Res. 2005, 15, 1034–1050. [Google Scholar] [CrossRef] [Green Version]
- Gilbert, P.S.; Chang, J.; Pan, C.; Sobel, E.; Sinsheimer, J.S.; Faircloth, B.; Alfaro, M.E. Genome-wide ultraconserved elements exhibit higher phylogenetic informativeness than traditional gene markers in percomorph fishes. Mol. Phylogenet. Evol. 2015, 92, 140–146. [Google Scholar] [CrossRef] [Green Version]
- Blaimer, B.B.; Lloyd, M.W.; Guillory, W.X.; Brady, S.G. Sequence capture and phylogenetic utility of genomic ultraconserved elements obtained from pinned insect specimens. PLoS ONE 2016, 11, e0161531. [Google Scholar] [CrossRef]
- McCormack, J.E.; Tsai, W.L.E.; Faircloth, B.C. Sequence capture of ultraconserved elements from bird museum specimens. Mol. Ecol. Resour. 2016, 16, 1189–1203. [Google Scholar] [CrossRef]
- Smith, B.T.; Harvey, M.G.; Faircloth, B.C.; Glenn, T.C.; Brumfield, R.T. Target capture and massively parallel sequencing of ultraconserved elements for comparative studies at shallow evolutionary time scales. Syst. Biol. 2014, 63, 83–95. [Google Scholar] [CrossRef]
- Crawford, N.G.; Faircloth, B.C.; McCormack, J.E.; Brumfield, R.T.; Winker, K.; Glenn, T.C. More than 1000 ultraconserved elements provide evidence that turtles are the sister group of archosaurs. Biol. Lett. 2012, 8, 783–786. [Google Scholar] [CrossRef] [Green Version]
- Crawford, N.G.; Parham, J.F.; Sellas, A.B.; Faircloth, B.C.; Glenn, T.C.; Papenfuss, T.J.; Henderson, J.B.; Hansen, M.H.; Simison, W.B. A phylogenomic analysis of turtles. Mol. Phylogenet. Evol. 2015, 83, 250–257. [Google Scholar] [CrossRef]
- Streicher, J.W.; Wiens, J.J. Phylogenomic analyses of more than 4000 nuclear loci resolve the origin of snakes among lizard families. Biol. Lett. 2017, 13, 20170393. [Google Scholar] [CrossRef]
- Streicher, J.W.; Wiens, J.J. Phylogenomic analyses reveal novel relationships among snake families. Mol. Phylogenet. Evol. 2016, 100, 160–169. [Google Scholar] [CrossRef] [Green Version]
- Streicher, J.W.; Miller, E.C.; Guerrero, P.C.; Correa, C.; Ortiz, J.C.; Crawford, A.J.; Pie, M.R.; Wiens, J.J. Evaluating methods for phylogenomic analyses, and a new phylogeny for a major frog clade (Hyloidea) based on 2214 loci. Mol. Phylogenet. Evol. 2018, 119, 128–143. [Google Scholar] [CrossRef]
- McCormack, J.E.; Faircloth, B.C.; Crawford, N.G.; Gowaty, P.A.; Brumfield, R.T.; Glenn, T.C. Ultraconserved elements are novel phylogenomic markers that resolve placental mammal phylogeny when combined with species-tree analysis. Genome Res. 2012, 22, 746–754. [Google Scholar] [CrossRef]
- Derti, A.; Roth, F.P.; Church, G.M.; Wu, C. Mammalian ultraconserved elements are strongly depleted among segmental duplications and copy number variants. Nat. Genet. 2006, 38, 1216–1220. [Google Scholar] [CrossRef]
- Simons, C.; Pheasant, M.; Makunin, I.V.; Mattick, J.S. Transposon-free regions in mammalian genomes. Genome Res. 2006, 16, 164–172. [Google Scholar] [CrossRef]
- Faircloth, B.C. PHYLUCE is a software package for the analysis of conserved genomic loci. Bioinformatics 2016, 32, 786–788. [Google Scholar] [CrossRef]
- Faircloth, B.C. Illumiprocessor: A trimmomatic wrapper for parallel adapter and quality trimming. 2013. [Google Scholar] [CrossRef]
- Bolger, A.M.; Lohse, M.; Usadel, B. Trimmomatic: A flexible trimmer for Illumina sequence data. Bioinformatics 2014, 30, 2114–2120. [Google Scholar] [CrossRef]
- Grabherr, M.G.; Haas, B.J.; Yassour, M.; Levin, J.Z.; Thompson, D.A.; Amit, I.; Adiconis, X.; Fan, L.; Raychowdhury, R.; Zeng, Q.; et al. Full-length transcriptome assembly from RNA-Seq data without a reference genome. Nat. Biotechnol. 2011, 29, 644–652. [Google Scholar] [CrossRef] [Green Version]
- Edgar, R.C. MUSCLE: Multiple sequence alignment with high accuracy and high throughput. Nucleic Acids Res. 2004, 32, 1792–1797. [Google Scholar] [CrossRef]
- Heibl, C. PHYLOCH: R Language Tree Plotting Tools and Interfaces to Diverse Phylogenetic Software Packages. 2008. Available online: http://www.christophheibl.de/Rpackages.html (accessed on 9 June 2019).
- Nguyen, L.-T.; Schmidt, H.A.; von Haeseler, A.; Minh, B.Q. IQ-TREE: A fast and effective stochastic algorithm for estimating maximum-likelihood phylogenies. Mol. Biol. Evol. 2015, 32, 268–274. [Google Scholar] [CrossRef]
- Minh, B.Q.; Nguyen, M.A.T.; von Haeseler, A. Ultrafast approximation for phylogenetic bootstrap. Mol. Biol. Evol. 2013, 30, 1188–1195. [Google Scholar] [CrossRef]
- Zhang, C.; Rabiee, M.; Sayyari, E.; Mirarab, S. ASTRAL-III: Polynomial time species tree reconstruction from partially resolved gene trees. BMC Bioinform. 2018, 19, 153. [Google Scholar] [CrossRef]
- Persons, N.W.; Hosner, P.A.; Meiklejohn, K.A.; Braun, E.L.; Kimball, R.T. Sorting out relationships among the grouse and ptarmigan using intron, mitochondrial, and ultra-conserved element sequences. Mol. Phylogenet. Evol. 2016, 98, 123–132. [Google Scholar] [CrossRef] [Green Version]
- Bouckaert, R.; Heled, J.; Kühnert, D.; Vaughan, T.; Wu, C.-H.; Xie, D.; Suchard, M.A.; Rambaut, A.; Drummond, A.J. BEAST 2: A Software platform for bayesian evolutionary analysis. PLoS Comput. Biol. 2014, 10, e1003537. [Google Scholar] [CrossRef]
- Ješovnik, A.; Sosa-Calvo, J.; Lloyd, M.W.; Branstetter, M.G.; Fernández, F.; Schultz, T.R. Phylogenomic species delimitation and host-symbiont coevolution in the fungus-farming ant genus Sericomyrmex Mayr (Hymenoptera: Formicidae): Ultraconserved elements (UCEs) resolve a recent radiation. Syst. Entomol. 2017, 42, 523–542. [Google Scholar] [CrossRef]
- Drummond, A.J.; Bouckaert, R. Bayesian Evolutionary Analysis with BEAST 2; Cambridge University Press: Cambridge, UK, 2015. [Google Scholar]
- Winker, K.; Glenn, T.C.; Faircloth, B.C. Ultraconserved elements (UCEs) illuminate the population genomics of a recent, high-latitude avian speciation event. PeerJ 2018, 6, e5735. [Google Scholar] [CrossRef] [Green Version]
- Hsiang, A.Y.; Field, D.J.; Webster, T.H.; Behlke, A.D.; Davis, M.B.; Racicot, R.A.; Gauthier, J.A. The origin of snakes: Revealing the ecology, behavior, and evolutionary history of early snakes using genomics, phenomics, and the fossil record. BMC Evol. Biol. 2015, 15, 87. [Google Scholar] [CrossRef]
- Rambaut, A.; Drummond, A.J.; Xie, D.; Baele, G.; Suchard, M.A. Posterior summarization in bayesian phylogenetics using tracer 1.7. Syst. Biol. 2018, 67, 901–904. [Google Scholar] [CrossRef]
- IUCN 2019. The IUCN Red List of Threatened Species. Version 2019-1. Available online: http://www.iucnredlist.org (accessed on 21 March 2019).
- Gu, Z.; Gu, L.; Eils, R.; Schlesner, M.; Brors, B. Circlize Implements and enhances circular visualization in R. Bioinformatics 2014, 30, 2811–2812. [Google Scholar] [CrossRef]
- Swofford, D.L.; Waddell, P.J.; Huelsenbeck, J.P.; Foster, P.G.; Lewis, P.O.; Rogers, J.S. Bias in phylogenetic estimation and its relevance to the choice between parsimony and likelihood methods. Syst. Biol. 2001, 50, 525–539. [Google Scholar] [CrossRef]
- Felsenstein, J. Parsimony in systematics: Biological and statistical issues. Annu. Rev. Ecol. Syst. 1983, 14, 313–333. [Google Scholar] [CrossRef]
- Felsenstein, J. Cases in which parsimony or compatibility methods will be positively misleading. Syst. Biol. 1978, 27, 401–410. [Google Scholar] [CrossRef]
- Dos Reis, M.; Donoghue, P.C.J.; Yang, Z. Bayesian molecular clock dating of species divergences in the genomics era. Nat. Rev. Genet. 2016, 17, 71–80. [Google Scholar] [CrossRef]
- Thorne, J.L.; Kishino, H. Divergence time and evolutionary rate estimation with multilocus data. Syst. Biol. 2002, 51, 689–702. [Google Scholar] [CrossRef]
- Schenk, J.J. Consequences of secondary calibrations on divergence time estimates. PLoS ONE 2016, 11, e0148228. [Google Scholar] [CrossRef]
- Rosauer, D.; Laffan, S.W.; Crisp, M.D.; Donnellan, S.C.; Cook, L.G. Phylogenetic endemism: A new approach for identifying geographical concentrations of evolutionary history. Mol. Ecol. 2009, 18, 4061–4072. [Google Scholar] [CrossRef]
- González-del-Pliego, P.; Freckleton, R.P.; Edwards, D.P.; Koo, M.S.; Scheffers, B.R.; Pyron, R.A.; Jetz, W. Phylogenetic and trait-based prediction of extinction risk for data-deficient amphibians. Curr. Biol. 2019, 29, 1557–1563. [Google Scholar] [CrossRef]
Figure 1.
Time-calibrated genus-level phylogeny of Dendrobatidae produced using BEAST. Node labels indicate divergence times (mya). This figure is reduced to one tip per genus from the species-level chronogram in Figure S3. Art by WXG.
Figure 1.
Time-calibrated genus-level phylogeny of Dendrobatidae produced using BEAST. Node labels indicate divergence times (mya). This figure is reduced to one tip per genus from the species-level chronogram in Figure S3. Art by WXG.

Figure 2.
An evolutionary perspective of the Red List status of Aromobatidae and Dendrobatidae. Each species is characterized by a ribbon that is connected to its current Red List status (bottom). The numerical values below each genus depict the number of species with the associated Red List status. Bars on the outer ring depict the current population status of the corresponding genus, either: decreasing, stable or unknown (black, dark grey, or light grey respectively). A tree representing the evolutionary relationships of the genera surrounds the main diagram. Relationships for taxa not included in our study (Dendrobatidae: Paruwrobates, Ectopoglossus, Leucostethus; Aromobatidae: Aromobates, Anomaloglossus, Mannophryne, Rheobates) are reproduced from Grant et al. 2017 [41].

Figure 3.
A geographic perspective of the Red List status of Aromobatidae and Dendrobatidae. The species composition of each country is characterized by ribbons connected to the current Red List status for each species (bottom). The numerical values below each country name depict the number of species with the associated Red List status. Bars on the outer ring depict the corresponding color of that country on the main map (top right). Maps to the left display Red List groups, where the intensity of color depicts larger number of species. If a species exists in more than one country, it was represented in each country of occurrence in the plot.


Table 1.
Dendrobatid genera and relevant information. The authority and type species for each genus is given, as well as the number of described species and a very basic description of each genus’ geographic range. Species counts and authorities retrieved from Amphibian Species of the World [33].
Table 1.
Dendrobatid genera and relevant information. The authority and type species for each genus is given, as well as the number of described species and a very basic description of each genus’ geographic range. Species counts and authorities retrieved from Amphibian Species of the World [33].
| Subfamily | Genus | Authority | Type Species | No. Species | Range |
|---|---|---|---|---|---|
| Dendrobatinae | Adelphobates | Grant et al. 2006 [21] | castaneoticus | 3 | Amazonia |
| Andinobates | Twomey et al. 2011 [34] | bombetes | 15 | N Amazonia | |
| Dendrobates | Wagler 1830 [20] | tinctorius | 5 | C America, N Amazonia, Hawaii (introduced) | |
| Excidobates | Twomey and Brown 2008 [35] | mysteriosus | 3 | NW Peru | |
| Minyobates | Myers 1987 [36] | steyermarki | 1 | Venezuela | |
| Oophaga | Bauer 1994 [37] | pumilio | 12 | C America, W Andean versant | |
| Phyllobates | Bibron 1840 [38] | bicolor | 5 | C America, Colombia | |
| Ranitomeya | Bauer 1986 [39] | reticulata | 16 | Amazonia | |
| Colostethinae | Ameerega | Bauer 1986 [39] | trivittata | 30 | Amazonia, Bolivia |
| Colostethus | Cope 1866 [40] | latinasus | 15 | Panama, NW S America | |
| Epipedobates | Myers 1987 [36] | tricolor | 8 | W Andean versant | |
| Leucostethus | Grant et al. 2017 [41] | argyrogaster | 6 | W Amazonia | |
| Silverstoneia | Grant et al. 2006 [21] | nubicola | 8 | C America, Colombia | |
| Hyloxalinae | Ectopoglossus | Grant et al. 2017 [41] | saxatilis | 7 | C America, W Andean versant |
| Hyloxalus | Jiménez de la Espada 1870 [42] | fuliginosus | 60 | Panama, W Andean versant, NW Amazonia | |
| Paruwrobates | Bauer 1994 [37] | andinus | 3 | W Andean versant |
© 2019 by the authors. Licensee MDPI, Basel, Switzerland. This article is an open access article distributed under the terms and conditions of the Creative Commons Attribution (CC BY) license (http://creativecommons.org/licenses/by/4.0/).
Share and Cite
MDPI and ACS Style
Guillory, W.X.; Muell, M.R.; Summers, K.; Brown, J.L. Phylogenomic Reconstruction of the Neotropical Poison Frogs (Dendrobatidae) and Their Conservation. Diversity 2019, 11, 126. https://0-doi-org.brum.beds.ac.uk/10.3390/d11080126
AMA Style
Guillory WX, Muell MR, Summers K, Brown JL. Phylogenomic Reconstruction of the Neotropical Poison Frogs (Dendrobatidae) and Their Conservation. Diversity. 2019; 11(8):126. https://0-doi-org.brum.beds.ac.uk/10.3390/d11080126
Chicago/Turabian StyleGuillory, Wilson X., Morgan R. Muell, Kyle Summers, and Jason L. Brown. 2019. "Phylogenomic Reconstruction of the Neotropical Poison Frogs (Dendrobatidae) and Their Conservation" Diversity 11, no. 8: 126. https://0-doi-org.brum.beds.ac.uk/10.3390/d11080126
Note that from the first issue of 2016, this journal uses article numbers instead of page numbers. See further details here.