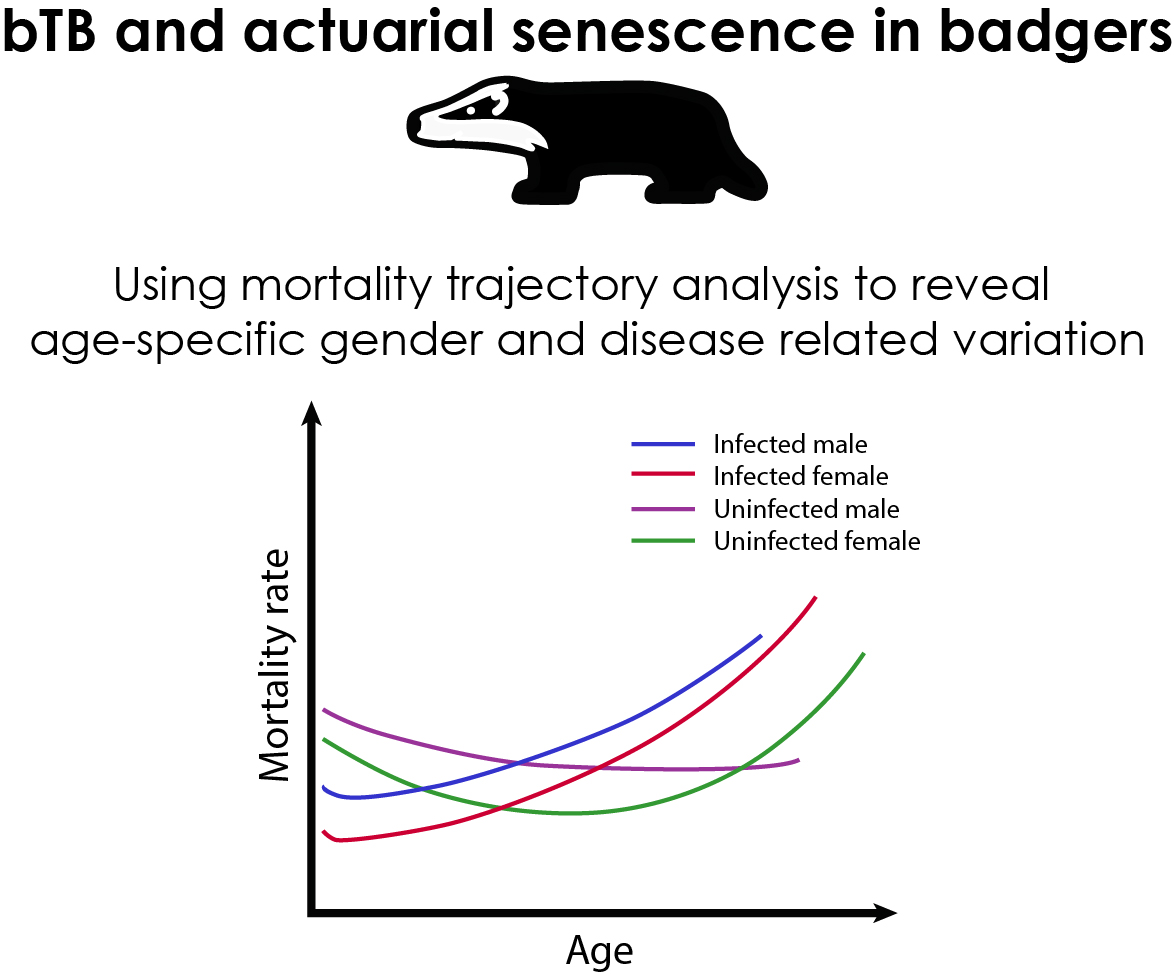
Analysis of Lifetime Mortality Trajectories in Wildlife Disease Research: BaSTA and Beyond

 , ,
, ,
Abstract
:
1. Introduction
2. Materials and Methods
2.1. Ecological Data
2.2. Diagnostic Tests
2.3. Analysis
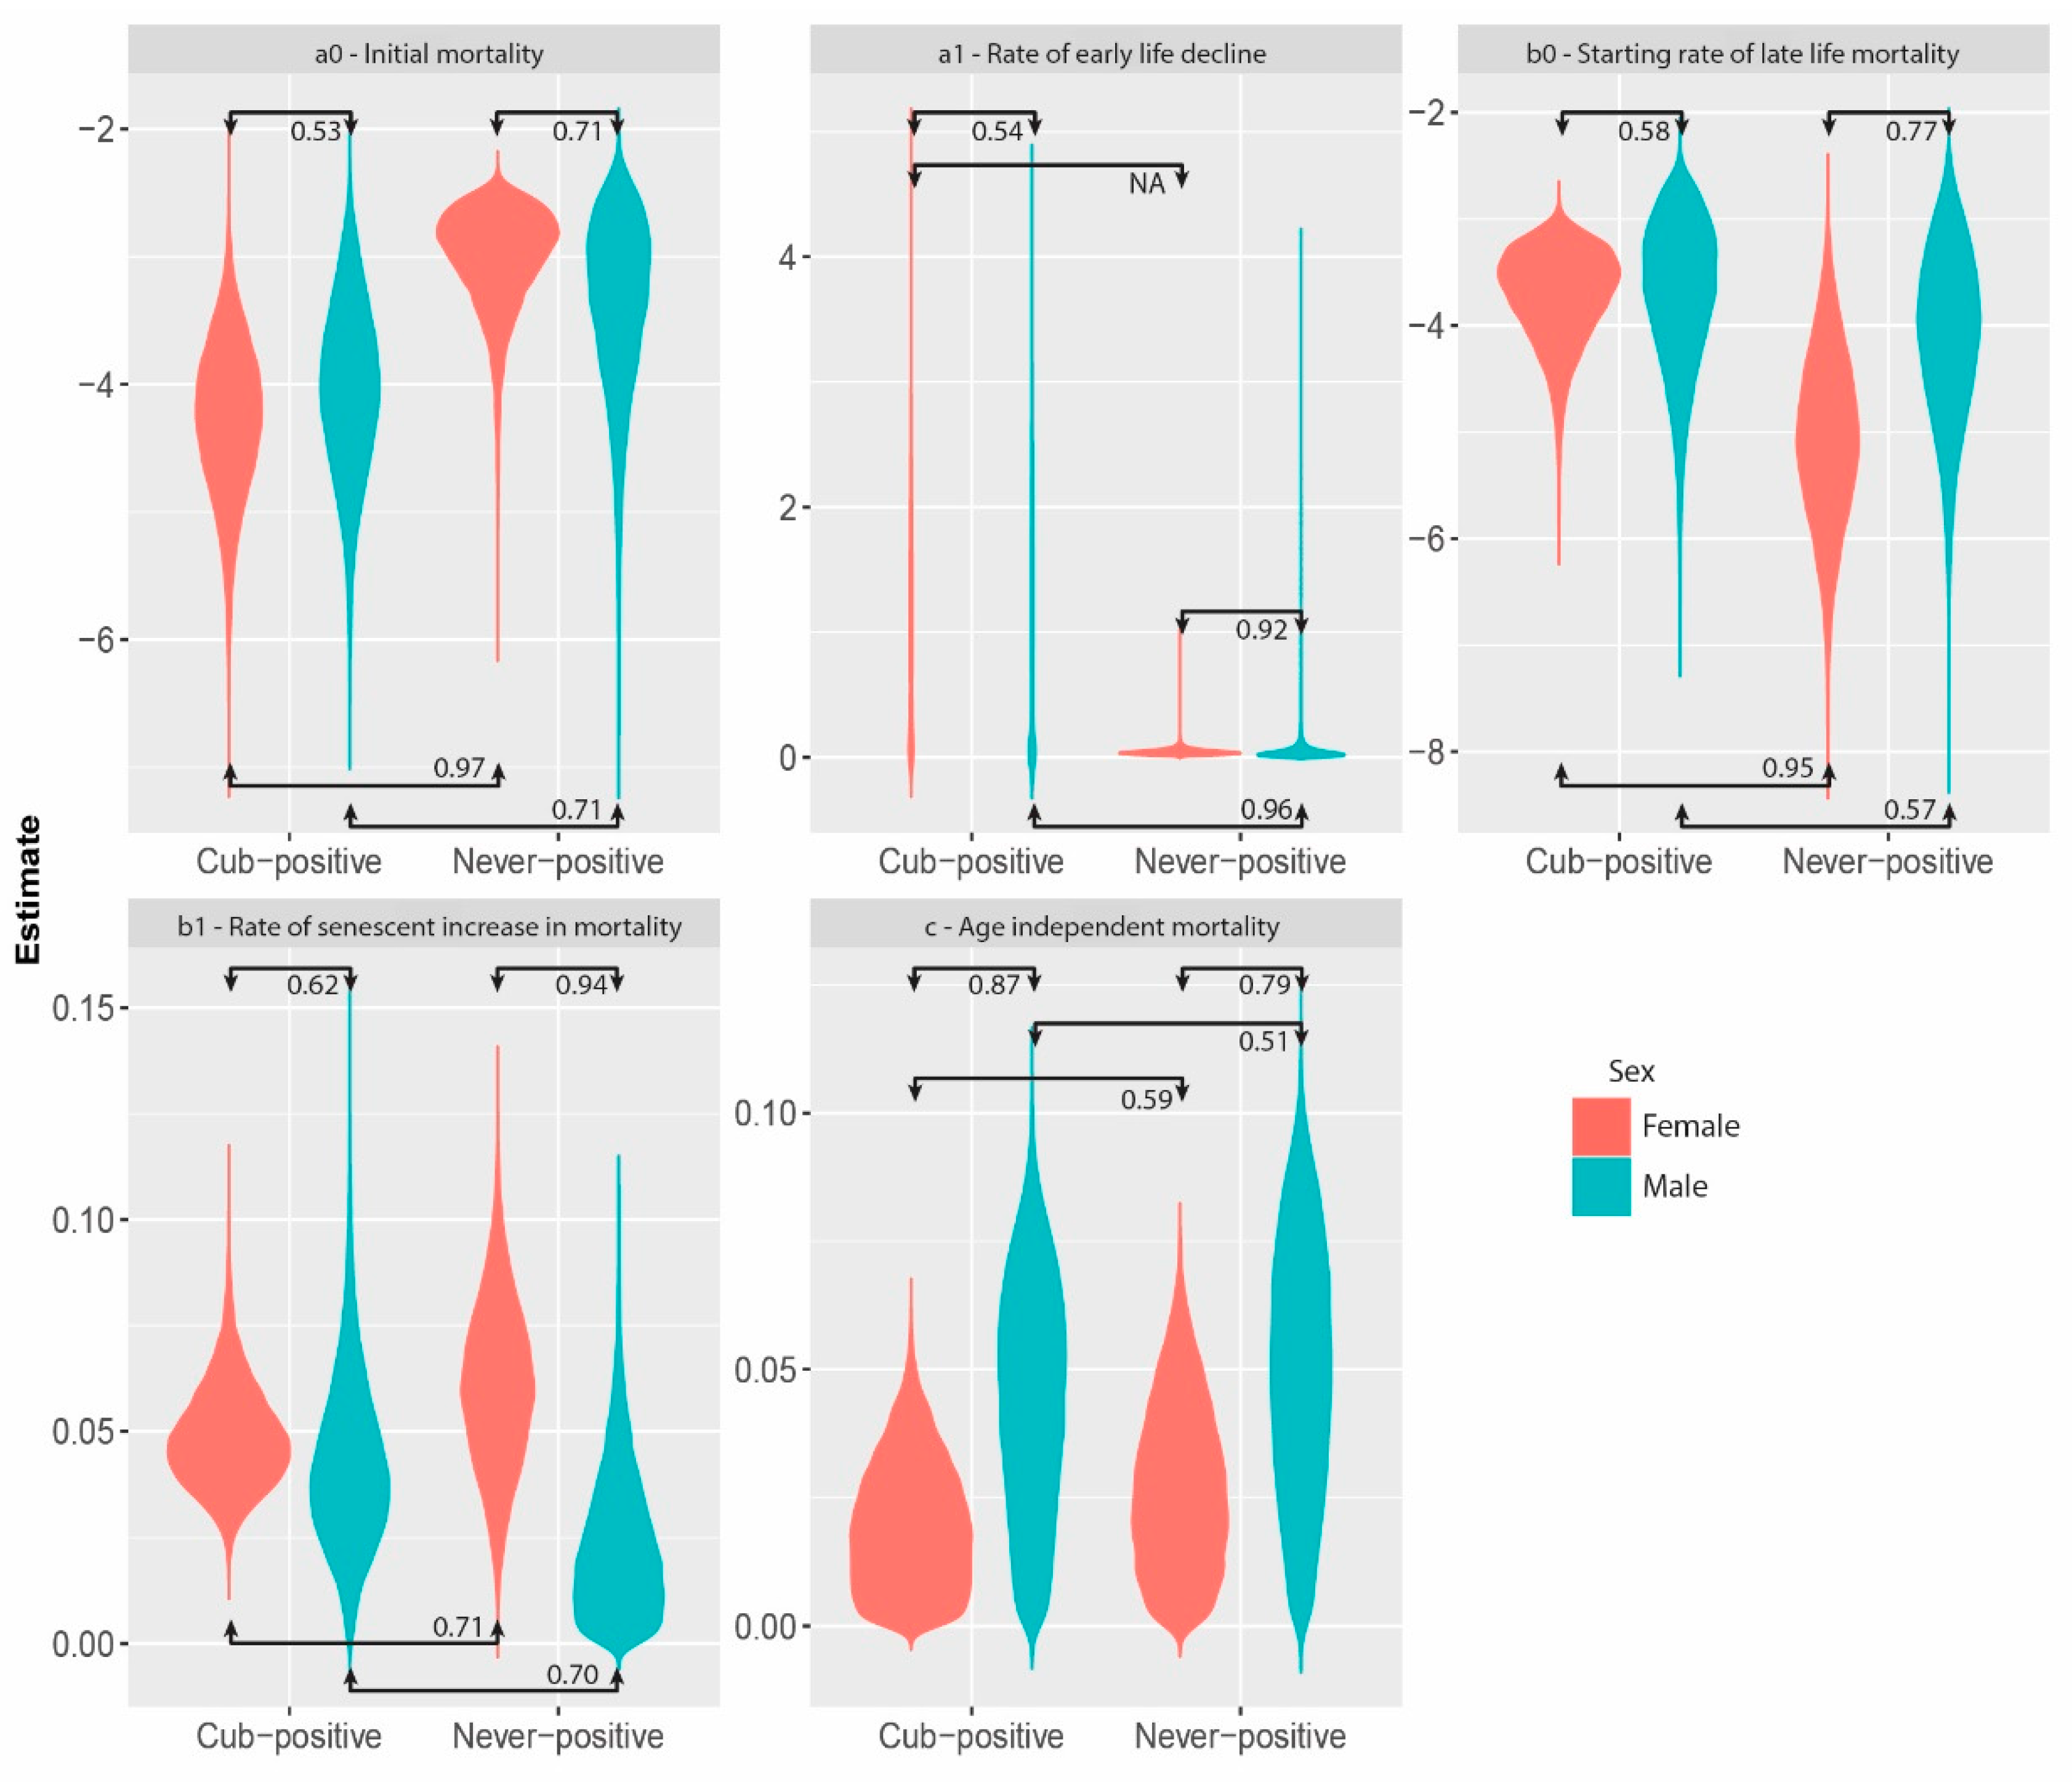
3. Results
4. Discussion
Supplementary Materials
Author Contributions
Funding
Acknowledgments
Ethics Statement
Conflicts of Interest
References
- Delahay, R.J.; Smith, G.C.; Hutchings, M.R. The science of wildlife disease management. In Management of Disease in Wild Mammals; Springer: Tokyo, Japan, 2009; pp. 1–8. [Google Scholar]
- Gortázar, C.; Ferroglio, E.; Höfle, U.; Frölich, K.; Vicente, J. Diseases shared between wildlife and livestock: A European perspective. Eur. J. Wildl. Res. 2007, 53, 241–256. [Google Scholar] [CrossRef]
- Wiethoelter, A.K.; Beltrán-Alcrudo, D.; Kock, R.; Mor, S.M. Global trends in infectious diseases at the wildlife-livestock interface. Proc. Natl. Acad. Sci. USA 2015, 112, 9662–9667. [Google Scholar] [CrossRef] [PubMed]
- Heisey, D.M.; Joly, D.O.; Messier, F. The fitting of general force-of-infection models to wildlife disease prevalence data. Ecology 2006, 87, 2356–2365. [Google Scholar] [CrossRef]
- Samuel, M.D.; Woodworth, B.L.; Atkinson, C.T.; Hart, P.J.; Lapointe, D.A. Avian malaria in Hawaiian forest birds: Infection and population impacts across species and elevations. Ecosphere 2015, 6, 1–21. [Google Scholar] [CrossRef]
- Kilpatrick, A.M.; Briggs, C.J.; Daszak, P. The ecology and impact of chytridiomycosis: An emerging disease of amphibians. Trends Ecol. Evol. 2010, 25, 109–118. [Google Scholar] [CrossRef] [PubMed]
- Frick, W.F.; Pollock, J.F.; Hicks, A.C.; Langwig, K.E.; Reynolds, D.S.; Turner, G.G.; Butchkoski, C.M.; Kunz, T.H. An emerging disease causes regional population collapse of a common North American bat species. Science 2010, 329, 679–682. [Google Scholar] [CrossRef]
- van Riper, C.; van Riper, S.G.; Goff, M.L.; Laird, M. The epizootiology and ecological significance of malaria in Hawaiian land birds. Ecol. Monogr. 1986, 56, 327–344. [Google Scholar] [CrossRef]
- Berger, L.; Roberts, A.A.; Voyles, J.; Longcore, J.E.; Murray, K.A.; Skerratt, L.F. History and recent progress on chytridiomycosis in amphibians. Fungal Ecol. 2016, 19, 89–99. [Google Scholar] [CrossRef]
- Samuel, M.D.; Storm, D.J. Chronic wasting disease in white-tailed deer: Infection, mortality, and implications for heterogeneous transmission. Ecology 2016, 97, 3195–3205. [Google Scholar] [CrossRef]
- Wilkinson, D.; Smith, G.C.; Delahay, R.J.; Rogers, L.M.; Cheeseman, C.L.; Clifton-Hadley, R.S. The effects of bovine tuberculosis (Mycobacterium bovis) on mortality in a badger (Meles meles) population in England. J. Zool. 2000, 250, 389–395. [Google Scholar] [CrossRef]
- Fontana, L.; Kennedy, B.K.; Longo, V.D.; Seals, D.; Melov, S. Medical research: Treat ageing. Nature 2014, 511, 405–407. [Google Scholar] [CrossRef] [PubMed]
- Hayflick, L. The future of ageing. Nature 2000, 408, 267–269. [Google Scholar] [CrossRef] [PubMed]
- Haas, G.P.; Delongchamps, N.; Brawley, O.W.; Wang, C.Y.; de la Roza, G. The worldwide epidemiology of prostate cancer: Perspectives from autopsy studies. Can. J. Urol. 2008, 15, 3866–3871. [Google Scholar] [PubMed]
- Jorgenson, J.T.; Festa-Bianchet, M.; Gaillard, J.-M.; Wishart, W.D. Effects of age, sex, disease, and density on survival of bighorn sheep. Ecology 1997, 78, 1019–1032. [Google Scholar] [CrossRef]
- Larsen, D.G.; Gauthier, D.A.; Markel, R.L. Causes and rate of moose mortality in the Southwest Yukon. J. Wildl. Manag. 1989, 53, 548–557. [Google Scholar] [CrossRef]
- Koons, D.N.; Gamelon, M.; Gaillard, J.-M.; Aubry, L.M.; Rockwell, R.F.; Klein, F.; Choquet, R.; Gimenez, O. Methods for studying cause-specific senescence in the wild. Methods Ecol. Evol. 2014, 5, 924–933. [Google Scholar] [CrossRef] [Green Version]
- Reid, J.M.; Bignal, E.M.; Bignal, S.; McCracken, D.I.; Monaghan, P. Age-specific reproductive performance in red-billed choughs Pyrrhocorax pyrrhocorax: Patterns and processes in a natural population. J. Anim. Ecol. 2003, 72, 765–776. [Google Scholar] [CrossRef]
- Reimers, E.; Holmengen, N.; Mysterud, A. Life-history variation of wild reindeer (Rangifer tarandus) in the highly productive North Ottadalen region, Norway. J. Zool. 2005, 265, 53–62. [Google Scholar] [CrossRef]
- Chen, G.H.; Wang, Y.J.; Wang, X.M.; Zhou, J.N.; Liu, R.Y. Effect of aging on species-typical behaviors in senescence-accelerated mouse. Physiol. Behav. 2005, 85, 536–545. [Google Scholar] [CrossRef]
- Angelier, F.; Weimerskirch, H.; Dano, S.; Chastel, O. Age, experience and reproductive performance in a long-lived bird: A hormonal perspective. Behav. Ecol. Sociobiol. 2007, 61, 611–621. [Google Scholar] [CrossRef]
- Ricklefs, R.E. Evolutionary theories of aging: Confirmation of a fundamental prediction, with implications for the genetic basis and evolution of life span. Am. Nat. 1998, 152, 24–44. [Google Scholar] [CrossRef] [PubMed]
- Nussey, D.H.; Froy, H.; Lemaitre, J.-F.; Gaillard, J.-M.; Austad, S.N. Senescence in natural populations of animals: Widespread evidence and its implications for bio-gerontology. Ageing Res. Rev. 2013, 12, 214–225. [Google Scholar] [CrossRef] [PubMed]
- Graham, J.; Smith, G.C.; Delahay, R.J.; Bailey, T.; McDonald, R.A.; Hodgson, D. Multi-state modelling reveals sex-dependent transmission, progression and severity of tuberculosis in wild badgers. Epidemiol. Infect. 2013, 141, 1429–1436. [Google Scholar] [CrossRef] [PubMed]
- Nussey, D.H.; Coulson, T.; Festa-Bianchet, M.; Gaillard, J.-M. Measuring senescence in wild animal populations: Towards a longitudinal approach. Funct. Ecol. 2008, 22, 393–406. [Google Scholar] [CrossRef]
- Ricklefs, R.E.; Scheuerlein, A. Biological implications of the Weibull and Gompertz models of aging. J. Gerontol. Ser. A Biol. Sci. Med. Sci. 2002, 57, B69–B76. [Google Scholar] [CrossRef] [PubMed]
- Wilson, D.L. The analysis of survival (mortality) data: Fitting Gompertz, Weibull, and logistic functions. Mech. Ageing Dev. 1994, 74, 15–33. [Google Scholar] [CrossRef]
- Gompertz, B. On the nature of the function expressive of the law of human mortality, and on a new. Philos. Trans. R. Soc. Lond. 1825, 115, 513–583. [Google Scholar]
- Pinder, J.E.; Wiener, J.G.; Smith, M.H. The Weibull distribution: A new method of summarizing survivorship data. Ecology 1978, 59, 175–179. [Google Scholar] [CrossRef]
- Colchero, F.; Clark, J.S. Bayesian inference on age-specific survival for censored and truncated data. J. Anim. Ecol. 2012, 81, 139–149. [Google Scholar] [CrossRef] [PubMed]
- Makeham, W.M. On the law of mortality. J. Inst. Actuar. 1867, 13, 325–358. [Google Scholar] [CrossRef]
- Cam, E.; Aubry, L.M.; Authier, M. The conundrum of heterogeneities in life history studies. Trends Ecol. Evol. 2016, 31, 872–886. [Google Scholar] [CrossRef] [PubMed]
- Vaupel, J.W.; Manton, K.G.; Stallard, E. The impact of heterogeneity in individual frailty on the dynamics of mortality. Demography 1979, 16, 439–454. [Google Scholar] [CrossRef] [PubMed]
- Pletcher, S.D. Pletcher model fitting and hypothesis testing for age-specific mortality data. J. Evol. Biol. 1999, 12, 430–439. [Google Scholar] [CrossRef]
- Jones, O.R.; Scheuerlein, A.; Salguero-Gómez, R.; Camarda, C.G.; Schaible, R.; Casper, B.B.; Dahlgren, J.P.; Ehrlén, J.; García, M.B.; Menges, E.S.; et al. Diversity of ageing across the tree of life. Nature 2014, 505, 169–173. [Google Scholar] [CrossRef] [PubMed]
- Vaupel, J.W.; Carey, J.R.; Christensen, K.; Johnson, T.E.; Yashin, A.I.; Holm, N.V.; Iachine, I.A.; Kannisto, V.; Khazaeli, A.A.; Liedo, P.; et al. Biodemographic trajectories of longevity. Science 1998, 280, 855–860. [Google Scholar] [CrossRef] [PubMed]
- Ricklefs, R.E.; Scheuerlein, A. Comparison of aging-related mortality among birds and mammals. Exp. Gerontol. 2001, 36, 845–857. [Google Scholar] [CrossRef]
- Barthold, J.A.; Loveridge, A.J.; Macdonald, D.W.; Packer, C.; Colchero, F. Bayesian estimates of male and female African lion mortality for future use in population management. J. Appl. Ecol. 2016, 53, 295–304. [Google Scholar] [CrossRef] [Green Version]
- Caughley, G. Mortality patterns in mammals. Ecology 1966, 47, 906–918. [Google Scholar] [CrossRef]
- Siler, W. A competing-risk model for animal mortality. Ecology 1979, 60, 750–757. [Google Scholar] [CrossRef]
- Klutke, G.A.; Kiessler, P.C.; Wortman, M.A. A critical look at the bathtub curve. IEEE Trans. Reliab. 2003, 52, 125–129. [Google Scholar] [CrossRef]
- Bebbington, M.; Lai, C.-D.; Zitikis, R. Modeling human mortality using mixtures of bathtub shaped failure distributions. J. Theor. Biol. 2007, 245, 528–538. [Google Scholar] [CrossRef] [PubMed]
- Snoke, M.S.; Promislow, D.E.L. Quantitative genetic tests of recent senescence theory: Age-specific mortality and male fertility in Drosophila melanogaster. Heredity 2003, 91, 546–556. [Google Scholar] [CrossRef]
- McDonald, J.L.; Smith, G.C.; McDonald, R.A.; Delahay, R.J.; Hodgson, D. Mortality trajectory analysis reveals the drivers of sex-specific epidemiology in natural wildlife-disease interactions. Proc. R. Soc. B Biol. Sci. 2014, 281, 20140526. [Google Scholar] [CrossRef]
- Delahay, R.J.; Walker, N.; Smith, G.S.; Wilkinson, D.; Clifton-Hadley, R.S.; Cheeseman, C.L.; Tomlinson, A.J.; Chambers, M.A. Long-term temporal trends and estimated transmission rates for Mycobacterium bovis infection in an undisturbed high-density badger (Meles meles) population. Epidemiol. Infect. 2013, 141, 1445–1456. [Google Scholar] [CrossRef] [PubMed]
- Donnelly, C.A.; Woodroffe, R.; Cox, D.R.; Bourne, F.J.; Cheeseman, C.L.; Clifton-Hadley, R.S.; Wei, G.; Gettinby, G.; Gilks, P.; Jenkins, H.; et al. Positive and negative effects of widespread badger culling on tuberculosis in cattle. Nature 2006, 439, 843–846. [Google Scholar] [CrossRef]
- Gallagher, J.; Clifton-Hadley, R.S. Tuberculosis in badgers; a review of the disease and its significance for other animals. Res. Vet. Sci. 2000, 69, 203–217. [Google Scholar] [CrossRef] [PubMed] [Green Version]
- Colchero, F.; Jones, O.R.; Rebke, M. BaSTA: An R package for Bayesian estimation of age-specific survival from incomplete mark-recapture/recovery data with covariates. Methods Ecol. Evol. 2012, 3, 466–470. [Google Scholar] [CrossRef]
- Colchero, F.; Aliaga, A.E.; Jones, O.R.; Conde, D.A. Individual heterogeneity determines sex differences in mortality in a monogamous bird with reversed sexual dimorphism. J. Anim. Ecol. 2017, 86, 899–970. [Google Scholar] [CrossRef] [PubMed]
- Tidière, M.; Gaillard, J.-M.; Müller, D.W.H.; Lackey, L.B.; Gimenez, O.; Clauss, M.; Lemaître, J.-F. Does sexual selection shape sex differences in longevity and senescence patterns across vertebrates? A review and new insights from captive ruminants. Evolution 2015, 69, 3123–3140. [Google Scholar] [CrossRef]
- Lemaître, J.-F.; Gaillard, J.-M.; Lackey, L.B.; Clauss, M.; Müller, D.W.H. Comparing free-ranging and captive populations reveals intra-specific variation in aging rates in large herbivores. Exp. Gerontol. 2013, 48, 162–167. [Google Scholar] [CrossRef] [PubMed] [Green Version]
- Klein, S.L. The effects of hormones on sex differences in infection: From genes to behavior. Neurosci. Biobehav. Rev. 2000, 24, 627–638. [Google Scholar] [CrossRef]
- Møller, A.P. Advantages and disadvantages of coloniality in the swallow, Hirundo rustica. Anim. Behav. 1987, 35, 819–832. [Google Scholar] [CrossRef]
- Zuk, M.; McKean, K.A. Sex differences in parasite infections: Patterns and processes. Int. J. Parasitol. 1996, 26, 1009–1024. [Google Scholar] [CrossRef]
- Berger, V.; Lemaître, J.-F.; Dupont, P.; Allainé, D.; Gaillard, J.-M.; Cohas, A. Age-specific survival in the socially monogamous alpine marmot (Marmota marmota): Evidence of senescence. J. Mammal. 2016, 97, 992–1000. [Google Scholar] [CrossRef]
- Baudisch, A. The pace and shape of ageing. Methods Ecol. Evol. 2011, 2, 375–382. [Google Scholar] [CrossRef]
- McDonald, J.L.; Hodgson, D.J. Prior precision, prior accuracy, and the estimation of disease prevalence using imperfect diagnostic tests. Front. Vet. Sci. 2018, 5, 83. [Google Scholar] [CrossRef]
- McDonald, J.L.; Robertson, A.; Silk, M.J. Wildlife disease ecology from the individual to the population: Insights from a long-term study of a naturally infected European badger population. J. Anim. Ecol. 2018, 87, 101–112. [Google Scholar] [CrossRef] [PubMed]
- Delahay, R.J.; Langton, S.; Smith, G.C.; Clifton-Hadley, R.S.; Cheeseman, C.L. The spatio-temporal distribution of Mycobacterium bovis (bovine tuberculosis) infection in a high-density badger population. J. Anim. Ecol. 2000, 69, 428–441. [Google Scholar] [CrossRef]
- Gallagher, J.; Horwill, D.M. A selective oleic acid albumin agar medium for the cultivation of Mycobacterium bovis. Epidemiol. Infect. 1977, 79, 155–160. [Google Scholar] [CrossRef]
- Goodger, J.; Nolan, A.; Russell, W.P.; Dalley, D.J.; Thorns, C.J.; Stuart, F.A.; Croston, P.; Newell, D.G. Serodiagnosis of Mycobacterium bovis infection in badgers: Development of an indirect ELISA using a 25 kDa antigen. Vet. Rec. 1994, 135, 82–85. [Google Scholar] [CrossRef]
- Chambers, M.A.; Crawshaw, T.; Waterhouse, S.; Delahay, R.; Hewinson, R.G.; Lyashchenko, K.P. Validation of the BrockTB stat-pak assay for detection of tuberculosis in Eurasian badgers (Meles meles) and influence of disease severity on diagnostic accuracy. J. Clin. Microbiol. 2008, 46, 1498–1500. [Google Scholar] [CrossRef] [PubMed]
- Clifton-Hadley, R.S.; Sayers, A.R.; Stock, M.P. Evaluation of an ELISA for Mycobacterium bovis infection in badgers (Meles meles). Vet. Rec. 1995, 137, 555–558. [Google Scholar] [CrossRef] [PubMed]
- Drewe, J.A.; Tomlinson, A.J.; Walker, N.J.; Delahay, R.J. Diagnostic accuracy and optimal use of three tests for tuberculosis in live badgers. PLoS ONE 2010, 5, e11196. [Google Scholar] [CrossRef] [PubMed]
- Buzdugan, S.N.; Chambers, M.A.; Delahay, R.J.; Drewe, J.A. Diagnosis of tuberculosis in groups of badgers: An exploration of the impact of trapping efficiency, infection prevalence and the use of multiple tests. Epidemiol. Infect. 2016, 144, 1717–1727. [Google Scholar] [CrossRef]
- Wawegama, N.K.; Markham, P.F.; Kanci, A.; Schibrowski, M.; Oswin, S.; Barnes, T.S.; Firestone, S.M.; Mahony, T.J.; Browning, G.F. Evaluation of an IgG enzyme-linked immunosorbent assay as a serological assay for detection of mycoplasma bovis infection in feedlot cattle. J. Clin. Microbiol. 2016, 54, 1269–1275. [Google Scholar] [CrossRef]
- Rogers, L.M.; Cheeseman, C.L.; Mallinson, P.J.; Clifton-Hadley, R. The demography of a high-density badger (Meles meles) population in the west of England. J. Zool. 1997, 242, 705–728. [Google Scholar] [CrossRef]
- R Development Core Team. R: A language and environment for statistical computing. R Found. R Found. Stat. Comput. 2011. Available online: https://www.r-project.org/ (accessed on 12 February 2019).
- Kalbfleisch, J.D.; Prentice, R.L. The Statistical Analysis of Failure Time Data; John Wiley & Sons, Inc.: Hoboken, NJ, USA, 2002; ISBN 9781118032985. [Google Scholar]
- Gelman, A.; Carlin, J.B.B.; Stern, H.S.S.; Dunson, D.B.; Vehtari, A.; Rubin, D.B.B. Bayesian Data Analysis, 3rd ed.; Texts in Statistical Science; CRC Press: Boca Raton, FL, USA, 2014; ISBN 9781439840955. [Google Scholar]
- Kass, R.E.; Raftery, A.E. Bayes factors. J. Am. Stat. Assoc. 1995, 90, 773–795. [Google Scholar] [CrossRef]
- Spiegelhalter, D.J.; Best, N.G.; Carlin, B.P.; van der Linde, A. Bayesian measures of model complexity and fit. J. R. Stat. Soc. Ser. B 2002, 64, 583–639. [Google Scholar] [CrossRef] [Green Version]
- Spiegelhalter, D.J.; Best, N.G.; Carlin, B.P.; van der Linde, A. The deviance information criterion: 12 years on. J. R. Stat. Soc. Ser. B 2014, 76, 485–493. [Google Scholar] [CrossRef]
- Kullback, S.; Leibler, R.A. On information and sufficiency. Ann. Math. 1951, 22, 79–86. [Google Scholar] [CrossRef]
- McCulloch, R.E. Local model influence. J. Am. Stat. Assoc. 1989, 84, 473–478. [Google Scholar] [CrossRef]
- Larson, S.M.; Colchero, F.; Jones, O.R.; Williams, L.; Fernandez-Duque, E. Age and sex-specific mortality of wild and captive populations of a monogamous pair-bonded primate (Aotus azarae). Am. J. Primatol. 2016, 78, 315–325. [Google Scholar] [CrossRef] [PubMed]
- Bronikowski, A.M.; Altmann, J.; Brockman, D.K.; Cords, M.; Fedigan, L.M.; Pusey, A.; Stoinski, T.; Morris, W.F.; Strier, K.B.; Alberts, S.C. Aging in the natural world: Comparative data reveal similar mortality patterns across primates. Science 2011, 311, 1325–1328. [Google Scholar] [CrossRef] [PubMed]
- Beirne, C.; Delahay, R.; Young, A. Sex differences in senescence: The role of intra-sexual competition in early adulthood. Proc. R. Soc. B Biol. Sci. 2015, 282, 20151086. [Google Scholar] [CrossRef] [PubMed]
- Byrnes, J.P.; Miller, D.C.; Schafer, W.D. Gender differences in risk taking: A meta-analysis. Psychol. Bull. 1999, 125, 367. [Google Scholar] [CrossRef]
- Delahay, R.J.; Walker, N.J.; Forrester, G.J.; Harmsen, B.; Riordan, P.; Macdonald, D.W.; Newman, C.; Cheeseman, C.L. Demographic correlates of bite wounding in Eurasian badgers, Meles meles L., in stable and perturbed populations. Anim. Behav. 2006, 71, 1047–1055. [Google Scholar] [CrossRef]
- Greiner, S.; Nagy, M.; Mayer, F.; Knörnschild, M.; Hofer, H.; Voigt, C.C. Sex-biased senescence in a polygynous bat species. Ethology 2014, 120, 197–205. [Google Scholar] [CrossRef]
- Descamps, S.; Boutin, S.; Berteaux, D.; Gaillard, J.M. Age-specific variation in survival, reproductive success and offspring quality in red squirrels: Evidence of senescence. Oikos 2008, 117, 1406–1416. [Google Scholar] [CrossRef]
- Lemaitre, J.F.; Gaillard, J.M. Male survival patterns do not depend on male allocation to sexual competition in large herbivores. Behav. Ecol. 2012, 24, 421–428. [Google Scholar] [CrossRef] [Green Version]
- Noonburg, E.G.; Chen, A.; Shima, J.S.; Swearer, S.E. Demographic heterogeneity and the dynamics of open populations. Ecology 2015, 96, 1159–1165. [Google Scholar] [CrossRef] [PubMed]
- Dahlgren, J.P.; Colchero, F.; Jones, O.R.; Øien, D.-I.; Moen, A.; Sletvold, N. Actuarial senescence in a long-lived orchid challenges our current understanding of ageing. Proc. R. Soc. B Biol. Sci. 2016, 283, 20161217. [Google Scholar] [CrossRef] [PubMed]
- Kynaston, S.; Neal, E.; Cheeseman, C. Badgers. J. Anim. Ecol. 2006, 65, 533. [Google Scholar] [CrossRef]
- Dalley, D.; Davé, D.; Lesellier, S.; Palmer, S.; Crawshaw, T.; Hewinson, R.G.; Chambers, M. Development and evaluation of a gamma-interferon assay for tuberculosis in badgers (Meles meles). Tuberculosis 2008, 88, 235–243. [Google Scholar] [CrossRef]
- Conn, P.B.; Cooch, E.G. Multistate capture-recapture analysis under imperfect state observation: An application to disease models. J. Appl. Ecol. 2009, 46, 486–492. [Google Scholar] [CrossRef]
- Pradel, R.; Hines, J.E.; Lebreton, J.-D.; Nichols, J.D. Capture-recapture survival models taking account of transients. Biometrics 1997, 53, 60–72. [Google Scholar] [CrossRef]
- Choquet, R.; Rouan, L.; Pradel, R. Program E-surge: A software application for fitting multievent models. In Modeling Demographic Processes in Marked Populations; Springer: Boston, MA, USA, 2009; pp. 845–865. [Google Scholar]


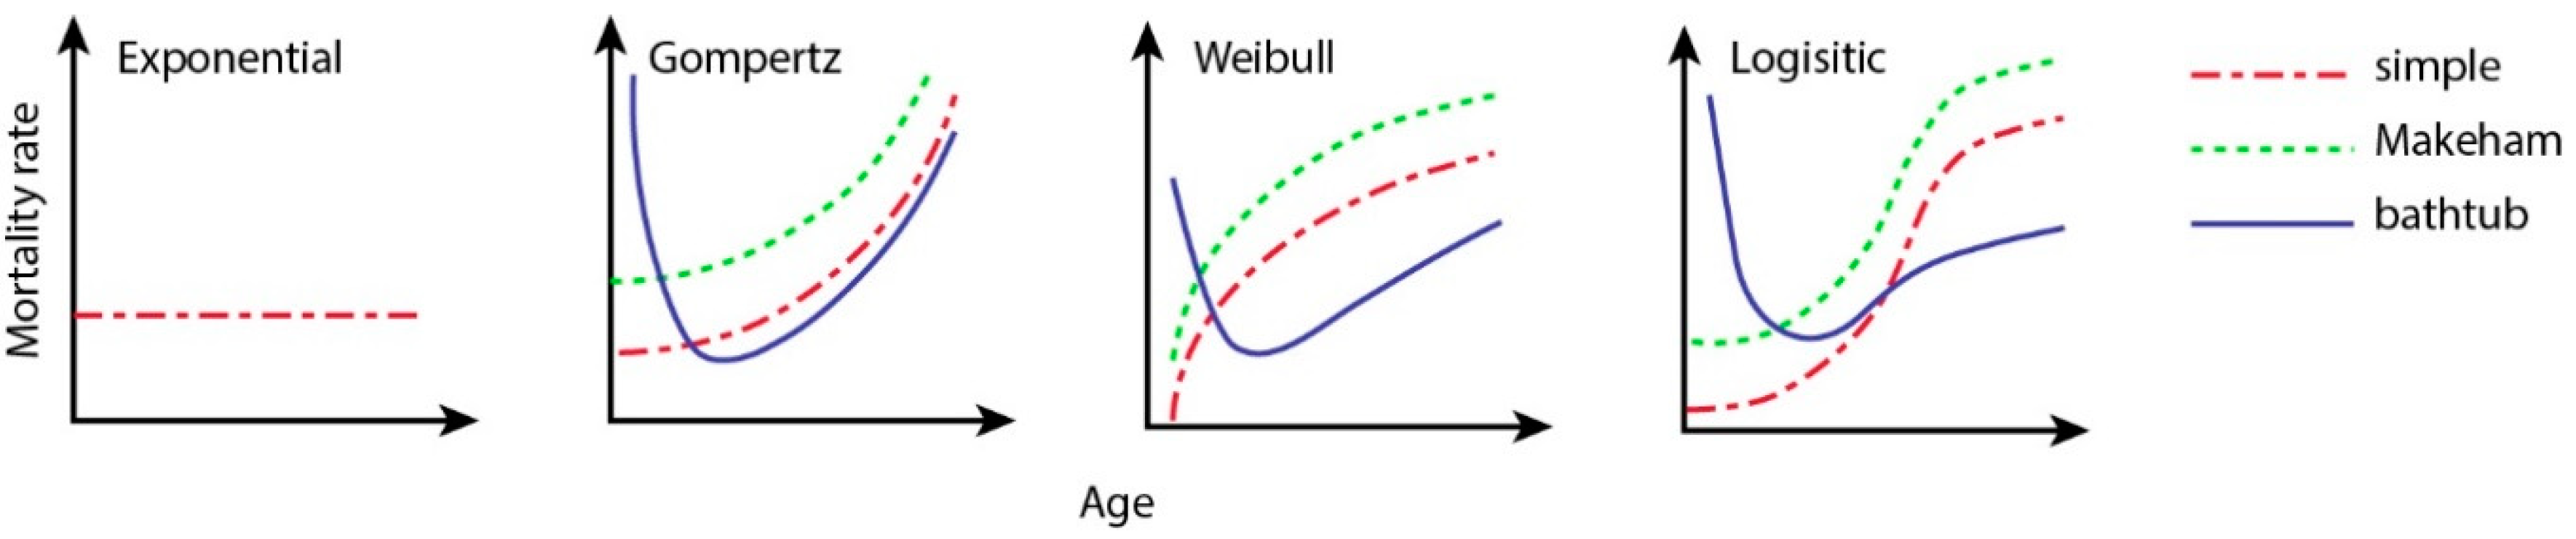
| Model | Parameters | ||
|---|---|---|---|
| Exponential | |||
| Gompertz [28] | |||
| Weibull [29] | |||
| Logistic [33] |
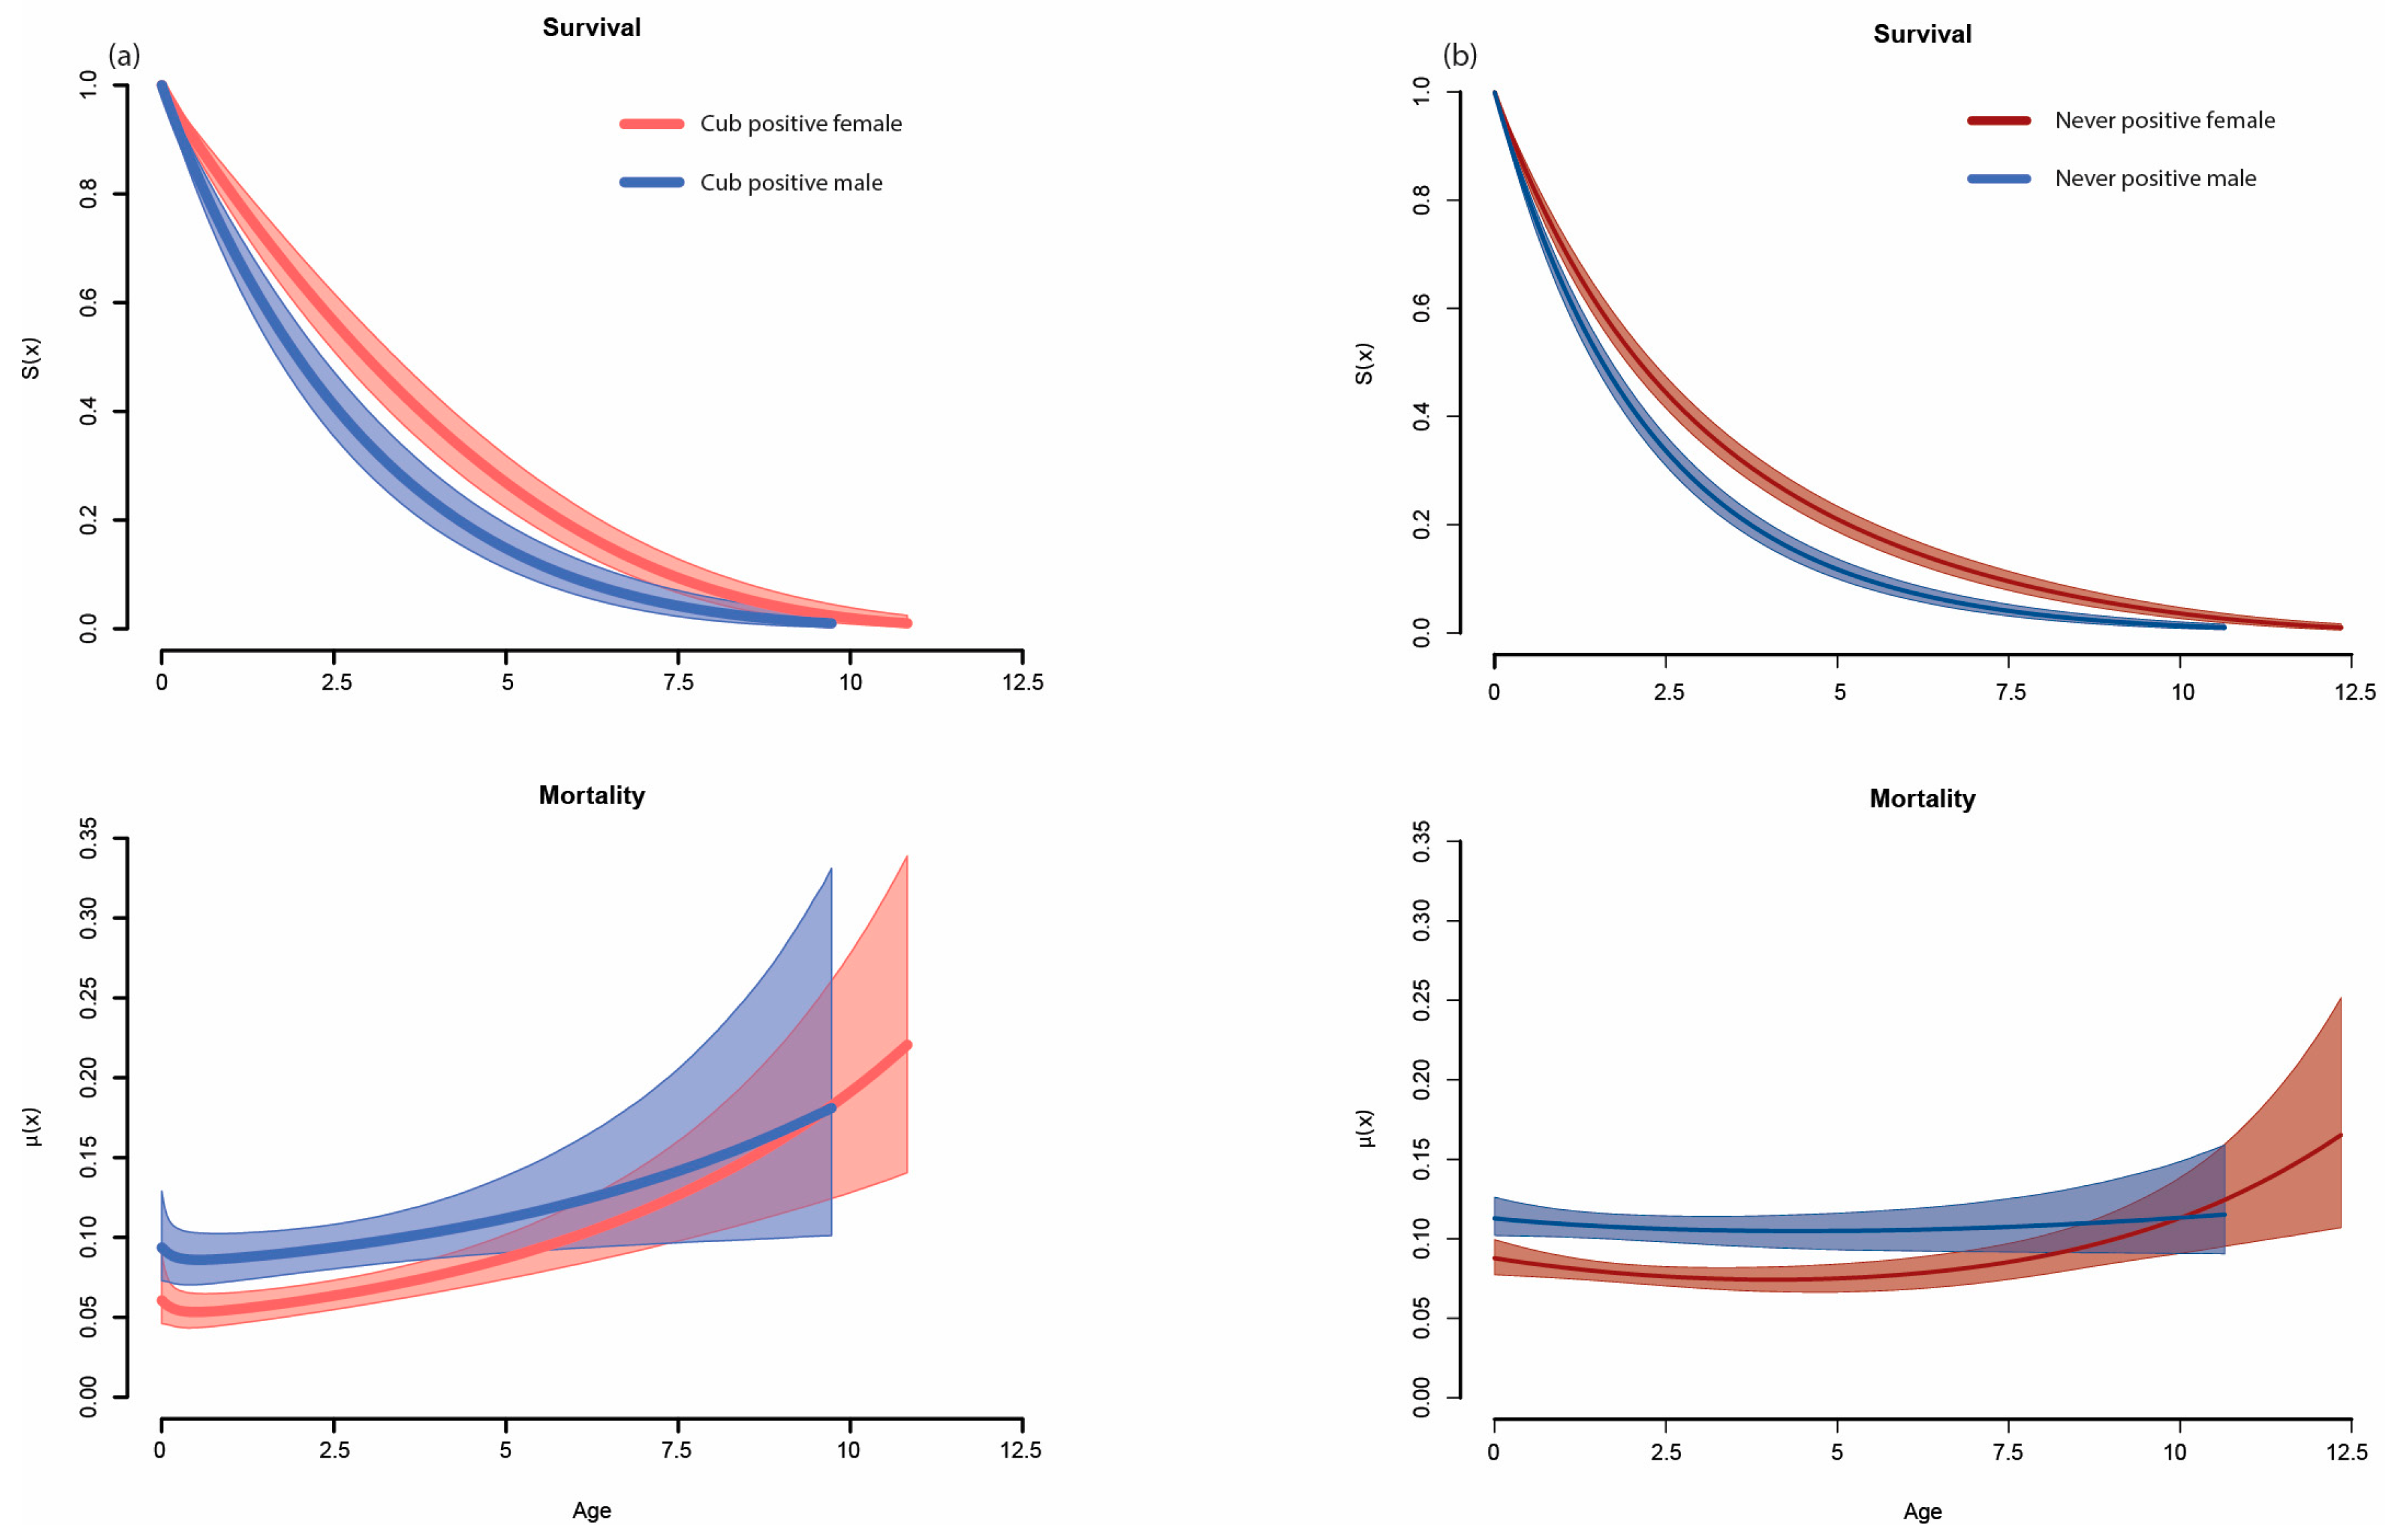
| Summary Statistic | Cub-Positive | Never-Positive |
|---|---|---|
| Total number badgers | 428 (M 191; F 237) | 1768 (M 833; F 935) |
| Number of known birth years | 428 | 1768 |
| Number of known death years | 13 | 323 |
| Total number of detections | 2515 | 7588 |
| Cub-Positive (in Rank Order by DIC) | Never-Positive | ||||||
|---|---|---|---|---|---|---|---|
| Model | Shape | DIC | DIC | Model | Shape | DIC | DIC |
| Gompertz | Bathtub | 4622 | 0 | Gompertz | Bathtub | 25,678 | 0 |
| Gompertz | Simple | 4642 | 20 | Exponential | Simple | 25,693 | 15 |
| Logistic | Bathtub | 4661 | 39 | Weibull | Bathtub | 25,695 | 17 |
| Weibull | Bathtub | 4669 | 47 | Weibull | Makeham | 25,954 | 276 |
| Weibull | Makeham | 4675 | 53 | Logistic | Makeham | 25,975 | 297 |
| Logistic | Makeham | 4682 | 60 | Logistic | Simple | 25,982 | 304 |
| Weibull | Simple | 4689 | 67 | Gompertz | Makeham | 26,004 | 326 |
| Logistic | Simple | 4697 | 75 | Logistic | Bathtub | 26,048 | 370 |
| Gompertz | Makeham | 4710 | 88 | Gompertz | Simple | 26,136 | 458 |
| Exponential | Simple | 4741 | 119 | Weibull | Simple | 26,235 | 557 |
© 2019 by the authors. Licensee MDPI, Basel, Switzerland. This article is an open access article distributed under the terms and conditions of the Creative Commons Attribution (CC BY) license (http://creativecommons.org/licenses/by/4.0/).
Share and Cite
Hudson, D.W.; Delahay, R.; McDonald, R.A.; McKinley, T.J.; Hodgson, D.J. Analysis of Lifetime Mortality Trajectories in Wildlife Disease Research: BaSTA and Beyond. Diversity 2019, 11, 182. https://0-doi-org.brum.beds.ac.uk/10.3390/d11100182
Hudson DW, Delahay R, McDonald RA, McKinley TJ, Hodgson DJ. Analysis of Lifetime Mortality Trajectories in Wildlife Disease Research: BaSTA and Beyond. Diversity. 2019; 11(10):182. https://0-doi-org.brum.beds.ac.uk/10.3390/d11100182
Chicago/Turabian StyleHudson, Dave W., Richard Delahay, Robbie A. McDonald, Trevelyan J. McKinley, and Dave J. Hodgson. 2019. "Analysis of Lifetime Mortality Trajectories in Wildlife Disease Research: BaSTA and Beyond" Diversity 11, no. 10: 182. https://0-doi-org.brum.beds.ac.uk/10.3390/d11100182