Article

Aquaculture-Mediated Invasion of the Genetically Improved Farmed Tilapia (Gift) into the Lower Volta Basin of Ghana

by
Gifty Anane-Taabeah
1,2,
Emmanuel A. Frimpong
2,* and
Eric Hallerman
2
1
Department of Fisheries and Watershed Management, Kwame Nkrumah University of Science and Technology, PMB, University Post Office, Kumasi, Ghana
2
Department of Fish and Wildlife Conservation, Virginia Polytechnic Institute and State University, Blacksburg, VA, 24061, USA
*
Author to whom correspondence should be addressed.
Submission received: 18 July 2019 / Revised: 25 September 2019 / Accepted: 30 September 2019 / Published: 2 October 2019
(This article belongs to the Special Issue Biological Invasions 2020 Horizon)

Abstract

:
The need for improved aquaculture productivity has led to widespread pressure to introduce the Genetically Improved Farmed Tilapia (GIFT) strains of Nile tilapia (Oreochromis niloticus) into Africa. However, the physical and regulatory infrastructures for preventing the escape of farmed stocks into wild populations and ecosystems are generally lacking. This study characterized the genetic background of O. niloticus being farmed in Ghana and assessed the genetic effects of aquaculture on wild populations. We characterized O. niloticus collected in 2017 using mitochondrial and microsatellite DNA markers from 140 farmed individuals sampled from five major aquaculture facilities on the Volta Lake, and from 72 individuals sampled from the wild in the Lower Volta River downstream of the lake and the Black Volta tributary upstream of the lake. Our results revealed that two farms were culturing non-native O. niloticus stocks, which were distinct from the native Akosombo strain. The non-native tilapia stocks were identical to several GIFT strains, some of which showed introgression of mitochondrial DNA from non-native Oreochromis mossambicus. We also found that the non-native cultured tilapias have escaped into the wild and interbred with local populations, and also observed potentially admixed individuals on some farms. Our results highlight aquaculture as a vector in the spread of invasive non-native species and strains, and underscore the importance of genetic baseline studies to guide conservation planning for wild populations.

1. Introduction

The Nile tilapia (Oreochromis niloticus) is one of the most widely introduced fish species outside its native range. Originally from Africa and the Middle East, the Nile tilapia has been introduced to nearly all tropical and sub-tropical regions, primarily for aquaculture purposes [1,2]. Many genetically improved tilapia strains have been developed for aquaculture production, including the Genetically Improved Farmed Tilapia (GIFT), Genetically Enhanced Tilapia-Excellent (GET-EXCEL), Brackishwater Enhanced Saline Tilapia (BEST), Genetically Male Tilapia (GMT), Chitralada, YY-male, Cold-tolerant tilapia (COLD), and Florida red strains [3]. The Genetically Improved Farmed Tilapia (GIFT) strain of O. niloticus was founded using parental stocks from eight countries, including four African countries (Egypt, Ghana, Kenya, and Senegal), and developed by 15 generations of selective breeding [4]. The subsequent distribution of the GIFT strain for commercial farming in Asia revolutionized tilapia aquaculture in Asia and contributed to increased global tilapia production [4,5,6,7,8]. However, due to the risk of contamination of locally adapted native genetic stocks, the WorldFish Center and other development partners responsible for the GIFT strain adopted a policy that did not allow the dissemination of GIFT to African countries where the original parental stocks were collected [9].
In Ghana, as in many other sub-Saharan African countries where O. niloticus is the main aquaculture species, locally available native strains are widely considered inferior to the GIFT and related strains with respect to growth performance. Recognition of the need for improved strains of tilapia in Africa and the desire to ensure that Africa benefits from the GIFT project without the associated ecological and genetic risks of introducing the GIFT strain resulted in the development of the Ghanaian Akosombo and the Egyptian Abbassa strains using the GIFT selective breeding methodology [9,10,11,12]. In recent years, however, many commercial farmers in Ghana have expressed discontentment with the growth and survival rates of the Akosombo strain. As part of the development and validation of the Akosombo strain, the GIFT strain was imported by the Ghanaian government’s Aquaculture Research Development Centre (ARDEC) in 2012 for experimentation alongside the Akosombo strain [13].
Ansah et al. [13] analyzed the economic benefits and the long-term ecological risks of introducing the GIFT strain to Africa and suggested that practical biosecurity measures be implemented prior to any future GIFT introductions. However, the effectiveness of biosecurity measures can be assessed only if countries properly define their conservation goals based on the characterization of the differentiation of natural populations requiring protection from genetic introgression in specific geographic regions. In Ghana, there are unconfirmed reports of farmers growing the GIFT strain even though the strain has not been officially approved for commercial farming. While much of aquaculture in Ghana is conducted in small- to medium-scale facilities in ponds, the aquaculture operations near the Volta Lake are relatively large and cage-culture based. Cages are prone to escape of fish into natural surface waters, with the possibility of attendant genetic impacts upon native receiving populations. If farmers are growing the unapproved genetically improved strains, especially on the Volta Lake where cultured fish easily escape into the wild [10], it is urgent to investigate the possible outcomes of such introductions, including the interbreeding of farmed and wild populations.
Population genetic structure of O. niloticus within West Africa has not been well characterized. Using allozyme markers, Rognon et al. [14] observed modest levels of genetic differentiation among seven wild populations. Screening nine microsatellite DNA loci across 350 samples from ten natural populations, Bezault et al. [15] found high genetic differentiation across the Ethiopian, Nilotic and Sudano-Sahelian regions and ichthyofaunal provinces, and intermediate levels of divergence between populations in rivers and lakes within regions, presumably reflecting relatively recent interruptions of gene flow between hydrographic basins. While some research has focused on the genetic variation among O. niloticus populations within the Volta system in West Africa [12,16,17], ours is the first study to focus upon genetic differentiation among O. niloticus populations for purposes of conservation planning for wild populations. The assessment of the genetic variability among natural populations of O. niloticus in aquaculture receiving waters will provide vital baseline information for purposes of conserving any genetically distinct native populations remaining and for ongoing monitoring of aquaculture impacts on aquatic ecosystems in Ghana. Therefore, this study was conducted in order to: (1) Characterize the genetic background of Nile tilapia O. niloticus being farmed in Ghana using sequence variation at the mitochondrial D-loop and COI regions and amplification of fragment size variation at ten nuclear microsatellite loci, and (2) assess the genetic effects of aquaculture on wild populations using selected farms operating on the Volta Lake in Ghana.

2. Materials and Methods

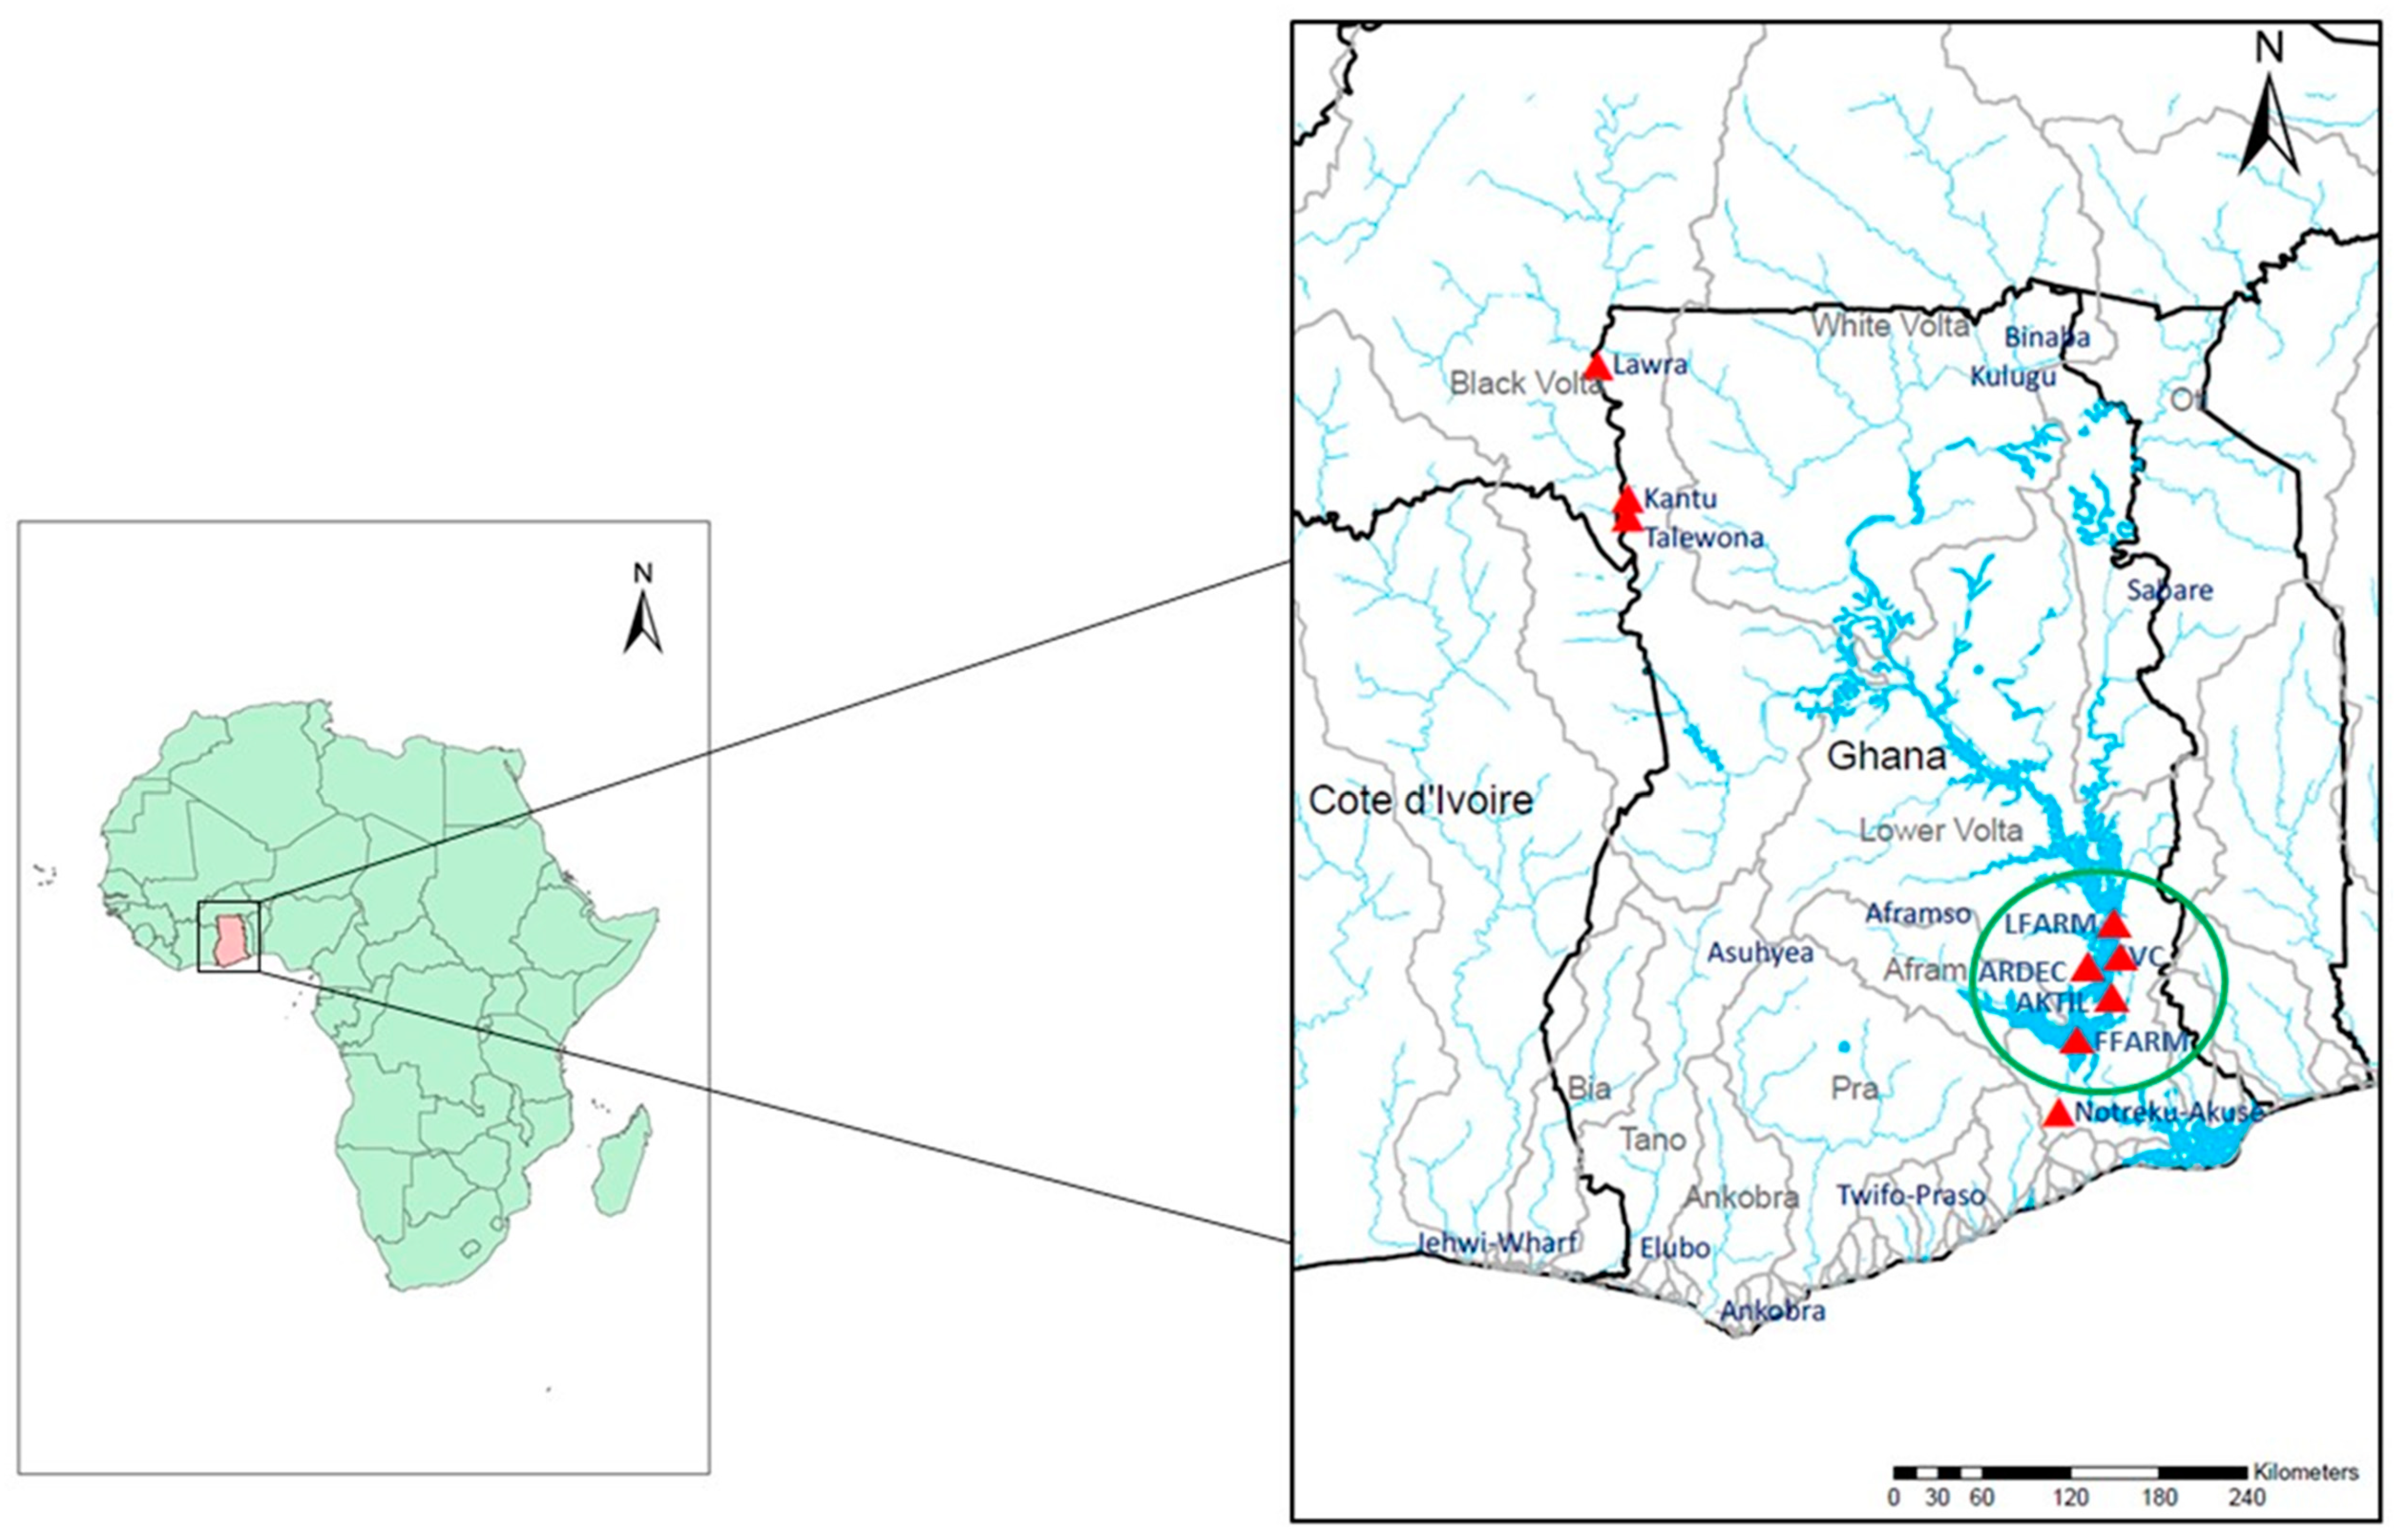
2.1. Fish Sampling and DNA Extraction

Fin-clips were obtained from 140 farmed and 72 wild tilapia collected between March and July 2017 (Table 1). Farmed tilapia samples were obtained from five major aquaculture facilities operating on the Volta Lake in Ghana, including Lee’s Farm, Volta Catch, Akosombo Tilapia, Fujian Farm, and the Aquaculture Research and Development Centre (ARDEC), the government hatchery responsible for the development and dissemination of the native Ghanaian Akosombo strain of O. niloticus. Farmed samples were obtained either directly from the farms or from wholesale distribution points of farms. Wild O. niloticus were sampled from two rivers: (1) Black Volta River, an upstream location far from the aquaculture sites; and (2) Lower Volta River, a downstream location close to the aquaculture sites. Figure 1 shows the sampling locations for both wild and farmed samples.
All fin-clips were stored in paper envelopes, dried, and transported to Virginia Tech, USA, for laboratory analysis. Total genomic DNA was extracted using the DNeasy Blood and Tissue kit (Qiagen, Germantown, MD, USA) according to the manufacturer’s instructions. The DNA was quantified using a μLite spectrophotometer (Biodrop, Cambridge, UK) and concentrations were standardized for use in the polymerase chain reaction (PCR).

2.2. Mitochondrial DNA Sequences

For mitochondrial DNA analysis, we sequenced and analyzed variation among 69 individuals comprising 42 farmed and 27 wild fish. Two mitochondrial DNA markers—the displacement loop (D-loop) region (control region), and the cytochrome c oxidase subunit 1 (CO1) gene—were selected and amplified by PCR. The D-loop was chosen because it is the most variable region in the mitochondrial genome and known to be a “hot spot” for mutation. CO1 was chosen because it is used widely as a barcoding gene marker to help identify species [18].
Primers (forward 5′-ACCCCTAGCTCCCAAAGCTA-3′ and reverse 5′- CCTGAAGTAGGACCAGATG-3′) previously designed for O. niloticus [19] were used for amplifying D-loop sequences. Universal fish primers (forward F2 and VF2, reverse R2 and FR1d) [20] were used for CO1 gene amplification. Details of PCR amplification are presented in Appendix A. PCR products were visualized with agarose gel electrophoresis to confirm amplification and amplicon sizes (391 bp for D-loop, 315 bp for COI) prior to sequencing with an ABI3730 automated DNA sequencer at the Virginia Tech Biocomplexity Institute (Blacksburg, VA).
The raw DNA sequences were assembled using Geneious® 11.1.2 (Biomatters Ltd., Auckland, New Zealand). The consensus sequences obtained were aligned with ClustalW [21] embedded in GeneStudio™ v2.2 (http://genestudio.com/). Variable sites and parsimony-informative sites were determined using MEGA7 [22] software. Haplotypes were inferred using the program DnaSP 6.11.01 [23] for downstream analyses. Using the Basic Local Alignment Search Tool (BLAST) [24], haplotype sequences for the DNA markers were queried against entries in GenBank, and highly homologous sequences obtained from the BLAST searches were retrieved and used as a reference sequences for the phylogenetic analyses.
We used five types of reference samples, and an outgroup for D-loop analysis: (1) Tilapia products were purchased in October 2017 from two U.S. grocery stores (N = 9). (2) GenBank sequences for the GIFT strain of O. niloticus together with the Egyptian, Filipino, and American strains of O. niloticus, which were studied in China (accession numbers GU477624, GU477625, GU477626, GU477628) were downloaded from GenBank (N = 4). (3) GenBank sequences for O. mossambicus, and one O. niloticus × O. mossambicus hybrid (accession numbers AF296466, EU430997, AF328843, AY833436, AY833448, and AY833481, respectively, N = 6) were downloaded from GenBank. (4) West African O. niloticus reference samples included samples obtained from Cote d’Ivoire and sequenced as part of the present study, a GenBank sequence of O. niloticus sampled from Senegal (accession number EF016715), and a GenBank sequence of O. niloticus sampled from Ghana (accession number AF485083) (N = 3). (5) GenBank sequences represented East African subspecies of O. niloticus sampled from Kenya (accession numbers AJ237397, EF016672, FJ440579, EF016688, and AF296468) (N = 5). Coptodon zillii was chosen as the outgroup for the construction of the phylogenetic tree; the C. zillii D-loop sequence used was from an individual collected from the Volta River in Ghana during our field sampling.

2.2.1. D-loop Phylogenetic Relationships

We analyzed the phylogenetic relationships among mitochondrial D-loop sequences of the respective samples. The phylogenetic tree was constructed using the Ghanaian O. niloticus haplotype sequences and five groups of reference samples. All DNA sequences were aligned, and the best substitution model for sequence evolution was determined using the program MrModeltest 2.3 [25] implemented within PAUP 4.0 [26]. Phylogenetic analysis based on a Bayesian inference algorithm was conducted using MrBayes 3.2.6 [27] using the parameters specified from MrModeltest. We checked for convergence of the runs using the output from MrBayes; the effective sample size (ESS) value for all parameters estimated in our model were > 1660. The best substitution model selected using the Akaike Information Criterion was the symmetrical model with gamma-shaped distribution (SYM + G). The phylogenetic analysis was performed with 2 million Markov Chain Monte Carlo (MCMC) generations with four chains, a sample frequency of every 100 generations, and a burn-in of 500,000 generations. The analysis was performed in two runs. A total of 30,002 trees was sampled. The average standard deviation of split frequency was 0.0053 with a -Ln likelihood of −1537.66. The resulting phylogenetic tree was visualized with FigTree 1.4.2 [28]. The evolutionary divergence between haplotypes was estimated using pairwise sequence divergence implemented in the program MEGA7 [22].

2.2.2. CO1 Phylogenetic Relationships

We assessed the presence or absence of GIFT and related strains in Ghana by sequencing the CO1 gene of two farmed samples (FFARM28 and FFARM29) previously identified as GIFT haplotypes from the D-loop analysis (haplotypes 14 and 13, respectively). The COI sequences were compared to CO1 sequences from GIFT samples from GenBank (accession numbers KU565827 and KU565864) and related strains (e.g., EXCEL3, BEST-BC3, PNT-04) collected in the Philippines and available in GenBank(accession numbers KU565814, KU565843, and KC789549 respectively). This verification step was necessary because no information on the GenBank Onilo_GIFT (used for the D-loop phylogenetic analysis) linked the sequence to the GIFT project, and no other appropriate GIFT sequences were found on GenBank for the D-loop analysis. We also sequenced four farmed individuals identified as native Ghanaian haplotypes from the D-loop analysis [ARDEC1 (haplotype 24), ARDEC13 (haplotype 1), LFARM1 (haplotype 9), and VCA1 (haplotype 1)] as reference samples. The relationships among the samples were visualized using a haplotype network constructed based on the method of Templeton, Crandall, and Sing (TCS) [29]; using the program TCS network [30].

2.3. Nuclear DNA Microsatellites

We genotyped all the 140 farmed and 72 wild samples using polymerase chain reaction (PCR) with ten microsatellite DNA markers designed for O. niloticus [31,32]. These markers have shown high allelic variation in previous studies [32,33,34], and were screened for polymorphism in our populations prior to including them in the study. Technical information for the respective microsatellite markers is presented in Table 2. Details of PCR amplification are presented in Appendix A. PCR products were visualized using agarose gel electrophoresis to confirm amplification and amplicon sizes prior to genotyping with an ABI3730 automated DNA sequencer at the Virginia Tech Biocomplexity Institute (Blacksburg, VA, USA) or Cornell University (Ithaca, NY, USA). Amplification products were visualized with GeneMarker version 2.6.4 and scored by eye.
We used the program Microchecker [35] to check for genotyping errors in the data set resulting from null alleles, false peaks, and short-allele dominance using a Monte Carlo simulation of differences in the expected allele size. We screened populations for linkage disequilibrium (LD) between all loci pairs [36], and for Hardy-Weinberg equilibrium (HWE) deviations at each locus using Arlequin, version 3.1 [37]. We determined the significance of departures of genotype frequencies from Hardy-Weinberg equilibrium using Fisher’s exact test with a Markov chain of 1,000,000 steps and 100,000 dememorization steps [38], and assessed the significance of linkage disequilibrium pairwise tests using the likelihood-ratio test with 10,000 permutations [39]. We then used the sequential Bonferroni correction, an approach used to account for possible Type 1 errors associated with multiple pairwise evaluations [40].
We quantified genetic variation across the microsatellite loci for both the wild and farmed tilapia populations using a number of alleles per locus, observed and expected heterozygosities, and a number of private alleles. We assessed population differentiation using the FST [41] metric of differentiation, and analysis of molecular variance (AMOVA) using the program Arlequin. We calculated locus-by-locus genic differentiation using the Fisher’s exact G test executed in Genepop on the Web [42]. We further assessed population structure using a Bayesian clustering program, Structure v 2.3.4. [43,44]. We used an admixture model for assessing possible introgression from the farmed populations and the extent of mixing of farmed populations with wild populations. The model was executed with 100,000 burn-in, and 500,000 MCMC replicates with the ancestry correlated option using default settings. Consequently, we set K = 1 to 7 for individual assignment analyses. The best-supported K values were selected using the Evanno et al. [45] method implemented online in Structure Harvester [46], and the LnP(D:K) criterion reported in Structure output. The resulting Structure plots were visualized using the Clumpak program [47].

3. Results

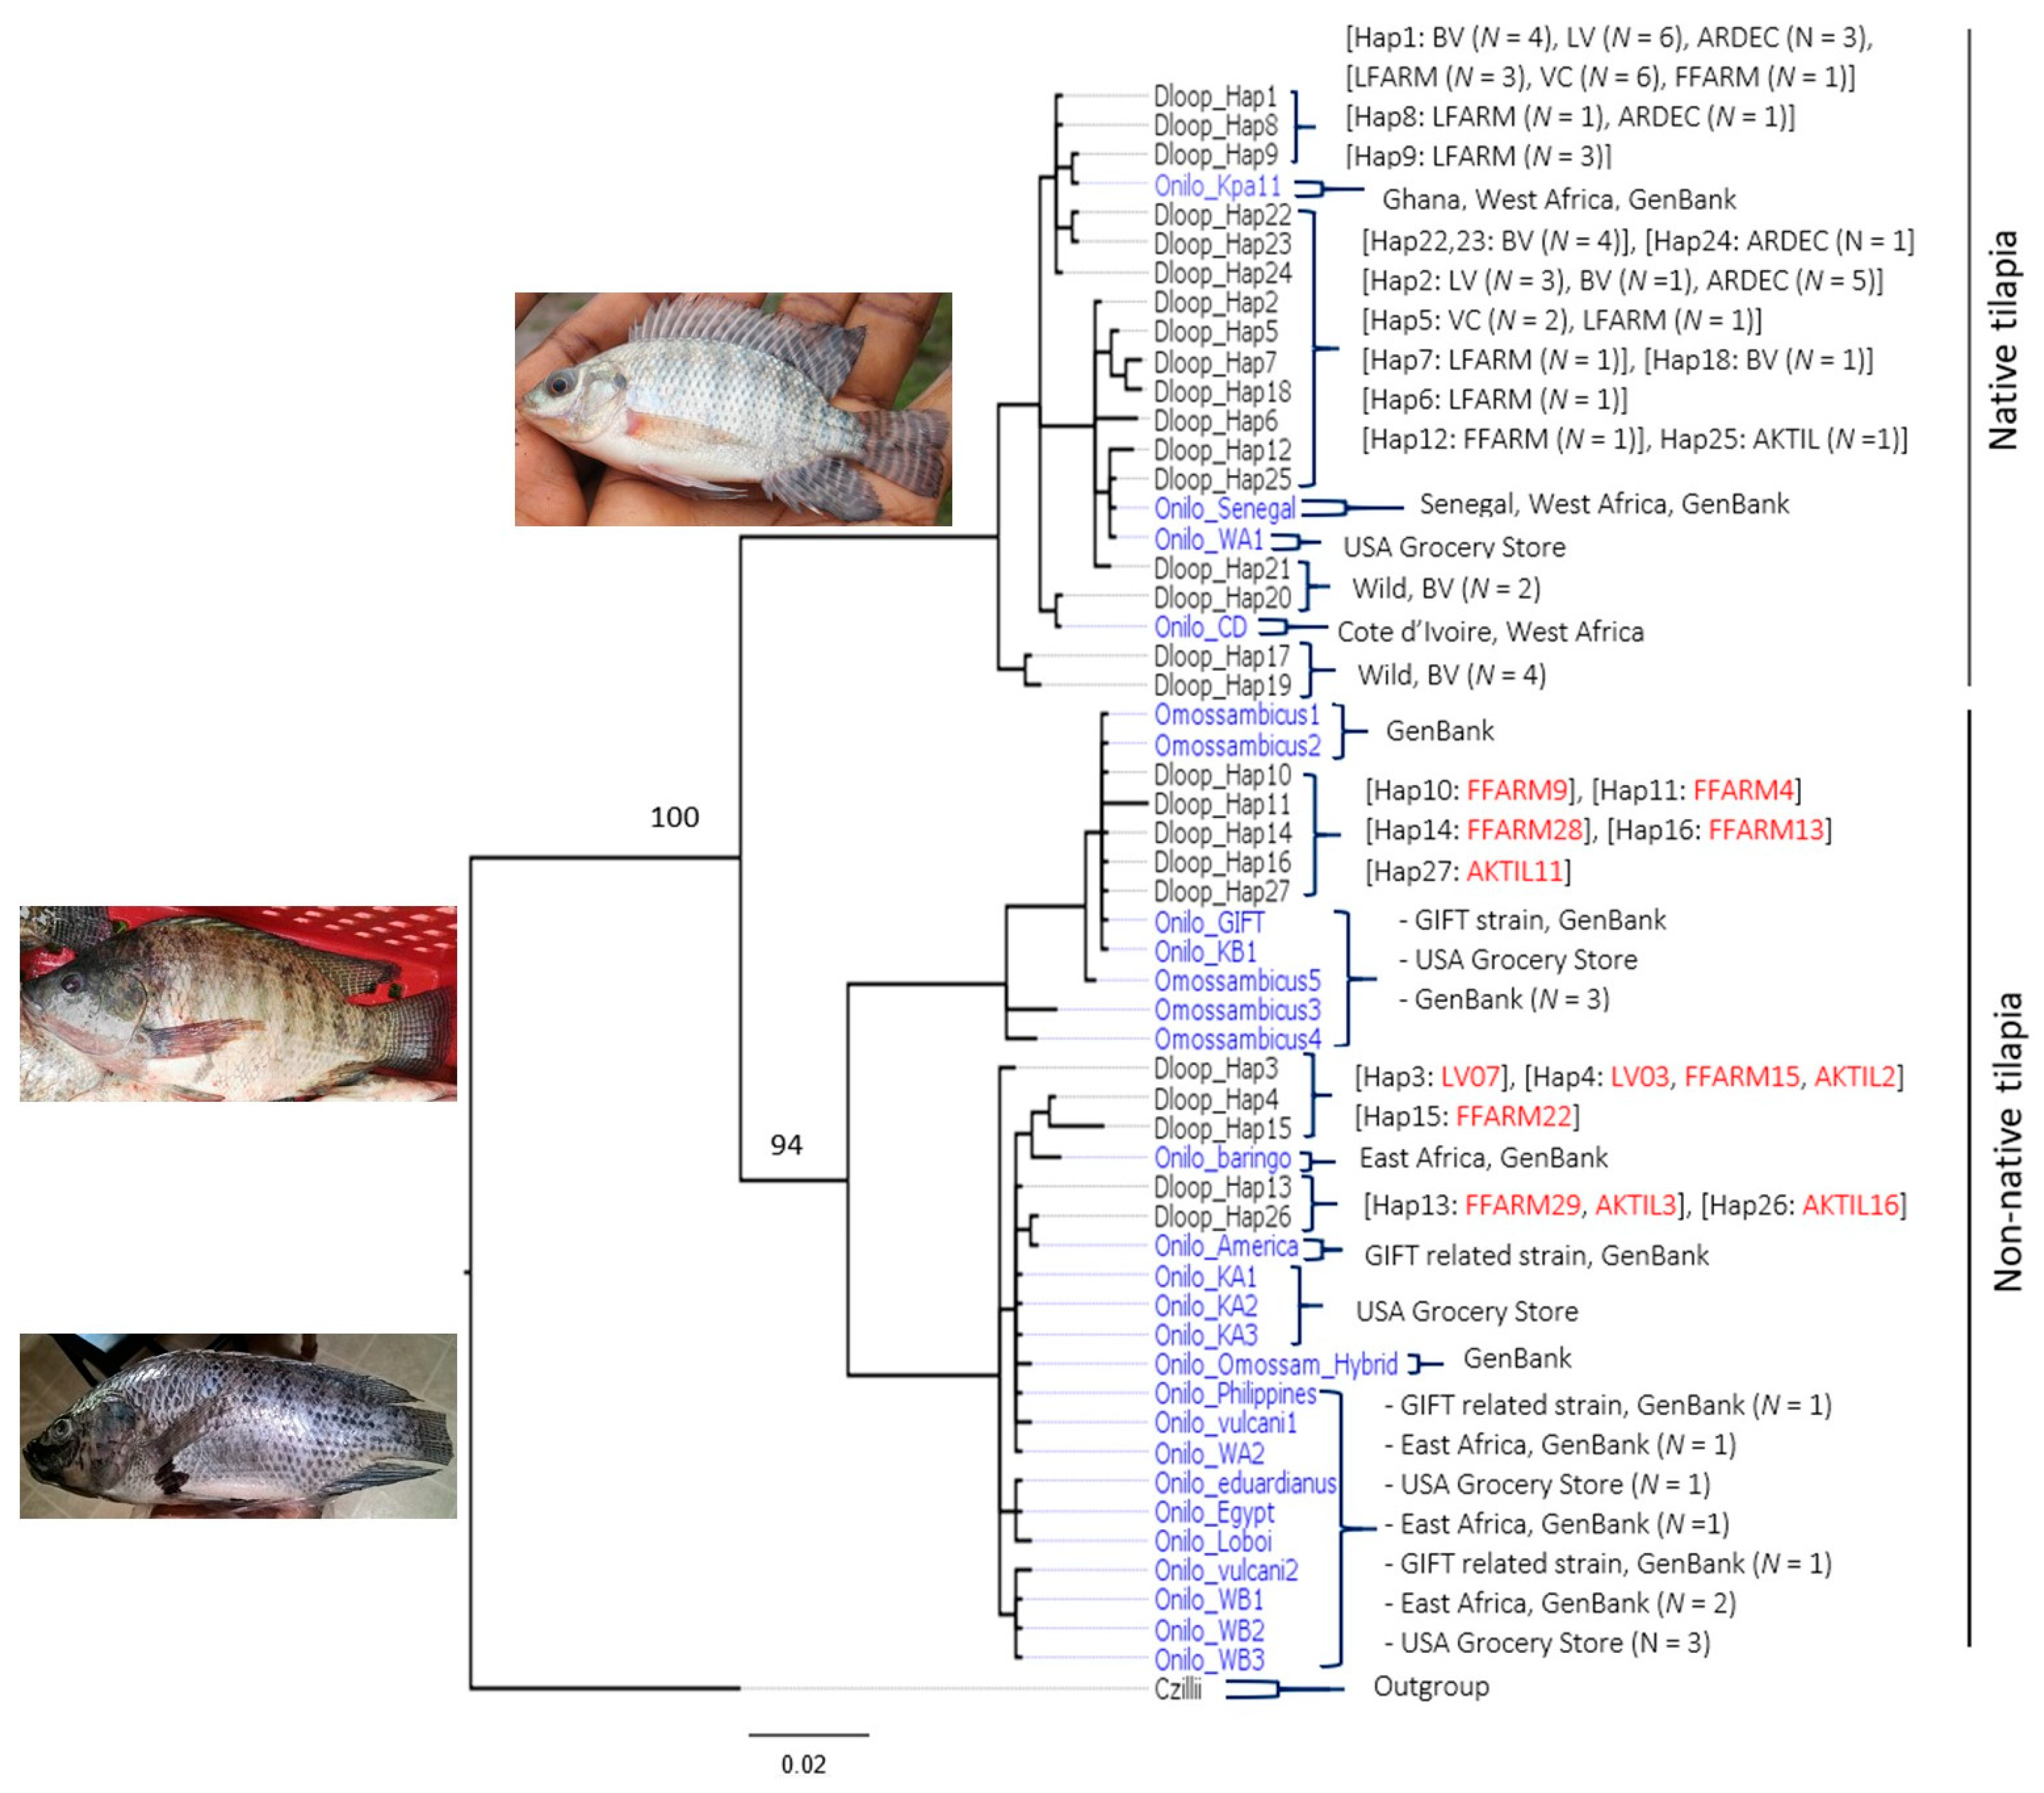
3.1. D-loop Haplotypes and Phylogenetic Relationships

A DNA sequence of 391 bp covering the hypervariable region (280 bp) and the first part of the central conserved region (111 bp) of the mitochondrial D-loop region was analyzed. There were 79 variable sites and 68 parsimony-informative sites. Twenty-seven haplotypes were identified among the 69 individuals sequenced (Table A1). The first two haplotypes were exhibited among nearly 50% (N = 32) of all the individuals from every site except Akosombo Tilapia Farm. Every geographic site, which exhibited haplotypes 1 and 2 included at least three individuals; except for Fujian Farm, in which a single individual exhibited haplotype 1. Of the remaining 25 haplotypes, 17 were private haplotypes observed in collections from wild sites only or farmed sites only. The private haplotypes from farmed sites were dominated by samples from two farms, Fujian Farm and Akosombo Tilapia Farm. One haplotype was shared by those two farms, Fujian Farm and Akosombo Tilapia Farm, and the Lower Volta River.
The results of the phylogenetic analysis of mitochondrial D-loop sequences showed two genetically distinct clusters with 100% posterior support (Figure 2 and Table A2), which also were distinct from that of the outgroup species, C. zillii. The first cluster, which we term the “native tilapia cluster”, contained 17 haplotypes, including haplotypes 1 and 2 (the haplotypes observed in the majority of both wild and farmed individuals), as well as seven “wild” haplotypes (of the eight observed) originating from the Black Volta River (haplotypes 17–23, Table A1 and Figure 2). The “O. niloticus” cluster also contained the sample from Cote d’Ivoire (Onilo_CD), the GenBank sequence Onilo_Kpa11 originally sampled from the Volta basin in Ghana by Falk et al. [48] as part of a genetic study of black-chinned tilapia, Sarotherodon melanotheron, and one sample from the U.S. grocery-store tilapia reference group (Onilo_WA1).
The second cluster, which can be described as the “non-native tilapia cluster”, further divided into two sub-clusters with 94% posterior support (Figure 2). The first sub-cluster within the “non-native tilapia” cluster, which we term the “O. mossambicus” cluster in Table A2, contained all five GenBank sequences for O. mossambicus, four private haplotypes from the Fujian Farm (haplotypes 10, 11, 14, and 16) and one private haplotype from the Akosombo Tilapia Farm (haplotype 27), one of the U.S. grocery-store tilapia samples (KB1), and the GenBank O. niloticus_GIFT strain sequence.
The second sub-cluster, which we term the “O. niloticus introgressed with O. mossambicus” cluster in Table A2, consisted of a GenBank sequence of an O. niloticus × O. mossambicus hybrid, five haplotypes, including two private haplotypes from three sites—Fujian Farm (haplotype 15), the Lower Volta River (haplotype 3), and Akosombo Tilapia Farm (haplotype 26); haplotype 4 shared by the Fujian Farm, Lower Volta River, and Akosombo Tilapia Farm; and haplotype 13 shared by Fujian Farm and Akosombo Tilapia Farm. The “O. niloticus introgressed with O. mossambicus” cluster also contained all five East African reference sequences; seven of the nine U.S. grocery-store tilapia reference samples, and the three GIFT-related strains (Egyptian strain, Filipino strain and the American strain).
Pairwise nucleotide Tamura-3 parameter distances provided further support for the clustering observed. The genetic distances were considerably larger between clusters than within clusters (Table A3). For instance, the genetic distances (i.e., dissimilarity) between the “O. niloticus” cluster and the “O. mossambicus” cluster, and the “O. niloticus introgressed with “O. mossambicus” cluster ranged from about 14–16% and 13–15% respectively, compared to the largest within-group distance of 1.7% for the “O. niloticus” cluster (Table A3). Divergence based on fixed nucleotide differences at the variable sites further supported the inference that individuals in the “O. niloticus” cluster were genetically distinct from individuals in the inferred “O. mossambicus” and “O. niloticus introgressed with O. mossambicus” clusters (Table A2).

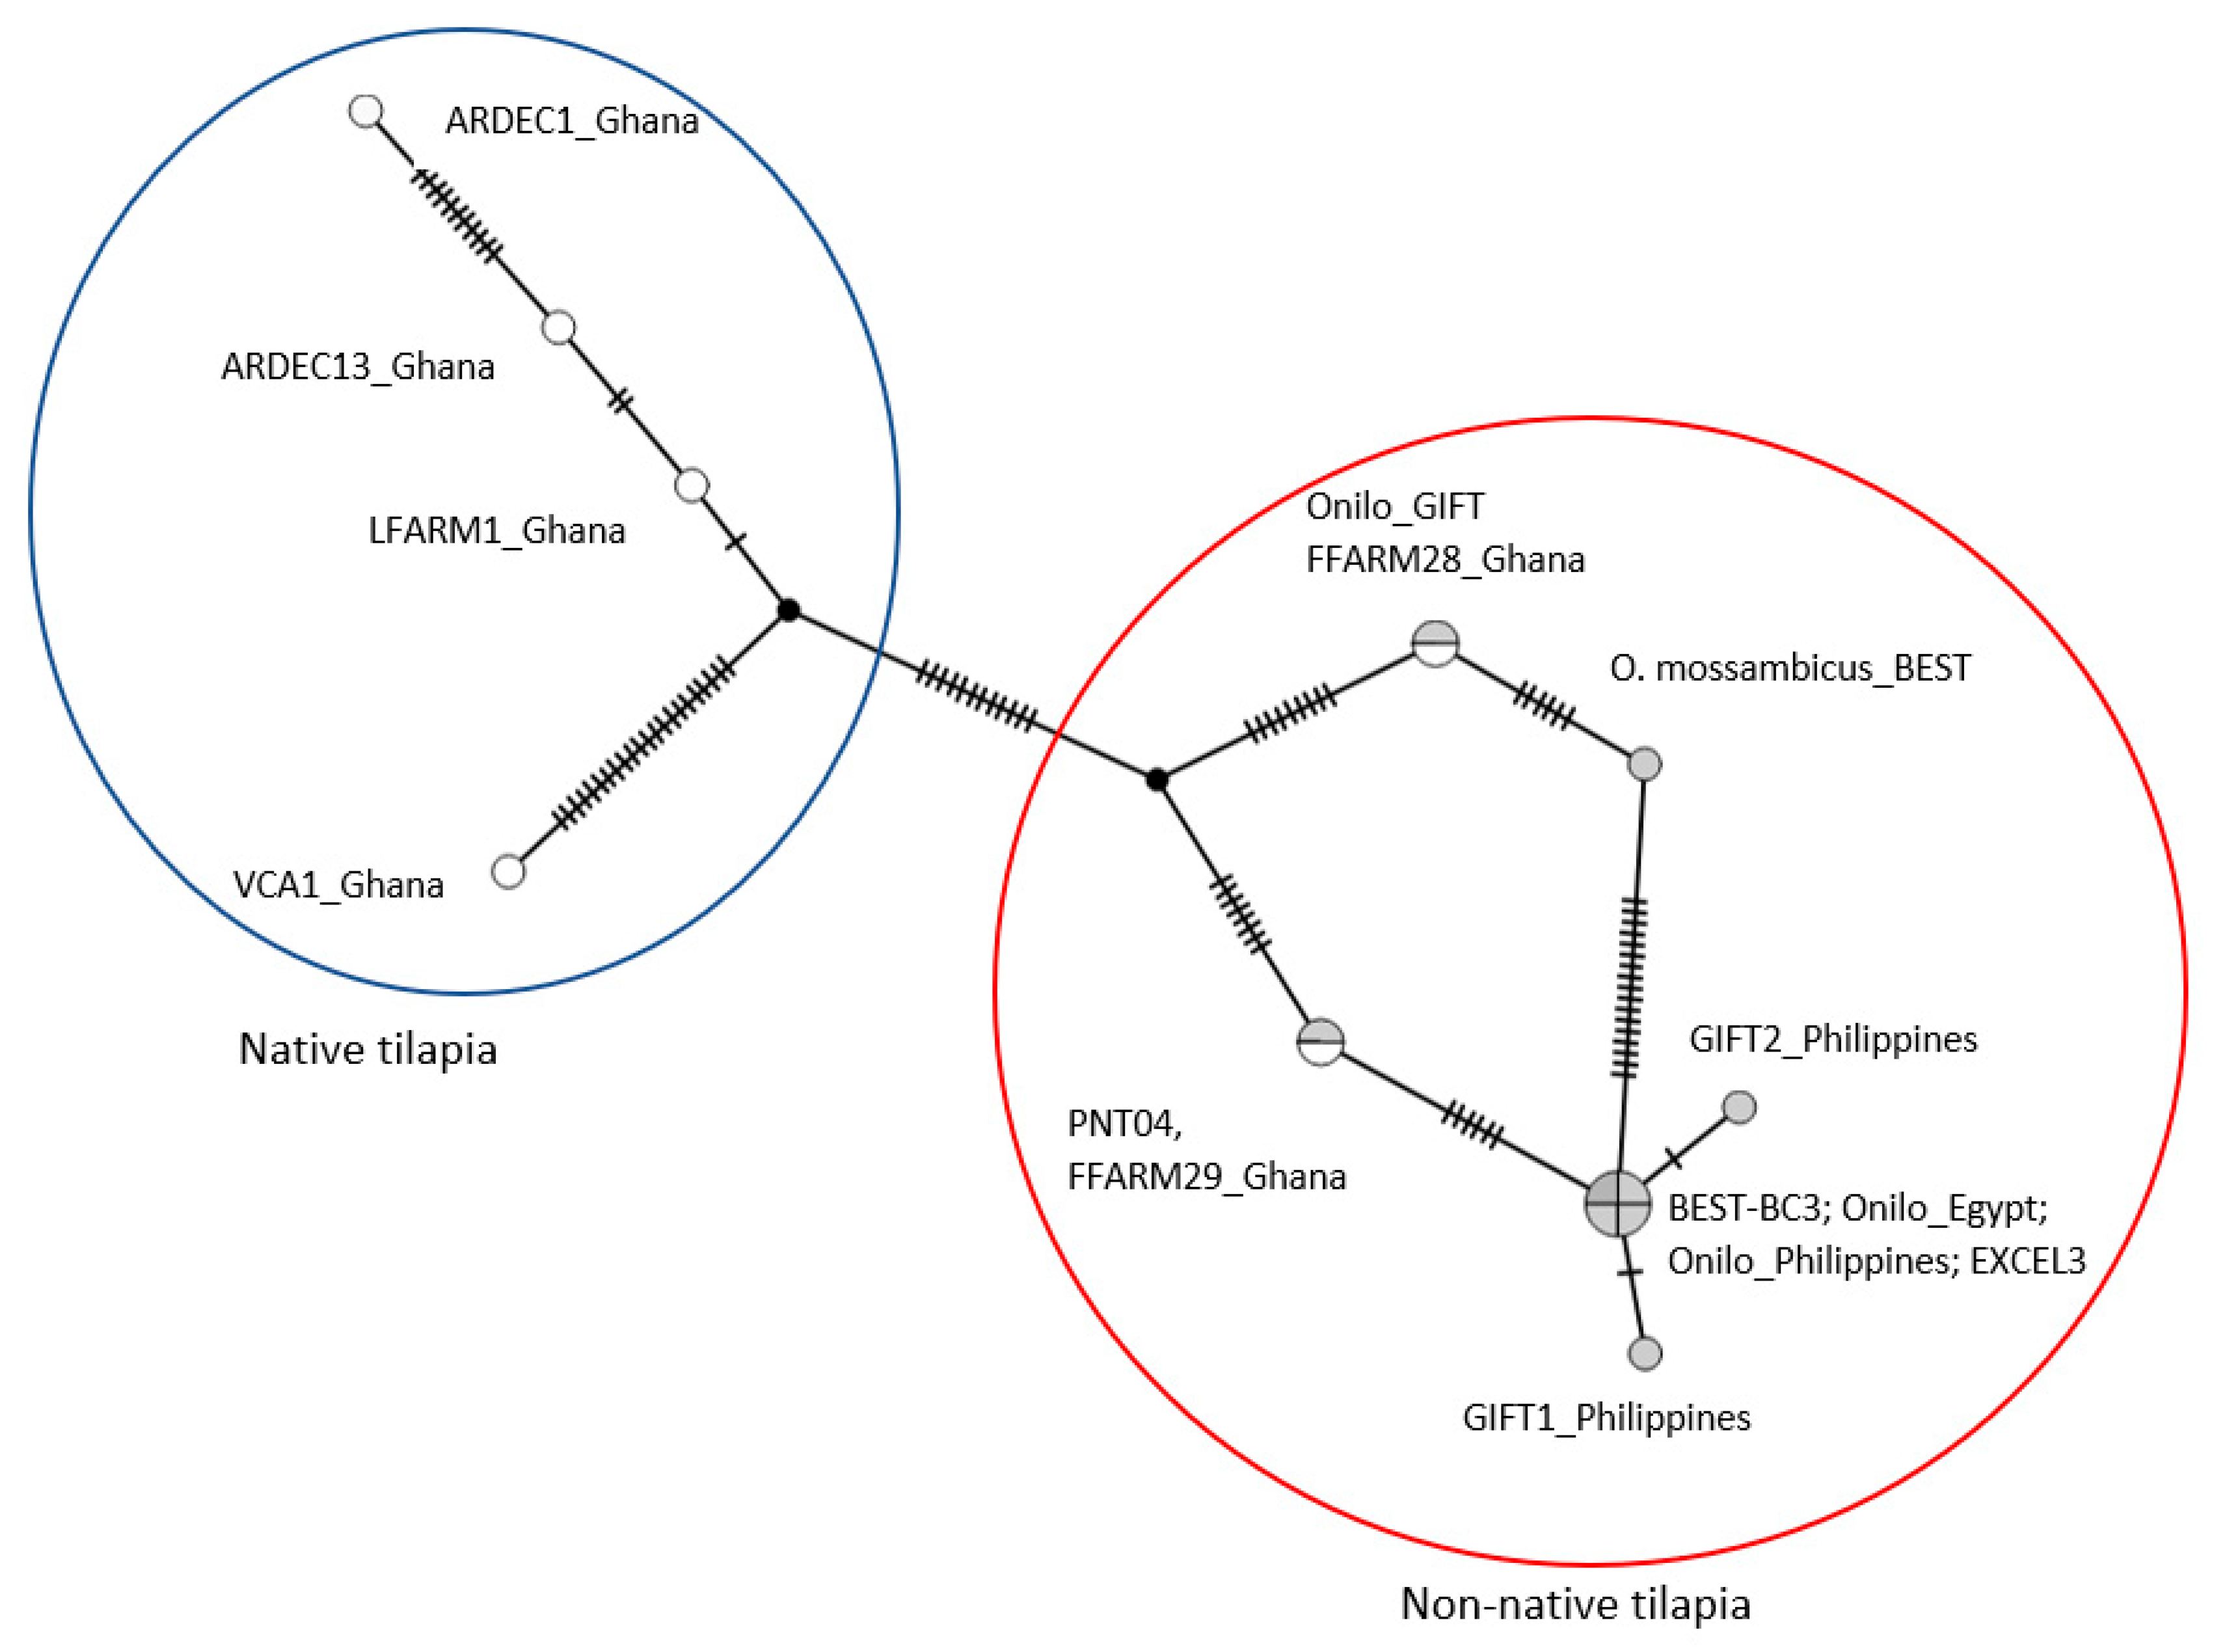
3.2. CO1 Phylogenetic Relationships

The results for the mitochondrial haplotype network analysis were congruent with the results obtained from the D-loop analysis. The results showed that the Fujian Farm samples (FFARM28 and FFARM29) were distinct from the native tilapia populations (Figure 3). The Philippines GIFT strain sequences were closely related with FFARM29 sampled from Fujian Farm, other improved strains, and the Egyptian and GIFT-related strains used in the D-loop analysis (Figure 3). Additionally, FFARM28 was closely related to the GenBank O. mossambicus sequence, similar to findings from the D-loop analysis (Figure 3).

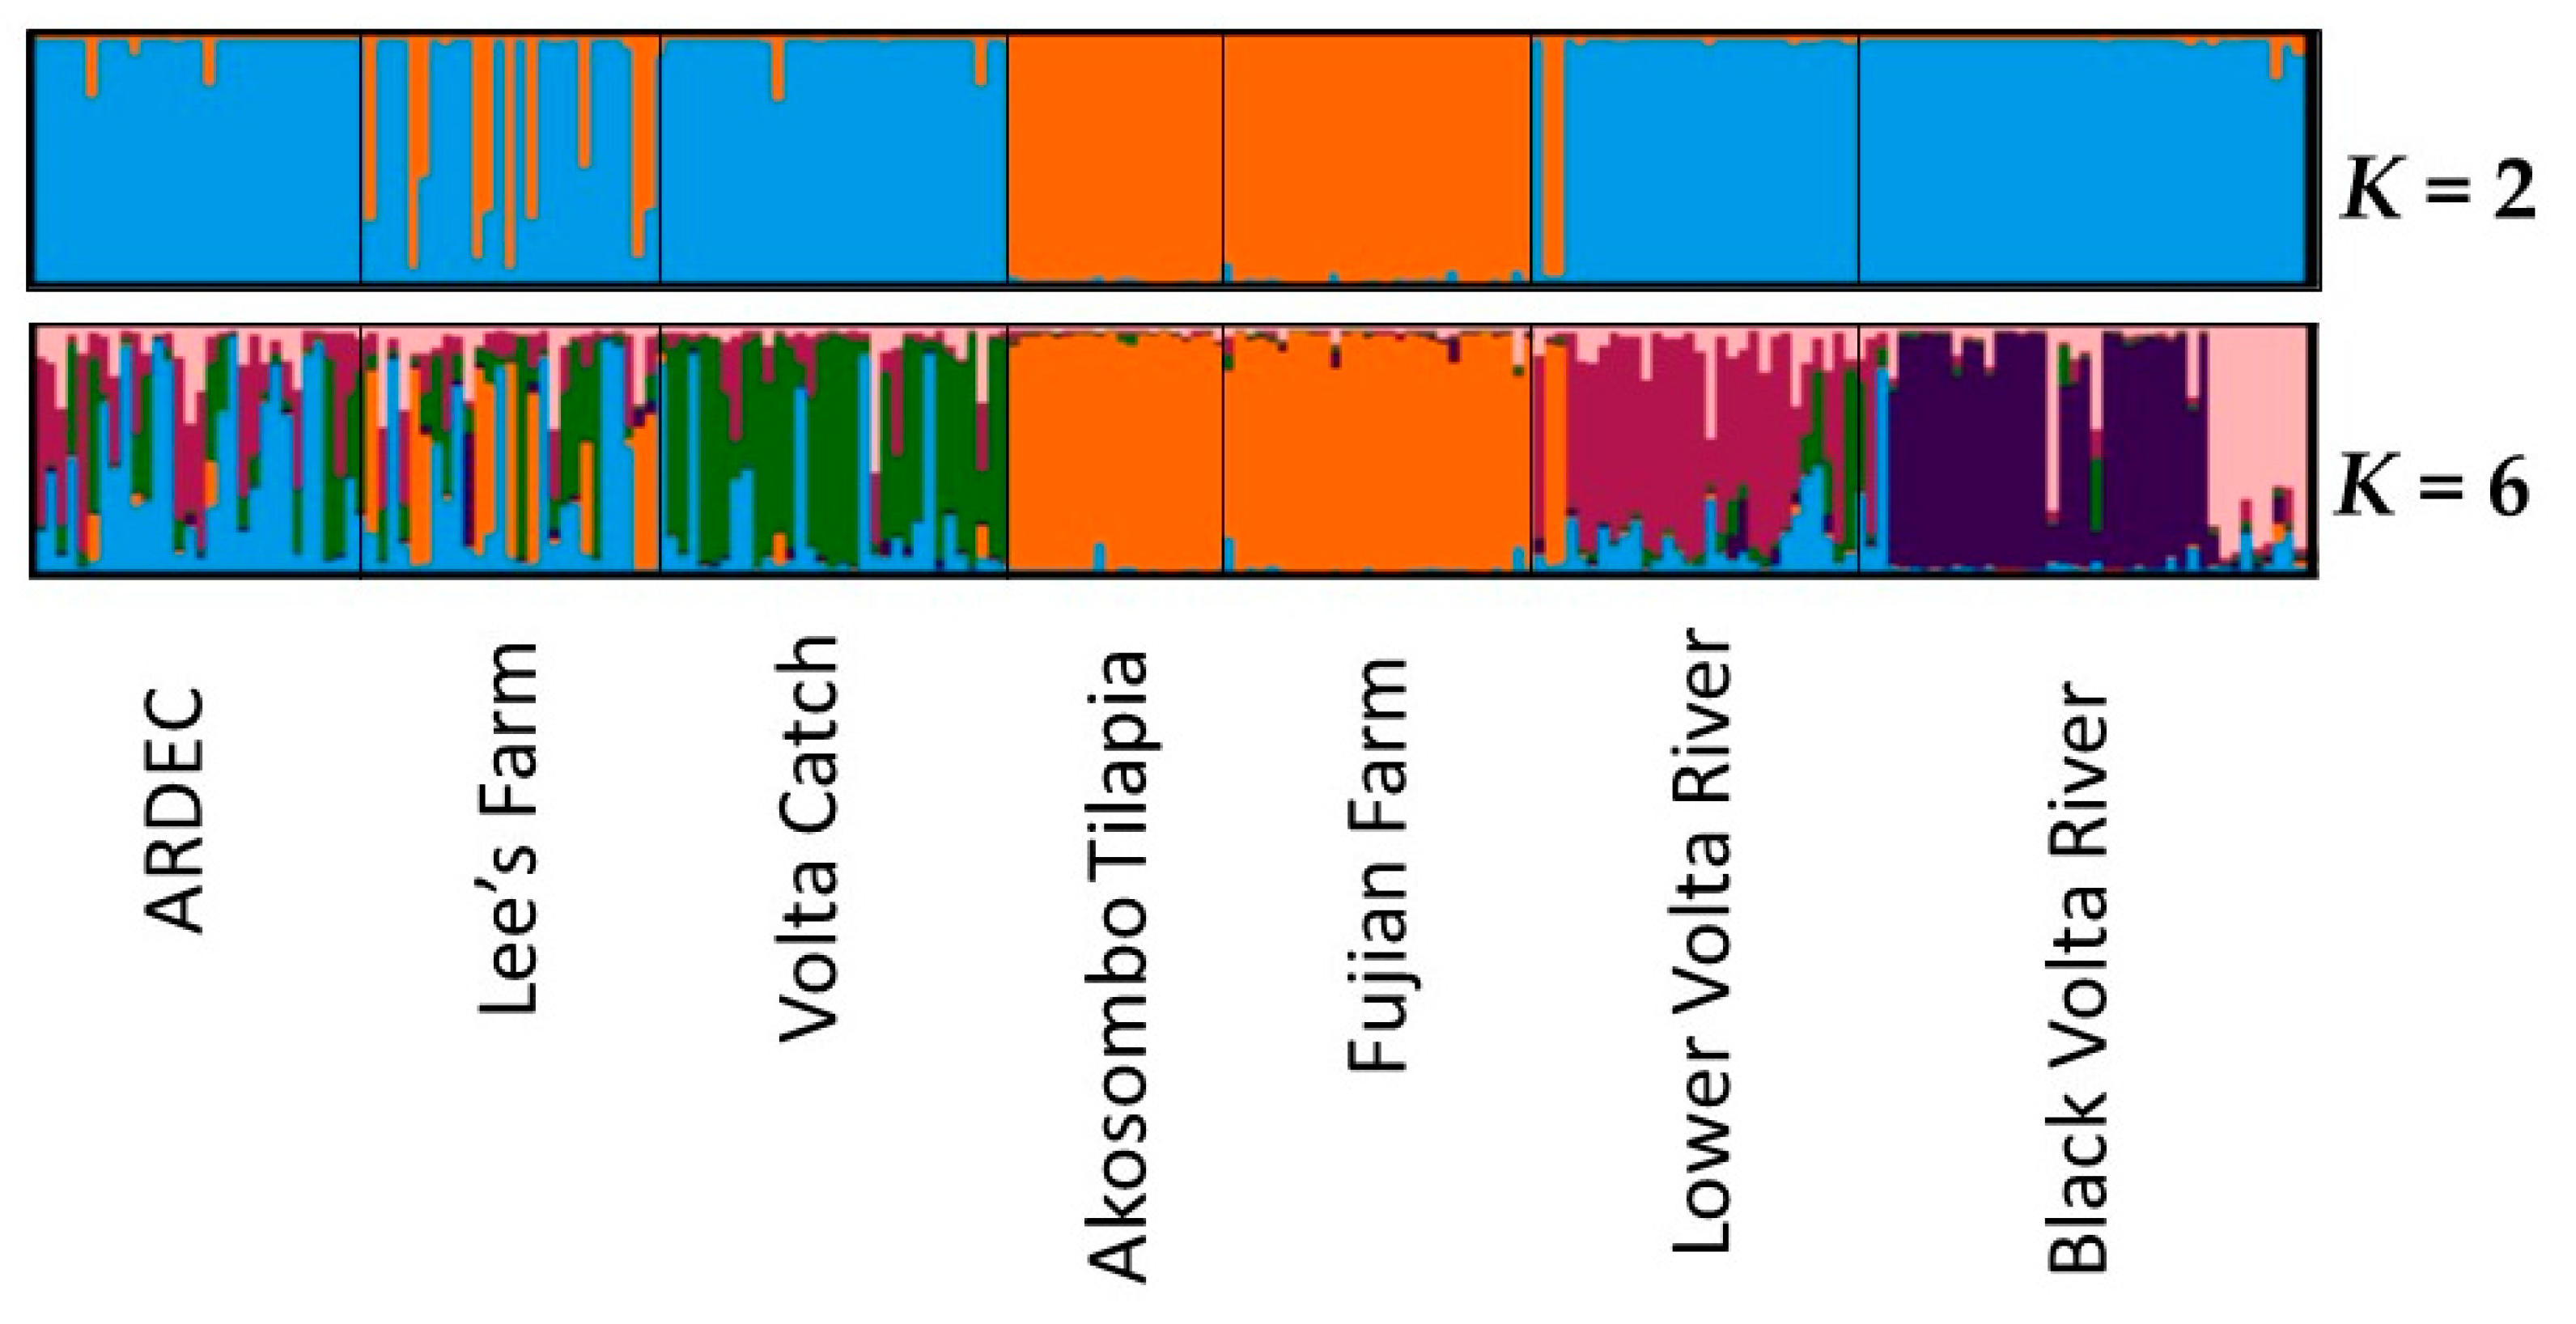
3.3. Genetic Variability in Microsatellite Genotypes

All ten microsatellite loci screened were polymorphic. However, results from Microchecker analysis showed evidence of null alleles at locus UNH925 for several populations. Loci UNH130 and UNH925 consistently showed departure from HWE across all sites, and locus UNH130 showed evidence for segregation of null alleles in some populations. Thus, we excluded data from loci UNH925 and UNH130 from subsequent analysis. Significant departure from HWE was evident in the Akosombo strain (ARDEC) at loci UNH858 and UNH898; Lee’s Farm at UNH180 and UNH858; Volta Catch at UNH180 and UNH898; Fujian Farm at UNH858; Lower Volta River at UNH123, UNH180, and UNH858; and the Black Volta River at all loci except UNH991. We observed significant departures from linkage equilibrium in the Fujian Farm (one pair of loci), Black Volta River (four pairs of loci), and Lee’s Farm (seven pairs of loci) samples after Bonferroni correction.
Table A4 provides the summary statistics calculated to show the variation across the eight loci included in the study. Mean observed and expected heterozygosities were moderate to high across sites, and ranged between 0.60 and 0.80, and 0.64 and 0.80, respectively (Table A4). The Volta Catch, ARDEC, and Black Volta River collections exhibited the lowest, while the Fujian Farm, Akosombo Tilapia Farm, and Lee’s Farm collections showed the highest mean observed and expected heterozygosities. Similarly, numbers of alleles were moderate to high across sites and ranged between 6.63 and 9.75. Volta Catch recorded the lowest number of alleles, while the Lower Volta River, Black Volta River and Fujian Farm populations recorded the highest mean numbers of alleles (> 9.0).
Private alleles were observed in all, but the ARDEC population. The highest number of private alleles was observed in the Fujian Farm stock (N = 7), followed by Akosombo Tilapia Farm (N = 4). The Lee’s Farm and Volta Catch samples had three and two private alleles, respectively. The Fujian Farm and Akosombo Tilapia Farm stocks shared eight infrequent alleles. The two farmed populations also shared a number of infrequent alleles exclusively with either the ARDEC population or with Lee’s Farm population. The Lower Volta River population also shared infrequent alleles with the Fujian and Akosombo Tilapia farm stocks.
Pairwise FST estimates revealed moderate to high genetic differentiation among the farmed and wild populations, which were significantly different from zero (Table A5). In general, the Fujian Farm and Akosombo Tilapia Farm stocks were similar to one another, but differentiated from all the other farmed populations. The least differentiation was observed between Fujian Farm and Akosombo Tilapia Farm (FST = 0.00), while the greatest was between Fujian Farm and Volta Catch (FST = 0.21). The AMOVA also showed high differentiation among populations, with 11% of the variance explained by differences among populations (Table 3). The Fisher’s exact G test and the locus-by-locus FST also showed highly significant differentiation (p < 0.000) across all loci for all sites combined.
Structure analysis using the admixture model and the most probable number of K selected using the Evanno et al. [40] method revealed greatest support for K = 2 clusters within and among the farmed and nearby wild populations analyzed, with high associated probabilities of assignment (Q ranged between 0.95 and 0.99, Figure 4). In general, individuals from Fujian Farm and Akosombo Tilapia Farm grouped into one cluster (shown in orange), while all other farmed populations and the reference to wild populations grouped into another cluster (shown in blue). On the other hand, the LnP(D) values revealed the greatest support for K = 6 clusters (Figure 4, bottom plot). However, two distinct groups were evident within the six clusters. The first group comprised individuals in the ARDEC, Volta Catch, Lee’s Farm, Lower Volta River, and Black Volta River populations, while the second group comprised individuals from the Fujian and Akosombo Tilapia farms. These outcomes suggested hierarchical genetic structuring, with two high-level populations, a native Nile tilapia group and a non-native Nile tilapia group. Two individuals from the Lower Volta River (LV02 and LV03) (N = 33) showed evidence of high levels of admixture and clustered with the non-native tilapia group from Fujian Farm and Akosombo Tilapia Farm (Q = 0.86 and 0.88). In contrast, none of the Black Volta individuals (N = 39) showed evidence of admixture (Q > 0.98). The non-native tilapia group showed no admixture with the native populations. However, the Lee’s Farm stock contained several individuals apparently admixed with the non-native tilapia populations (Q ranged between 0.11 and 0.74). Two individuals, one each in the ARDEC (Akosombo strain) and Volta Catch populations, appeared admixed with the non-native populations (Q = 0.13).

4. Discussion

4.1. Native Versus Non-Native Populations of O. Niloticus in Ghana

The results of the phylogenetic reconstruction presented here suggest the presence of distinct native populations of O. niloticus in Ghana and evidence of the recent introduction of non-native tilapia into the country. The clustering of haplotypes 1 and 2, which contained samples from all wild sites and samples from nearly all farmed sites with private “wild” haplotypes from the Black Volta River; as well as with all the West Africa reference samples clearly shows the presence of distinct O. niloticus populations, which at the mitochondrial marker show no evidence of being impacted by the introduction of non-native tilapia strains. However, the clustering of Ghanaian haplotypes of O. niloticus with O. mossambicus sequences, GenBank sequence Onilo_GIFT, GenBank sequence of O. niloticus × O. mossambicus hybrid, U.S. grocery-store tilapia samples (labeled as originating from China and Ecuador), and the results of the haplotype network analysis support the interpretation that the GIFT strain of O. niloticus or related improved strains are currently present in Ghana.
The clustering of the GenBank sequence Onilo_GIFT with O. mossambicus sequences further suggests that the original GIFT strain included founding O. niloticus populations that had been introgressed with mitochondrial DNA of O. mossambicus in their natural history, i.e., prior to their inclusion in the GIFT baseline population. Thus, the mitochondrial DNA of O. mossambicus present in GIFT tilapia may well derive from O. niloticus from East Africa. The O. niloticus vulcani population from Kenya which was used as a resource for developing the GIFT strain may actually have been an O. mossambicus hybrid population. Eknath et al. [49] reported that O. n. vulcani was genetically distant from the seven other GIFT founding populations examined, including populations from Ghana, Egypt, and Senegal. Such genetic distinction between East African and West African O. niloticus has been observed consistently [17,19,50], and in the present study, it was expected that all West African haplotypes would be distinctly separated from the East African haplotypes.
As expected, the East African O. niloticus sequences were genetically distinct from the pure and hybrid O. niloticus populations discussed above. However, the East African O. niloticus sequences also clustered with some Ghanaian haplotypes distinct from the other Ghanaian haplotypes, O. niloticus × O. mossambicus hybrid, and the U.S. grocery-store tilapia samples. This observation supports the hypothesis that there has been widespread hybridization historically between East African O. niloticus populations and O. mossambicus. The results from the CO1 analysis provided evidence of the ongoing farming of the GIFT and other improved strains in Ghana and supported the findings that the GIFT strains may include hybrid O. niloticus × O. mossambicus background.
The possibility of introgressive hybridization among Oreochromis species has previously been assessed for wild populations. Surveying the phylogeny of 32 Oreochromis species, Ford et al. [51] showed widespread discordance between mitochondrial and nuclear DNA trees; while this discordance could be the result of incomplete lineage sorting or introgression of mitochondrial haplotypes, the authors did not find strong signal for the latter in their study of material collected from the wild. However, our study of cultured O. niloticus could show the signature of introgression because of the known breeding history of the GIFT strain. In another contrasting result, Rognon and Guyomard [50] showed mitochondrial DNA transfer from O. aureus to O. niloticus in West Africa.

4.2. Aquaculture Mediating the Invasion of Non-Native Tilapia Strains

The distribution of haplotypes showed that the GIFT and related strains detected among Ghanaian O. niloticus haplotypes were introduced into the country through aquaculture and were predominantly represented by samples from two farms, Fujian Farm and Akosombo Tilapia Farm. The finding that one of the two haplotypes observed from the Lower Volta River was shared with the Fujian Farm and the Akosombo Tilapia Farm further suggests that those individuals were escapees or descendants of escapees from the two farms or others producing the same strains. The results from the admixture analysis revealed that the non-native tilapias which have escaped into the wild have also bred with local populations, with potentially admixed individuals present on some farms. Introgressive hybridization may impact taxa by genetic swamping when a native form is replaced by hybrids. Surveying the literature, Todesco et al. [52] noted that human involvement is associated with an increased risk of harmful impacts. These findings highlight the potential of aquaculture as a vector in the spread of invasive non-native species and strains [53,54], and underscores the importance of baseline population genetic studies to guide conservation planning for wild tilapia populations.
Both the genetic diversity within and differentiation among the farmed populations clearly showed that two distinct tilapia strains were farmed in Ghana, a native strain and a non-native farmed strain. The highest genetic diversity in terms of expected heterozygosity observed in individuals from Fujian Farm and Akosombo Tilapia Farm (HE = 0.80 and 0.79 respectively), was comparable to what Romana-Eguia et al. [55] observed in the GIFT strain of Nile tilapia (HE = 0.81). Overall, the diversity observed in the ARDEC and Volta Catch populations were similar to those of the wild populations, but significantly lower than the diversity observed in the Lee’s, Akosombo Tilapia, and Fujian farm stocks. The high genetic diversity observed in individuals from Lee’s Farm compared to the ARDEC and Volta Catch populations showed an apparent introduction of new alleles into the Lee’s Farm populations’ gene pool. The genetic variation observed among the wild and farmed populations using microsatellite markers provides further evidence that aquaculture mediated the invasion of the non-native tilapia strains into Ghana and confirmed that the introductions might have included stock from two of the sampled farms, the Fujian and Akosombo Tilapia farms.
The fact that the two farms with the non-native tilapia shared some alleles with the other farmed populations and the observation that admixed individuals occurred in these populations supports the interpretation of interbreeding between native O. niloticus populations and the non-native farmed tilapia populations suggested by their being clustered into the lower-most cluster within the phylogram, shown in Figure 2. Admixture was observed in a few individuals in the ARDEC and Volta Catch populations, which could be due to misclassification errors inherent to assignment tests. However, the presence of admixed individuals within the ARDEC population also could be explained by the possible crossing of the Akosombo strain of O. niloticus with the GIFT strain during recent experimentation with the two strains [13]. Several admixed individuals were found in Lee’s Farm, and the nature of the admixture suggests crossbreeding between non-native farmed tilapia with native O. niloticus either deliberately or accidentally.
The Structure results also showed that two individuals in the Lower Volta River population were admixed. One of the two admixed individuals (LV03) also shared a mitochondrial DNA haplotype with Fujian and Akosombo Tilapia farms, supporting the interpretation that the non-native farmed tilapia females have escaped into the wild and interbred. The other admixed Lower Volta individual (LV02) was not among the 11 individuals selectively screened at the mtDNA D-loop region. The detection of admixed individuals both in farmed and Lower Volta populations necessitates proactive measures to be implemented in a timely fashion to prevent further and routine escapes of the non-native farmed tilapia into the wild.
The lack of evidence of admixed individuals in the Black Volta population support earlier findings from the mtDNA analysis that the escaped non-native farmed tilapia may be restricted to the Lower Volta and possibly adjacent rivers, such as the Afram River within the Volta basin. The Lower Volta River is downstream of aquaculture operations on the Volta Lake, while there are aquaculture facilities in close proximity to the Afram River. On the other hand, the Black Volta is relatively isolated from aquaculture farms, although cage farming in irrigation reservoirs is increasing in the region. Given that admixed individuals are found on multiple farms and the fish escape from farms into the wild is commonplace, restricting the dispersal of non-native tilapia populations into unaffected river basins could be very challenging.
Although we approached this study using classical mitochondrial sequence and nuclear microsatellite markers, the objectives could also have been approached using SNP (single nucleotide polymorphism) markers that cover the entire genome. The genomic approach potentially would allow demonstration of introgression of non-native haplotypes of linked SNPs on particular chromosomal segments into the genomic background of regional O. niloticus populations. While several studies [56,57,58] have established SNP markers for O. niloticus, considerable work is needed to determine the geographic distribution of SNP haplotypes among introduced and native O. niloticus populations. This would require significant baseline research, although the implications of our findings may attract further research investment into the applied population genetics of West African tilapias.

5. Conclusions and Implications

This study was conducted in order to characterize the genetic background of Nile tilapia O. niloticus strains being farmed in Ghana, and to assess the genetic effects of aquaculture on wild populations using selected farms operating on the Volta Lake in Ghana. Our results revealed that two farms were culturing non-native O. niloticus stocks, which were distinct from the native Akosombo strain. The non-native tilapia stocks were identical to several GIFT strains, some of which were introgressed with O. mossambicus. We also found that the non-native tilapias have escaped into the wild and interbred with local populations, with potentially admixed individuals present on some farms. Within the Volta basin, it appears that the escaped GIFT populations are restricted to the lower part of the Volta River and suggests that upstream populations in the Black Volta River and possibly the White Volta River and the Oti River are not currently impacted by the GIFT strain. Given these findings, we suggest that aquaculture operations in the Volta River basin be restricted to the production of the strain derived from native genetic resources and that more effective physical confinement and operations management measures be required.
Furthermore, the possibility that the Akosombo strain disseminated by ARDEC is introgressed with the GIFT strain should be investigated as a matter of urgency because of the potential to spread Akosombo strain and GIFT-strain hybrids to other farms. In the meantime, the two farms in the Volta basin currently known to contain the improved O. niloticus strains should be required to produce native strains and practice strict confinement measures to prevent further escapes or intentional spread to other farms. The broader implication of the findings presented here is the possibility of the spread of GIFT strains to neighboring countries through the Volta River and other shared basins, such as the Tano. In light of the results of this study, it is imperative that larger-scale baseline population genetic studies—with more samples collected at a larger number of locations—be conducted for all neighboring countries and a broader set of farms in all countries, including Ghana, to provide data for the conservation of pure populations of O. niloticus in the region.

Author Contributions

Conceptualization, G.A.-T., E.A.F., and E.H., methodology, G.A.-T., E.A.F., and E.H.; application of software, G.A.-T.; formal analysis, G.A.-T.; validation, G.A.-T., E.A.F., and E.H.; investigation, G.A.-T.; resources, G.A.-T., E.A.F., and E.H.; data curation, G.A.-T.; writing—original draft preparation, G.A.-T.; writing—review and editing, G.A.-T., E.A.F., and E.H.; visualization, G.A.-T., E.A.F., and E.H.; supervision, E.A.F., and E.H.; project administration, G.A.-T., E.A.F., and E.H.; funding acquisition, G.A.-T., and E.A.F.

Funding

This research was funded by the AquaFish Innovation Lab, supported by the U.S. Agency for International Development (USAID) award number CA/LWA EPP-A-00-06-0012-00 and Rufford Foundation (UK), grant number 22083-1. G.A. was supported in part by the Global Change Center (Virginia Tech Graduate School); Aquaculture Association of Ghana; Raanan Fish Feed, Ghana; Consulting in Aquaculture Research and Training for Development (CART4D); and the Burd Sheldon McGinnes Graduate Fellowship through the Department of Fish and Wildlife Conservation, Virginia Tech. Publication charges for this article was paid by Virginia Tech’s Open Access Subvention Fund.

Acknowledgments

We thank all the fishers, fish farmers, local guides, and the Fisheries Commission, Ghana, who collaborated on this project. We are grateful to the following individuals for their immense support in the fieldwork in Ghana: Nathaniel Gyasi Adjei, Francis Adjei, Suzette Emefa Sey and Doris Yeboah Baah. Miluska Olivera-Hyde, Sheila Harris, and Clay Ferguson of Virginia Tech assisted with laboratory work. Jess Jones and Donald Orth reviewed earlier versions of the manuscript and provided useful feedback.

Conflicts of Interest

The authors declare no conflict of interest, except as may arise through the funding relationships described above.

Appendix A. Materials and Methods

For mitochondrial DNA sequencing, the 22-µL PCR amplification reactions consisted of 50–100 ng of genomic DNA, 5 U/µL Taq DNA polymerase (Promega, Madison, WI, USA), 5 × PCR buffer, 25 mM MgCl2, 2.5 mM dNTP mix, 5 µM bovine serum albumin, and 5 µM of primers. The CO1 amplification reaction used 10 µM of primers. The following thermal cycling conditions were used for both D-loop and CO1: 94 °C for 3 min; 35 cycles of 94 °C for 40 s, 52 °C for 30 s, and 72 °C for 1 min; a final extension of 72 °C for 5 min; and a 4 °C hold.
For microsatellite DNA amplification, the 11-µL PCR amplification reactions consisted of 50–100 ng of genomic DNA, 5 U/µL Taq DNA polymerase (Promega, Madison, WI, USA), 5 × PCR buffer, 25 mM MgCl2, 2.5 mM dNTP mix, 5 µM bovine serum albumin, and 5 µM of primers. Forward primers were fluorescently labeled by Applied Biosystems (USA). All microsatellite markers were amplified as singleplexes, with the exception of UNH130 and UNH858, which were multiplexed. We used the following thermal cycling conditions: 94 °C for 3 min; 35 cycles of 94 °C for 40 s, 54–58 °C depending on marker for 30 s, and 72 °C for 1 min; a final extension of 72 °C for 5 min; and a 4 °C hold.
Table A1. Sample sizes (N) for mitochondrial DNA (mtDNA) analysis and frequency distribution of D-loop haplotypes across all sampling sites.
Population (N)
Black Volta RiverLower Volta RiverARDECLee’s FarmVolta CatchAkosombo TilapiaFujian Farm
HaplotypeN(16)(11)(10)(10)(8)(5)(9)
Dloop Hap12346336 1
Dloop Hap29135
Dloop Hap31 1
Dloop Hap43 1 11
Dloop Hap53 12
Dloop Hap61 1
Dloop Hap71 1
Dloop Hap82 11
Dloop Hap93 3
Dloop Hap101 1
Dloop Hap111 1
Dloop Hap121 1
Dloop Hap132 11
Dloop Hap141 1
Dloop Hap151 1
Dloop Hap161 1
Dloop Hap1733
Dloop Hap1811
Dloop Hap1911
Dloop Hap2011
Dloop Hap2111
Dloop Hap2222
Dloop Hap2322
Dloop Hap241 1
Dloop Hap251 1
Dloop Hap261 1
Dloop Hap271 1
Table A2. Variable nucleotide sites for Oreochromis spp. haplotypes at the mitochondrial D-loop region and the reference sequences used for the phylogenetic analysis. Alignment gaps are indicated by “-”. Nucleotides identical to those in the first sequence are indicated with a dot. Bases highlighted in orange and blue indicate nucleotide differences at variable sites within the non-native tilapia cluster. Sequences from GenBank are indicated with *.
Diversity 11 00188 i001
Table A3. Tamura-3 parameter pairwise nucleotide distances between haplotypes 1 at the mitochondrial D-loop region for Ghanaian Oreochromis spp. Representative samples for the haplotypes are in parentheses.
Hap1Hap2Hap5Hap9Hap17Hap10Hap11Hap14Hap16Hap27Hap3Hap4Hap13Hap15Hap26
Hap1 (LVOLTA)0.000
Hap2 (ARDEC)0.0080.001
Hap5 (LVOLTA)0.0110.0030.000
Hap9 (LFARM)0.0030.0110.0140.000
Hap17 (BVOLTA)0.0110.0140.0170.0140.000
Hap10 (FFARM)0.1520.1480.1520.1480.160N = 1
Hap11 (FFARM)0.1520.1480.1520.1560.1600.042N = 1
Hap14 (FFARM)0.1410.1370.1410.1450.1490.0220.019N = 1
Hap16 (FFARM)0.1440.1400.1440.1480.1520.0110.0420.028N = 1
Hap27 (AKTIL)0.1480.1440.1480.1520.1560.0080.0450.0250.003N = 1
Hap3 (LVOLTA)0.1340.1430.1470.1380.1340.1380.1310.1240.1340.137N = 1
Hap4 (LVOLTA)0.1340.1430.1470.1380.1340.1340.1270.1200.1330.1370.0080.000
Hap13 (FFARM)0.1340.1430.1470.1380.1340.1340.1270.1200.1330.1370.0030.0050.000
Hap15 (FFARM)0.1460.1500.1540.1500.1420.1450.1380.1310.1450.1490.0220.0140.019N = 1
Hap26 (AKTIL)0.1300.1380.1430.1340.1300.1380.1310.1230.1370.1410.0050.0080.0030.019N = 1
1 The “O. niloticus” cluster is represented by haplotypes 1, 2, 5, 9, and 17; the “O. mossambicus” cluster is represented by haplotypes 10, 11, 14, 16, and 27; and the “O. niloticus introgressed with O. mossambicus” cluster by haplotypes 3, 4, 13, 15, and 26. LVOLTA = Lower Volta River, ARDEC = Aquaculture Research and Development Centre, LFARM = Lee’s Farm, BVOLTA = Black Volta River, FFARM = Fujian Farm, and AKTIL = Akosombo Tilapia Farm. Analyses were conducted using the Tamura 3-parameter model. The rate variation among sites was modeled with a gamma distribution (shape parameter = 1). Positions containing gaps and missing data were eliminated. Interspecific distances were not calculated for haplotypes with only one sample and are indicated with N = 1.
Table A4. Genetic variation among eight microsatellite DNA loci examined in farmed and wild tilapia populations 1 from seven sites collected in Ghana from March to July 2017. N = number of individuals genotyped per population, HO = observed heterozygosity, HE = expected heterozygosity, A = number of observed alleles per locus, and PHWE = Probability of Hardy-Weinberg equilibrium. NS = non-significant test result. * p < 0.05.
LocusPopulations (N)
AD (30)LE (32)VC (29)AT (19)FF (30)LV (33)BV (39)
UNH123HE0.760.790.840.840.850.740.78
HO0.900.880.890.890.800.580.69
A10.009.0010.0011.0011.0010.0011.00
PHWENSNSNSNSNS**
UNH178HE0.830.770.850.680.510.810.77
HO0.800.810.930.890.570.820.54
A810868910
PHWENSNSNSNSNSNS*
UNH180HE0.580.650.470.760.770.530.72
HO0.400.610.310.630.630.480.69
A4565776
PHWENS**NSNS**
UNH203HE0.690.700.520.830.820.680.40
HO0.600.750.620.680.670.670.28
A4537843
PHWENSNSNSNSNSNS*
UNH858HE0.850.880.680.870.870.900.83
HO0.830.810.660.890.730.970.74
A9111010121516
PHWE**NSNS***
UNH898HE0.750.750.700.860.860.830.80
HO0.470.690.480.950.800.730.59
A1011613131412
PHWE*NS*NSNSNS*
UNH934HE0.360.600.420.690.730.700.63
HO0.370.690.450.530.670.670.54
A575461010
PHWENSNSNSNSNSNS*
UNH991HE0.620.730.620.880.880.550.72
HO0.670.780.550.950.870.580.72
A565101096
PHWENSNSNSNSNSNSNS
Mean ± SDHE0.68 ± 0.150.73 ± 0.080.64 ± 0.150.80 ± 0.080.79 ± 0.120.72 ± 0.120.71 ± 0.13
HO0.63 ± 0.190.75 ± 0.080.61 ± 0.200.80 ± 0.150.72 ± 0.090.69 ± 0.140.60 ± 0.14
A6.88 ± 2.478.00 ± 2.406.63 ± 2.348.25 ± 2.999.38 ± 2.349.75 ± 3.319.25 ± 3.83
1 AD = ARDEC, LE = Lee’s Farm, VC = Volta Catch, AT = Akosombo Tilapia Farm, and FF = Fujian Farm, LV = Lower Volta, and BV = Black Volta.
Table A5. Pairwise FST values from nuclear microsatellite DNA sequences for farmed and wild O. niloticus populations sampled from the Lower Volta River, the Black Volta tributary of the Volta Lake and five cage farms located on the Volta Lake in Ghana in 2017. AD = ARDEC, LE = Lee’s Farm, VC = Volta Catch, AT = Akosombo Tilapia Farm, and FF = Fujian Farm, LV = Lower Volta, and BV = Black Volta.
ADLEVCATFFLVBV
AD
LE0.028
VC0.0450.043
AT0.1760.1180.195
FF0.1880.1180.2070.002 NS
LV0.0240.0390.0690.1530.155
BV0.1020.0880.1010.1860.1880.091
NS = non-significant test result (p > 0.05). All other values are significant.

References

  1. De Silva, S.S.; Subasinghe, R.P.; Bartley, D.M.; Lowther, A. Tilapias as Alien Aquatics in Asia and the Pacific: A Review; Food and Agriculture Organization: Rome, Italy, 2004; Volume 453. [Google Scholar]
  2. Eknath, A.E.; Hulata, G. Use and exchange of genetic resources of Nile tilapia (Oreochromis niloticus). Rev. Aquac. 2009, 1, 197–213. [Google Scholar] [CrossRef]
  3. Ordoñez, J.F.F.; Ventolero, M.F.H.; Santos, M.D. Maternal mismatches in farmed tilapia strains (Oreochromis spp.) in the Philippines as revealed by mitochondrial COI gene. Mitochondrial DNA Part A 2017, 28, 526–535. [Google Scholar] [CrossRef] [PubMed]
  4. Ponzoni, R.W.; Nguyen, N.H.; Khaw, H.L.; Hamzah, A.; Bakar, K.R.A.; Yee, H.Y. Genetic improvement of Nile tilapia (Oreochromis niloticus) with special reference to the work conducted by the WorldFish Center with the GIFT strain. Rev. Aquac. 2011, 3, 27–41. [Google Scholar] [CrossRef]
  5. Eknath, A.E.; Tayamen, M.M.; Palada-de Vera, M.S.; Danting, J.C.; Reyes, R.A.; Dionisio, E.E.; Capili, J.B.; Bolivar, H.L.; Abella, T.A.; Circa, A.V.; et al. Genetic improvement of farmed tilapias: The growth performance of eight strains of Oreochromis niloticus tested in different farm environments. Aquaculture 1993, 111, 171–188. [Google Scholar] [CrossRef]
  6. Eknath, A.E.; Dey, M.M.; Rye, M.; Gjerde, B.; Abella, T.A.; Sevilleja, R.; Tayamen, M.M.; Reyes, R.A.; Bentsen, H.B. Selective breeding of Nile tilapia for Asia. In Proceedings of the 6th World Congress of Genetics Applied to Livestock Production, Armidale, Australia, 11–16 January 1998; ICLARM Contribution No. 1397. International Center for Living Aquatic Resources Management: Manila, The Philippines, 1998. [Google Scholar]
  7. Dey, M.M. The impact of genetically improved farmed Nile tilapia in Asia. Aquac. Econ. Manag. 2000, 4, 107–124. [Google Scholar] [CrossRef]
  8. Eknath, A.E.; Bentsen, H.B.; Ponzoni, R.W.; Rye, M.; Nguyen, N.H.; Thodesen, J.; Gjerde, B. Genetic improvement of farmed tilapias: Composition and genetic parameters of a synthetic base population of Oreochromis niloticus for selective breeding. Aquaculture 2007, 273, 1–14. [Google Scholar] [CrossRef]
  9. Gupta, M.V.; Acosta, B.O. From drawing board to dining table: The success story of the GIFT project. NAGA World Fish Center Q. 2004, 27, 4–14. [Google Scholar]
  10. Attipoe, F.Y.; Blay Jnr, J.; Agyakwah, S.; Ponzoni, R.W.; Khaw, H.L.; Abban, E.K. Genetic parameters and response to selection in the development of Akosombo strain of the Nile tilapia (Oreochromis niloticus) in the Volta Basin, Ghana. In Proceedings of the International Symposium on Tilapia in Aquaculture, Jerusalem, Palestine, 6–10 October 2013. [Google Scholar]
  11. Dewedar, R. Fast-Growing Fish Variety Could Benefit Egypt and West Africa. The Science and Development Network. Available online: http://www.scidev.net/en/agriculture-and-environment/fisheries/news/fast-growing-fish-variety-could-benefit-egypt-and-west-africa-.html (accessed on 4 November 2016).
  12. Mireku, K.K.; Kassam, D.; Changadeya, W.; Attipoe, F.Y.K.; Adinortey, C.A. Assessment of genetic variations of Nile Tilapia (Oreochromis niloticus L.) in the Volta Lake of Ghana using microsatellite markers. Afr. J. Biotechnol. 2017, 16, 312–321. [Google Scholar] [CrossRef]
  13. Ansah, Y.B.; Frimpong, E.A.; Hallerman, E.M. Genetically-improved tilapia strains in Africa: Potential benefits and negative impacts. Sustainability 2014, 6, 3697–3721. [Google Scholar] [CrossRef]
  14. Rognon, X.; Andriamanga, M.; McAndrew, B.; Guyomard, R. Allozyme variation in natural and cultured populations in two tilapia species: Oreochromis niloticus and Tilapia zillii. Heredity 1996, 76, 640–650. [Google Scholar] [CrossRef]
  15. Bezault, E.; Balaresque, P.; Toguyeni, A.; Fermon, A.; Araki, H.; Baroiller, J.-F.; Rognon, X. Spatial and temporal variation in population genetic structure of wild Nile tilapia (Oreochromis niloticus) across Africa. BMC Genet. 2011, 12, 102. [Google Scholar] [CrossRef] [PubMed]
  16. Falk, T.M.; Abban, E.K. Genetic diversity of the Nile tilapia Oreochromis niloticus (Teleostei, Cichlidae) from the Volta System in Ghana. In Biodiversity, Management and Utilization of West African Fishes, WorldFish Center Conference Proceedings; Abban, E.K., Casal, C.M.V., Dugan, P., Falk, T.M., Eds.; WorldFish Center: Penang, Malaysia, 2004; pp. 13–15. [Google Scholar]
  17. Agnèse, J.-F.; Adepo-Gourene, B.; Abban, E.K.; Fermon, Y. Genetic differentiation among natural populations of the Nile tilapia Oreochromis niloticus (Teleostei, Cichlidae). Heredity 1997, 79, 89–96. [Google Scholar] [CrossRef] [PubMed]
  18. Ward, R.D.; Hanner, R.; Hebert, P.D. The campaign to DNA barcode all fishes, FISH-BOL. J. Fish Biol. 2009, 74, 329–356. [Google Scholar] [CrossRef] [PubMed]
  19. Nyingi, D.; De Vos, L.; Aman, R.; Agnèse, J.-F. Genetic characterization of an unknown and endangered native population of the Nile tilapia Oreochromis niloticus (Linnaeus, 1758) (Cichlidae; Teleostei) in the Loboi Swamp (Kenya). Aquaculture 2009, 297, 57–63. [Google Scholar] [CrossRef]
  20. Ivanova, N.V.; Zemlak, T.S.; Hanner, R.H.; Hebert, P.D.N. Universal primer cocktails for fish DNA barcoding. Mol. Ecol. Notes 2007, 7, 544–548. [Google Scholar] [CrossRef]
  21. Larkin, M.A.; Blackshields, G.; Brown, N.P.; Chenna, R.; McGettigan, P.A.; McWilliam, H.; Valentin, F.; Wallace, I.M.; Wilm, A.; Lopez, R.; et al. Clustal W and Clustal X version 2.0. Bioinformatics 2007, 23, 2947–2948. [Google Scholar] [CrossRef] [Green Version]
  22. Kumar, S.; Stecher, G.; Tamura, K. MEGA7: Molecular Evolutionary Genetics Analysis version 7.0 for bigger datasets. Mol. Biol. Evol. 2016, 33, 1870–1874. [Google Scholar] [CrossRef]
  23. Rozas, J.; Ferrer-Mata, A.; Sanchez-DelBarrio, J.C.; Guirao-Rico, S.; Librado, P.; Ramos-Onsins, S.E.; Sanchez-Gracia, A. DnaSP 6: DNA sequence polymorphism analysis of large datasets. Mol. Biol. Evol. 2017, 34, 3299–3302. [Google Scholar] [CrossRef]
  24. Altschul, S.F.; Gish, W.; Miller, W.; Myers, E.W.; Lipman, D.J. Basic local alignment search tool. J. Mol. Biol. 1990, 215, 403–410. [Google Scholar] [CrossRef]
  25. Nylander, J.A.A. MrModeltest 2.3. Program Distributed by the Author. Evolutionary Biology Centre, Uppsala University. Available online: https://github.com/nylander/MrModeltest2 (accessed on 6 June 2018).
  26. Swafford, D.L. PAUP; Version 4.0; Sinauer Associates, Inc.: Sunderland, MA, USA, 2002. [Google Scholar]
  27. Ronquist, F.; Teslenko, M.; van der Mark, P.; Ayres, D.L.; Darling, A.; Höhna, S.; Larget, B.; Liu, L.; Suchard, M.A.; Huelsenbeck, J.P. MrBayes 3.2: Efficient Bayesian phylogenetic inference and model choice across a large model space. Syst. Biol. 2012, 61, 539–542. [Google Scholar] [CrossRef]
  28. Rambaut, A. Figtree. Tree Figure Drawing Tool. Version 1.4.2. Available online: http://tree.bio.ed.ac.uk/software/figtree (accessed on 6 June 2018).
  29. Templeton, A.R.; Crandall, K.A.; Sing, C.F. A cladistic analysis of phenotypic associations with haplotypes inferred from restriction endonuclease mapping and DNA sequence data. III. Cladogram estimation. Genetics 1992, 132, 619–633. [Google Scholar] [PubMed]
  30. Clement, M.; Snell, Q.; Walker, P.; Posada, D.; Crandall, K. TCS: Estimating gene Genealogies. In Proceedings of the 16th International Parallel and Distributed Processing Symposium (IPDPS 2002), Fort Lauderdale, FL, USA, 15–19 April 2002; p. 184. [Google Scholar]
  31. Carleton, K.L.; Streelman, J.T.; Lee, B.-Y.; Garnhart, N.; Kidd, M.; Kocher, T.D. Rapid isolation of CA microsatellites from the tilapia genome. Anim. Genet. 2002, 33, 140–144. [Google Scholar] [CrossRef] [PubMed] [Green Version]
  32. Streelman, J.T.; Kocher, T.D. Microsatellite variation associated with prolactin expression and growth of salt-challenged tilapia. Physiol. Genom. 2002, 9, 1–4. [Google Scholar] [CrossRef] [PubMed] [Green Version]
  33. Cnaani, A.; Hallerman, E.M.; Ron, M.; Weller, J.I.; Kashi, Y.; Gall, G.A.E.; Hulata, G. A chromosomal region with quantitative trait loci affecting cold tolerance and fish size in an F2 tilapia hybrid. Aquaculture 2003, 223, 117–128. [Google Scholar] [CrossRef]
  34. Frimpong, E.A.; Amisah, S.; Anane-Taabeah, G.; Ampofo-Yeboah, A. Identifying Local Strains of Oreochromis Niloticus that Are Adapted to Future Climate Conditions; Report Submitted to United States Agency for International Development (USAID); Aquaculture Innovation Lab, Oregon State University: Corvallis, OR, USA, 2016; p. 32. [Google Scholar]
  35. Van Oosterhout, C.; Hutchinson, W.F.; Willis, D.P.M.; Shipley, P. Microchecker: Software for identifying and correcting genotyping errors in microsatellite data. Mol. Ecol. Notes 2004, 4, 535–538. [Google Scholar] [CrossRef]
  36. Sokal, R.R.; Rohlf, F.J. Biometry: The Principles and Practice of Statistics in Biological Research, 3rd ed.; W.H. Freeman: New York, NY, USA, 1994. [Google Scholar]
  37. Excoffier, L.; Laval, G.; Schneider, S. ARLEQUIN, version 3.0: An integrated software package for population genetics data analysis. Evol. Bioinform. 2005, 1, 47–50. [Google Scholar] [CrossRef]
  38. Guo, S.; Thompson, E. Performing the exact test of Hardy–Weinberg proportion for multiple alleles. Biometrics 1992, 48, 361–372. [Google Scholar] [CrossRef]
  39. Slatkin, M.; Excoffier, L. Testing for linkage disequilibrium in genotypic data using the EM algorithm. Heredity 1996, 76, 377–383. [Google Scholar] [CrossRef]
  40. Rice, W.R. Analyzing tables of statistical tests. Evolution 1989, 43, 223–225. [Google Scholar] [CrossRef]
  41. Wright, S. Evolution and the Genetics of Populations, Vol. 4, Variability Within and Among Natural Populations; University of Chicago Press: Chicago, IL, USA, 1978. [Google Scholar]
  42. Raymond, M.; Rousset, F. GENEPOP (version 1.2): Population genetics software for exact tests and ecumenicism. J. Hered. 1995, 86, 248–249. [Google Scholar] [CrossRef]
  43. Pritchard, J.K.; Stephens, M.; Donnelly, P. Inference of population structure using multilocus genotype data. Genetics 2000, 155, 945–959. [Google Scholar] [PubMed]
  44. Falush, D.; Stephens, M.; Pritchard, J.K. Inference of population structure using multilocus genotype data: Linked loci and correlated allele frequencies. Genetics 2003, 164, 1567–1587. [Google Scholar] [PubMed]
  45. Evanno, G.; Regnaut, S.; Goudet, J. Detecting the number of clusters of individuals using the software structure: A simulation study. Mol. Ecol. 2005, 14, 2611–2620. [Google Scholar] [CrossRef]
  46. Earl, D.A.; von Holdt, B.M. STRUCTURE HARVESTER: A website and program for visualizing STRUCTURE output and implementing the Evanno method. Conserv. Genet. Resour. 2012, 4, 359–361. [Google Scholar] [CrossRef]
  47. Kopelman, N.M.; Mayzel, J.; Jakobsson, M.; Rosenberg, N.A.; Mayrose, I. Clumpak: A program for identifying clustering modes and packaging population structure inferences across K. Mol. Ecol. Resour. 2015, 15, 1179–1191. [Google Scholar] [CrossRef]
  48. Falk, T.M.; Teugels, G.G.; Abban, E.D.; Villwock, W.; Renwrantz, L. Phylogeographic patterns in populations of the black-chinned tilapia complex (Teleostei, Cichlidae) from coastal areas in West Africa: Support for the refuge zone theory. Mol. Phylogenet. Evol. 2003, 27, 81–92. [Google Scholar] [CrossRef]
  49. Eknath, A.E.; Macaranas, J.M.; Agustin, L.Q.; Velasco, R.R.; Ablan, M.C.A.; Pante, M.J.R.; Pullin, R.S.V. Biochemical and morphometric approaches to characterize farmed tilapias. NAGA 1991, 14, 7–9. [Google Scholar]
  50. Rognon, X.; Guyomard, R. Large extent of mitochondrial DNA transfer from Oreochromis aureus to O. niloticus in West Africa. Mol. Ecol. 2003, 12, 435–445. [Google Scholar] [CrossRef] [PubMed]
  51. Ford, A.G.; Bullen, T.R.; Pang, L.; Genner, M.J.; Bills, R.; Flouri, T.; Ngatunga, B.P.; Rüber, L.; Schliewen, U.K.; Seehausen, O.; et al. Molecular phylogeny of Oreochromis (Cichlidae: Oreochromini) reveals mito-nuclear discordance and multiple colonisation of adverse aquatic environments. Mol. Phylogenet. Evol. 2019, 136, 215–226. [Google Scholar] [CrossRef]
  52. Todesco, M.; Pascual, M.A.; Owens, G.L.; Ostevik, K.L.; Moyers, B.T.; Hübner, S.; Heredia, S.M.; Hahn, M.A.; Caseys, C.; Bock, D.G.; et al. Hybridization and extinction. Evol. Appl. 2016, 9, 892–908. [Google Scholar] [CrossRef]
  53. Ndiwa, T.C.; Nyingi, D.W.; Agnèse, J.-F. An important natural genetic resource of Oreochromis niloticus (Linnaeus, 1758) threatened by aquaculture activities in Loboi Drainage, Kenya. PLoS ONE 2014, 9, e106972. [Google Scholar] [CrossRef] [PubMed]
  54. Shechonge, A.; Ngatunga, B.P.; Bradbeer, S.J.; Day, J.J.; Ford, A.G.P.; Kihedu, J.; Richmond, T.; Mzighani, S.; Smith, A.M.; Sweke, E.A.; et al. Widespread colonisation of Tanzanian catchments by introduced Oreochromis tilapia fishes: The legacy from decades of deliberate introduction. Hydrobiologia 2019, 832, 235–253. [Google Scholar] [CrossRef] [PubMed]
  55. Romana-Eguia, M.R.R.; Ikeda, M.; Basiao, Z.U.; Taniguchi, N. Genetic diversity in farmed Asian Nile and red hybrid tilapia stocks evaluated from microsatellite and mitochondrial DNA analysis. Aquaculture 2004, 236, 131–150. [Google Scholar] [CrossRef]
  56. Van Bers, N.E.M.; Crooijmans, R.P.M.A.; Dibbits, B.W.; Komen, J.; Groenen, M.A.M. SNP marker detection and genotyping in tilapia. Mol. Ecol. Resour. 2012, 12, 932–941. [Google Scholar] [CrossRef] [PubMed]
  57. Xia, J.H.; Wan, Z.Y.; Ng, Z.L.; Wang, L.; Fu, G.H.; Liu, G.; Liu, F.; Yue, G.H. Genome-wide discovery and in-silico mapping of gene-associated SNPs in Nile tilapia. Aquaculture 2014, 432, 67–73. [Google Scholar] [CrossRef]
  58. Delomas, T.A.; Gomelsky, B.; Vu, N.; Campbell, M.R.; Novelo, N.D. Single-nucleotide polymorphism discovery and genetic variation in YY-male and mixed-sex strains of Nile tilapia available in the United States. N. Am. J. Aquac. 2019, 81, 183–188. [Google Scholar] [CrossRef]
Figure 1. Sampling locations for wild and farmed Oreochromis spp. collected in Ghana at nine sites from the Lower Volta River (downstream of the lake) and the Black Volta tributary upstream of the lake (three locations comprising the Black Volta river site in Table 1 shown separately here) and five aquaculture facilities from March 2017 through July 2017. Sampling sites are indicated with red triangles. The cluster of five aquaculture facilities (and their approximate location) is indicated with the green circle. LFARM = Lee’s Farm, ARDEC = Aquaculture Research and Development Centre, VC = Volta Catch, AKTIL = Akosombo Tilapia Farm, FFARM = Fujian Farm.
Diversity 11 00188 g001
Figure 2. Phylogenetic tree constructed from 391-bp D-loop consensus haplotype sequences for Oreochromis spp. using Bayesian analysis showing the inferred origins of haplotypes. Population designators: BV = Black Volta, LV = Lower Volta, ARDEC = Aquaculture Research and Development Centre, LFARM = Lee’s Farm, FFARM = Fujian Farm, VC = Volta Catch, AKTIL = Akosombo Tilapia Farm. The “Native tilapia” cluster contains mitochondrial haplotypes characteristic of West Africa, the “Non-native tilapia” cluster contains haplotypes from O. mossambicus that are derived from pure O. mossambicus, East African O. niloticus, and introduced O. niloticus strains cultured in Ghana. Reference groups are highlighted in blue. Farmed and wild samples collected from Ghana, which clustered with the non-native tilapia group are highlighted in red. Posterior support values are indicated to the left of each node. The tree was rooted using a D-loop sequence for Coptodon zillii. All photos are from this study.
Diversity 11 00188 g002
Figure 3. TCS network of six farmed tilapia mitochondrial haplotypes from Ghana (white shading), and the GIFT and related strains of O. niloticus (gray shading) observed among 315 bp of the mitochondrial CO1 gene sequence. Native haplotypes are indicated in the blue oval, and non-native haplotypes are indicated in the red oval. Three sequences; Onilo_GIFT, Onilo_Egypt, and Onilo_Philippines used in the D-loop phylogenetic analysis are included as reference samples. One sequence of O. mossambicus from GenBank (accession number KU565829) is included as a reference sample to show the dissimilarity between O. niloticus, O. mossambicus, and the genetically improved strains.
Diversity 11 00188 g003
Figure 4. Structure results showing the proportion of each farmed and reference tilapia individual’s ancestry that was inferred to come from each of K = 2 (top plot) or K = 6 (bottom plot) clusters (Markov Chain Monte Carlo generations = 500,000). Populations are indicated on the x-axis.
Diversity 11 00188 g004
Table 1. Sample and site information for Oreochromis spp. collected in Ghana from March 2017 to July 2017 and sample sizes for nuclear and mitochondrial DNA (mtDNA) analyses.
Site NameSampling LocationSourceNuclear DNA (N)mtDNA (N)
Black Volta RiverKantu **Wild3916
Lower Volta RiverNotreku-AkuseWild3311
ARDEC *AkosomboFarm3010
Lee’s FarmAkosomboFarm3210
Volta CatchAsokwa-KumasiFarm298
Akosombo TilapiaAshaimanFarm195
Fujian FarmAsutuareFarm309
* ARDEC = Aquaculture Research and Development Centre. ** The majority of Black Volta River samples were obtained from Kantu (N = 30). Samples were also collected from Lawra (N = 3) and Talewona (N = 6).
Table 2. Technical details for amplification of ten microsatellite loci for Ghanaian tilapias (Oreochromis spp.) collected from the Lower Volta River, the Black Volta tributary of the lake and five cage farm sites on the Volta Lake in Ghana.
LocusPrimer Sequences (5′ to 3′)Base-pair RangeAnnealing Temp (°C)GenBank Accession Number
UNH123F: CATCATCACAGACAGATTAGA171–24554G12276.1
R: GATTGAGATTTCATTCAAG
UNH130F: AGGAAGAATAGCATGTAGCAAGTA164–24258G12283.1
R: GTGTGATAAATAAAGAGGCAGAAA
UNH178F: GTCACACCTCCATCATC114–14458G12330.1
R: AGTTGTTTGGTCGTGTAAG
UNH180F: GCAACTAATCACACAATTTT121–18758G12332.1
R: GTTTAAGTTAAAAACAAATTCGTTT
UNH203F: CACAAAGATGTCTAAACATGT65–9756G12354.1
R: GAATTTGACAGTTTGTTGTTTAC
UNH858F: TTCAAACAGCTTCACGGTCA196–25258G68194.1
R: CTATGCCATGGCTAAAGTCAC
UNH898F: GATGTCCCCACAAGGTATGAA214–29258G68215.1
R: TAATCCACTCACCCCGTTTC
UNH925F: GTAGCTGCTGGGGTCTGAAG172–25258G68234.1
R: TAGCACTCTGCCACTTGTCC
UNH934F: ACTGCAATGAAATGCTGCTT214–24658G68240.1
R: CCATTCCTCAGAGCACAACA
UNH991F: AAGCCTTGCATAAAACAGCA150-18258G68271.1
R: AAAGTTTGCTGCCCTCAGTG
Table 3. AMOVA for eight nuclear DNA microsatellites loci in the wild (Lower Volta and Black Volta rivers) and five farmed tilapia stocks collected in Ghana from March 2017 to July 2017.
Source of Variationd.f.Sum of SquaresPercentage of Variation
Among populations6129.8811.15
Within populations4171054.8688.85
Total4231184.74

