Negative Effects of Diurnal Changes in Acidification and Hypoxia on Early-Life Stage Estuarine Fishes


School of Marine and Atmospheric Sciences, Stony Brook University, 239 Montauk Hwy, Southampton, NY 11968, USA
*
Author to whom correspondence should be addressed.
Diversity 2020, 12(1), 25; https://0-doi-org.brum.beds.ac.uk/10.3390/d12010025
Submission received: 19 August 2019
/
Revised: 29 December 2019
/
Accepted: 5 January 2020
/
Published: 8 January 2020
(This article belongs to the Special Issue The Effects of Hypoxia on Marine Food Webs and Ecosystems)
Abstract
:Estuaries serve as important nursery habitats for various species of early-life stage fish, but can experience cooccurring acidification and hypoxia that can vary diurnally in intensity. This study examines the effects of acidification (pH 7.2–7.4) and hypoxia (dissolved oxygen (DO) ~ 2–4 mg L−1) as individual and combined stressors on four fitness metrics for three species of forage fish endemic to the U.S. East Coast: Menidia menidia, Menidia beryllina, and Cyprinodon variegatus. Additionally, the impacts of various durations of exposure to these two stressors was also assessed to explore the sensitivity threshold for larval fishes under environmentally-representative conditions. C. variegatus was resistant to chronic low pH, while M. menidia and M. beryllina experienced significantly reduced survival and hatch time, respectively. Exposure to hypoxia resulted in reduced hatch success of both Menidia species, as well as diminished survival of M. beryllina larvae. Diurnal exposure to low pH and low DO for 4 or 8 h did not alter survival of M. beryllina, although 8 or 12 h of daily exposure through the 10 days posthatch significantly depressed larval size. In contrast, M. menidia experienced significant declines in survival for all intervals of diel cycling hypoxia and acidification (4–12 h). Exposure to 12-h diurnal hypoxia generally elicited negative effects equal to, or of greater severity, than chronic exposure to low DO at the same levels despite significantly higher mean DO exposure concentrations. This evidences a substantial biological cost to adapting to changing DO levels, and implicates diurnal cycling of DO as a significant threat to fish larvae in estuaries. Larval responses to hypoxia, and to a lesser extent acidification, in this study on both continuous and diurnal timescales indicate that estuarine conditions throughout the spawning and postspawn periods could adversely affect stocks of these fish, with diverse implications for the remainder of the food web.
1. Introduction
Estuaries, rivers, and coastal bays function as essential spawning grounds and nursery habitats for forage fishes, which are pivotal components of marine food webs [1]. The environmental conditions prevailing in these systems during the embryonic and larval stages of these fish can have a substantial influence on their survival into the juvenile and adult stages [2,3]. Large declines in early-life stage survival can translate into significant decreases in recruitment and an abundance of fish stocks [4].
The phenomena of ocean acidification (decreased pH) and hypoxia (low dissolved oxygen) associated with global climate change have been increasingly prevalent in world oceans in recent decades [5,6]. In a warming climate, these stressors add another layer of complexity to the physiological challenges for early-life stage fishes [2,7,8]. Acidification and hypoxia can be especially acute in coastal ecosystems where unfavorable low pH and low DO conditions are intensified by eutrophication [9,10]. Excessive nutrient loading can stimulate accelerated primary production of organic carbon, which ultimately promotes hypoxia, as microbial respiration reduces oxygen levels and produces carbon dioxide that lowers pH [10]. Given that eutrophication-induced microbial respiration is just one of many acidification mechanisms in coastal zones [11], organisms persisting in these ecosystems may frequently encounter elevated levels of CO2.
Hypoxic conditions in temperate coastal water bodies most commonly develop in summer, when seasonal temperatures are elevated, and thus, saturated dissolved oxygen (DO) levels are already low [12]. In addition, during summer months, thermally-induced vertical stratification is more likely to occur, wind-driven mixing is minimal, and microbial respiration rates are maximal [10]. Hence, hypoxic zones within temperate latitudes are often seasonal features that dissipate when temperatures decrease, stratification is disrupted, and respiration rates decline.
Global atmospheric CO2 levels currently average ~410 µatm, and are expected to increase to between 700 and 1000 µatm by the end of this century [13]. Since acidification can be exacerbated by ecosystem respiration, estimates for coastal hypoxic-prone regions are even more severe [14]. Recently, within eutrophic estuaries on Long Island, NY, USA, midsummer extremes of dissolved CO2 of up to 3000 µatm with a corresponding pH of <7 have been observed [7,10]. These conditions are expected to intensify this century due to atmospheric delivery of CO2 [14], with dissolved CO2 levels potentially reaching upwards of 3400–4500 µatm in some regions by 2100 [15], a forecast that could have profound implications for aquatic life in estuaries.
Early-life stage fish can be sensitive to low DO and low pH. It has long been known that low oxygen is detrimental to fish [16,17]. While some larval fish such as Baltic cod [18] and larval Walleye pollock [19] appear to be resistant to elevated levels of CO2, acidification can lead to significant reductions in hatch success and survival of some embryonic and larval fishes, such as inland silversides (Menidia beryllia) [20], Atlantic silversides (Menidia menidia) [21], Summer flounder (Paralichthys dentatus) [22], and Atlantic cod (Gadus morhau L.) [23]. Some recent studies exploring the combined effects of low DO and low pH have found that hypoxia has a stronger negative effect than acidification on the survival and growth of larval Atlantic (M. menidia) and inland silversides (M. beryllina), but that the combined stressors often worsened outcomes over low DO exposure alone [24].
While exposure to continuously low pH and low DO can be harmful to marine life including fishes [12,24,25], in many shallow estuaries, pH and DO levels often vary on diurnal timescales, with values being higher during the day due to photosynthetic production, and reduced at night in the absence of photosynthesis [7,9,26]. In the Flax Pond salt marsh, an estuary on the north shore of Long Island, midsummer in situ diel fluctuations of DO ranged up to 5 mg L−1, while diel pH fluctuations ranged up to 0.7 units [7]. The consequences of these fluctuations on marine life in general, and larval fish in particular, are unclear [27]. A laboratory study of juvenile summer flounder (Paralichthys dentatus) determined that extreme diel cycling on the order of 10 mg O2 L−1 and 1.3 pH units resulted in significantly reduced growth and survival [28]. Atlantic silversides (Menidia menidia) and mummichogs (Fundulus heteroclitus) were found to perform surface respiration when experiencing diel cycling DO and pH [29]. The effects of diel cycles in pH and DO on early-life stage fish, however, is unclear.
The goal of this study was to explore the effects of chronic and diel cycling of hypoxia and acidification on the hatch time, hatch success, larval survival, and size of early-life stages of three ecologically-important forage fish in food webs within the northwest coastal Atlantic Ocean: Menidia menidia (Atlantic silverside), Menidia beryllina (inland silversides), and Cyprinodon variegatus (Sheepshead minnows). Experiments also examined the effects of differing durations of diel acidification and hypoxia on the early-life stages of these fishes. All of these species naturally occur in shallow estuaries along the U.S. east coast, tolerating wide ranges of temperature and salinity within spawning and nursery habitats [30]. While inland silversides and sheepshead minnows remain within estuaries throughout the year, Atlantic silversides migrate offshore to the coastal shelf during fall and winter months, returning to spawn [30,31,32]. In estuaries surrounding Long Island, New York, silversides spawn between April/May and June, while sheepshead minnows can spawn from May through September [30,31,32]. All three species spawn in shallow waters within the intertidal zone, with Menidia spp. depositing eggs upon available vegetation, while sheepshead minnows are demersal spawners, depositing eggs onto the bottom substrate [30,31,32,33]. As forage fishes, all three species tested here serve as important links in transferring energy from lower trophic levels to carnivores in higher trophic levels, including commercially- and recreationally-valued fishes [30,34]. Given their life histories, these fish likely experience strong diel cycles in DO and pH throughout their early-life stages within some parts of their native habitats [35].
2. Materials and Methods
2.1. Experimental Design
The effects of hypoxia and acidification on the survival of larval fishes were examined through laboratory experiments exposing eggs and larvae to several iterations of varying pH and dissolved oxygen treatments. These effects were tested for one species of fish per experiment (Atlantic silversides, inland silversides, Sheepshead minnows), for a total of seven distinct experiments. Oxygen concentrations for low DO treatments ranged from 2–4 mg L−1, while pHT (pH total scale) for acidification treatments ranged from 7.2–7.4, conditions commonly found in coastal zones during summer [7,9,10], whereas control conditions had dissolved oxygen concentrations of ~7 mg L−1 and a pHT of 7.7–7.9. The DO and pH conditions varied in terms of concentration (low or ambient) and duration, being either continuous (24 h) or diurnal, i.e., a set number of hours at low pH/DO with the remainder of the 24 h at ambient chemistry (12 h low, 12 h ambient) so as to mimic trends in estuarine environments [7,9,10]. A summary of experiments, treatments, species, and significant results can be found in Table 1.
2.2. Seven Treatment Experiments
The first experimental design included seven different pH and DO combinations, and was performed on three occasions, one experiment each for Atlantic silversides, sheepshead minnows, and inland silversides. Collectively, the seven treatments consisted of: 1. Control: Continuous, ambient pH and DO (~7.8, ~7 mg L−1), 2. Continuous low pH and ambient DO (~7.2, ~7 mg L−1), 3. Continuous ambient pH and low DO (~7.8, ~2 mg L−1), 4. Continuous low pH and low DO (~7.2, ~2 mg L−1), 5. Diurnal ambient pH and low DO (~7.8, ~2–7 mg L−1), 6. Diurnal low pH and ambient DO (~7.2–7.7, ~7 mg L−1), and 7. Diurnal low pH and low DO (~7.3–7.7, ~2–7 mg L−1). The precise chemistries achieved in these experiments appear in Table 2, Table 3 and Table 4. Desired pH and DO concentrations were achieved by bubbling in various gas mixtures of ambient air, 5% CO2, N2, and a 400 ppm CO2/N2 mix. Control treatments and ambient conditions in diel cycles were achieved using only ambient air, while low pH conditions required a mixture of 5% CO2 and ambient air, low DO conditions required the 400 ppm CO2/N2 mix with ambient air, and combined low pH and low DO treatments required a mixture of both 5% CO2 and N2 [36]. Diurnal treatments were controlled by their own set of gas tanks and timers (details below). While it took less than an hour from the time that gas flow was altered in the treatments until DO in diurnal treatments reflected the new conditions (ambient or low), pH took longer, i.e., up to two hours.
2.3. Four Treatment Experiments
The response of fishes to diel cycling of pH and DO was examined further in a series of four treatment experiments with varying intervals of exposure to low pH and/or DO conditions. Inland silversides were exposed to: 1. Continuous ambient pH and DO (~7.9, ~7 mg L−1), 2. Continuous reduced pH and DO (~7.4, ~4 mg L−1), 3. Continuous low pH and DO (~7.2, ~2 mg L−1), and 4. Diurnal low pH and low DO (~7.3–7.8, ~2–7 mg L−1) using a 12 h low, 12 h ambient duration. The diurnal treatment in this experiment fluctuated between the ambient and low pH/DO treatment so as to achieve a mean DO/pH that was nearly equal to the DO/pH of the ‘reduced pH/DO’ treatment. The precise chemistries achieved in this experiment appear in Table 5. Three additional experiments examined differing durations of diel low pH/DO exposure with three distinct intervals of exposure, where pH and DO concentrations remained consistent with the previous experiments, such that ambient was (~7.9, 7 mg L−1) and low was (~7.2, 2 mg L−1) respectively. The precise chemistries achieved in these experiments appear in Table 6, Table 7 and Table 8. The four treatments were: 1. Continuous ambient pH and DO, 2. Four-hour low pH and DO, 3. Eight-hour low pH and DO, and 4. Twelve-hour low pH and DO. This type of experiment was used once for Atlantic silversides and twice for inland silversides.
For all experiments, replicate (n = 4) 8 L polyethylene vessels (Letica®, Rochester Hills, MI, USA) were filled with UV sterilized, 1 µm filtered seawater from Old Fort Pond in Southampton, NY, USA. Temperature was controlled by partially submerging vessels in water baths maintained at ideal temperatures for these fish (21–22 °C) [30], achieved via chilling units supplemented with heating wands. The described experimental set ups were modeled from previous experiments with fish [24]. The delivery rate and mixing of gases to attain desired pH and DO was accomplished using a series of Cole Parmer® gas regulators, single-tube flowmeters, and/or multi-tube gas proportioners. Diurnal treatments were achieved using sprinkler timers (RainBird and Hunter) and solenoid valves connected to gas tanks and ambient air lines, with CO2 and N2 gas being delivered at night and ambient air delivered during daytime hours, mimicking in situ the changes associated with ecosystem metabolism [37].
2.4. Physical and Chemical Water Properties
Water quality measurements were made daily over the duration of experiments. Within the seven treatment experiments, temperature and DO were logged every 15 min within one replicate of each of the three diurnal treatments with a HOBO® U26-001 dissolved oxygen logger. Similarly, pH was also logged at 15 min intervals from one replicate of each diurnal treatment with a Thermo-Scientific Orion STAR™ A321 pH meter. In addition to continuous logging, for all experiments, daily measurements of DO were recorded for all replicates with a YSI 5100 Dissolved Oxygen Meter. Salinity and temperature were measured daily with a YSI Professional Plus Multiparameter Instrument. pH was measured daily in each replicate with a Honeywell Durafet Ion Sensitive Field Effect Transistor (ISFET)-based pH sensor, and flow rates through proportioners were adjusted accordingly to ensure the maintenance of optimal chemistry conditions throughout the experiment.
Carbonate chemistry was assessed via measurements of dissolved inorganic carbon (DIC) from all treatments at the start and end of each experiment using a VINDTA 3D (Versatile Instrument for the Determination of Total inorganic carbon) delivery system coupled with a UIC Inc. (Joliet, IL, USA). coulometer (model CM5017O). Bicarbonate standards were used, and certified standard reference material for DIC provided by Dr. Andrew Dickson (Scripps Oceanographic Institute) was analyzed prior to each set of analyses, with sample analysis proceeding only when 100 ± 0.2% of certified values were obtained. The CO2SYS program was used to calculate and report carbonate chemistry values including total alkalinity, carbonate, pCO2, total dissolved inorganic carbon, Ωcalcite, and Ωaragonite using dissociation constants from Millero [38].
2.5. Experimental Organisms
All research was performed under IACUC# 2011-1903-R2 from Stony Brook University. Organisms used in experiments were either spawned in the Stony Brook—Southampton Marine Science laboratory or obtained from Aquatic Research Organisms, Inc. (ARO) (Hampton, NH, USA). Eggs (<24 h age) of inland silversides and sheepshead minnows were obtained from ARO. Atlantic silversides are plentiful throughout estuaries around Long Island during late spring and summer, and adults were caught and spawned according to EPA [30] guidelines. To commence experiments, 50–80 viable eggs (~24 h post fertilization) were placed into experimental vessels across all treatments (n = 16–28). Each day, the number of hatched and live fish per bucket was recorded. Larvae were fed a diet of rotifers for their first five days posthatch, after which they were transitioned to a diet of Artemia nauplii [30]. Full water changes were performed two to three times per week to ensure optimal water conditions and prevent biotic fouling of the vessels. Experiments persisted up to ~10 days post >80% hatch for each respective bucket, encompassing the critical life stage for larval fish when they transition from yolk sack nutrition to exogenous food. At the end of experiments, a random subset of fish from each replicate were preserved in 10% formalin for size analysis, while the remaining fish were euthanized according to IACUC protocols.
2.6. Data & Statistical Analyses
From the daily count data, three variables were calculated per experimental vessel: 1. Hatch time, which is the day by which the largest number of fish had cumulatively hatched and were counted alive in each bucket, 2. Hatch success, which is the percentage of fish that hatch relative to the total number of eggs added per bucket, and 3. Larval survival, which is the ratio of fish alive at the cessation of the experiment compared to the number of total fish hatched relative to each replicate. A fourth variable, size, was quantified by measuring the final length of fish, from nose to end of tail fin, from pictures taken of fish using a Canon REBEL T6i digital camera with Macro Lens EF 100 m 1:2.8 L IS USM. Images were analyzed in ImageJ after the cessation of the experiment.
Statistical analyses were performed in RStudio® (RStudio Team 2016 v1.1.463). Two-way ANOVAs (Analysis of Variance) were performed to examine differences in hatch time, hatch success, and final larval survival resulting from exposure to differing pH and/or DO conditions (high, low, and diurnal). One-way ANOVAs were performed for all four treatment experiments for hatch time, hatch success, and larval survival. A Shapiro-Wilks test was performed for all data sets to ensure normal distribution of data (p > 0.5), while a Bartlett’s test was performed to ensure homogeneity of variance (p > 0.5), followed by Levene’s test in the event that Bartlett’s failed the assumptions for any given dataset. Arcsin square root transformations were performed on hatch success and survival values prior to statistical analyses due to the inherent uneven distribution of proportional data. In the event of a failed normality or equal variance test, the residuals of that data set were plotted to reassess distribution, and were further examined with a GLM (General Linear Model) to determine significance. ANOVAs and GLMs yielding significant results were examined and plotted using Tukey test for multiple comparisons performed with the glht function to determine which treatments of low pH and/or DO accounted for statistical difference (p value = 0.05) relative to control conditions. Size data sets were modeled with a linear mixed model and analyzed with an ANOVA, comparing a full model to a null model to test for significant treatment effect. Linear mixed models (lme) were used to account for fixed (DO, pH, or treatment) and random (replicate) effects. A Tukey test for multiple comparisons was performed using the Kenward-Roger method under the emmeans package to determine significance.
3. Results
3.1. Seven Treatment Diurnal Acidification and Hypoxia Experiments
3.1.1. Menidia menidia
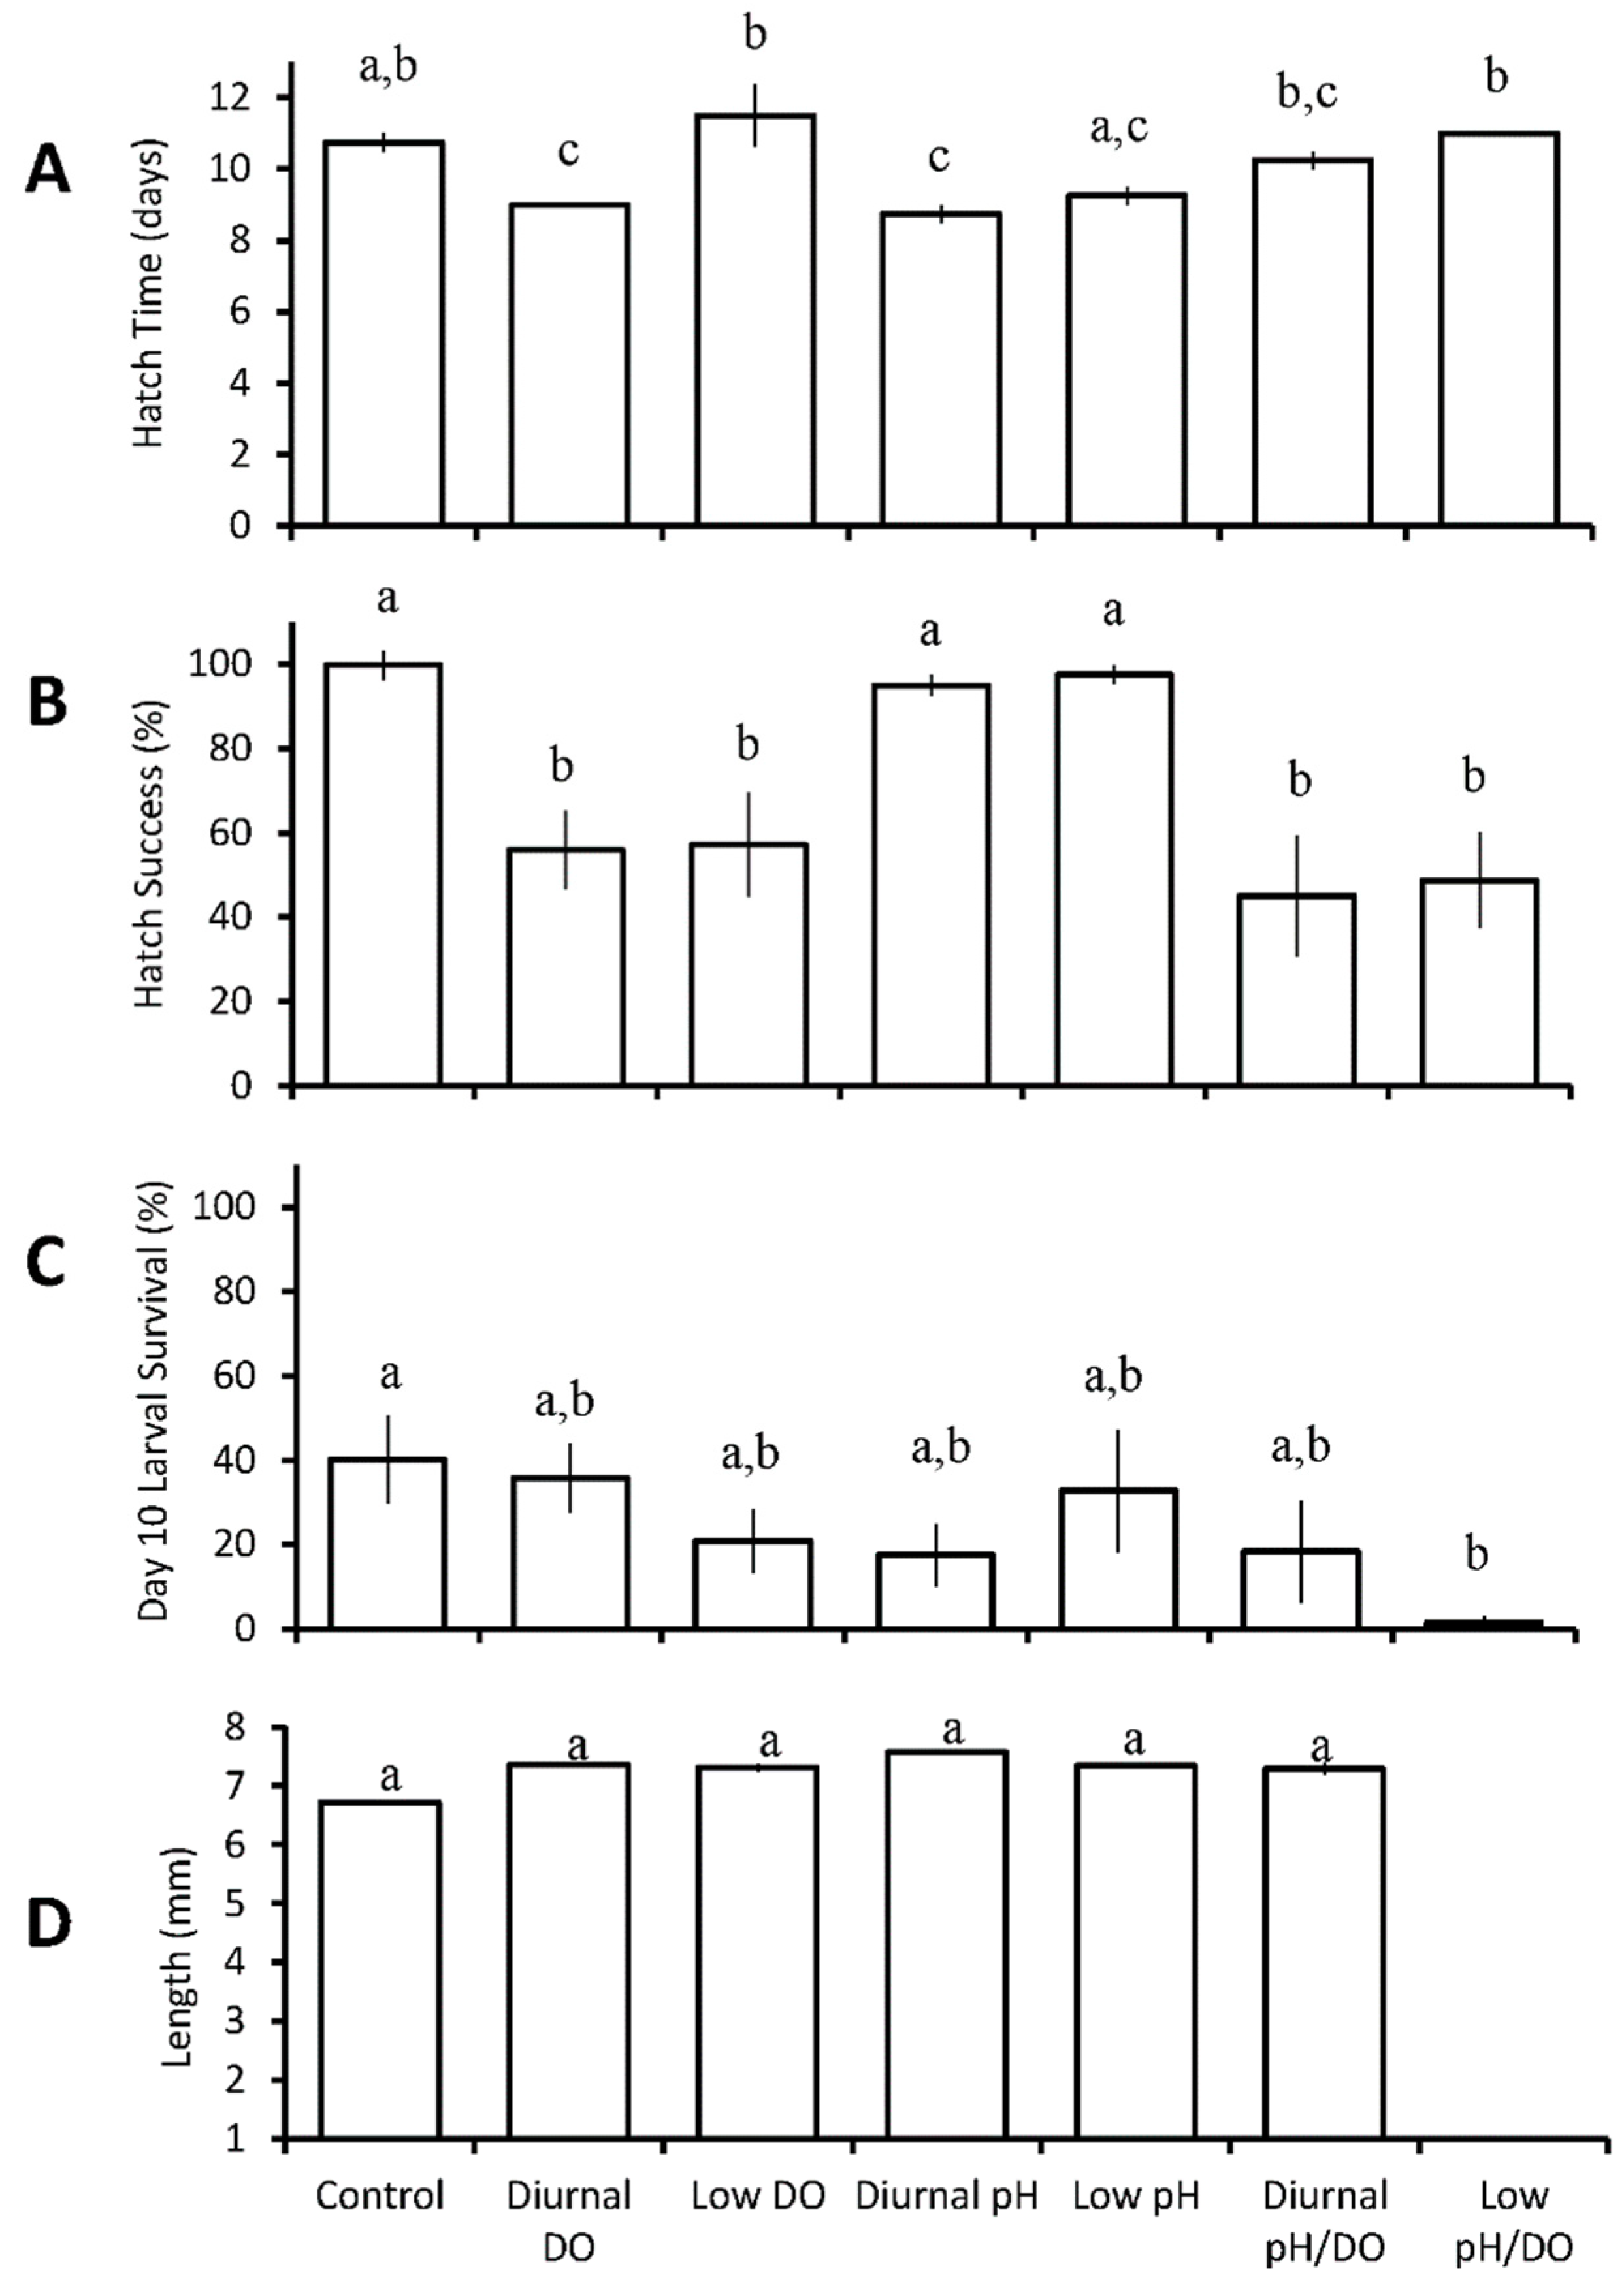
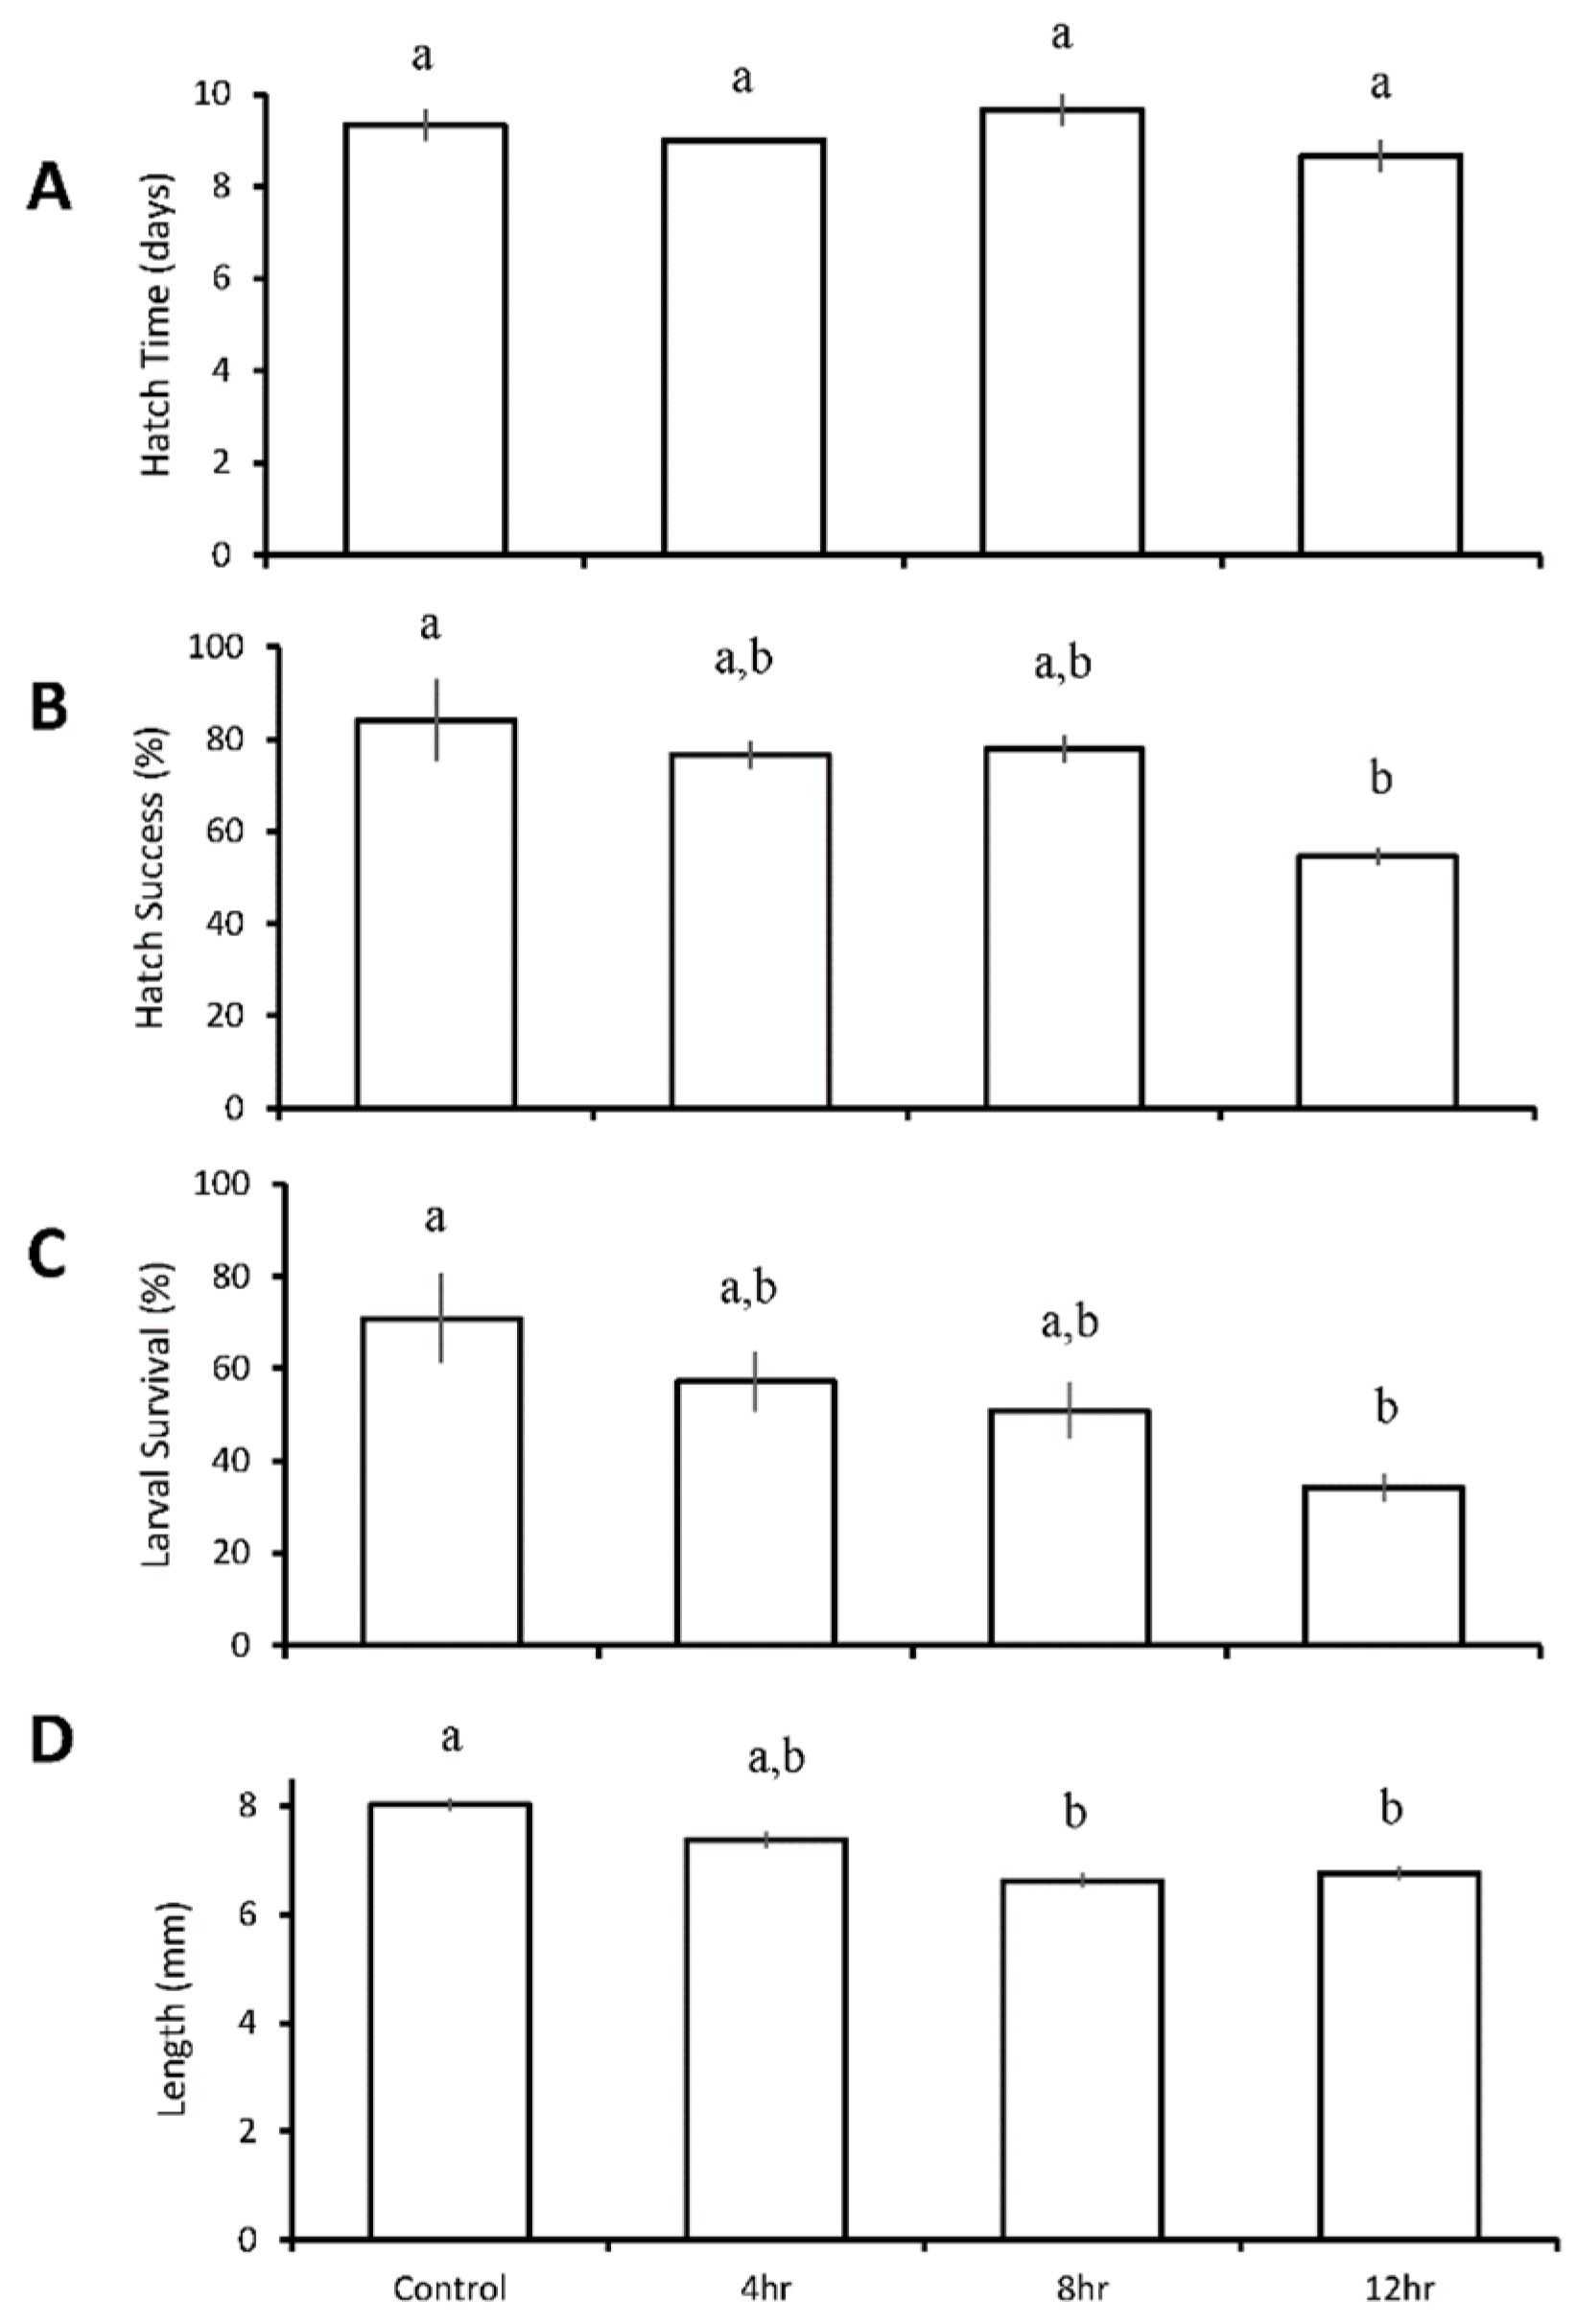
Diurnal exposure to low DO (pH 7.84 ± 0.07, low DO 3.17 ± 1.91 mg L−1) or low pH (low pH 7.28 ± 0.12, DO 6.69 ± 0.15 mg L−1) significantly decreased hatch time for larval Atlantic silversides from 10.75 ± 0.5 days in the control to 9.0 ± 0.0 and 8.75 ± 0.5 days respectively (p = 0.02; p = 0.004; GLM fitted model; Table S1, Figure 1A). There was an antagonistic interaction between pH and DO such that the hatch time of Atlantic silversides was longer than predicted by the individual treatments (p < 0.0001; Table S1). Hatch success decreased most significantly from the control (99 ± 7%) in diurnal low DO/pH (45 ± 28%; low pH 7.35 ± 0.11, low DO 3.22 ± 1.96 mg L−1; p = 0.001; Two-way ANOVA; Figure 1B, Table S2), and in continuous low pH/DO (49 ± 22%; pH 7.25 ± 0.07, DO 2.42 ± 0.64 mg L−1; p = 0.002; Two-way ANOVA; Figure 1B, Table S2). Hatch success was also significantly reduced to 56 ± 18% in response to diurnal low DO (p = 0.006; Two-way ANOVA; Figure 1B, Table S2) and to 57 ± 25% in continuous low DO (pH 7.84 ± 0.06, DO 2.82 ± 0.45 mg L−1; p = 0.008; Two-way ANOVA; Figure 1B, Table S2). Acidification was a significant main effect (p < 0.05) that decreased survival, while only the continuous low pH/DO treatment resulted in a significantly lower larval survival at day ten post hatch (p = 0.04; Two-way ANOVA), with only 1.5 ± 3% surviving in this treatment compared to 40 ± 21% in the control (Figure 1C, Table S3). Low DO was a significant main effect on length of Atlantic silverside (p = 0.022, ANOVA, Figure 1D, Table S4C), although none of the treatments differed from the control (6.7 ± 0.6 mm).
3.1.2. Cyprinodon variegatus
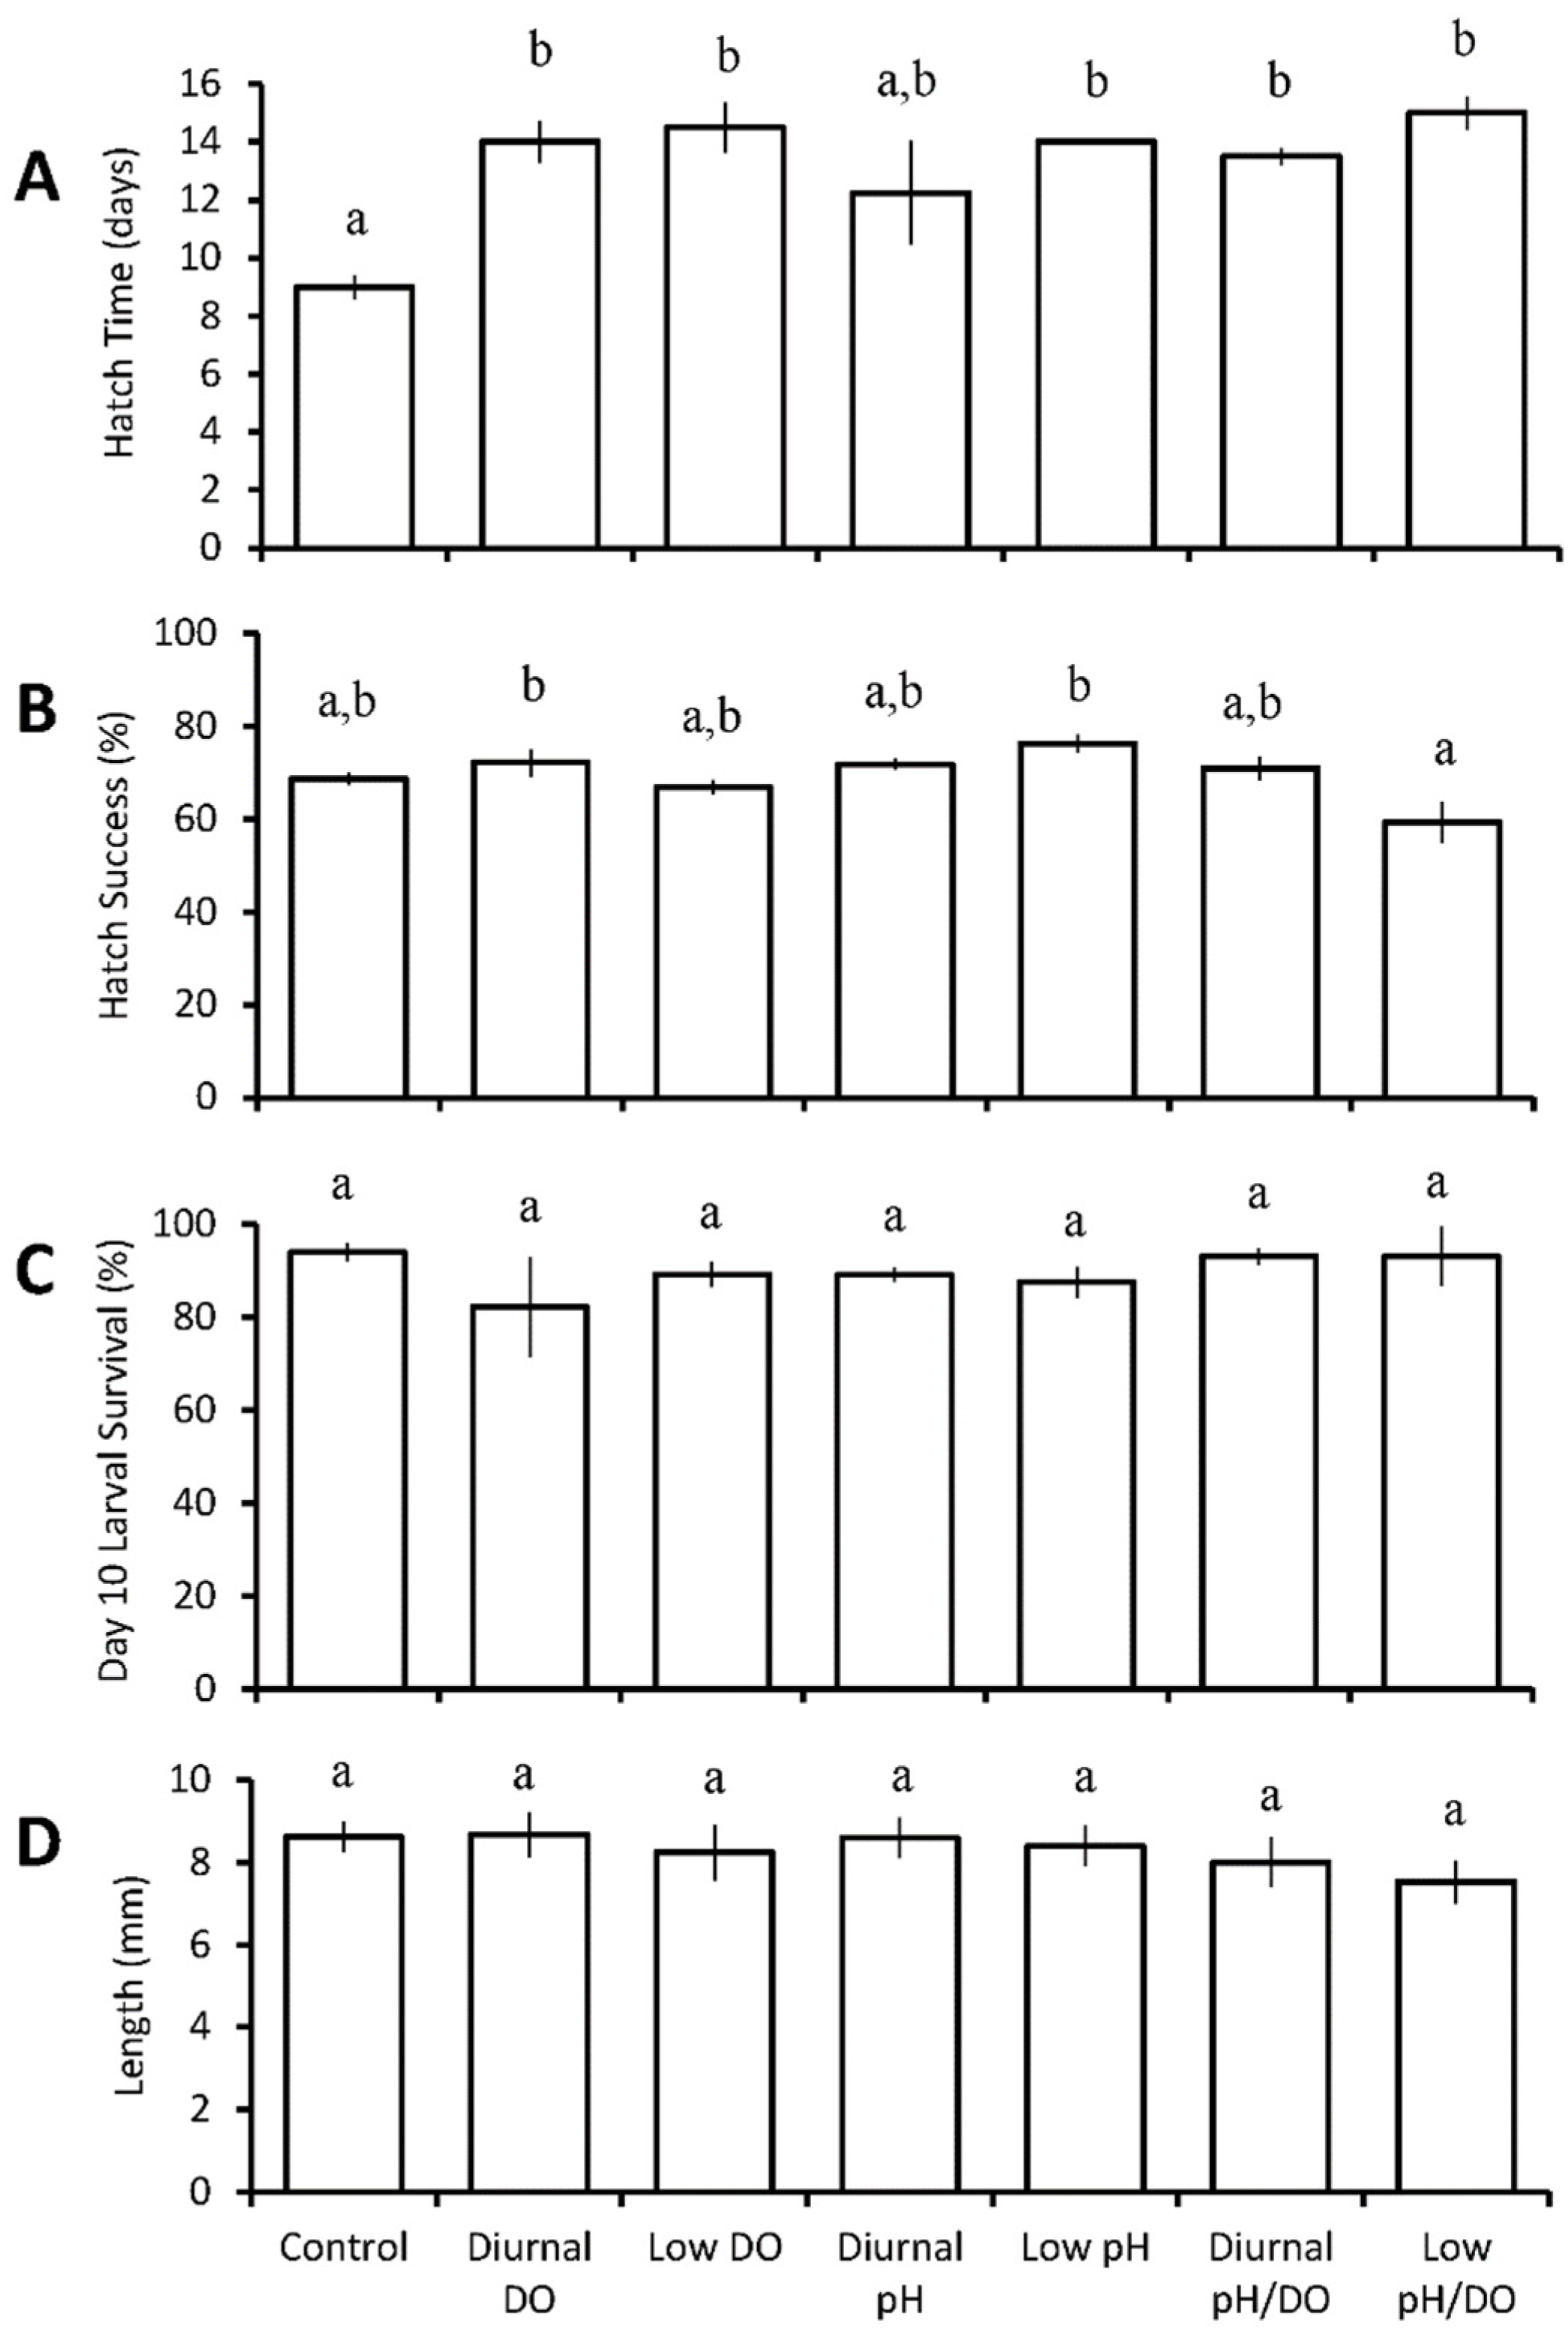
Hatch time for larval sheepshead minnows significantly increased by at least four days relative to the control (9 ± 0.8 days) in all treatments, with the exception of diurnal pH. Larvae in the continuous low pH/low DO (pH 7.17 ± 0.07, DO 2.29 ± 0.49 mg L−1) treatment exhibited the most significant increase in hatch time, i.e., six days (p < 0.001; GLM fitted model; Figure 2A, Table S5). There was a significant interaction between pH and DO that antagonistically combined to yield hatch times that were not as long as predicted by the individual treatments (p < 0.001; Table S5). Exposure to diurnal low DO (pH 7.74 ± 0.05, DO 4.35 ± 1.75 mg L−1) and continuous low pH (pH 7.08 ± 0.12, DO 6.64 ± 0.61 mg L−1) resulted in significantly higher hatch success (72 ± 6% (p = 0.044) and 76 ± 4% (p = 0.003), respectively) compared to continuous low pH / low DO (59 ± 9%; Two-way ANOVA; Figure 2B, Table S6). There was a significant interaction between pH and DO that combined to synergistically yield the aforementioned lowest hatch success (p < 0.050; 59 ± 9%; Figure 2B, Table S6). Sheepshead minnow larval survival at ten days post hatch was not significantly different across any of the treatments, averaging 90 ± 4% overall (Figure 2C). Acidification had a significant effect on reducing the length of sheepshead minnows (p = 0.02, ANOVA, Figure 2D, Table S8B); however, at the individual treatment level, there were no significant differences in size compared to the control (8.6 ± 0.7 mm).
3.1.3. Menidia beryllina
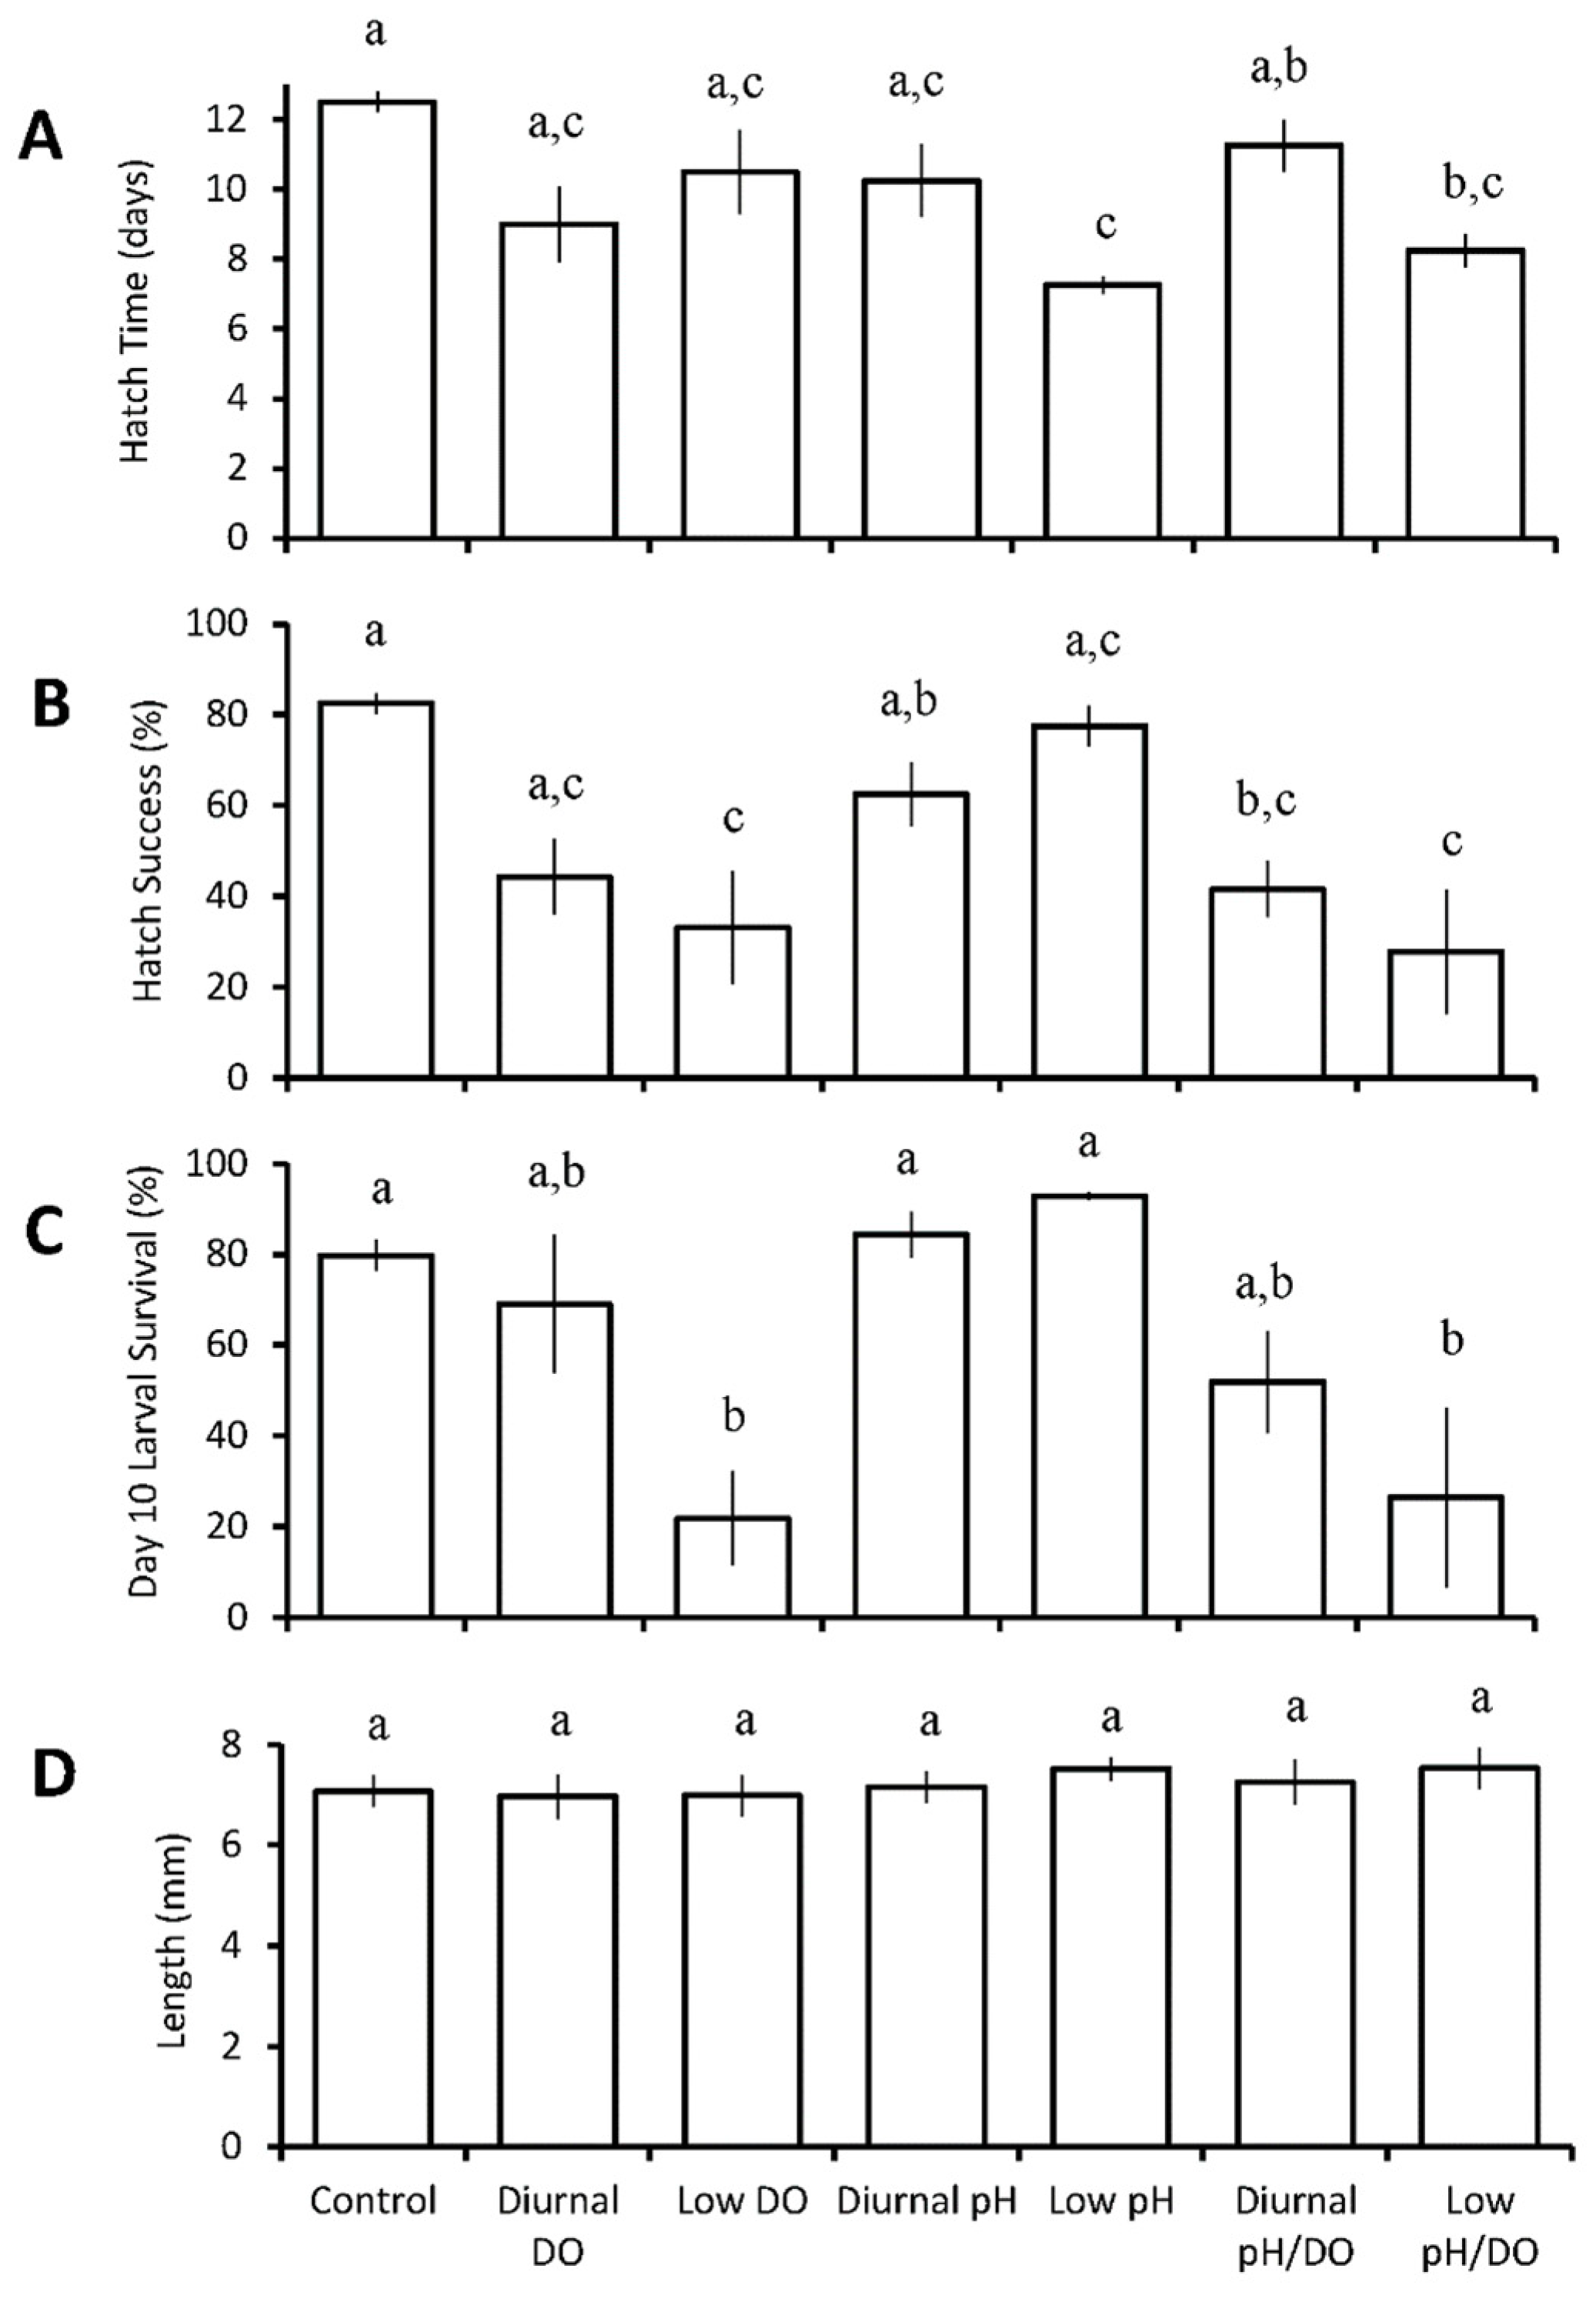
The hatch time of inland silversides significantly decreased relative to the control (12.5 ± 0.6 days; pH 7.78 ± 0.06, DO 6.91 ± 0.14 mg L−1) in both the continuous low pH (pH 7.19 ± 0.16, DO 6.78 ± 0.25 mg L−1) and continuous low pH/low DO (pH 7.27 ± 0.13, DO 2.44 ± 0.56 mg L−1) treatments to 7.25 ± 0.5 days (p = 0.002; Two-way ANOVA; Figure 3A, Table S9) and 8.25 ± 1.0 days (p = 0.02; Two-way ANOVA; Figure 3A, Table S9), respectively. There was, again, an antagonistic interaction between pH and DO on hatch time, as the combined treatments did not reduce hatch time lower than either individual treatment (p < 0.05; Table S9). Hatch success was significantly reduced from 82 ± 5% in the control to 42 ± 12% in diurnal low pH/low DO (pH 7.49 ± 0.03, DO 2.82 ± 0.64 mg L−1; p = 0.04; Two-way ANOVA; Figure 3B, Table S10), 33 ± 24% for continuous low DO (pH 7.83 ± 0.05, DO 2.11 ± 0.33 mg L−1; p = 0.007; Two-way ANOVA; Figure 3B, Table S10) and 28 ± 27% for continuous low pH and low DO (p = 0.002; Figure 3B, Table S10). Additionally, hatch success for continuous low DO and continuous low DO/low pH both were significantly lower compared to that of continuous low pH (p = 0.02; p = 0.006; Figure 3B, Table S10). Larval survival was significantly reduced from 80 ± 6% in the control to 22 ± 20% for continuous low DO (p = 0.04; Two-way ANOVA; Figure 3C, Table S11) and to 26 ± 46% for continuous low pH / low DO (p = 0.04). Larval survival in the continuous low DO and continuous low DO/pH treatment was also significantly lower than the diurnal low pH (p = 0.02; p = 0.02) and continuous low pH (p = 0.004; p = 0.004) treatments. Low pH or DO did not exert any main or treatment effects on the length of inland silversides compared to the control.
3.2. Four Treatment Diurnal Acidification and Hypoxia Experiments
Menidia beryllina
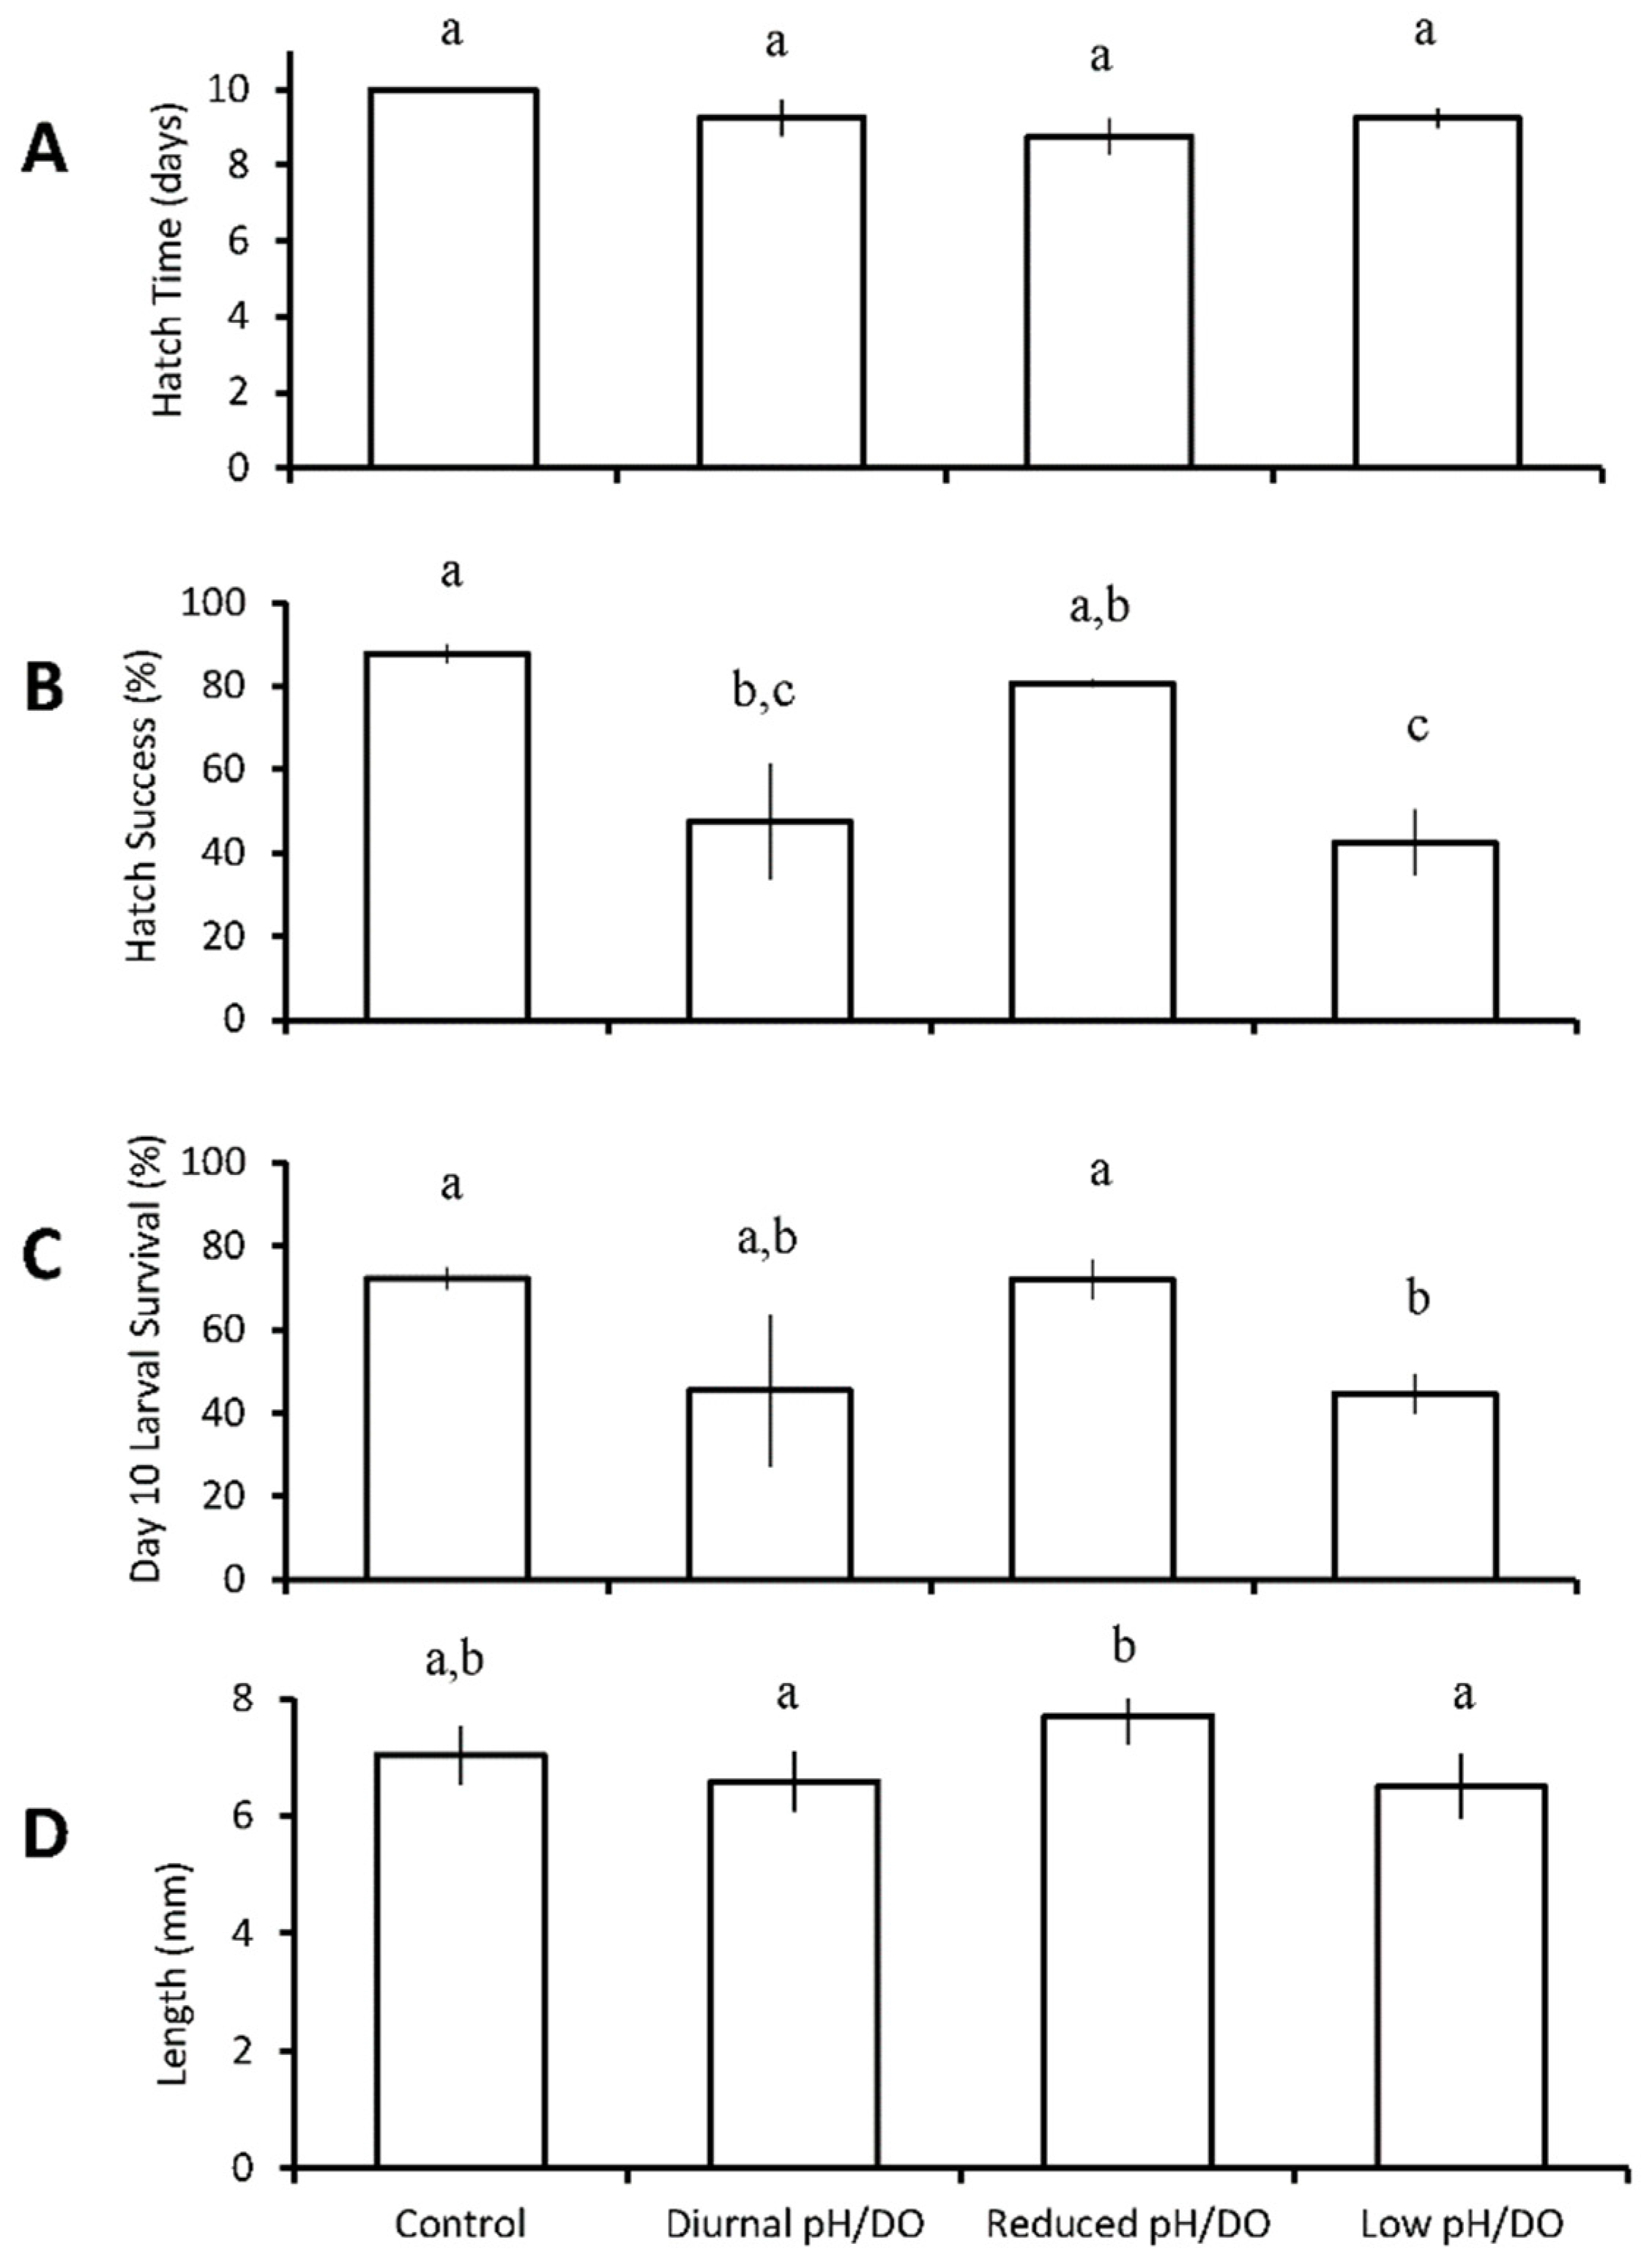
Larval hatch success was significantly reduced from 88 ± 4% in the control to 47 ± 28% in the diurnal low pH/DO treatment (pH 7.32 ± 0.06, DO 2.17 ± 0.52 mg L−1; p = 0.013; One-way ANOVA; Figure 4B; Table S14), and to 42 ± 16% in the continuous low pH/DO (pH 7.16 ± 0.07, DO 2.47 ± 0.33 mg L−1; p < 0.001; One-way ANOVA; Figure 4B, Table S14), while the continuous reduced pH/DO did not exhibit a hatch success that was significantly different from the control. Exposure to continuously low DO/pH resulted in the lowest overall larval survival (45 ± 9%; Figure 4C), which was significantly lower than the control at 72 ± 5% (p = 0.05; One-way ANOVA; Figure 4C, Table S15) and continuous reduced low pH/DO at 72 ± 9% (pH 7.43 ± 0.08, DO 4.81 ± 0.22 mg L−1; p = 0.05; one-way ANOVA; Figure 4C, Table S19), but no different than the diurnal low pH/DO treatment. Size was significantly greater in the reduced pH/DO (7.69 ± 1.0 mm) relative to diurnal low pH/DO (6.59 ± 1.0 mm) and continuous low pH and low DO (6.51 ± 1.1 mm) (p = 0.004; p = 0.001; ANOVA; Figure 4D, Table S16), with fish lengths of the latter two treatments being statistically indistinguishable. Hatch time was not significantly different for inland silversides across any of the treatments in this experiment.
3.3. Diurnal Duration Experiments with Menidia beryllina
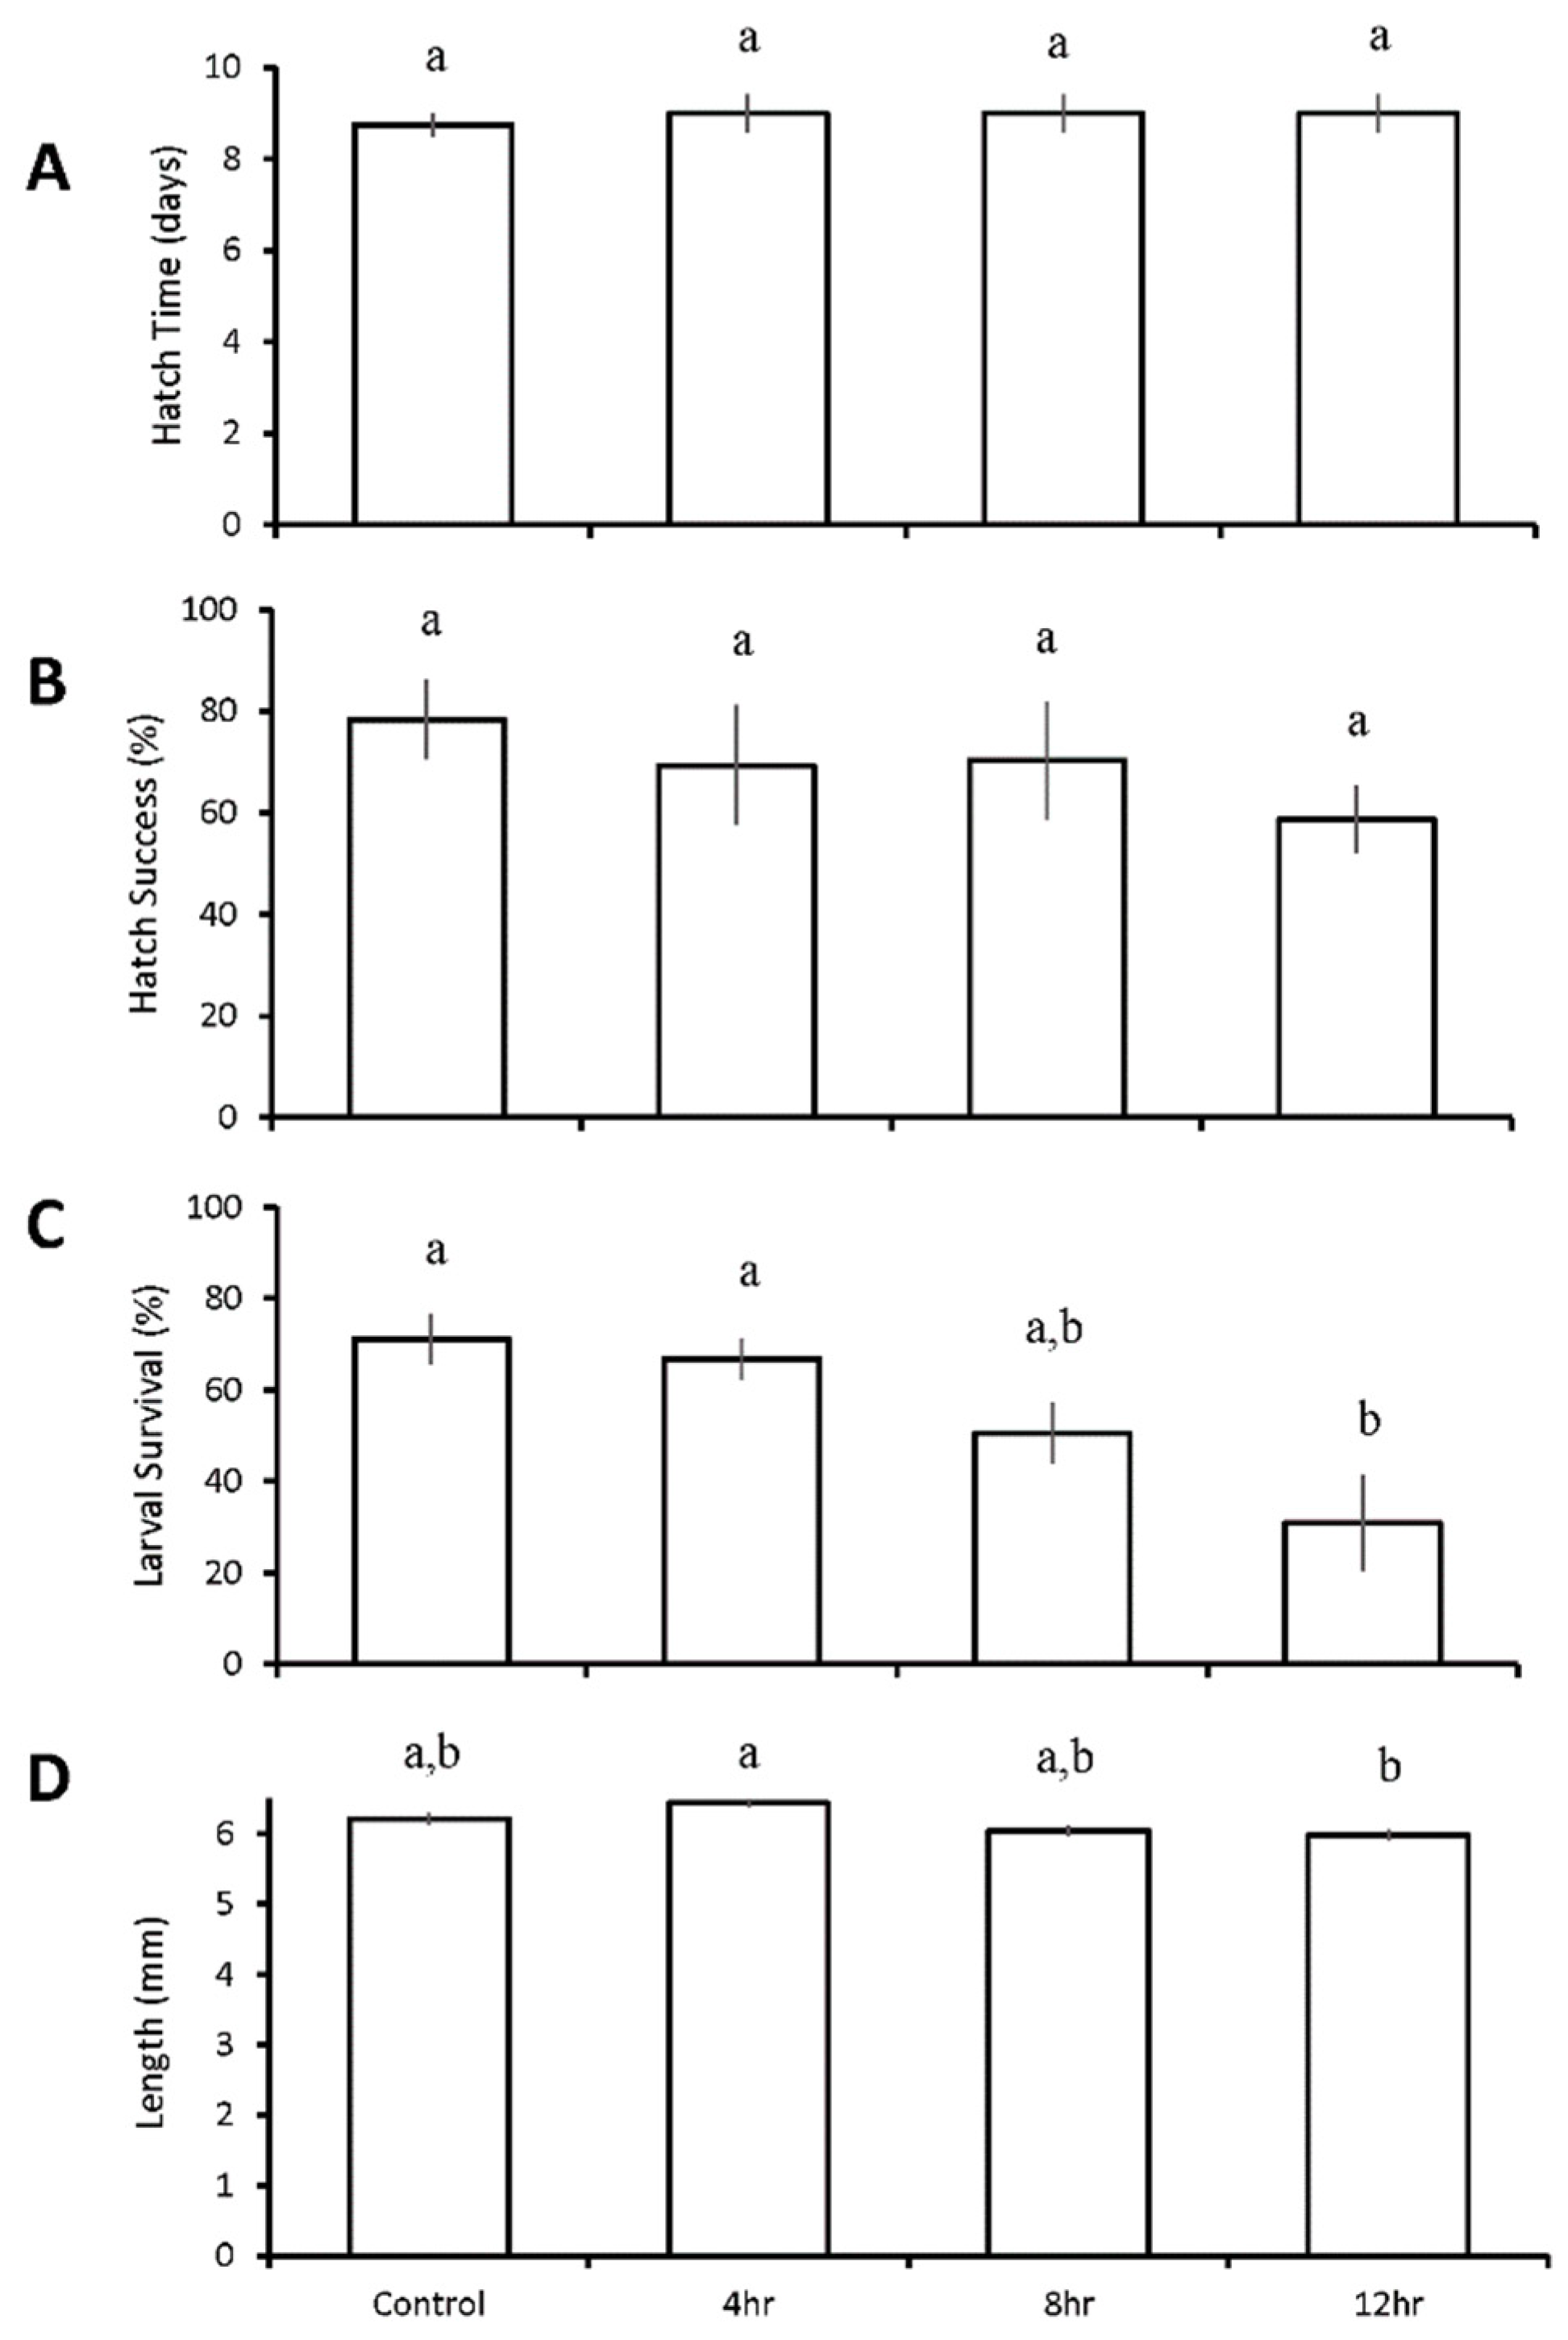
The hatch time of inland silversides larvae did not differ by duration of low pH and low DO, and averaged 9.2 ± 0.6 days for all treatments (Figure 5A). Hatch success averaged 84 ± 15% (Figure 5B) in the control, and was significantly reduced to 55 ± 3% within the 12-h diurnal pH and DO treatment (pH 7.23 ± 0.05, DO 2.12 ± 0.60 mg L−1; p = 0.03; One-way ANOVA; Figure 5B, Table S18), but not in the 4- or 8-h treatments. Final larval survival at eleven days post hatch averaged 71 ± 17% in the control treatment, but was significantly lower (34 ± 5%) in the 12-h diurnal treatment (p = 0.02, One-way ANOVA; Figure 5C, Table S19), but not in the 4- or 8-h treatments. Length was reduced in the 8- (6.6 ± 0.8 mm) and 12-h (6.8 ± 0.7) diurnal treatments relative to the control (8.0 ± 0.6 mm) (p = 0.005; p = 0.009; ANOVA; Figure 5D, Table S20), but not in the 4-h treatment.
A second diurnal duration experiment was performed with inland silversides to explore slightly higher DO levels (2.4 v 2.1 mg L−1). In this case, diurnal cycling pH and DO of any duration did not significantly alter hatch times, which averaged 8.9 ± 0.7 days among all treatments (Figure 6A). Differences were also absent in hatch success for this experiment, with an average of 69 ± 19% for all treatments (Figure 6B). Larval survival at nine days post hatch was highest in the control (71 ± 11%; pH 7.90 ± 0.03, DO 7.07 ± 0.75 mg L−1) and 4-h diurnal (67 ± 9%; pH 7.20 ± 0.07, DO 2.64 ± 1.01 mg L−1) treatments, but declined significantly to 31 ± 21% in the 12-h diurnal treatment (p = 0.009; p = 0.02; pH 7.23 ± 0.08, DO 2.25 ± 0.77 mg L−1; One-way ANOVA; Figure 6C, Table S23). Length was reduced in the 12-h (6.0 ± 0.5 mm) diurnal treatment relative to the 4-h (6.4 ± 0.4 mm) treatment (p = 0.04; ANOVA; Figure 6D, Table S24).
3.4. Diurnal Duration Experiment with Menidia menidia
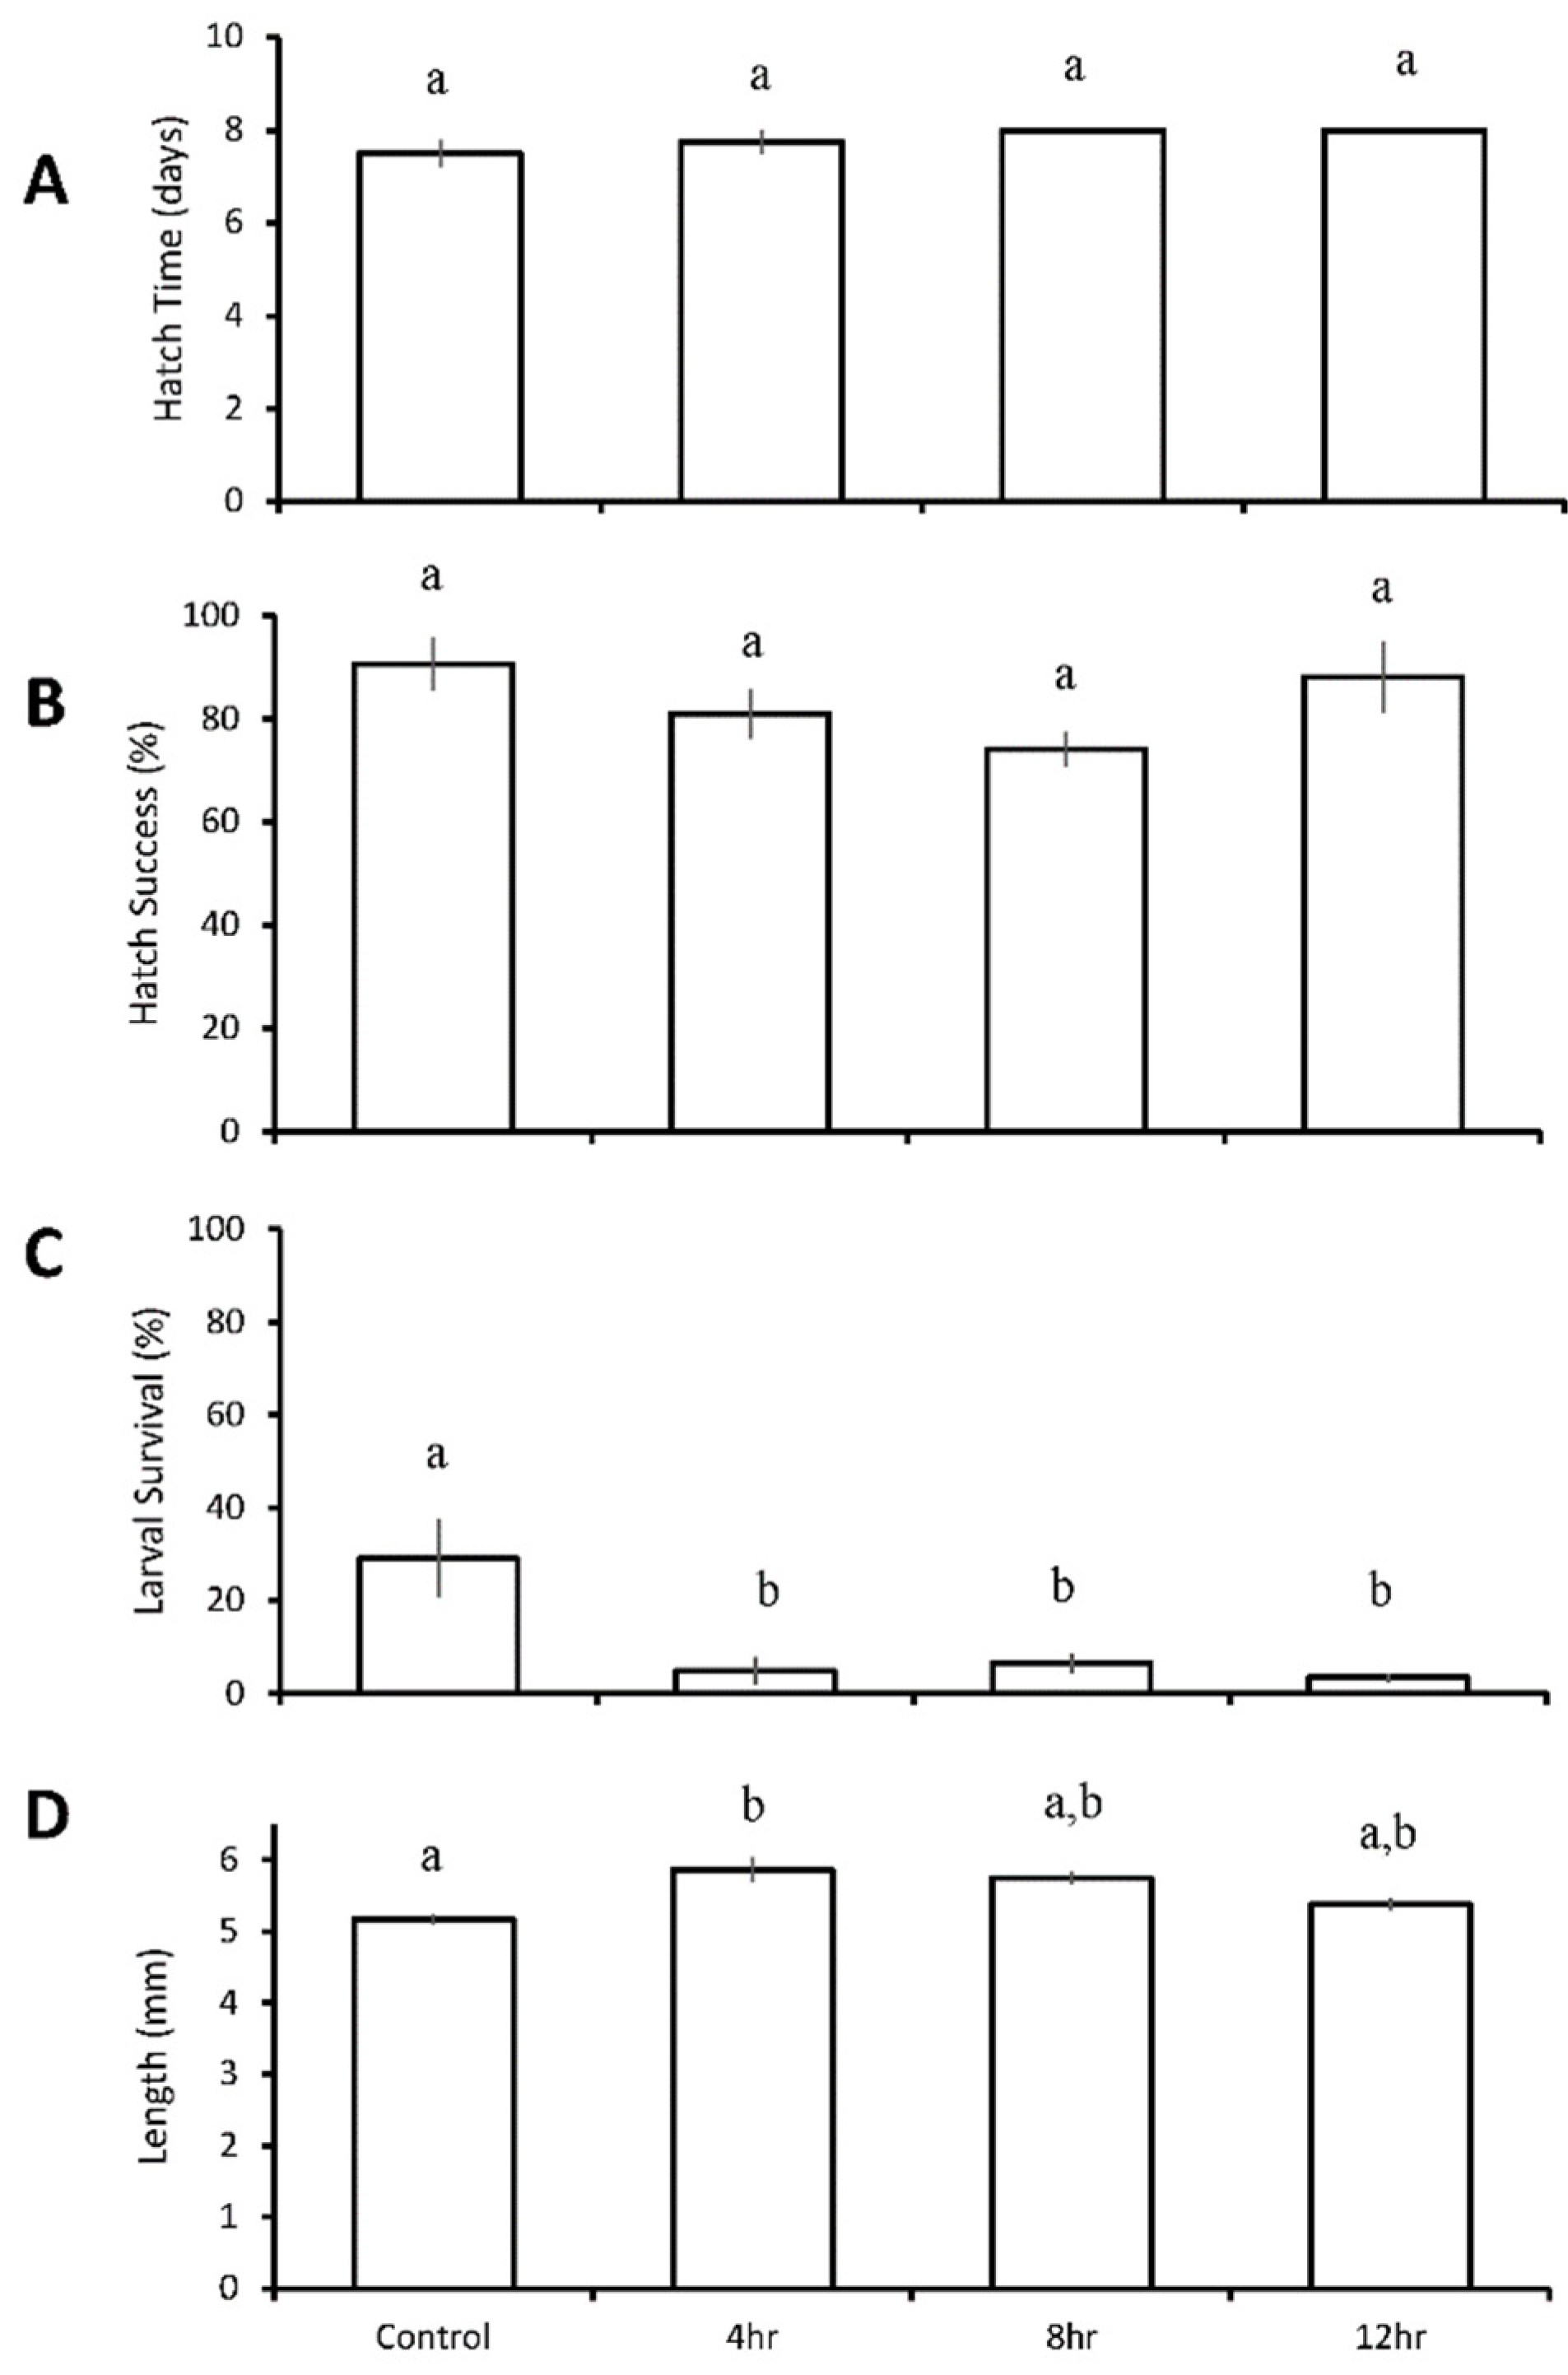
The hatch time of Atlantic silverside larvae averaged 7.8 ± 0.4 days between all treatments, and was not significantly affected by diel cycling of pH and DO of any duration (Figure 7A). Hatch success also did not differ in response to varying durations of low pH and low DO, averaging 83 ± 11% among all treatments (Figure 7B). Final larval survival at five days post hatch averaged 29 ± 17% in the control treatment, but was significantly reduced among all three diurnal pH and DO treatments (p = 0.005; One-way ANOVA; Figure 7C, Table S27), such that survival was 5 ± 6% for the 4-h diurnal treatment (p = 0.009; pH 7.27 ± 0.05, DO 1.95 ± 0.38 mg L−1; One-way ANOVA; Figure 7C, Table S27), 7 ± 4% for the 8-h treatment (p = 0.03; pH 7.21 ± 0.04, DO 2.08 ± 0.40 mg L−1; One-way ANOVA; Figure 7C, Table S27), and 3 ± 2% for the 12-h treatment (p = 0.009; pH 7.32 ± 0.09, DO 1.81 ± 0.29 mg L-1; One-way ANOVA; Figure 7C, Table S27). Length was not reduced, but rather, increased in the 4-h (5.9 ± 0.6 mm) diurnal treatment relative to the control (5.2 ± 0.6 mm) (p = 0.03; ANOVA; Figure 7D, Table S28).
4. Discussion
Estuaries represent vital spawning and nursery habitats for countless marine species, and can be susceptible to acidification and hypoxia that threatens the early-life stages of resident forage fish. Rapid rates of ecosystem metabolism in estuaries can also drive sharp diurnal fluctuations in pH and DO [7,15]. Forage fish provide critical links to upper trophic levels in marine food webs, with their extended support service value to global fisheries estimated at $16 billion [34]. Hence, the alteration of forage fish population survival can have severe implications on both marine food webs and coastal economies. This study revealed the ability of diurnal fluctuations in pH and DO to significantly reduce the size, hatch time, hatch success, and larval survival of two of three species of forage fish studied here. These impacts were more frequently due to low DO rather than low pH. Outcomes for fish exposed to low DO/pH for 12 h were often no different than for fish exposed to the same conditions for 24 h. Negative effects of exposure to low DO/pH was somewhat dose dependent, with 12 h exposure being consistently harmful to Menidia spp., while 8 h exposure caused a negative effect in two of three experiments, and 4 h exposure had a negative effect only once. Collectively, these observations provide a new perspective on the effects of diel cycling pH and DO for early-life stage forage fish.
Larval fish are more sensitive to changes in environmental conditions than their juvenile and adult counterparts, likely due to the incomplete development of their physiological compensatory mechanisms and higher costs of homeostasis attributed to smaller size [39]. In this study, exposure to acidification resulted in the main effects and treatment-specific effects for all fish examined. C. variegatus experienced longer hatch times in response to acidification, while for M. beryllina and M. menidia, time to hatch was reduced. Alteration in hatch time on either end of the spectrum has implications on larval fitness, such that reduction shortens the developmental period of embryos, while longer incubation increases the exposure to adverse conditions, potentially resulting in malformed or underdeveloped larvae, though this was not analyzed in the current study [40,41]. This critical period of early development can be affected by acidification, as metabolic resources are reallocated for basic maintenance of homeostasis, rather than for growth, development, or activity [42]. Acidification was also a main effect that reduced larval M. menidia survival at 10 days posthatch. While adult fishes are able to maintain their internal pH through active ion transport, even under elevated CO2 conditions, increased acid-base regulation may have negative energetic consequences on the physiology and development of early-life stage fish [15,39,40]. In adult fish, gas exchange and oxygen uptake typically depend on the surface area of the gills, while the rate of ion exchange, including CO2 excretion controlling acid-base balance, is diffusion limited, i.e., it is proportional to the number of specialized chloride cells, ionocytes, within the gills [43,44]. Ionocytes first appear on the yolk sac during embryonic development, expanding onto the head and body before hatching. In some studies, the chorion, which surrounds fish embryos, is not a barrier to gas exchange under normoxic conditions; however, its presence may limit oxygen diffusion, particularly under hypoxia, with implications for growth [45,46,47]. After hatching, the number of ionocytes on the surface of the skin diminishes as the gills develop along with specific branchial ionocytes [44]. The gills of Menidia sp. form during early ontogenetic development, shortly after hatching. Prior to the formation of the gills, ionocytes on the skin surface may help to regulate pH under normal conditions [44]. However, this vulnerable developmental stage, coinciding with organ restructuring and transition in acid-base regulation from skin to gills, can increase vulnerability to acidification, negatively affecting a larval fish’s capacity for ion regulation during early life, with implications on survival [44]. While acidification negatively affected hatch time, survival, and length of some species in this study, exposure to low DO exerted more numerous significant effects on each of the three species tested.
Hypoxia in estuaries occurs when oxygen consumption in the water column declines below a critical partial pressure of oxygen, causing a reduced and often insufficient supply for many organisms’ energy demands and metabolic processes [41]. Previous studies have demonstrated that fishes are more vulnerable to hypoxia than bivalves and crustaceans [17,41], and all three species of fish tested here displayed acute sensitivity to low DO. Exposure to hypoxia exerted main and treatment-specific effects in reducing or elongating hatch time for Menidia spp. and C. variegatus, respectively. Low DO significantly reduced hatch success of all three species as a main or treatment-specific effect. While short-term exposure to moderately low DO is a common technique for influencing egg development and inducing hatching of late-stage embryos for various species of fish in aquaculture [48], prolonged early exposure to hypoxia throughout the incubation period can result in a higher percentage of weaker, malformed embryos, including reduced hatch length [this study [41]. Exposure of prehatch embryos to hypoxia may have greater negative effects on the survival of larvae and juveniles, compared to posthatch exposure, which has been noted in inland silverside, Atlantic herring, and cinnamon clownfish larvae and juveniles [9,49,50]. Hypoxia reduced larval survival of M. beryllina, suggesting an inability to cope with low DO during this critical period of early development, where oxygen demands are high [41]. While the negative effects of hypoxia outnumbered those attributed to acidification alone, exposure to low pH can increase sensitivity and susceptibility to low DO [25], an outcome exemplified by M. menidia, which experienced 21% and 33% larval survival under low DO and low pH, respectively, but had only 1.5% survival when exposed to both stressors. Importantly, these results come from a cohort of wild M. menidia fish eggs, whose natural survival rates can vary more than five-fold due to maternal and other factors [21,24]. Offspring sensitivity to ocean acidification changes seasonally in coastal marine fish [21]. This study captured the mid-to-late spawning period of M. menidia in New York waters from late spring (May) and summer (July), a period when these fish are typically less vulnerable to acidification [21].
The combination of continuous hypoxia and acidification reduced hatch time, success, and survival for both M. menidia and M. beryllina, while combined low pH and low DO exposure had no posthatch effects on C. variegatus. Sheepshead minnows are demersal spawners whose eggs develop on the seabed [33,41], perhaps making these early-life stages naturally more resistant to low DO and low pH, given the greater prevalence of these conditions near the sediment–water interface [51,52,53]. Additionally, hatch times of C. variegatus were extended by 60–70% (5–6 days) when exposed to acidification or hypoxia treatments. It is plausible that this extended period in the egg phase allowed these fish to more fully develop as embryos prior to hatching, making them more resistant to environmentally-unfavorable conditions as larvae. In contrast, Menidia depend on the vegetative substrate, on which to deposit their eggs, providing protection from anoxic sediments [32]; however, this may increase the sensitivity of posthatch silverside larvae to conditions of hypoxia and acidification within nursery habitats.
Interactions between hypoxia and acidification were complex. Specifically, these stressors combined to antagonistically alter hatch times in all three fish species. As previously noted, differing responses in hatch time to stressors likely represent differing early life history strategies: earlier hatch, perhaps to escape adverse conditions, in Menidia spp., vs later hatch, to extend development times in C. variegatus. The nonadditive nature of these changes may be related to the characteristics of hatch times, specifically, that there is perhaps a limit to the extent to which they can be accelerated or slowed, making the response of this trait nonadditive. In contrast, chronic low DO and pH had a synergistically negative effect on hatch success in C. variegatus, whereby embryos exposed to low DO or low pH hatched at a rate equal to or greater than the control, but the combined exposure depressed hatch success by 15%. All of these outcomes evidence the importance of exploring multiple stressors concurrently, as they can often yield nonadditive outcomes that cannot be predicted from the study of the stressors individually [36].
Diel cycling of DO and pH associated with ecosystem metabolism is a common occurrence in estuaries during summer months, coinciding with larval and juvenile fish residence in these nursery habitats [10,35,54]. Hence, continuous exposures to hypoxia and acidification may misrepresent the in situ conditions experienced by estuarine and coastal fishes [40]. In one experiment of this study, 12-h low pH and low DO resulted in a significantly lower hatch success, larval survival, and size of M. beryllina, compared to continuous reduced values of the same mean low pH and low DO, signifying that despite 12-h periods for optimal conditions, diel cycling exerted more negative effects on larval fish. In the case of M. menidia, diurnal exposure to low DO or low pH had an even more negative effect on hatch time than continuous exposure. The more severe outcomes for fish under cycling conditions compared to chronic exposure indicate that the physiological cost of adapting to large changes in pH and DO are greater than the relief provided by 12-h of ideal conditions.
Previous studies accounting for diurnal fluctuations have found similar negative effects on the survival and growth of summer flounder in response to extreme, but not moderate concentrations of diel cycling [28]. Long-term acclimation to low DO can occur, such that the critical partial pressure of oxygen and standard metabolic rate may be lower for fish under chronic low oxygen conditions, with implications for reduced growth rates [41]. One of the first physiological responses to intermittent hypoxia in fish is hyperventilation through increased opercular action [25]. Larval fish subject to changing oxygen conditions on varying diel timescales may not be able to acclimate through alterations to metabolic rate, while increased ventilation raises energy demands, and may not be a plausible strategy for larval fish. While continuous exposure to either singular or combined low pH and low DO provides a baseline for how species respond to these stressors, all of these findings emphasize that studies exploring diurnal changes provide a more realistic representation of environmental conditions that larval forage fish experience during their early-life stages [37]. The findings here were largely consistent with those of Depasquale et al. [24], who also found that Menidia spp. were more vulnerable to hypoxia and acidification than Cyprinodon variegatus. Also consistent with this prior study, low oxygen was more damaging to Menidia spp. than acidification. A key additional finding here is that the hypothesis suggested in Depasquale et al. [24], i.e., that shorter-term, diurnal exposure to low DO and low pH might mitigate negative effects on fish, should be rejected, as outcomes for fish diurnally exposed to hypoxia and acidification were equal to, or sometimes worse than, chronic exposure.
The duration of diurnal hypoxia and acidification varies seasonally and by ecosystem [7,21,28,55]. While exposures to low pH and low DO for 4 or 8 h did not affect M. beryllina hatch success and larval survival compared to ambient conditions, the 12-h duration did significantly depress these metrics. This resilience to shorter exposure periods of low pH and low DO indicates that larval fish may be able to cope with occasional or brief bouts of hypoxia and acidification. Still, as little as 8 h of exposure to low pH and low DO yielded a significant reduction in the length of M. beryllina in one experiment, and such smaller-sized fish may be even more vulnerable to adverse environmental conditions, as higher surface area to volume ratios increase diffusive processes [28]. Some species of fish cope with low DO by reducing food intake, and therefore energy, demands and O2 requirements, resulting in overall lower growth rates [41,56,57]; this effect on size may have been driven by low DO more than low pH. In contrast to M. beryllina, M. menidia experienced significantly reduced survival rates even under 4 h of exposure to low pH and low DO, indicating that this species can be highly vulnerable to diel cycling in nursery and spawning grounds. Furthermore, in the duration experiment with slightly lower DO (2.1 v 2.4 mg L−1), the M. beryllina exposed to 8- and 12-h of low DO/pH were significantly smaller than individuals receiving 4-h and no exposure, indicating that even slight changes in exposure (4 h vs 8 h) can manifest in measurable and ecologically-important changes. Reduced larval growth can affect a fish’s swimming ability, while smaller fish are more susceptible to predation [40,58].
Further research is needed to fully understand the consequences of diurnal changes of pH and DO in estuaries for early-life stage forage fish. For example, future experiments could examine diel cycling at time intervals longer and shorter than 12 h, as well as at varying intensities of reduced and low pH and DO to account for environmental conditions outside of peak summer variance. Additionally, research on generational effects from parental exposure and buffering consequences on offspring would provide insight regarding the adaptation capacity of fishes to intense eutrophication and diel cycling DO and pH. Previous studies have shown that parental exposure in A. melanopus (cinnamon clownfish) and Atlantic silverside to continuous and diurnal acidification alleviated reductions in growth of offspring; however, exposure to hypoxia was not considered [59]. Other experiments with M. menidia conducted with sequential wild larval cohorts found resilience to elevated CO2 in offspring from parental effects as the spawning season progressed from spring into summer [21,27]. Furthermore, experiments with larval fish during algal blooms and decay that drive significant changes in pH and DO may provide more realistic environmental conditions and subsequent responses in terms of success and survival.
5. Conclusions
Global climate change threatens marine ecosystems, including coastal habitats. Estuaries serve as crucial spawning and nursery grounds for forage fish, and can regularly experience diurnal fluctuations in low pH and low DO, a potential threat to fish success and survival. This study determined that hypoxia poses a greater threat than acidification to the hatch success and survival of larval silversides. Furthermore, exposure to chronic combined hypoxia and acidification, as occurs in estuaries around Long Island during the summer months coinciding with the spawning and larval development stages for these species, yielded the most significantly negative effects on all fish species studied. The negative effects of acidification and/or hypoxia were rarely ameliorated by diel cycling of these conditions, despite exposure to significantly higher pH and DO levels in these treatments. This finding indicates there is a strong physiological cost to adapting to diel cycling DO and pH. Some larval fish were capable of tolerating exposure of up to eight hours acidification and hypoxia without negative effects on hatch success and survival. Atlantic silverside, however, were sensitive to just a four-hour daily acidification and hypoxia exposure, whereas inland silverside size was reduced by 8-, but not 4-h, exposure. These finding collectively indicate that diurnally cycling pH and DO in estuaries is likely to have broad fishery, food web, and economic effects within coastal ecosystems.
Supplementary Materials
The following are available online at https://0-www-mdpi-com.brum.beds.ac.uk/1424-2818/12/1/25/s1, Table S1: Analysis of Deviance for a GLM fitted model for hatch time of Menidia menidia larvae in the seven treatment diurnal acidification and hypoxia experiments, Table S2: Two-way ANOVA results for hatch success (arcsin transformed) of Menidia menidia larvae in the seven treatment diurnal acidification and hypoxia experiments, Table S3: Two-way ANOVA results for survival (normalized to # fish hatched per vessel, arcsin transformed) of Menidia menidia larvae in the seven treatment diurnal acidification and hypoxia experiments, Table S4A-C: ANOVA analysis of Deviance for linear mixed effects model comparing model with (full) and without (null, pH, DO) treatment effects for length of Menidia menidia larvae in the seven treatment diurnal acidification and hypoxia experiments, Table S5: Analysis of Deviance for a GLM fitted model for hatch time of Cyprinodon variegatus larvae in the seven treatment diurnal acidification and hypoxia experiments, Table S6: Two-way ANOVA results for hatch success (arcsin transformed) of Cyprinodon variegatus larvae in the seven treatment diurnal acidification and hypoxia experiments, Table S7: Two-way ANOVA results for survival (normalized to # fish hatched per vessel, arcsin transformed) of Cyprinodon variegatus larvae in the seven treatment diurnal acidification and hypoxia experiments, Table S8A–C: ANOVA analysis of Deviance for linear mixed effects model comparing model with (full) and without (null, pH, DO) treatment effects for length of Cyprinodon variegatus larvae in the seven treatment diurnal acidification and hypoxia experiments, Table S9: Two-way ANOVA results for hatch time of Menidia beryllina larvae in the seven treatment diurnal acidification and hypoxia experiments, Table S10: Two-way ANOVA results for hatch success (arcsin transformed) of Menidia beryllina larvae in the seven treatment diurnal acidification and hypoxia experiments, Table S11: Two-way ANOVA results for survival (normalized to # fish hatched per vessel, arcsin transformed) of Menidia beryllina larvae in the seven treatment diurnal acidification and hypoxia experiments, Table S12A–C: ANOVA analysis of Deviance for linear mixed effects model comparing model with (full) and without (null, pH, DO) treatment effects for length of Menidia beryllina larvae in the seven treatment diurnal acidification and hypoxia experiments, Table S13: One way Anova results for hatch time of Menidia beryllina larvae in the four treatment diurnal acidification and hypoxia experiment, Table S14: One way Anova results for hatch success (arcsin transformed) of Menidia beryllina larvae in the four treatment diurnal acidification and hypoxia experiment, Table S15: One way Anova results for survival (normalized to # fish hatched per vessel, arcsin transformed) of Menidia beryllina larvae in the four treatment diurnal acidification and hypoxia experiment, Table S16: ANOVA analysis of Deviance for linear mixed effects model comparing model with (full) and without (null) treatment effects for length of Menidia beryllina larvae in the four-treatment diurnal acidification and hypoxia experiment, Table S17: One way Anova results for hatch time of Menidia beryllina I larvae in the four treatment diurnal duration acidification and hypoxia experiment, Table S18: One way Anova results for hatch success (arcsin transformed) of Menidia beryllina I larvae in the four treatment diurnal duration acidification and hypoxia experiment, Table S19: One way Anova results for survival (normalized to # fish hatched per vessel, arcsin transformed) of Menidia beryllina I larvae in the four treatment diurnal duration acidification and hypoxia experiment, Table S20: ANOVA analysis of Deviance for linear mixed effects model comparing model with (full) and without (null) treatment effects for length of Menidia beryllina I larvae in the four treatment diurnal duration acidification and hypoxia experiment, Table S21: Analysis of Deviance for GLM fitted model for hatch time of Menidia beryllina II larvae in the four treatment diurnal duration acidification and hypoxia experiment, Table S22: One way Anova results for hatch success (arcsin transformed) of Menidia beryllina II larvae in the four treatment diurnal duration acidification and hypoxia experiment, Table S23: One way Anova results for survival (normalized to # fish hatched per vessel, arcsin trasnformed) of Menidia beryllina II larvae in the four treatment diurnal duration acidification and hypoxia experiment, Table S24: ANOVA analysis of Deviance for linear mixed effects model comparing model with (full) and without (null) treatment effects for length of Menidia beryllina II larvae in the four treatment diurnal duration acidification and hypoxia experiment, Table S25: Analysis of Deviance for GLM fitted model for hatch time of Menidia menidia larvae in the four treatment diurnal duration acidification and hypoxia experiment, Table S26: One way Anova results for hatch success (arcsin transformed) of Menidia menidia larvae in the four treatment diurnal acidification duration and hypoxia experiment, Table S27: One way Anova results for survival (normalized to # fish hatched per vessel, arcsin transformed) of Menidia menidia larvae in the four treatment diurnal duration acidification and hypoxia experiment, Table S28: ANOVA analysis of Deviance for linear mixed effects model comparing model with (full) and without (null) treatment effects for length of Menidia menidia larvae in the four treatment diurnal duration acidification and hypoxia experiments.
Author Contributions
Conceptualization, B.K.M. and C.J.G.; Formal analysis, B.K.M. and C.J.G.; Funding acquisition, C.J.G.; Investigation, B.K.M.; Methodology, B.K.M. and C.J.G.; Resources, C.J.G.; Validation, B.K.M. and C.J.G.; Visualization, B.K.M. and C.J.G.; Writing—riginal draft, B.K.M. and C.J.G.; Writing—review & editing, B.K.M. and C.J.G. All authors have read and agreed to the published version of the manuscript.
Funding
This research was funded by New York Sea Grant Award R-FBM-38, as well as grants from the Laurie Landeau Foundation, the Simons Foundation, and the Chicago Community Foundation.
Acknowledgments
We are grateful for the assistance and wet lab facility support of the Southampton Marine Station staff, particularly Chris Paparo, as well as laboratory and analytical assistance from members of the Gobler Lab including Jenn Jankowiack, Andrew Lundstrom, Ryan Wallace, Mark Lusty, Darren De Silva, and Tim Curtin. We thank Drs. Steven Beaupré and Janet Nye for their helpful feedback on this manuscript.
Conflicts of Interest
The authors declare no conflict of interest. The funders had no role in the design of the study; in the collection, analyses, or interpretation of data; in the writing of the manuscript, or in the decision to publish the results.
References
- Copp, G.H.; Peňáz, M. Ecology of fish spawning and nursery zones in the flood plain, using a new sampling approach. Hydrobiologia 1988, 169, 209–224. [Google Scholar] [CrossRef]
- Hjort, J. Fluctuations in the great fisheries of northern Europe viewed in the light of biological research. Rapports et Proces-Verbaux des Réunions/Conseil Permanent International pour l’Exploration de la Mer 1914, 20, 1–228. Available online: https://core.ac.uk/download/pdf/52047619.pdf (accessed on 29 December 2019).
- Houde, E. Effects of temperature and delayed feeding on growth and survival of larvae of three species of subtropical marine fishes. Mar. Biol. 1974, 26, 271–285. [Google Scholar] [CrossRef]
- Houde, E.D. Emerging from Hjort’s Shadow. J. Northwest Atl. Fish. Sci. 2008, 41, 53–70. [Google Scholar] [CrossRef]
- Doney, S.C.; Ruckelshaus, M.; Duffy, J.E.; Barry, J.P.; Chan, F.; English, C.A.; Galindo, H.M.; Grebmeier, J.M.; Hollowed, A.B.; Knowlton, N.; et al. Climate change impacts on marine ecosystems. Annu. Rev. Mar. Sci. 2012, 4, 11–37. [Google Scholar] [CrossRef] [Green Version]
- Breitburg, D.; Levin, L.A.; Oschlies, A.; Grégoire, M.; Chavez, F.P.; Conley, D.J.; Garçon, V.; Gilbert, D.; Guitérrez, D.; Isensee, K.; et al. Declining oxygen in the global ocean and coastal waters. Science 2018, 359, eaam7240. [Google Scholar] [CrossRef] [PubMed] [Green Version]
- Baumann, H.; Wallace, R.B.; Tagliaferri, T. Large Natural pH, CO2 and O2 Fluctuations in a Temperate Tidal Salt Marsh on Diel, Seasonal, and Interannual Time Scales. Estuar. Coasts 2014, 38, 220–231. [Google Scholar] [CrossRef]
- Portner, H.O.; Peck, M.A. Climate change effects on fishes and fisheries: Towards a cause-and-effect understanding. J. Fish. Biol. 2010, 77, 1745–1779. [Google Scholar] [CrossRef]
- Baumann, H.; Smith, E.M. Quantifying Metabolically Driven pH and Oxygen Fluctuations in US Nearshore Habitats at Diel to Interannual Time Scales. Estuar. Coasts 2017, 41, 1102–1117. [Google Scholar] [CrossRef]
- Wallace, R.B.; Baumann, H.; Grear, J.S.; Aller, R.C.; Gobler, C.J. Coastal ocean acidification: The other eutrophication problem. Estuar. Coast. Shelf. Sci. 2014, 148, 1–13. [Google Scholar] [CrossRef]
- Waldbusser, G.G.; Salisbury, J.E. Ocean acidification in the coastal zone from an organism’s perspective: Multiple system parameters, frequency domains, and habitats. Annu. Rev. Mar. Sci. 2014, 6, 221–247. [Google Scholar] [CrossRef] [PubMed]
- Gobler, C.J.; Baumann, H. Hypoxia and acidification in ocean ecosystems: Coupled dynamics and effects on marine life. Biol. Lett. 2016, 12, 20150976. [Google Scholar] [CrossRef] [PubMed] [Green Version]
- First, P.J. Global Warming of 1.5 °C An IPCC Special Report on the Impacts of Global Warming of 1.5 °C above Pre-Industrial Levels and Related Global Greenhouse Gas Emission Pathways, in the Context of Strengthening the Global Response to the Threat of Climate Change, Sustainable Development, and Efforts to Eradicate Poverty; World Meterological Organization: Geneva, Switzerland, 2018. [Google Scholar]
- Sunda, W.G.; Cai, W.J. Eutrophication induced CO2-acidification of subsurface coastal waters: Interactive effects of temperature, salinity, and atmospheric PCO2. Environ. Sci. Technol. 2012, 46, 10651–10659. [Google Scholar] [CrossRef] [PubMed]
- Melzner, F.; Thomsen, J.; Koeve, W.; Oschlies, A.; Gutowska, M.A.; Bange, H.W.; Hansen, H.P.; Kortzinger, A. Future ocean acidification will be amplified by hypoxia in coastal habitats. Mar. Biol. 2013, 160, 1875–1888. [Google Scholar] [CrossRef]
- Diaz, R.J.; Rosenberg, R. Marine benthic hypoxia: A review of its ecological effects and the behavioural responses of benthic macrofauna. Oceanogr. Mar. Biol. Annu. Rev. 1995, 33, 245–303. [Google Scholar]
- Vaquer-Sunyer, R.; Duarte, C.M. Thresholds of hypoxia for marine biodiversity. Proc. Natl. Acad. Sci. USA 2008, 105, 15452–15457. [Google Scholar] [CrossRef] [Green Version]
- Frommel, A.Y.; Schubert, A.; Piatkowski, U.; Clemmesen, C. Egg and early larval stages of Baltic cod, Gadus morhua, are robust to high levels of ocean acidification. Mar. Biol. 2012, 160, 1825–1834. [Google Scholar] [CrossRef]
- Hurst, T.P.; Fernandez, E.R.; Mathis, J.T. Effects of ocean acidification on hatch size and larval growth of walleye pollock (Theragra chalcogramma). ICES J. Mar. Sci. 2013, 70, 812–822. [Google Scholar] [CrossRef] [Green Version]
- Baumann, H.; Talmage, S.C.; Gobler, C.J. Reduced early life growth and survival in a fish in direct response to increased carbon dioxide. Nat. Clim. Chang. 2011, 2, 38–41. [Google Scholar] [CrossRef]
- Murray, C.M.; Malvezzi, A.; Gobler, C.J.; Baumann, H. Offspring sensitivity to ocean acidification changes seasonally in a coastal marine fish. Mar. Ecol. Prog. Ser. 2014, 504, 1–11. [Google Scholar] [CrossRef] [Green Version]
- Chambers, R.C.; Candelmo, A.C.; Habeck, E.A.; Poach, M.E.; Wieczorek, D.; Cooper, K.R.; Greenfield, C.E.; Phelan, B.A. Effects of elevated CO2 in the early life stages of summer flounder, Paralichthys dentatus, and potential consequences of ocean acidification. Biogeosciences 2014, 11, 1613–1626. [Google Scholar] [CrossRef] [Green Version]
- Stiasny, M.H.; Mittermayer, F.H.; Sswat, M.; Voss, R.; Jutfelt, F.; Chierici, M.; Puvanendran, V.; Mortensen, A.; Reusch, T.B.H.; Clemmesen, C. Ocean Acidification Effects on Atlantic Cod Larval Survival and Recruitment to the Fished Population. PLoS ONE 2016, 11, e0155448. [Google Scholar] [CrossRef] [PubMed] [Green Version]
- DePasquale, E.; Baumann, H.; Gobler, C.J. Vulnerability of early life stage Northwest Atlantic forage fish to ocean acidification and low oxygen. Mar. Ecol. Prog. Ser. 2015, 523, 145–156. [Google Scholar] [CrossRef] [Green Version]
- Miller, S.H.; Breitburg, D.L.; Burrell, R.B.; Keppel, A.G. Acidification increases sensitivity to hypoxia in important forage fishes. Mar. Ecol. Prog. Ser. 2016, 549, 1–8. [Google Scholar] [CrossRef] [Green Version]
- Wootton, J.T.; Pfister, C.A.; Forester, J.D. Dynamic patterns and ecological impacts of declining ocean pH in a high-resolution multi-year dataset. Proc. Natl. Acad. Sci. USA 2008, 105, 18848–18853. [Google Scholar] [CrossRef] [PubMed] [Green Version]
- Murray, C.; Baumann, H. You Better Repeat It: Complex CO2 × Temperature Effects in Atlantic Silverside Offspring Revealed by Serial Experimentation. Diversity 2018, 10, 69. [Google Scholar] [CrossRef] [Green Version]
- Davidson, M.I.; Targett, T.E.; Grecay, P.A. Evaluating the effects of diel-cycling hypoxia and pH on growth and survival of juvenile summer flounder Paralichthys dentatus. Mar. Ecol. Prog. Ser. 2016, 556, 223–235. [Google Scholar] [CrossRef]
- Dixon, R.L.; Grecay, P.A.; Targett, T.E. Responses of juvenile Atlantic silverside, striped killifish, mummichog, and striped bass to acute hypoxia and acidification: Aquatic surface respiration and survival. J. Exp. Mar. Biol. Ecol. 2017, 493, 20–30. [Google Scholar] [CrossRef]
- Weber, C.I.; Middaugh, D.P.; Hemmer, M.J.; Goodman, L.R. Methods for Measuring the Acute Toxicity of Effluents and Receiving Waters to Freshwater and Marine Organisms; Environmental Monitoring Systems Laboratory, Office of Research and Development, US Environmental Protection Agency: Cincinnati, OH, USA, 1991. [Google Scholar]
- Middaugh, D.P.; Hemmer, M.J. Reproductive ecology of the inland silverside, Menidia beryllina, (Pisces: Atherinidae) from Blackwater Bay, Florida. Copeia 1992, 1, 53–61. [Google Scholar] [CrossRef]
- Middaugh, D.P.; Scott, G.I.; Dean, J.M. Reproductive behavior of the Atlantic silverside, Menidia menidia (Pisces, Atherinidae). Environ. Biol. Fish. 1981, 6, 269–276. [Google Scholar] [CrossRef]
- Chitty, J.D.; Able, K.W. Habitat use, movements and growth of the sheepshead minnow, Cyprinodon variegatus, in a restored salt marsh in Delaware Bay. Bull. N. J. Acad. Sci. 2004, 49, 1–9. [Google Scholar]
- Pikitch, E.K.; Rountos, K.J.; Essington, T.E.; Santora, C.; Pauly, D.; Watson, R.; Sumaila, U.R.; Boersma, P.D.; Boyd, I.L.; Conover, D.O.; et al. The global contribution of forage fish to marine fisheries and ecosystems. Fish Fish. 2014, 15, 43–64. [Google Scholar] [CrossRef]
- Heuer, R.M.; Grosell, M. Physiological impacts of elevated carbon dioxide and ocean acidification on fish. Am. J. Physiol. Regul. Integr. Comp. Physiol. 2014, 307, R1061–R1084. [Google Scholar] [CrossRef] [PubMed] [Green Version]
- Gobler, C.J.; DePasquale, E.L.; Griffith, A.W.; Baumann, H. Hypoxia and acidification have additive and synergistic negative effects on the growth, survival, and metamorphosis of early life stage bivalves. PLoS ONE 2014, 9, e83648. [Google Scholar] [CrossRef] [Green Version]
- Clark, H.R.; Gobler, C.J. Diurnal fluctuations in CO2 and dissolved oxygen concentrations do not provide a refuge from hypoxia and acidification for early-life-stage bivalves. Mar. Ecol. Prog. Ser. 2016, 558, 1–14. [Google Scholar] [CrossRef] [Green Version]
- Millero, F.J. Carbonate constants for estuarine waters. Mar. Freshw. Res. 2010, 61, 139–142. [Google Scholar] [CrossRef]
- Munday, P.L.; Gagliano, M.; Donelson, J.M.; Dixon, D.L.; Thorrold, S.R. Ocean acidification does not affect the early life history development of a tropical marine fish. Mar. Ecol. Prog. Ser. 2011, 423, 211–221. [Google Scholar] [CrossRef] [Green Version]
- Cattano, C.; Claudet, J.; Domenici, P.; Milazzo, M. Living in a high CO2 world: A global meta-analysis shows multiple trait-mediated fish responses to ocean acidification. Ecol. Monog. 2018, 88, 320–335. [Google Scholar] [CrossRef]
- Ekau, W.; Auel, H.; Pörtner, H.O.; Gilbert, D. Impacts of hypoxia on the structure and processes in pelagic communities (zooplankton, macro-invertebrates and fish). Biogeosciences 2010, 7, 1669–1699. [Google Scholar] [CrossRef] [Green Version]
- Bignami, S.; Sponaugle, S.; Hauff, M.; Cowen, R.K. Combined effects of elevated pCO2, temperature, and starvation stress on larvae of a large tropical marine fish. ICES J. Mar. Sci. 2017, 74, 1220–1229. [Google Scholar] [CrossRef]
- Esbaugh, A.J. Physiological implications of ocean acidification for marine fish: Emerging patterns and new insights. J. Comp. Physiol. B 2018, 188, 1–13. [Google Scholar] [CrossRef] [PubMed]
- Rombough, P. The gill of fish larvae. Is it primarily a respiratory or an ionoregulatory structure? J. Fish Biol. 1999, 55, 186–204. [Google Scholar] [CrossRef]
- Ciuhandu, C.; Stevens, E.D.; Wright, P. The effect of oxygen on the growth of Oncorhynchus mykiss embryos with and without a chorion. J. Fish Biol. 2005, 67, 1544–1551. [Google Scholar] [CrossRef] [Green Version]
- Ciuhandu, C.S.; Wright, P.A.; Goldberg, J.I.; Stevens, E.D. Parameters influencing the dissolved oxygen in the boundary layer of rainbow trout (Oncorhynchus mykiss) embryos and larvae. J. Exp. Biol. 2007, 210, 1435–1445. [Google Scholar] [CrossRef] [PubMed] [Green Version]
- Hwang, P.P.; Lee, T.H. New insights into fish ion regulation and mitochondrion-rich cells. Comp. Biochem. Physiol. A Mol. Integr. Physiol. 2007, 148, 479–497. [Google Scholar] [CrossRef]
- Oppen-Berntsen, D.O.; Bogsnes, A.; Walther, B.T. The effects of hypoxia, alkalinity and neurochemicals on hatching of Atlantic salmon (Salmo salar) eggs. Aquaculture 1990, 86, 417–430. [Google Scholar] [CrossRef]
- Franke, A.; Clemmesen, C. Effect of ocean acidification on early life stages of Atlantic herring (Clupea harengus L.). Biogeosciences 2011, 8, 3697–3707. [Google Scholar] [CrossRef] [Green Version]
- Miller, G.M.; Watson, S.A.; Donelson, J.M.; McCormick, M.I.; Munday, P.L. Parental environment mediates impacts of increased carbon dioxide on a coral reef fish. Nat. Clim. Chang. 2012, 2, 858–861. [Google Scholar] [CrossRef]
- Green, M.A.; Aller, R.C.; Aller, J.Y. Carbonate dissolution and temporal abundances of foraminifera in Long Island Sound sediments. Limnol. Oceanog. 1993, 38, 331–345. [Google Scholar] [CrossRef]
- Green, M.A.; Waldbusser, G.G.; Reilly, S.L.; Emerson, K.; O’Donnell, S. Death by dissolution: Sediment saturation state as a mortality factor for juvenile bivalves. Limnol. Oceanog. 2009, 54, 1037–1047. [Google Scholar] [CrossRef] [Green Version]
- Mackin, J.E.; Swider, K.T. Organic matter decomposition pathways and oxygen consumption in coastal marine sediments. J. Mar. Res. 1989, 47, 681–716. [Google Scholar] [CrossRef]
- Koenigstein, S.; Mark, F.C.; Gößling-Reisemann, S.; Reuter, H.; Poertner, H.O. Modelling climate change impacts on marine fish populations: Process-based integration of ocean warming, acidification and other environmental drivers. Fish Fish. 2016, 17, 972–1004. [Google Scholar] [CrossRef]
- Tyler, R.M.; Targett, T.E. Juvenile weakfish Cynoscion regalis distribution in relation to diel-cycling dissolved oxygen in an estuarine tributary. Mar. Ecol. Prog. Ser. 2007, 333, 257–269. [Google Scholar] [CrossRef] [Green Version]
- Boeuf, G.; Boujard, D.; Ruyet, J.P.L. Control of the somatic growth in turbot. J. Fish Biol. 1999, 55, 128–147. [Google Scholar] [CrossRef]
- Pichavant, K. Comparative effects of long-term hypoxia on growth, feeding and oxygen consumption in juvenile turbot and European sea bass. J. Fish Biol. 2001, 59, 875–883. [Google Scholar] [CrossRef]
- Miller, T.J.; Crowder, L.B.; Rice, J.A.; Marschall, E.A. Larval Size and Recruitment Mechanisms in Fishes: Toward a Conceptual Framework. Can. J. Fish. Aquat. Sci. 1988, 45, 1657–1670. [Google Scholar] [CrossRef] [Green Version]
- Jarrold, M.D.; Munday, P.L. Diel CO2 cycles and parental effects have similar benefits to growth of a coral reef fish under ocean acidification. Biol. Lett. 2019, 15, 20180724. [Google Scholar] [CrossRef] [Green Version]
Figure 1.
Hatch time (A), hatch success (B), survival (C), and length (D) of Menidia menidia larvae in the seven treatment diurnal acidification and hypoxia experiments (Table 2 and Tables S1–S4). Bars represent the mean (n = 4) for each treatment. Error bars represent standard error of the mean (n = 4). Letters on bars represent significant differences among groups as determined by Tukey Honest Significance Difference tests.

Figure 2.
Hatch time (A), hatch success (B), survival (C), and length (D) of Cyprinodon variegatus larvae in the seven treatment diurnal acidification and hypoxia experiments (Table 3 and Tables S5–S8). Bars represent the mean (n = 4) for each treatment. Error bars represent standard error of the mean (n = 4). Letters on bars represent significant differences among groups as determined by Tukey Honest Significance Difference tests.

Figure 3.
Hatch time (A), hatch success (B), survival (C), and length (D) of Menidia beryllina larvae in the seven treatment diurnal acidification and hypoxia experiments (Table 4 and Tables S9–S12) Bars represent the mean (n = 4) for each treatment. Error bars represent standard error of the mean (n = 4). Letters on bars represent significant differences among groups as determined by Tukey Honest Significance Difference tests.

Figure 4.
Hatch time (A), hatch success (B), survival (C), and length (D) of Menidia beryllina larvae in the four treatment diurnal acidification and hypoxia experiments (Table 5 and Tables S13–S16) Bars represent the mean (n = 3, 4, 4, 4) for each treatment. Error bars represent standard error of the mean (n = 3, 4, 4, 4). Letters on bars represent significant differences among groups as determined by Tukey Honest Significance Difference tests.

Figure 5.
Hatch time (A), hatch success (B), survival (C), and length (D) of Menidia beryllina I larvae in the four treatment diurnal duration acidification and hypoxia experiment (Table 6 and Tables S17–S20) Bars represent the mean (n = 3) for each treatment. Error bars represent standard error of the mean (n = 3). Letters on bars represent significant differences among groups as determined by Tukey Honest Significance Difference tests.

Figure 6.
Hatch time (A), hatch success (B), survival (C), and length (D) of Menidia beryllina II larvae in the four treatment diurnal duration acidification and hypoxia experiment (Table 7 and Tables S21–S24) Bars represent the mean (n = 4) for each treatment. Error bars represent standard error of the mean (n = 4). Letters on bars represent significant differences among groups as determined by Tukey Honest Significance Difference tests.

Figure 7.
Hatch time (A), hatch success (B), survival (C), and length (D) of Menidia menidia larvae in the four treatment diurnal duration acidification and hypoxia experiment (Table 8 and Tables S25–S28) Bars represent the mean (n = 4) for each treatment. Error bars represent standard error of the mean (n = 4). Letters on bars represent significant differences among groups as determined by Tukey Honest Significance Difference tests.


Table 1.
Summary of experiments with treatments, species used, and statistically significant effects; downward arrows indicate a corresponding reduction and upward arrows an increase of the measured response metric listed.
Table 1.
Summary of experiments with treatments, species used, and statistically significant effects; downward arrows indicate a corresponding reduction and upward arrows an increase of the measured response metric listed.
| Experiment | Species | Significant Effects | |||
|---|---|---|---|---|---|
| Hatch Time (days) | Hatch Success (%) | Survival (%) | Size (mm) | ||
| Seven treatments: control chronic low DO diurnal low DO chronic low pH diurnal low pH chronic low pH/DO diurnal low pH/DO | M.menidia | diurnal low pH ↓ diurnal low DO ↓ | diurnal and chronic low DO ↓ diurnal and chronic low pH/DO ↓ | chronic low pH/DO ↓ | |
| C. variegatus | chronic low pH ↑ diurnal and chronic low DO ↑ diurnal and chronic low pH/DO ↑ | ||||
| M. beryllina | chronic low pH ↓ chronic low pH/DO ↓ | chronic low DO ↓ diurnal and chronic low pH/DO ↓ | chronic low DO ↓ chronic low pH/DO ↓ | ||
| Four treatments: control chronic low pH/DO diurnal (12 h) low pH/DO chronic reduced pH/DO | M. beryllina | diurnal low pH/DO ↓ chronic low pH/DO ↓ | chronic low pH/DO ↓ | ||
| Four treatment diurnal durations: control 4 h low pH/DO 8 h low pH/DO 12 h low pH/DO | M. beryllina | 12 h ↓ | 12 h ↓ | 8 h ↓ 12 h ↓ | |
| M. beryllina | 12 h ↓ | ||||
| M. menidia | 4 h ↓ 8 h ↓ 12 h ↓ | 4 h ↑ | |||
Table 2.
Mean (± standard deviation) pH, pCO2, saturation states of calcite and aragonite, total dissolved inorganic carbon (TDIC), carbonate, total alkalinity (TA), salinity, dissolved oxygen, and temperature for the Menidia menidia seven treatment diurnal acidification and hypoxia experiments.
Table 2.
Mean (± standard deviation) pH, pCO2, saturation states of calcite and aragonite, total dissolved inorganic carbon (TDIC), carbonate, total alkalinity (TA), salinity, dissolved oxygen, and temperature for the Menidia menidia seven treatment diurnal acidification and hypoxia experiments.
| Parameter | Continuous | Diurnal pH | Diurnal DO | Diurnal pH/DO | |||||||||
|---|---|---|---|---|---|---|---|---|---|---|---|---|---|
| Control | Low pH | Low DO | Low pH/DO | Ambient | Low | Mean | Ambient | Low | Mean | Ambient | Low | Mean | |
| pHT daily chem | 7.85 ± 0.05 | 7.20 ± 0.08 | 7.84 ± 0.06 | 7.25 ± 0.07 | 7.64 ± 0.09 | 7.28 ± 0.12 | 7.50 ± 0.21 | 7.84 ± 0.07 | 7.87 ± 0.04 | 7.85 ± 0.06 | 7.68 ± 0.10 | 7.35 ± 0.11 | 7.55 ± 0.19 |
| pCO2 (µatm) | 407 ± 73 | 2255 ± 420 | 406 ± 30 | 1935 ± 124 | 714 ± 390 | 2110 ± 394 | 1412 ± 830 | 416 ± 20 | 468 ± 41 | 442 ± 41 | 443 ± 87 | 1433 ± 622 | 938 ± 670 |
| Ω calcite | 1.66 ± 0.34 | 0.38 ± 0.04 | 1.82 ± 0.26 | 0.49 ± 0.13 | 1.30 ± 0.57 | 0.36 ± 0.08 | 0.83 ± 0.63 | 1.70 ± 0.09 | 1.66 ± 0.26 | 1.68 ± 0.18 | 1.72 ± 0.34 | 0.62 ± 0.22 | 1.17 ± 0.64 |
| Ω aragonite | 1.1 ± 0.26 | 0.3 ± 0.03 | 1.2 ± 0.22 | 0.3 ± 0.07 | 0.9 ± 0.41 | 0.2 ± 0.06 | 0.6 ± 0.44 | 1.1 ± 0.10 | 1.1 ± 0.21 | 1.1 ± 0.15 | 1.2 ± 0.27 | 0.4 ± 0.13 | 0.8 ± 0.44 |
| TDIC (µmol L−1) | 1177 ± 110 | 1329 ± 33 | 1244 ± 82 | 1379 ± 129 | 1253 ± 35 | 1243 ± 39 | 1248 ± 34 | 1217 ± 41 | 1267 ± 87 | 1242 ± 68 | 1244 ± 55 | 1270 ± 135 | 1257 ± 97 |
| CO32− (µmol L−1) | 67.5 ± 14.8 | 15.6 ± 1.8 | 74.2 ± 11.8 | 19.8 ± 4.8 | 53.1 ± 24.1 | 14.8 ± 3.4 | 33.9 ± 25.9 | 69.2 ± 4.8 | 67.6 ± 11.6 | 68.4 ± 8.3 | 69.8 ± 15.0 | 25.0 ± 8.5 | 47.4 ± 26.5 |
| TA (µmol L−1) | 1283 ± 124 | 1287 ± 22 | 1358 ± 95 | 1354 ± 138 | 1322 ± 37 | 1206 ± 54 | 1264 ± 75 | 1324 ± 45 | 1368 ± 100 | 1346 ± 75 | 1350 ± 73 | 1271 ± 110 | 1310 ± 96 |
| Salinity | 28.46 ± 0.0 | 28.46 ± 0.0 | 28.46 ± 0.0 | 28.46 ± 0.0 | 28.46 ± 0.0 | 28.46 ± 0.0 | 28.46 ± 0.0 | 28.46 ± 0.0 | 28.46 ± 0.0 | 28.46 ± 0.0 | 28.46 ± 0.0 | 28.46 ± 0.0 | 28.46 ± 0.0 |
| Dissolved Oxygen (µM) | 6.83 ± 0.28 | 6.77 ± 0.28 | 2.82 ± 0.45 | 2.42 ± 0.64 | 6.69 ± 0.15 | 6.76 ± 0.27 | 6.72 ± 0.21 | 6.63 ± 0.20 | 3.17 ± 1.91 | 5.19 ± 2.11 | 6.63 ± 0.64 | 3.22 ± 1.96 | 5.18 ± 2.18 |
| Temperature (°C) | 23.2 ± 0.4 | 23.2 ± 0.4 | 23.2 ± 0.4 | 23.2 ± 0.4 | 23.2 ± 0.4 | 23.2 ± 0.4 | 23.2 ± 0.4 | 23.2 ± 0.4 | 23.2 ± 0.4 | 23.2 ± 0.4 | 23.2 ± 0.4 | 23.2 ± 0.4 | 23.2 ± 0.4 |
Table 3.
Mean (± standard deviation) pH, pCO2, saturation states of calcite and aragonite, total dissolved inorganic carbon (TDIC), carbonate, total alkalinity (TA), salinity, dissolved oxygen, and temperature for the Cyprinodon variegatus seven treatment diurnal acidification and hypoxia experiments.
| Parameter | Continuous | Diurnal pH | Diurnal DO | Diurnal pH/DO | |||||||||
|---|---|---|---|---|---|---|---|---|---|---|---|---|---|
| Control | Low pH | Low DO | Low pH/DO | Ambient | Low | Mean | Ambient | Low | Mean | Ambient | Low | Mean | |
| pHT daily chem | 7.67 ± 0.15 | 7.08 ± 0.12 | 7.74 ± 0.07 | 7.17 ± 0.07 | 7.57 ± 0.19 | 7.27 ± 0.19 | 7.37 ± 0.23 | 7.74 ± 0.05 | 7.71 ± 0.12 | 7.72 ± 0.11 | 7.65 ± 0.13 | 7.37 ± 0.18 | 7.46 ± 0.21 |
| pCO2 (µatm) | 528 ± 96 | 2152 ± 1001 | 519 ± 113 | 1652 ± 658 | 1453 ± 1112 | 1911 ± 899 | 1682 ± 968 | 707 ± 320 | 1046 ± 1040 | 876 ± 735 | 1752 ± 993 | 1413 ± 1762 | 1582 ± 1336 |
| Ω calcite | 1.51 ± 0.24 | 0.68 ± 0.60 | 1.65 ± 0.20 | 0.79 ± 0.44 | 0.85 ± 0.44 | 0.73 ± 0.74 | 0.79 ± 0.56 | 1.33 ± 0.35 | 1.26 ± 0.57 | 1.29 ± 0.44 | 0.62 ± 0.22 | 1.25 ± 0.68 | 0.93 ± 0.58 |
| Ω aragonite | 1.0 ± 0.16 | 0.4 ± 0.39 | 1.1 ± 0.13 | 0.5 ± 0.28 | 0.5 ± 0.28 | 0.5 ± 0.48 | 0.5 ± 0.37 | 0.9 ± 0.23 | 0.8 ± 0.37 | 0.8 ± 0.29 | 0.4 ± 0.14 | 0.8 ± 0.44 | 0.6 ± 0.38 |
| TDIC (µmol L−1) | 1266 ± 196 | 1424 ± 81 | 1301 ± 146 | 1472 ± 65 | 1348 ± 109 | 1338 ± 148 | 1343 ± 120 | 1290 ± 119 | 1317 ± 145 | 1303 ± 124 | 1352 ± 219 | 1355 ± 174 | 1354 ± 183 |
| CO32− (µmol L−1) | 60.7 ± 9.9 | 27.1 ± 24.0 | 66.2 ± 8.0 | 31.7 ± 17.7 | 34.0 ± 17.6 | 29.3 ± 29.6 | 31.7 ± 22.7 | 53.3 ± 13.9 | 50.4 ± 22.9 | 51.9 ± 17.6 | 24.7 ± 8.8 | 50.2 ± 27.5 | 37.5 ± 23.3 |
| TA (µmol L−1) | 1357 ± 201 | 1405 ± 129 | 1400 ± 145 | 1475 ± 51 | 1364 ± 79 | 1331 ± 201 | 1348 ± 143 | 1363 ± 83 | 1374 ± 109 | 1368 ± 90 | 1343 ± 177 | 1400 ± 139 | 1372 ± 150 |
| Salinity | 31.9 ± 2.1 | 31.9 ± 2.1 | 31.9 ± 2.1 | 31.9 ± 2.1 | 31.9 ± 2.1 | 31.9 ± 2.1 | 31.9 ± 2.1 | 31.9 ± 2.1 | 31.9 ± 2.1 | 31.9 ± 2.1 | 31.9 ± 2.1 | 31.9 ± 2.1 | 31.9 ± 2.1 |
| Dissolved Oxygen (µM) | 6.78 ± 0.54 | 6.64 ± 0.61 | 2.74 ± 0.44 | 2.29 ± 0.49 | 6.79 ± 0.68 | 6.51 ± 0.57 | 6.60 ± 0.61 | 6.85 ± 0.60 | 4.35 ± 1.75 | 5.13 ± 1.89 | 7.17 ± 0.40 | 5.04 ± 1.90 | 5.71 ± 1.90 |
| Temperature (°C) | 22.8 ± 1.0 | 22.8 ± 1.0 | 22.8 ± 1.0 | 22.8 ± 1.0 | 22.8 ± 1.0 | 22.8 ± 1.0 | 22.8 ± 1.0 | 22.8 ± 1.0 | 22.8 ± 1.0 | 22.8 ± 1.0 | 22.8 ± 1.0 | 22.8 ± 1.0 | 22.8 ± 1.0 |
Table 4.
Mean (± standard deviation) pH, pCO2, saturation states of calcite and aragonite, total dissolved inorganic carbon (TDIC), carbonate, total alkalinity (TA), salinity, dissolved oxygen, and temperature for the Menidia beryllina seven treatment diurnal acidification and hypoxia experiments.
Table 4.
Mean (± standard deviation) pH, pCO2, saturation states of calcite and aragonite, total dissolved inorganic carbon (TDIC), carbonate, total alkalinity (TA), salinity, dissolved oxygen, and temperature for the Menidia beryllina seven treatment diurnal acidification and hypoxia experiments.
| Parameter | Continuous | Diurnal pH | Diurnal DO | Diurnal pH/DO | |||||||||
|---|---|---|---|---|---|---|---|---|---|---|---|---|---|
| Control | Low pH | Low DO | Low pH/DO | Ambient | Low | Mean | Ambient | Low | Mean | Ambient | Low | Mean | |
| pHT daily chem | 7.78 ± 0.06 | 7.19 ± 0.16 | 7.83 ± 0.05 | 7.27 ± 0.13 | 7.65 ± 0.11 | 7.23 ± 0.02 | 7.62 ± 0.16 | 7.80 ± 0.04 | 7.81 ± 0.02 | 7.80 ± 0.04 | 7.68 ± 0.07 | 7.49 ± 0.03 | 7.66 ± 0.09 |
| pCO2 (µatm) | 313 ± 111 | 2885 ± 462 | 317 ± 130 | 2376 ± 886 | 442 ± 81 | 892 ± 87 | 742 ± 245 | 383 ± 144 | 451 ± 154 | 428 ± 140 | 435 ± 102 | 636 ± 190 | 569 ± 186 |
| Ω calcite | 2.02 ± 0.05 | 0.38 ± 0.06 | 2.08 ± 0.09 | 0.33 ± 0.04 | 2.09 ± 0.37 | 1.17 ± 0.16 | 1.48 ± 0.52 | 2.14 ± 0.51 | 1.84 ± 0.30 | 1.94 ± 0.36 | 1.88 ± 0.14 | 1.27 ± 0.30 | 1.47 ± 0.39 |
| Ω aragonite | 1.3 ± 0.03 | 0.2 ± 0.04 | 1.4 ± 0.06 | 0.2 ± 0.02 | 1.4 ± 0.24 | 0.8 ± 0.10 | 1.0 ± 0.34 | 1.4 ± 0.33 | 1.2 ± 0.20 | 1.3 ± 0.24 | 1.2 ± 0.09 | 0.8 ± 0.19 | 1.0 ± 0.25 |
| TDIC (µmol L−1) | 1140 ± 198 | 1464 ± 38 | 1158 ± 212 | 1255 ± 311 | 1353 ± 19 | 1413 ± 40 | 1393 ± 45 | 1260 ± 93 | 1260 ± 132 | 1260 ± 111 | 1287 ± 94 | 1249 ± 132 | 1262 ± 112 |
| CO32- (µmol L−1) | 82.2 ± 2.1 | 15.4 ± 2.5 | 84.7 ± 4.0 | 13.3 ± 1.5 | 84.9 ± 15.0 | 47.6 ± 6.5 | 60.0 ± 21.0 | 86.7 ± 20.7 | 74.7 ± 12.5 | 78.7 ± 14.7 | 76.3 ± 6.1 | 51.8 ± 12.0 | 59.9 ± 15.9 |
| TA (µmol L−1) | 1284 ± 183 | 1405 ± 25 | 1305 ± 191 | 1208 ± 284 | 1486 ± 9 | 1469 ± 47 | 1474 ± 38 | 1403 ± 49 | 1380 ± 106 | 1388 ± 85 | 1409 ± 76 | 1323 ± 133 | 1352 ± 117 |
| Salinity | 31.7 ± 0.3 | 31.7 ± 0.3 | 31.7 ± 0.3 | 31.7 ± 0.3 | 31.7 ± 0.3 | 31.7 ± 0.3 | 31.7 ± 0.3 | 31.7 ± 0.3 | 31.7 ± 0.3 | 31.7 ± 0.3 | 31.7 ± 0.3 | 31.7 ± 0.3 | 31.7 ± 0.3 |
| Dissolved Oxygen (µM) | 6.91 ± 0.14 | 6.78 ± 0.25 | 2.11 ± 0.33 | 2.44 ± 0.56 | 6.33 ± 1.43 | 6.76 ± 0.02 | 6.37 ± 1.36 | 6.75 ± 0.27 | 2.23 ± 0.53 | 6.34 ± 1.35 | 6.78 ± 0.26 | 2.82 ± 0.64 | 6.40 ± 1.20 |
| Temperature (°C) | 22.8 ± 0.5 | 22.8 ± 0.5 | 22.8 ± 0.5 | 22.8 ± 0.5 | 22.8 ± 0.5 | 22.8 ± 0.5 | 22.8 ± 0.5 | 22.8 ± 0.5 | 22.8 ± 0.5 | 22.8 ± 0.5 | 22.8 ± 0.5 | 22.8 ± 0.5 | 22.8 ± 0.5 |
Table 5.
Mean (± standard deviation) pH, pCO2, saturation states of calcite and aragonite, total dissolved inorganic carbon (TDIC), carbonate, total alkalinity (TA), salinity, dissolved oxygen, and temperature for the Menidia beryllina four treatment diurnal acidification and hypoxia experiments.
Table 5.
Mean (± standard deviation) pH, pCO2, saturation states of calcite and aragonite, total dissolved inorganic carbon (TDIC), carbonate, total alkalinity (TA), salinity, dissolved oxygen, and temperature for the Menidia beryllina four treatment diurnal acidification and hypoxia experiments.
| Parameter | Continuous | Diurnal pH/DO | ||||
|---|---|---|---|---|---|---|
| Control | Reduced pH/DO | Low pH/DO | Ambient | Low | Mean | |
| pHT daily chem | 7.89 ± 0.07 | 7.43 ± 0.08 | 7.16 ± 0.07 | 7.82 ± 0.05 | 7.32 ± 0.06 | 7.56 ± 0.25 |
| pCO2 (µatm) | 357 ± 57 | 1271 ± 371 | 2368 ± 407 | 422 ± 71 | 818 ± 151 | 620 ± 238 |
| Ω calcite | 2.22 ± 0.54 | 0.88 ± 0.05 | 0.40 ± 0.03 | 2.18 ± 0.87 | 1.03 ± 0.06 | 1.61 ± 0.84 |
| Ω aragonite | 1.5 ± 0.31 | 0.6 ± 0.05 | 0.3 ± 0.01 | 1.5 ± 0.54 | 0.7 ± 0.03 | 1.1 ± 0.54 |
| TDIC (µmol L−1) | 1286 ± 59 | 1480 ± 159 | 1399 ± 130 | 1357 ± 161 | 1303 ± 112 | 1330 ± 132 |
| CO32− (µmol L−1) | 93.9 ± 17.6 | 37.5 ± 4.0 | 17.2 ± 0.5 | 91.8 ± 32.0 | 44.1 ± 2.4 | 68.0 ± 33.0 |
| TA (µmol L−1) | 1437 ± 83 | 1505 ± 143 | 1358 ± 117 | 1498 ± 210 | 1357 ± 106 | 1427 ± 172 |
| Salinity | 31.8 ± 0.6 | 31.8 ± 0.6 | 31.8 ± 0.6 | 31.8 ± 0.6 | 31.8 ± 0.6 | 31.8 ± 0.6 |
| Dissolved Oxygen (µM) | 6.83 ± 0.26 | 4.81 ± 0.22 | 2.47 ± 0.33 | 6.87 ± 0.34 | 2.17 ± 0.52 | 4.44 ± 2.39 |
| Temperature (°C) | 23.2 ± 0.6 | 23.2 ± 0.6 | 23.2 ± 0.6 | 23.2 ± 0.6 | 23.2 ± 0.6 | 23.2 ± 0.6 |
Table 6.
Mean (± standard deviation) pH, pCO2, saturation states of calcite and aragonite, total dissolved inorganic carbon (TDIC), carbonate, total alkalinity (TA), salinity, dissolved oxygen, and temperature for the Menidia beryllina I four treatment diurnal duration acidification and hypoxia experiments.
| Parameter | 4 h Diurnal pH/DO | 8 h Diurnal DO/pH | 12 h Diurnal pH/DO | |||||||
|---|---|---|---|---|---|---|---|---|---|---|
| Control | Ambient | Low | Mean | Ambient | Low | Mean | Ambient | Low | Mean | |
| pHT daily chem | 7.94 ± 0.03 | 7.94 ± 0.01 | 7.22 ± 0.09 | 7.95 ± 0.01 | 7.23 ± 0.08 | 7.94 ± 0.00 | 7.23 ± 0.05 | |||
| pCO2 (µatm) | 466 ± 3 | 509 ± 7 | 2782 ± 19 | 1483 ± 1215 | 517 ± 56 | 2901 ± 168 | 1709 ± 1279 | 541 ± 55 | 2895 ± 88 | 1718 ± 1260 |
| Ω calcite | 3.16 ± 0.09 | 2.98 ± 0.18 | 0.69 ± 0.02 | 2.00 ± 1.23 | 2.98 ± 0.10 | 0.67 ± 0.06 | 1.83 ± 1.24 | 2.87 ± 0.10 | 0.67 ± 0.04 | 1.77 ± 1.18 |
| Ω aragonite | 2.04 ± 0.07 | 1.93 ± 0.12 | 0.45 ± 0.01 | 1.29 ± 0.79 | 1.92 ± 0.06 | 0.43 ± 0.04 | 1.18 ± 0.80 | 1.85 ± 0.06 | 0.43 ± 0.03 | 1.14 ± 0.76 |
| TDIC (µmol L−1) | 1789 ± 38 | 1811 ± 58 | 2002 ± 27 | 1893 ± 111 | 1821 ± 71 | 2008 ± 36 | 1915 ± 113 | 1825 ± 66 | 2009 ± 32 | 1917 ± 109 |
| CO32- (µmol L−1) | 127.2 ± 5.5 | 119.9 ± 8.6 | 28.0 ± 1.2 | 80.5 ± 49.5 | 119.6 ± 2.6 | 27.0 ± 2.8 | 73.3 ± 49.5 | 115.3 ± 2.8 | 27.0 ± 2.0 | 71.2 ± 47.2 |
| TA (µmol L−1) | 1968 ± 48 | 1976 ± 71 | 1959 ± 29 | 1969 ± 54 | 1986 ± 66 | 1960 ± 44 | 1973 ± 54 | 1983 ± 61 | 1961 ± 37 | 1972 ± 48 |
| Salinity | 29.6 ± 1.6 | 29.6 ± 1.6 | 29.6 ± 1.6 | 29.6 ± 1.6 | 29.6 ± 1.6 | 29.6 ± 1.6 | 29.6 ± 1.6 | |||
| Dissolved Oxygen (µM) | 7.04 ± 0.58 | 6.90 ± 0.02 | 2.20 ± 0.45 | 6.92 ± 0.02 | 2.04 ± 0.40 | 6.97 ± 0.04 | 2.12 ± 0.60 | |||
| Temperature (°C) | 22.5 ± 0.4 | 22.5 ± 0.4 | 22.5 ± 0.4 | 22.5 ± 0.4 | 22.5 ± 0.4 | 22.5 ± 0.4 | 22.5 ± 0.4 | |||
Table 7.
Mean (± standard deviation) pH, pCO2, saturation states of calcite and aragonite, total dissolved inorganic carbon (TDIC), carbonate, total alkalinity (TA), salinity, dissolved oxygen, and temperature for the Menidia beryllina II four treatment diurnal duration acidification and hypoxia experiments.
| Parameter | 4 h Diurnal pH/DO | 8 h Diurnal DO/pH | 12 h Diurnal pH/DO | |||||||
|---|---|---|---|---|---|---|---|---|---|---|
| Control | Ambient | Low | Mean | Ambient | Low | Mean | Ambient | Low | Mean | |
| pHT daily chem | 7.90 ± 0.03 | 7.86 ± 0.01 | 7.21 ± 0.07 | 7.86 ± 0.02 | 7.20 ± 0.07 | 7.86 ± 0.00 | 7.23 ± 0.08 | |||
| pCO2 (µatm) | 506 ± 48 | 538 ± 30 | 2881 ± 79 | 1543 ± 1253 | 521 ± 60 | 2960 ± 98 | 1741 ± 1306 | 543 ± 58 | 2922 ± 125 | 1733 ± 1274 |
| Ω calcite | 2.76 ± 0.37 | 2.60 ± 0.27 | 0.60 ± 0.06 | 1.74 ± 1.09 | 2.71 ± 0.41 | 0.60 ± 0.03 | 1.65 ± 1.16 | 2.62 ± 0.39 | 0.61 ± 0.04 | 1.61 ± 1.10 |
| Ω aragonite | 1.78 ± 0.24 | 1.67 ± 0.18 | 0.39 ± 0.04 | 1.12 ± 0.70 | 1.74 ± 0.27 | 0.39 ± 0.02 | 1.06 ± 0.75 | 1.68 ± 0.25 | 0.39 ± 0.03 | 1.04 ± 0.71 |
| TDIC (µmol L−1) | 1728 ± 33 | 1728 ± 38 | 1910 ± 54 | 1806 ± 105 | 1731 ± 33 | 1931 ± 54 | 1831 ± 115 | 1736 ± 37 | 1929 ± 61 | 1833 ± 113 |
| CO32− (µmol L−1) | 109.8 ± 14.7 | 103.3 ± 10.6 | 23.9 ± 2.4 | 69.3 ± 43.1 | 107.6 ± 16.3 | 23.8 ± 1.2 | 65.7 ± 46.0 | 104.0 ± 15.4 | 24.1 ± 1.7 | 64.1 ± 43.9 |
| TA (µmol L−1) | 1880 ± 55 | 1869 ± 53 | 1856 ± 60 | 1864 ± 52 | 1879 ± 58 | 1875 ± 54 | 1877 ± 52 | 1877 ± 61 | 1875 ± 62 | 1876 ± 57 |
| Salinity | 28.03 ± 0.9 | 28.03 ± 0.9 | 28.03 ± 0.9 | 28.03 ± 0.9 | 28.03 ± 0.9 | 28.03 ± 0.9 | 28.03 ± 0.9 | 28.03 ± 0.9 | 28.03 ± 0.9 | 28.03 ± 0.9 |
| Dissolved Oxygen (µM) | 7.07 ± 0.75 | 7.38 ± 0.01 | 2.64 ± 1.01 | 7.32 ± 0.31 | 2.32 ± 0.83 | 7.56 ± 0.27 | 2.25 ± 0.77 | |||
| Temperature (°C) | 22.8 ± 1.6 | 22.8 ± 1.6 | 22.8 ± 1.6 | 22.8 ± 1.6 | 22.8 ± 1.6 | 22.8 ± 1.6 | 22.8 ± 1.6 | 22.8 ± 1.6 | 22.8 ± 1.6 | 22.8 ± 1.6 |
Table 8.
Mean (± standard deviation) pH, pCO2, saturation states of calcite and aragonite, total dissolved inorganic carbon (TDIC), carbonate, total alkalinity (TA), salinity, dissolved oxygen, and temperature for the Menidia menidia four treatment diurnal duration acidification and hypoxia experiments.
| Parameter | 4 h Diurnal pH/DO | 8 h Diurnal DO/pH | 12 h Diurnal pH/DO | |||||||
|---|---|---|---|---|---|---|---|---|---|---|
| Control | Ambient | Low | Mean | Ambient | Low | Mean | Ambient | Low | Mean | |
| pHT daily chem | 7.93 ± 0.02 | 7.94 ± 0.01 | 7.27 ± 0.05 | 7.91 ± 0.01 | 7.21 ± 0.04 | 7.91 ± 0.02 | 7.32 ± 0.09 | |||
| pCO2 (µatm) | 526 ± 39 | 523 ± 12 | 3052 ± 164 | 1787 ± 1356 | 528 ± 12 | 2998 ± 31 | 1763 ± 1320 | 544 ± 42 | 3015 ± 129 | 1780 ± 1324 |
| Ω calcite | 2.62 ± 0.21 | 2.64 ± 0.11 | 0.57 ± 0.04 | 1.61 ± 1.11 | 2.61 ± 0.11 | 0.58 ± 0.01 | 1.59 ± 1.09 | 2.57 ± 0.21 | 0.58 ± 0.03 | 1.57 ± 1.08 |
| Ω aragonite | 1.69 ± 0.13 | 1.70 ± 0.07 | 0.37 ± 0.02 | 1.03 ± 0.71 | 1.68 ± 0.07 | 0.37 ± 0.01 | 1.03 ± 0.70 | 1.66 ± 0.13 | 0.37 ± 0.02 | 1.01 ± 0.69 |
| TDIC (µmol L−1) | 1720 ± 15 | 1726 ± 26 | 1923 ± 13 | 1824 ± 107 | 1725 ± 26 | 1910 ± 26 | 1818 ± 102 | 1730 ± 21 | 1917 ± 23 | 1823 ± 102 |
| CO32− (µmol L−1) | 104.4 ± 7.7 | 105.4 ± 3.9 | 22.9 ± 1.4 | 64.1 ± 44.2 | 104.3 ± 4.0 | 23.0 ± 0.3 | 63.6 ± 43.6 | 102.6 ± 8.0 | 23.0 ± 1.1 | 62.8 ± 42.9 |
| TA (µmol L−1) | 1864 ± 26 | 1871 ± 30 | 1863 ± 18 | 1867 ± 24 | 1869 ± 31 | 1852 ± 25 | 1861 ± 27 | 1871 ± 31 | 1858 ± 24 | 1864 ± 27 |
| Salinity | 29.6 ± 0.8 | 29.6 ± 0.8 | 29.6 ± 0.8 | 29.6 ± 0.8 | 29.6 ± 0.8 | 29.6 ± 0.8 | 29.6 ± 0.8 | 29.6 ± 0.8 | 29.6 ± 0.8 | 29.6 ± 0.8 |
| Dissolved Oxygen (µM) | 7.00 ± 0.10 | 7.09 ± 0.03 | 1.95 ± 0.38 | 7.91 ± 0.01 | 2.08 ± 0.40 | 7.25 ± 0.07 | 1.81 ± 0.29 | |||
| Temperature (°C) | 22.4 ± 0.2 | 22.4 ± 0.2 | 22.4 ± 0.2 | 22.4 ± 0.2 | 22.4 ± 0.2 | 22.4 ± 0.2 | 22.4 ± 0.2 | 22.4 ± 0.2 | 22.4 ± 0.2 | 22.4 ± 0.2 |
© 2020 by the authors. Licensee MDPI, Basel, Switzerland. This article is an open access article distributed under the terms and conditions of the Creative Commons Attribution (CC BY) license (http://creativecommons.org/licenses/by/4.0/).
Share and Cite
MDPI and ACS Style
Morrell, B.K.; Gobler, C.J. Negative Effects of Diurnal Changes in Acidification and Hypoxia on Early-Life Stage Estuarine Fishes. Diversity 2020, 12, 25. https://0-doi-org.brum.beds.ac.uk/10.3390/d12010025
AMA Style
Morrell BK, Gobler CJ. Negative Effects of Diurnal Changes in Acidification and Hypoxia on Early-Life Stage Estuarine Fishes. Diversity. 2020; 12(1):25. https://0-doi-org.brum.beds.ac.uk/10.3390/d12010025
Chicago/Turabian StyleMorrell, Brooke K., and Christopher J. Gobler. 2020. "Negative Effects of Diurnal Changes in Acidification and Hypoxia on Early-Life Stage Estuarine Fishes" Diversity 12, no. 1: 25. https://0-doi-org.brum.beds.ac.uk/10.3390/d12010025
Note that from the first issue of 2016, this journal uses article numbers instead of page numbers. See further details here.