Article

Diversity of a Large Collection of Natural Populations of Mango (Mangifera indica Linn.) Revealed by Agro-Morphological and Quality Traits

Institute of Tropical and Subtropical Cash Crops, Yunnan Academy of Agricultural Sciences, Baoshan 678000, China
*
Authors to whom correspondence should be addressed.
These authors contributed equally to this work.
Submission received: 11 December 2019 / Revised: 31 December 2019 / Accepted: 3 January 2020 / Published: 11 January 2020
(This article belongs to the Section Plant Diversity)

Abstract

:
Collection, characterization and utilization of genetic resources are crucial for developing varieties to meet current and future needs. Although mango is an economically important fruit tree, its genetic resources are still undocumented and are threatened in their natural habits. In this study, the variability of 452 mango accessions from three regions in China (Nujiang, Lancang river and Honghe) was assessed using 41 descriptors including qualitative and quantitative traits, with the aim to identify mango accessions with excellent agronomic and quality traits. To this end, descriptive and multivariate analyses were performed. Based on Shannon–Weaver diversity index, qualitative traits including pericarp color, fruit aroma, flesh color, and fruit flavor recorded the highest variability in the germplasm. Fruit related traits including pulp weight, peel weight, and fruit weight were the most diverse traits in the germplasm with a high coefficient of variation (CV > 40%). Significant differences (MANOVA test, p < 0.000) were observed among the three regions for most of the quantitative traits. Biologically significant and positive correlations were found among agronomically important traits such as fruit weight and pulp weight, fruit weight and edible rate. The hierarchical cluster analysis revealed tree clusters, indicating a low diversity in the germplasm. The majority of the descriptors contributed to the differentiation of the accessions. Accessions with good fruits quality (high fruit weight, pulp weight, and edible rate) were found in Cluster 2. Accessions in this cluster could be used for fruit quality improvement in mango breeding programs. Our study sheds light on the diversity of a large collection of natural mango population in China and provides relevant information for efficient conservation and harnessing of mango genetic resources.

1. Introduction

Mango (Mangifera indica L.) is grown throughout the tropics and in many subtropical areas of the world. It is cultivated at the equator and up to the latitudes of 37° N in Sicily and to 33° S in South Africa [1]. Mango, also called “King of fruits” [2], is the most important commercially grown fruit crop worldwide. It is a versatile fruit used in various ways either raw or processed into juice, smoothies, sliced canned. Mango has nutraceutical properties as the leaves, roots, bark, seed and peel are used in traditional medicine to treat several ailments including piles, diarrhea, anemia, dysentery, asthma, cough, bronchitis, hypertension, toothache, leucorrhoea, hemorrhage, rheumatism [3,4,5]. Global mango production is about 51 million tons on an average harvested area of 6 million ha with an average yield of about 9 t ha−1. China is one of the major mango producers behind India [6] with a long history of mango production. Yunnan region accounts for 26.6% of total mango production of China and is the second major mango production area of the country behind Guangxi [7]. Taiong No.1, Guifei, Jinhuang, Mya HinTa, Keitt, Sensation, Chok Anan, Nam Doc Mai 4, and Xiangya are the main mango varieties planted in the region, most of which were imported from Southeast Asian countries. Overall, the production system is poorly mechanized and labor intensive [7]. The mango season lasts from May to November, which is longer than the harvesting period in other producing areas in China. The year-round availability of good quality fruit is challenging for mango industry in China [8].
Mango is affected by several biotic (e.g., mango quick wilt disease, anthracnose, fruit fly) and abiotic (extreme temperatures, erratic rainfall) constraints [2,8,9,10,11,12]. Change in climatic conditions are likely going to negatively affect mango production by limiting vegetative growth, flowering and fruit set, fruit growth, and fruit quality [10]. Genetic resources are reservoirs of useful alleles for traits improvement and innovation in plant breeding. Identification of germplasm with high fruit yield and good fruit quality is important to broaden the genetic basis of mango cultivars [9,13]. For this purpose, it is crucial to assemble and properly characterize the available mango genetic resources.
The importance of conserving mango genetic resources especially the landraces and wild species cannot be over emphasized [14] as the species is in danger of loss in its natural habitat [13]. Currently, wild mango germplasm resources are distributed in Yunnan, Guangdong, Guangxi, and Hainan in China, and more than 1000 accessions have been collected and conserved. Globally, there are about 26,000 mango accessions including landraces, breeding lines, advanced cultivars, and wild species held in various field gene banks in Australia, Indonesia, Sierra Leone, India, Thailand, United States of America, and other countries [15]. Local varieties or landraces harbor specific traits that can be exploited in improvement programs to cope with biotic and abiotic stresses and to meet consumers’ preferences [16]. Local mango germplasms are considered to be highly adapted to their environment with interesting agronomic potentials including resistance to pests and diseases and tolerance to abiotic stresses [17].
Worldwide, mango germplasm is being conserved through complementary in situ and ex situ strategies. However, a wealth of mango genetic resources is still poorly assembled and characterized [13]. Germplasm assembly and their characterization are critical for efficient utilization and management of genetic resources. Gaining insight into the existing variability and relatedness among individuals allows for identification of duplicates and the selection of superior genotypes or combination of genotypes to generate desired traits. Assessment of genetic diversity is done through various methods used either alone or in combination. These include morphological and molecular characterization [18]. Various markers systems have been used to assess genetic diversity in mango germplasm across the world and particularly in China [9,13]. Attempts have already been made in several regions in the world to assemble and document genetic variability present in mango collections using various marker systems [9,19,20], combination of molecular markers and morphological traits [14,17,21,22], and phenotypic characterization [23,24]. While molecular characterization is widely used, especially with the continued drop in genotyping cost, it is equally important to characterize germplasm phenotypically. Morphological characterization sets the basis for key traits of interest present in a germplasm collection and allows the identification of elite materials to be used in breeding. It is the simple way to assess variability in a collection [18] as it reveals extent of diversity in the collection. It also provides information on history of selection and trait plasticity.
Our study presents a unique particularity in terms of the size of the collection and the evaluation process. In fact, we collected over 10 years a wide range (452) of mango accessions, from spontaneous trees, in Yunnan Province in China and sampled scions for grafting on station for observations and data recording. The diversity of the collection was analyzed using quantitative and quality traits in order to identify superior genotypes with excellent agronomic and quality traits. Collected materials with excellent phenological, morphological, and fruit quality traits can be used as parents for developing adapted and consumers preferred mango varieties. They can also be used as materials to get further understanding into molecular basis of important traits in mango, providing sound basis for molecular breeding technologies.

2. Materials and Methods

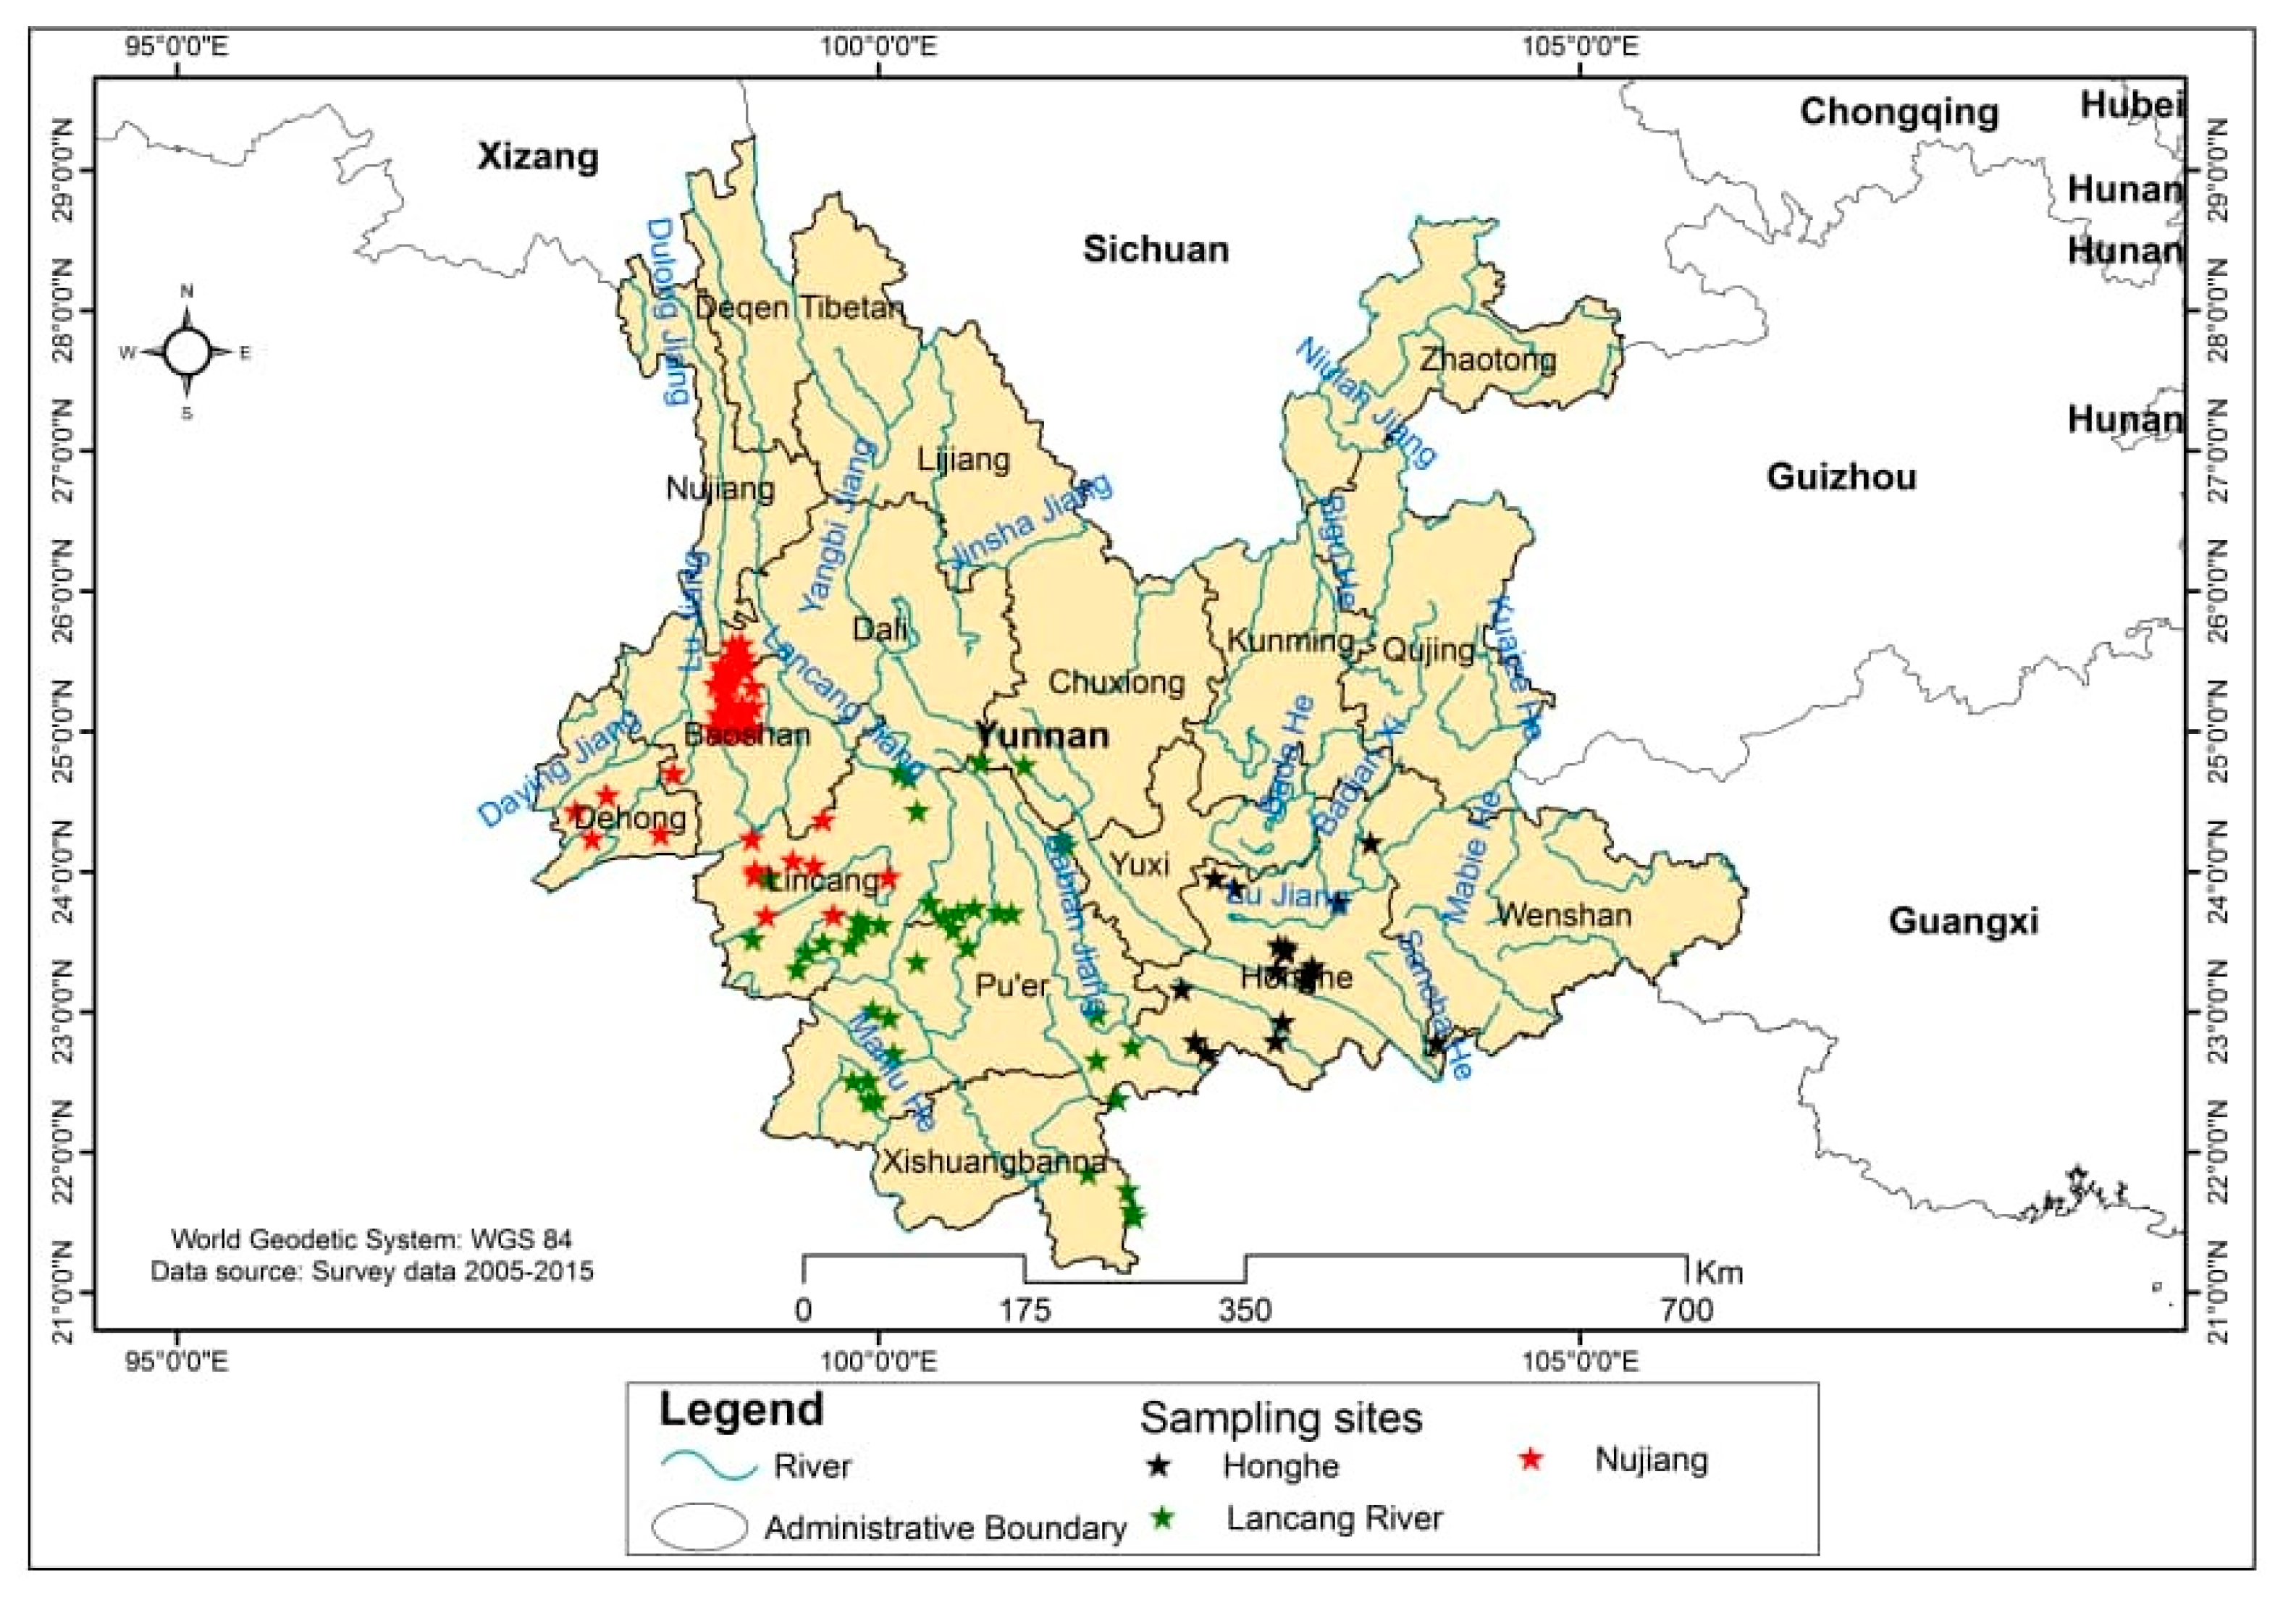
2.1. Description of the Mango Germplasm Collection Sites

A total of 452 mango accessions were collected in Yunnan Province from 2005 to 2015 in three regions (Nujiang, Lancang river and Honghe) across various land-uses/landscapes (fields, front and back of the villages, barren hills, mountains and rivers). The locations where the sampling was done and the overall environmental conditions of each region are described as follows. Most of the collected mango germplasm were in a wild and unmanaged state, and many trees are over 100 years old.

2.1.1. Nujiang

Mango germplasm resources are mainly distributed in Liuku Town, Lushui County, Nujiang City, to Zhongshan Township, Mangshi County, Dehong City. In the region, Lushui County, Changning County, Shidian County, Longling County, and Yongde County belong to the savanna climate type. Mangshi County, Ruili County, Longchuan County, and Yingjiang County are tropical monsoon forest types, the soil is red loam, and the altitude range is 630–1420 m.

2.1.2. Honghe

Mango germplasm resources are mainly distributed in Shuangbai County of Chuxiong Prefecture to Hekou County of Honghe Prefecture. In the region, Shuangbai County of Chuxiong Prefecture, Xinping County and Yuanjiang County of Yuxi; Honghe County and Yuanyang County of Honghe Prefecture belong to the savanna climate type, and Hekou County and Jinping County of Honghe Prefecture are tropical monsoon forest types, and the soil is red loam; the altitude range is 76–1198 m.

2.1.3. Lancang River

Mango germplasm resources are mainly distributed in Fengqing County of Lincang City to Mengla County of Xishuangbanna Prefecture. The area of Lincang City, Fengqing County, Yunxian County, Linxiang County, Shuangjiang County, Jingdong County, Jinggu County, Simao County, Cangyuan County, Ximeng County, Jiangcheng County, Menhai Sea belongs to the tropical monsoon forest climate type. Jinghong and Mengla County are tropical rainforest climate types. The soil is yellow loam, and the altitude range is 76–1457 m.
The Global Positioning System (GPS) coordinates were recorded to localize the site of collection (Figure 1).

2.2. Mango Germplasm Resources Evaluation

We grafted all the 452 scions of mango germplasms on three years old rootstocks of the cultivar “Sannianmang” (a native cultivar of Yunnan) planted in a row spacing of 4.0 m × 5.0 m. The collection is maintained at the Tropical and Subtropical Economic Crops Research Institute of Yunnan Academy of Agricultural Sciences (China, Baoshan) (24°58′28.96″ N and 98°52′31.59″ E). The soil is mainly dry laterite. The soil is red, with a pH ranging from 5 to 6.5 and organic matter content of about 0.6%. The weather conditions of this experimental site were an average yearly relative humidity of 72.75% and average annual total solar radiation of 138449 cal cm−2. The annual average temperature is 21.3 °C; the coldest monthly average temperature is 13.9 °C; the hottest monthly average temperature is 26.4 °C; the annual extreme minimum temperature is 0.2 °C; the extreme maximum temperature is 40.4 °C; the accumulated temperature ≥10 °C is 7800 °C. The annual precipitation is 751.4 mm, and the precipitation in rainy season (May to October) is 614.7 mm, accounting for more than 81% of the annual precipitation. The precipitation in dry season (November to April) is 132.8 mm, only accounting for 18% of the annual precipitation.
All traits were described with reference to the Tropical Crop Germplasm Resources Data Standard [25] and International Plant Genetic Resources Institute (IPGRI) mango descriptors [26]. Data were recorded from 2010 to 2018.

2.2.1. Monitoring of the Tree Phenology

The tree phenology was regularly observed each year during the tree growth period. The dates of the following stages were noted: initial bloom stage, full-bloom stage, end-bloom stage, fruit maturity, initial fruit picking date, massive fruit picking date, final fruit picking date and flowering habit.

2.2.2. Measurement of Dendrometric Parameters

During the fruiting period, the shape of the canopy structure of the plant was observed by visual inspection and compared with the predefined shapes as described by Joshi and Joshi [27]. The growth habit of the tree referring to the global appearance (shape, trunk girth (1 m 30), height) and the form of growth of the tree [28,29] were observed by visual inspection of the tree compared with the predefined shapes.

2.2.3. Measurement of the Leaf Parameters

The leaf length was measured by sampling randomly 20 pieces of intact mature leaves during the fruiting period. The length, in cm, was measured from the base of each leaf to the tip end of the blade using a digital vernier caliper, and the average value was recorded. Similarly, the leaf width was measured on the same leaves by measuring the largest width of the leaf. The leaf petiole was also measured using a vernier caliper. Moreover, the leaf shape, leaf texture, leaf apex shape, leaf margin, and leaf surface were assessed through a visual inspection of the shape of the mature leaves in the middle of the plant, and the leaf shape of the germplasm resources was determined by combining the leaf shape index.

2.2.4. Measurement of the Flower Parameters

The flower diameter was measured during the flowering period of the plant. Ten completely open flowers were randomly sampled, and the maximum diameter (in cm) of the flower was measured using a digital vernier caliper. Inflorescence shape, type of flower, and petal color were recorded through a visual observation.

2.2.5. Measurement of Fruit and Seed Parameters

The average fruit weight (in g) was measured during the fruit ripening period of the plant on ten mature fruits randomly sampled and weighted using an electronic weighing balance. The fruit length, width and thickness (in cm) were measured on these sampled fruits using a digital vernier caliper. Fiber length, quantity fiber pulp, edible quality, fruit shape, fruit beak type, fruit sinus type and flesh color were recorded through a visual observation. Ripened fruits were selected and tasted to assess fruit aroma and fruit flavor.
The edible rate and the peel weight of the fruit was determined on 10 mature fruits randomly sampled at the fruit ripening stage. The edible rate (in %) is calculated according to the following formula.
E d i b l e   r a t e   ( % ) = average   single   fruit   weight average   peel   weight average   seed   weight average   single   fruit   weight × 100
The soluble solid content was determined on 10 mature fruits randomly sampled at the fruit ripening stage of the plants, and the samples were selected following the sampling method of GB/T 8855-2008 fresh fruits and vegetables [30]. The soluble solid content was determined in mangoes fruit using a hand refractometer as described by Jha et al. [31].
Fiber length, type of embryo, and kernel shape were recorded through a visual observation after removing the flesh (for kernel shape) and break the kernel (for embryo type).

2.3. Statistical Analysis

The means and dispersion parameters for the quantitative traits were computed. The strength and direction of association among the quantitative traits were assessed by performing correlation analysis. The frequencies of the different levels of qualitative traits in the germplasm and the Shannon–Weaver diversity index [32] were computed. The Shannon–Weaver Index quantifies the richness and evenness of alleles in a germplasm. Higher the index of a character, higher is its diversity.
Multivariate analysis of variance (MANOVA) and univariate analysis of variance (ANOVA) were performed to test the significant variations among the origins of collection of the germplasm for all the quantitative variables. The p value ≤ 0.05 was used to indicate significant differences between mean values determined by one-way analysis of variance (ANOVA). Shapiro–Wilk’s test of normality and Levene’s test for equality of error variances were used to check the normality and homoscedasticity assumptions before performing MANOVA and ANOVA. Since multiple tests were simultaneously performed, the Bonferroni post hoc test was computed [33] to indicate statistically significant values at p ≤ 0.05. To identify discriminating traits and group the accessions, Factor Analysis of Mixed Data (FAMD) [34] combined with a Hierarchical Clustering on Principal Component (HCPC) analysis [35] were performed using the package FactoMineR [36]. The strength and direction of association among the quantitative traits was assessed through correlation analysis and the correlogram was drawn for visualization in corrplot package [37]. All analyses were performed in R statistical software version 3.6.1 [38].

3. Results

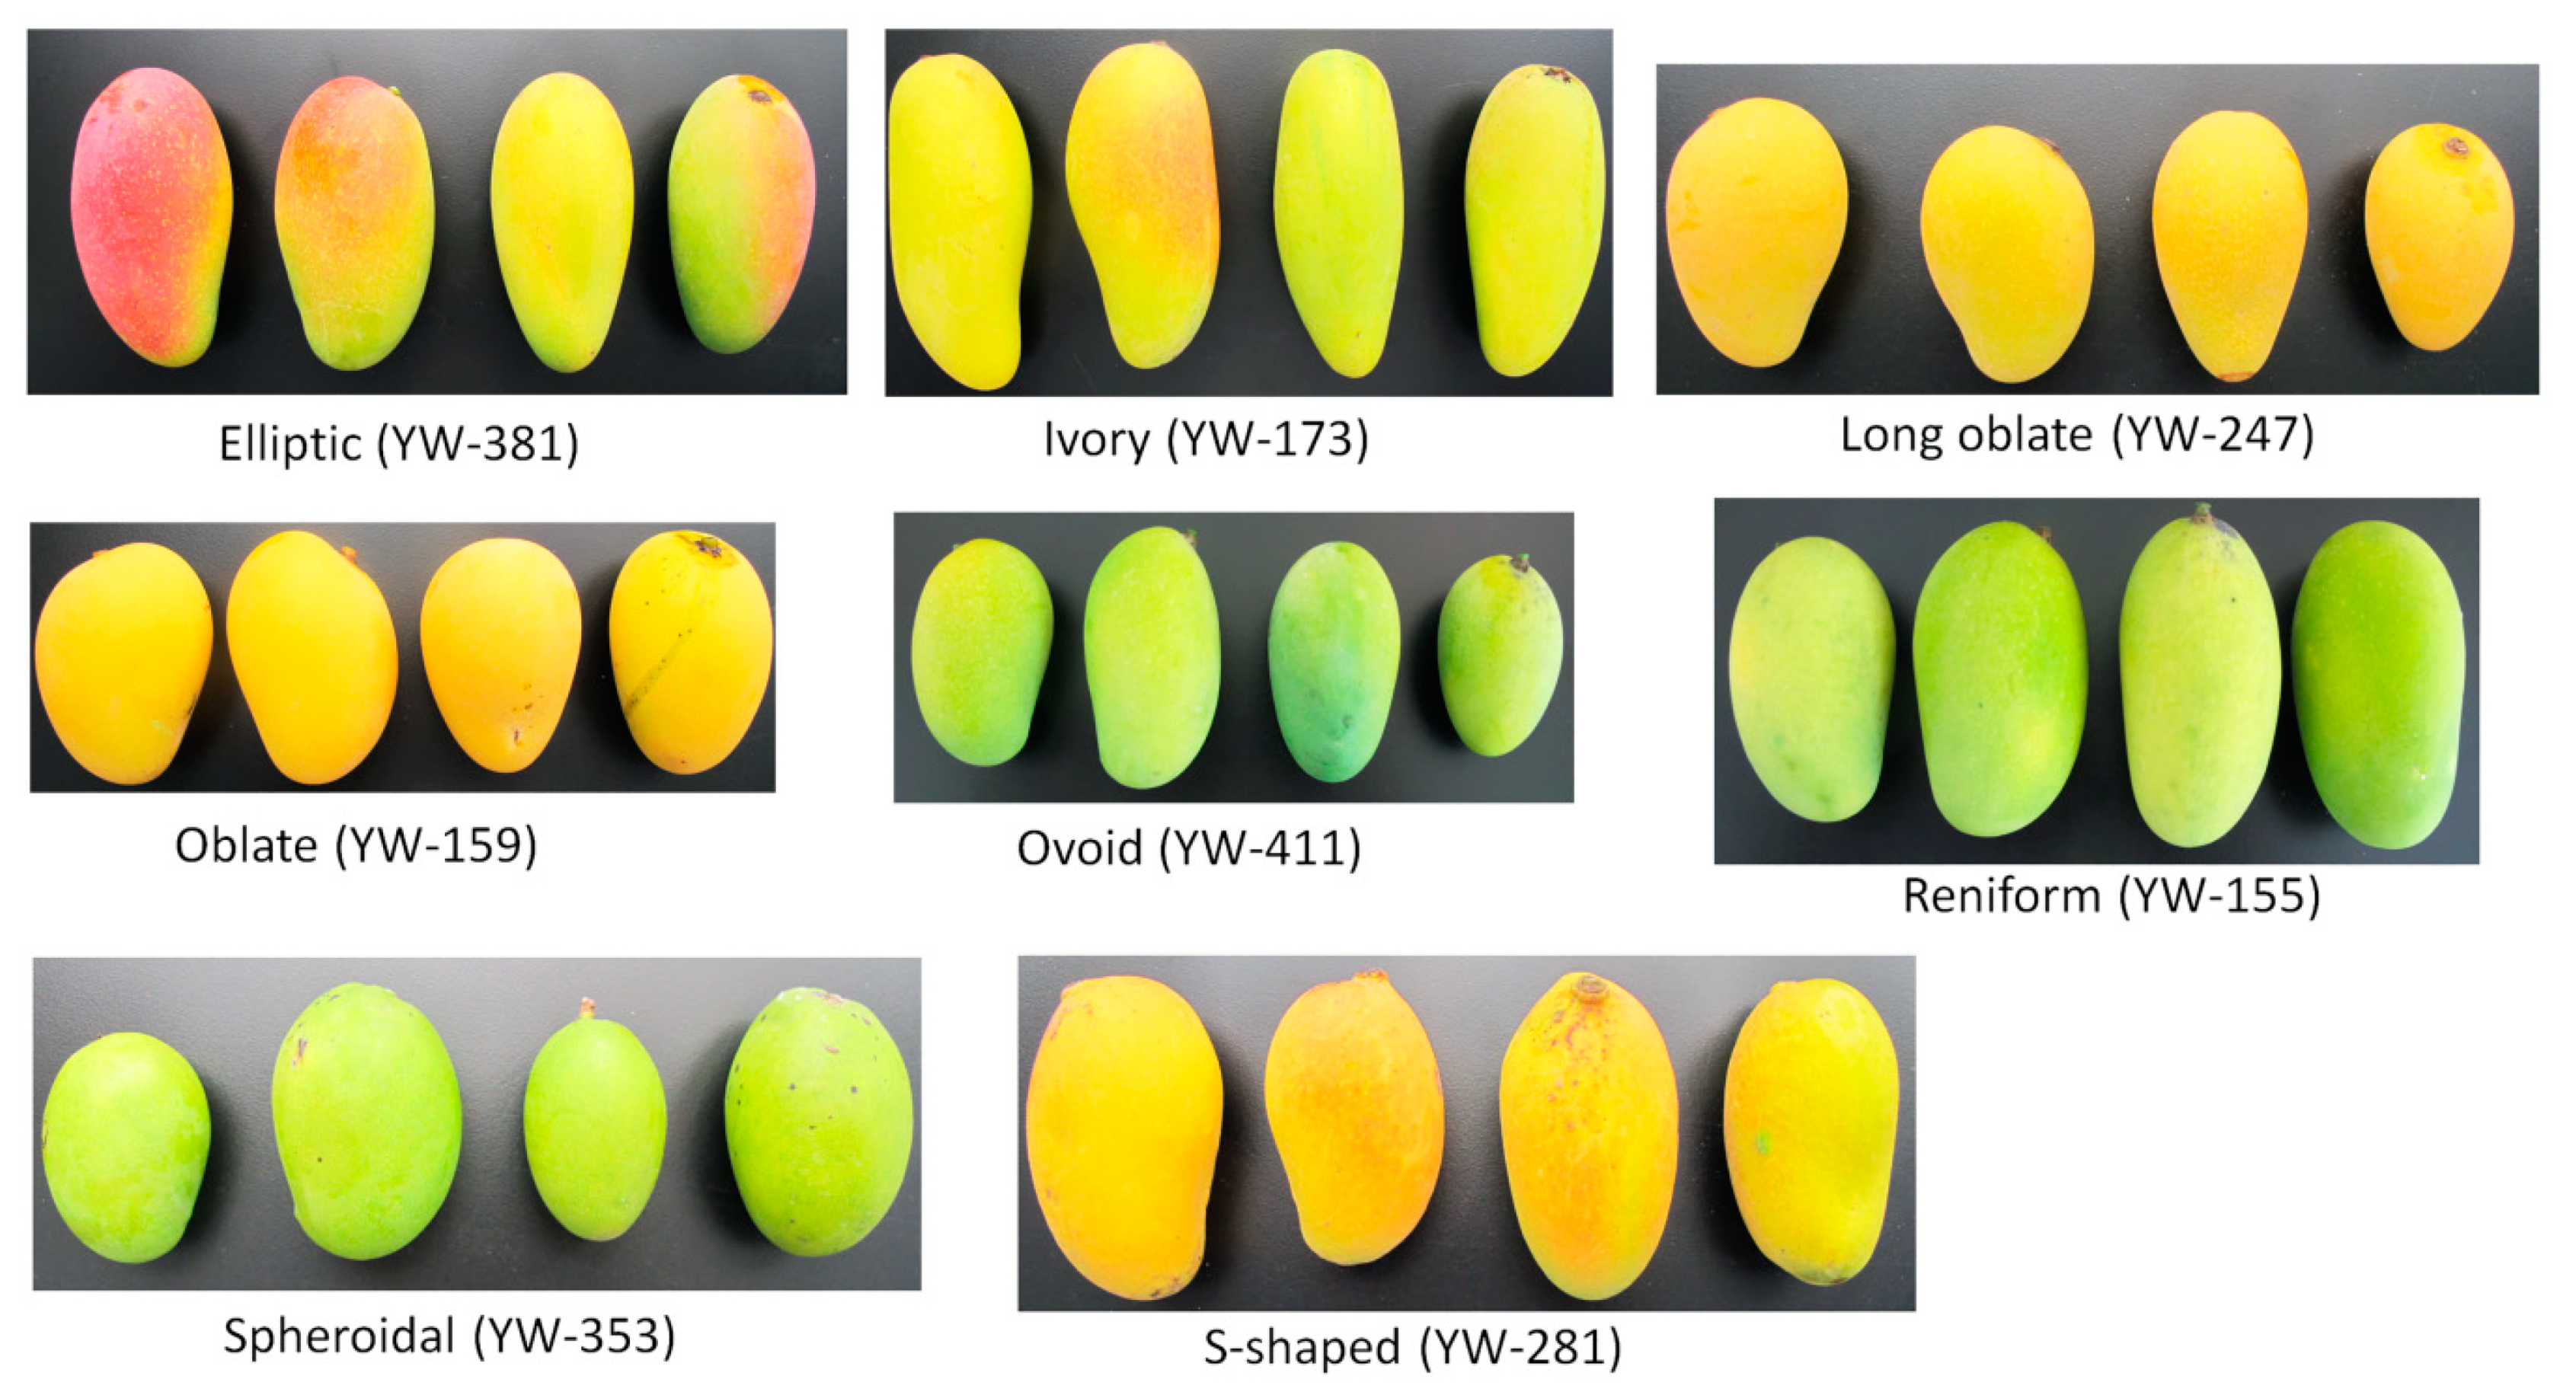
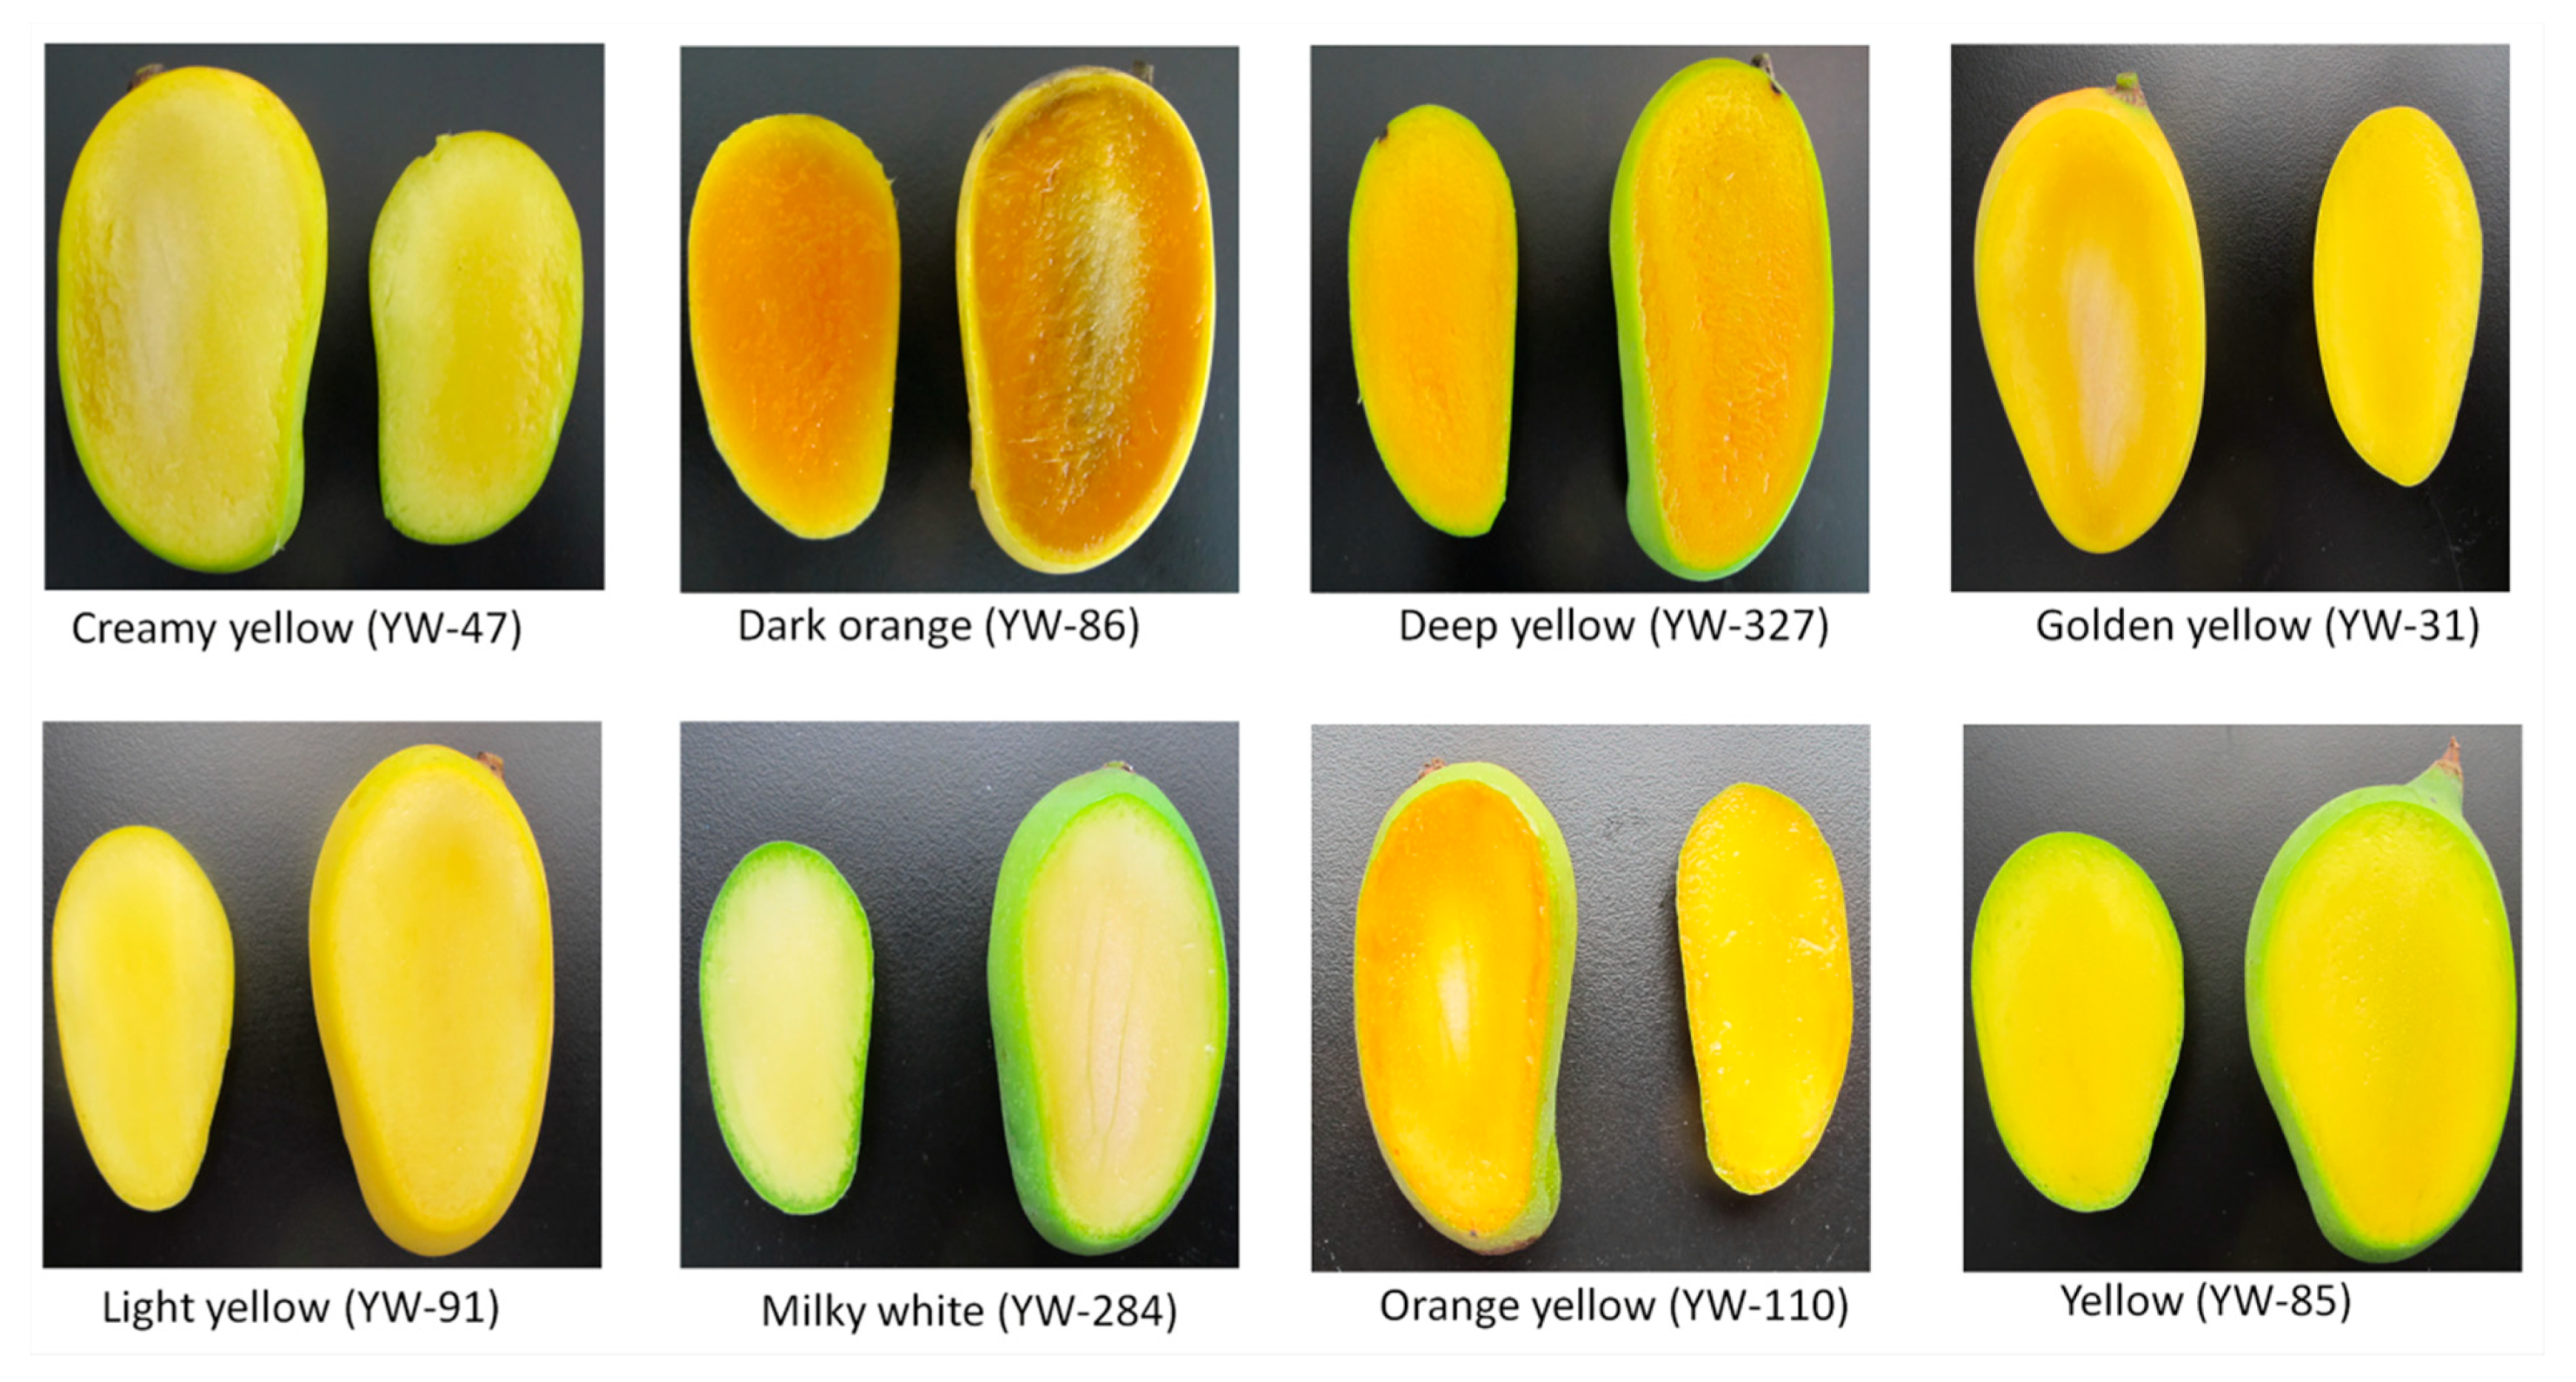
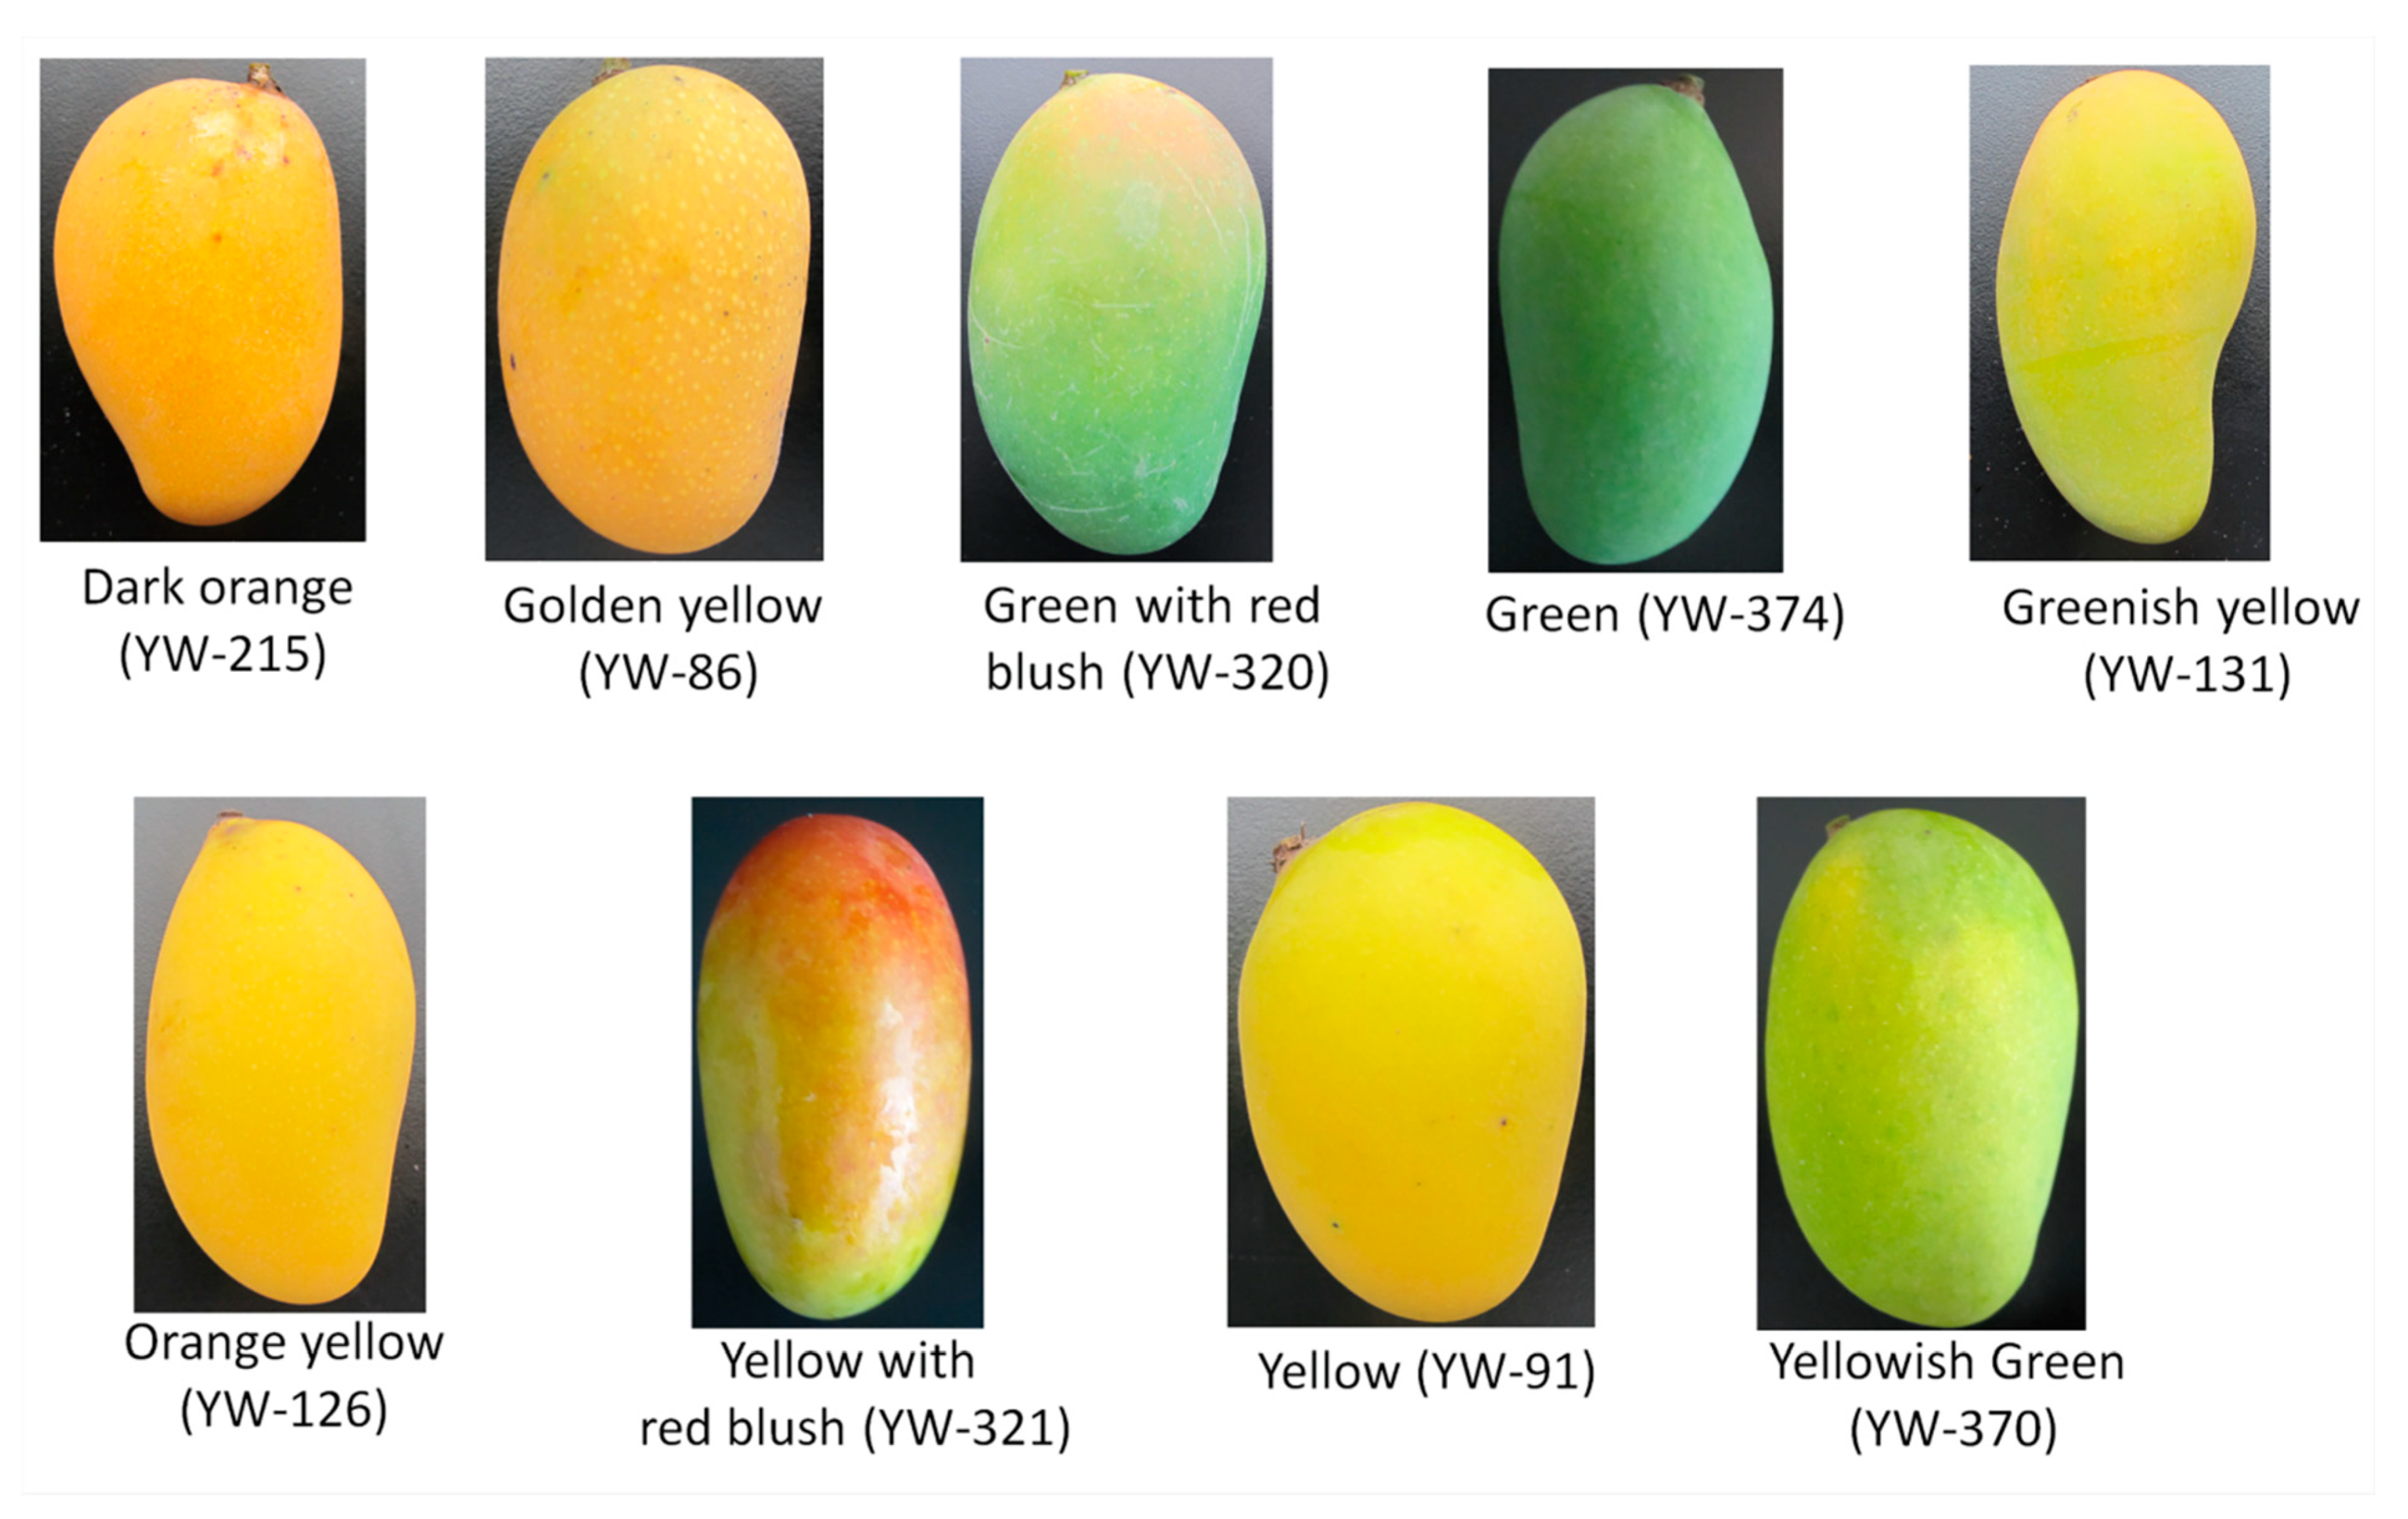
3.1. Variation of Qualitative Traits in the Mango Tree Collection

The diversity in the germplasm was assessed using 25 qualitative traits. The crown shape of most of the accessions were spherical with intermediate (between spreading and erect) growth habit. There was a slight predominance of monoembryo type over polyembryo. The germplasm was predominantly of medium flowering and maturity types. The accessions were largely characterized by lanceolate leaf blade shape, wavy leaf surface, leathery leaf texture, acuminate leaf apex, and wavy leaf margin. The inflorescences were mostly pyramidal with pentamerous flowers and light-yellow petal colors. The fruits were mostly of pointed beak type, with elliptic and oblate shape (Figure 2), golden yellow and orange yellow flesh color (Figure 3), shallow fruit sinus type, and yellow pericarp color (Figure 4). Organoleptic quality of the fruits is mainly depicted by sour and sweet taste, faint scent aroma, long fiber with an overall medium edible quality. Kernels are primarily ellipsoid followed by oblong shape (Table S1).
The average Shannon–Weaver diversity index was 0.77 ± 0.33 (Table 1) indicating a moderate diversity of the qualitative traits in the germplasm. Pericarp color, fruit aroma, flesh color, and fruit flavor recorded the highest diversity while petal color, leaf apex shape, and flowering habit had the lowest diversity in the germplasm.

3.2. Quantitative Traits Variation in the Germplasm

Sixteen quantitative traits were also recorded, and most of these traits showed significant variability in the germplasm. The coefficient of variation is a measure of dispersion around, and it is computed as the ratio of the standard deviation to the mean. The higher the coefficient of variation, the greater the diversity of the trait. Fruit related traits including pulp weight, peel weight, and fruit weight were the most diverse traits while leaf related traits such as leaf shape index, blade width, blade length showed low diversity as revealed by the coefficient of variation (Table 2).
There were significant variations in quantitative traits among region/origin of collection of tree mango (MANOVA test p < 0.0001). All the quantitative descriptors showed significant variations with the region of collection except Trunk girth, Blade length, Fruit length, Fruit width, Fruit thickness, and Seed width (Table 3). We reported only traits with significant differences among the region of collection.

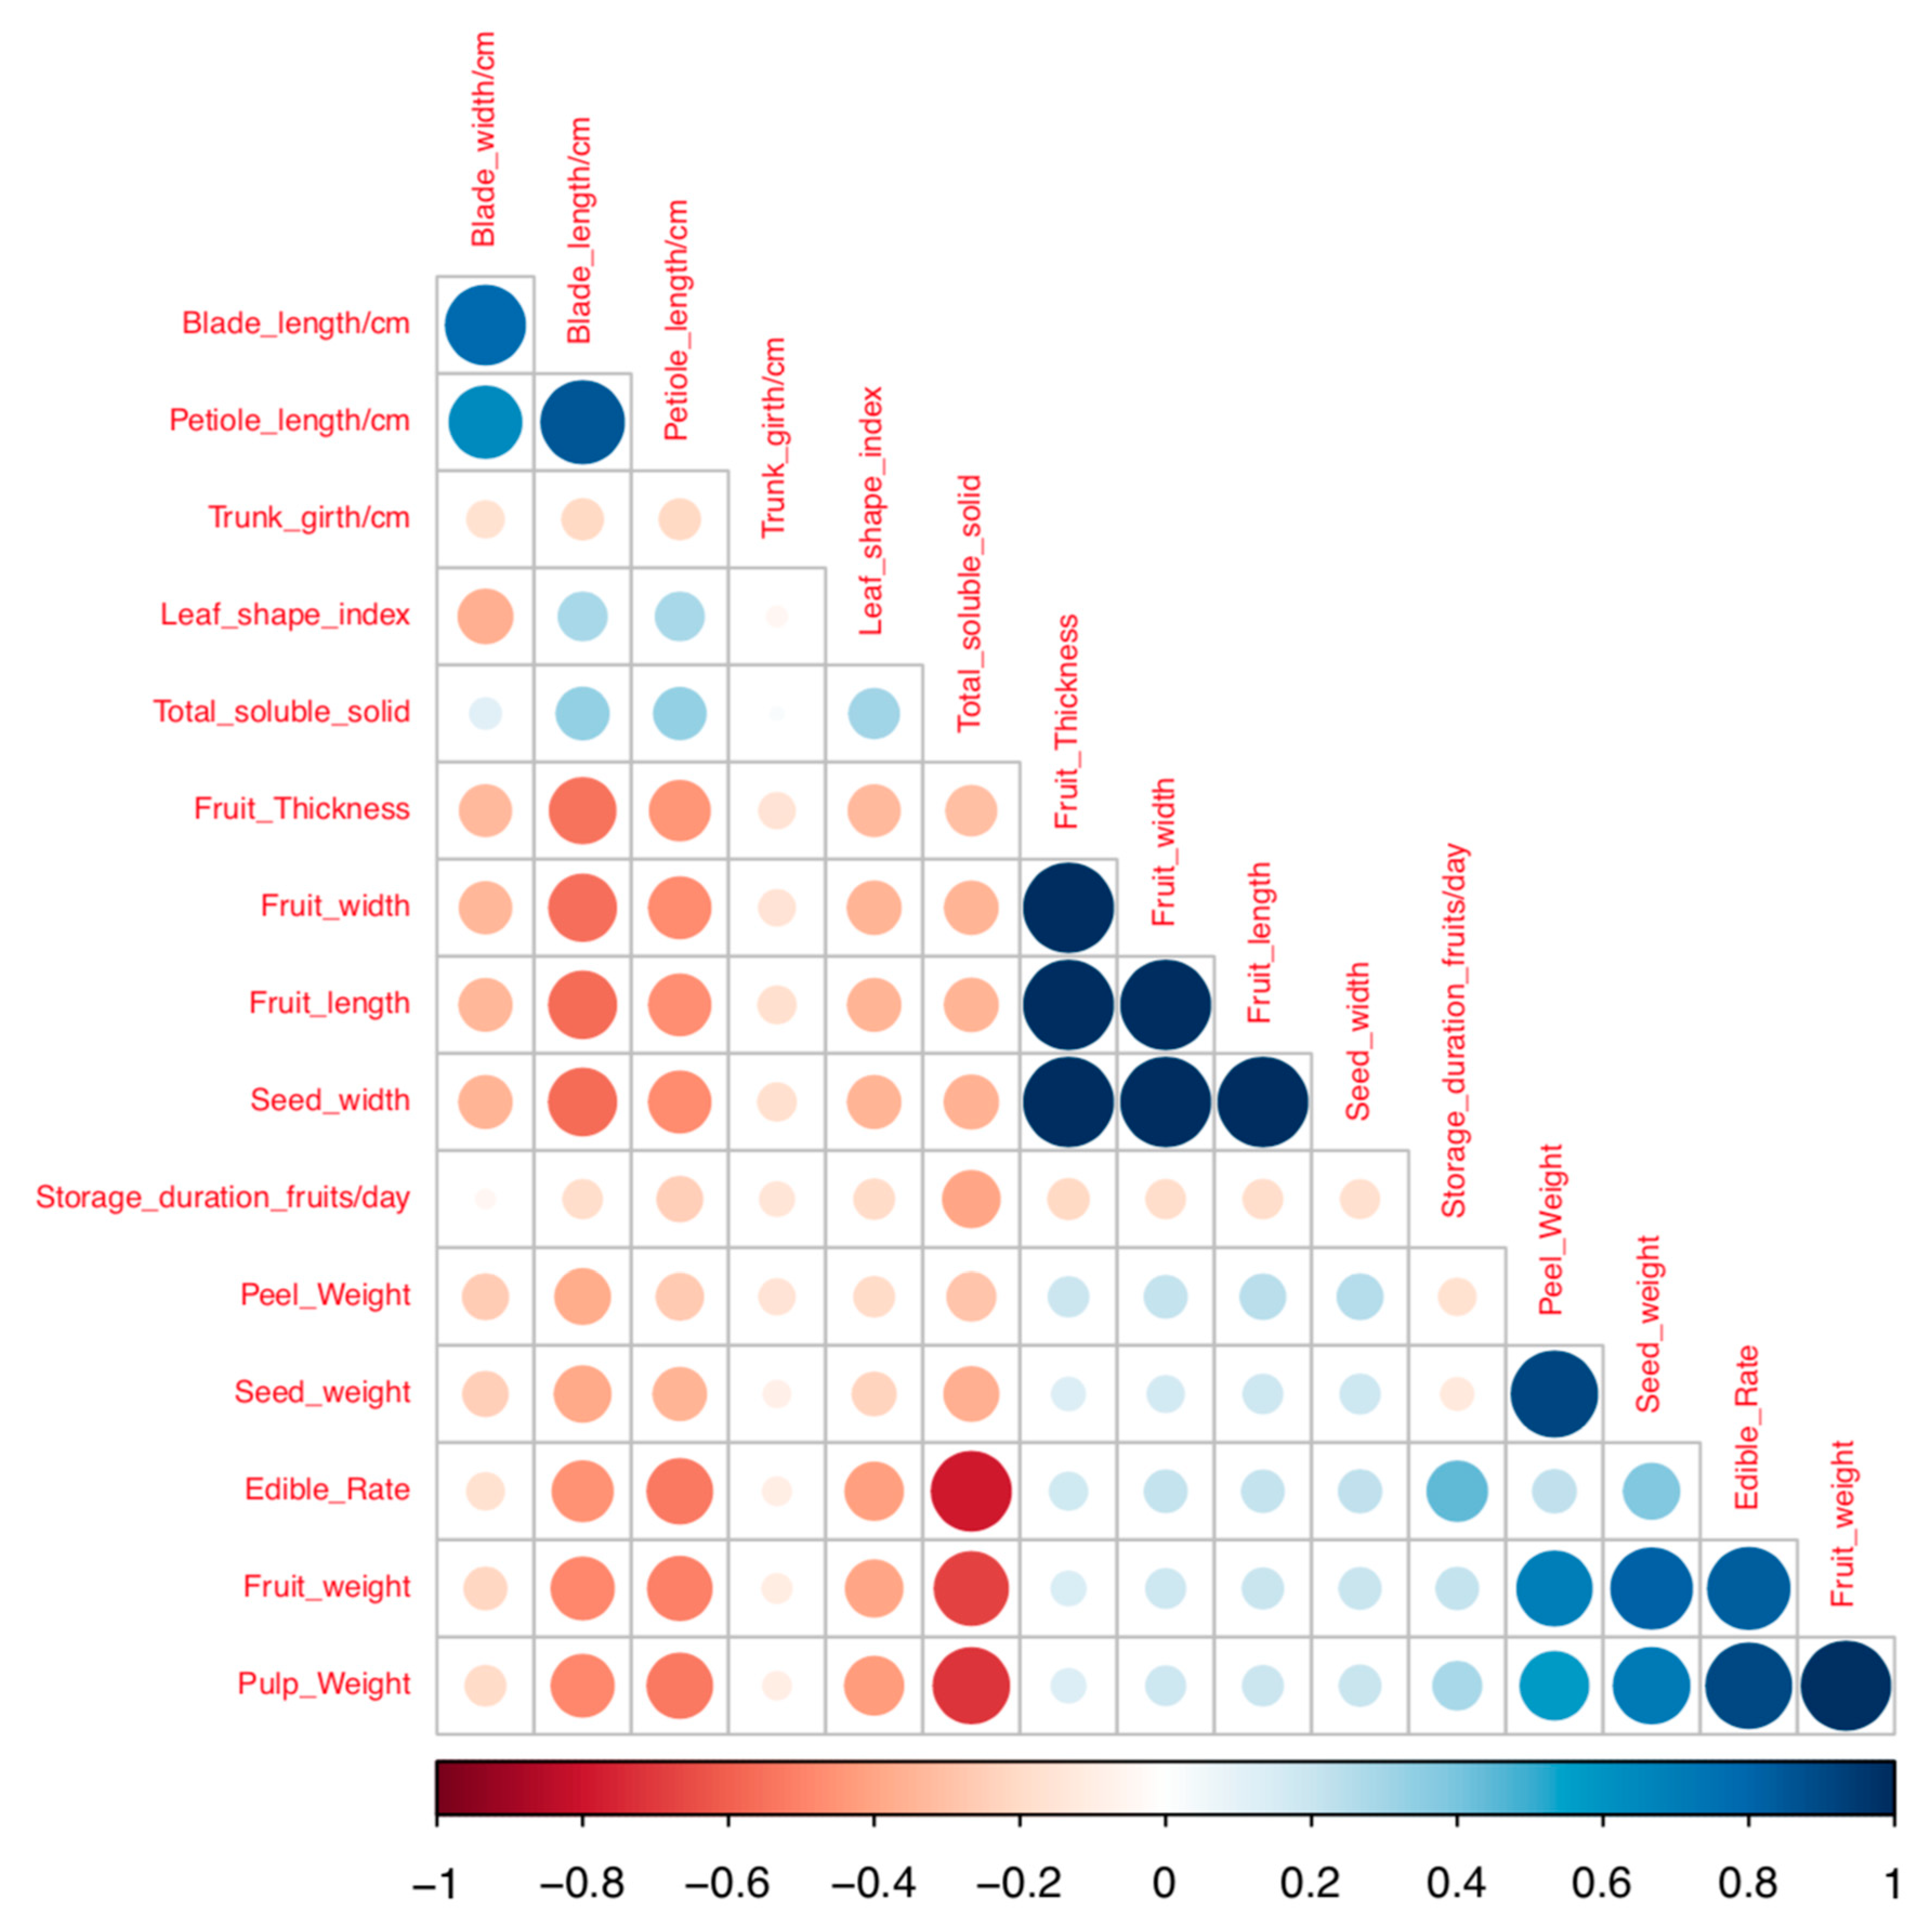
3.3. Correlation Analysis for Quantitative Traits

The correlation analysis revealed significant association among several traits (Figure 5). Blade width showed strong and positive association with blade length. Fruit weight was strongly and positively correlated with pulp weight, seed weight, and edible rate. Similarly, high and positive correlation was recorded for the following pairs of traits: seed weight and peel weight, edible rate and peel weight, fruit thickness and fruit length, fruit width and fruit length, seed width and fruit width, fruit thickness and fruit width, seed width and fruit thickness (Table S2).

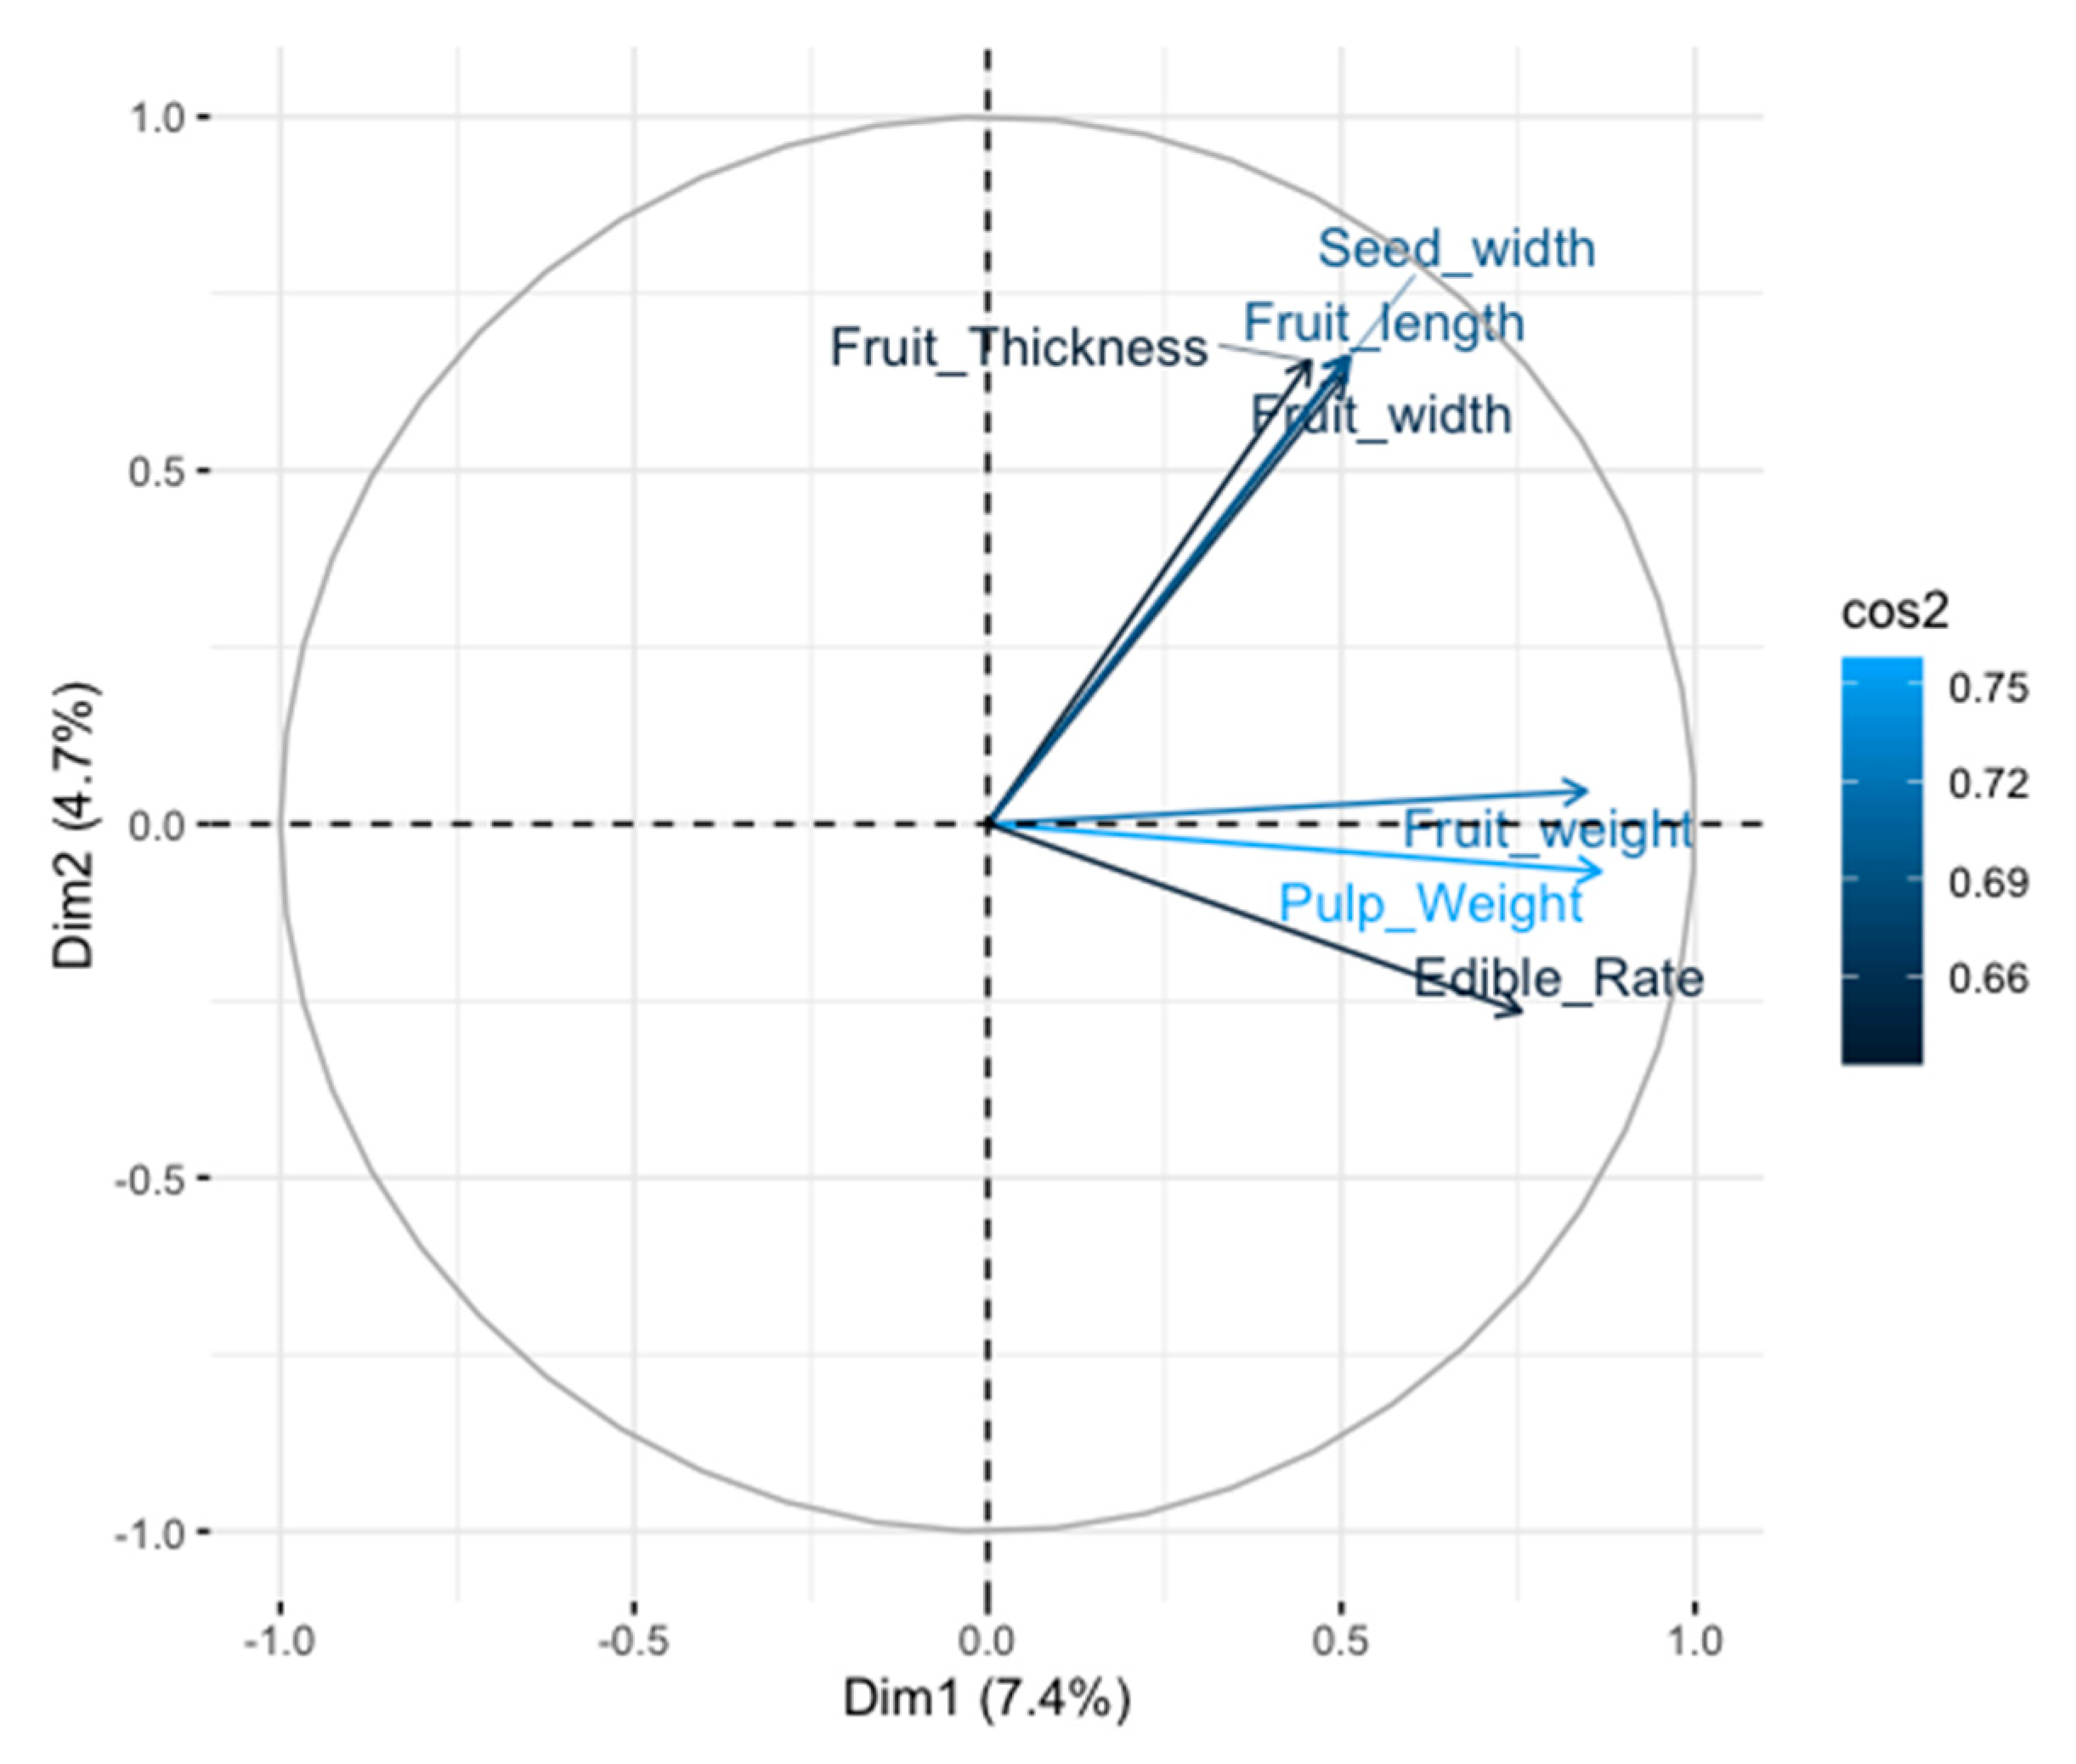
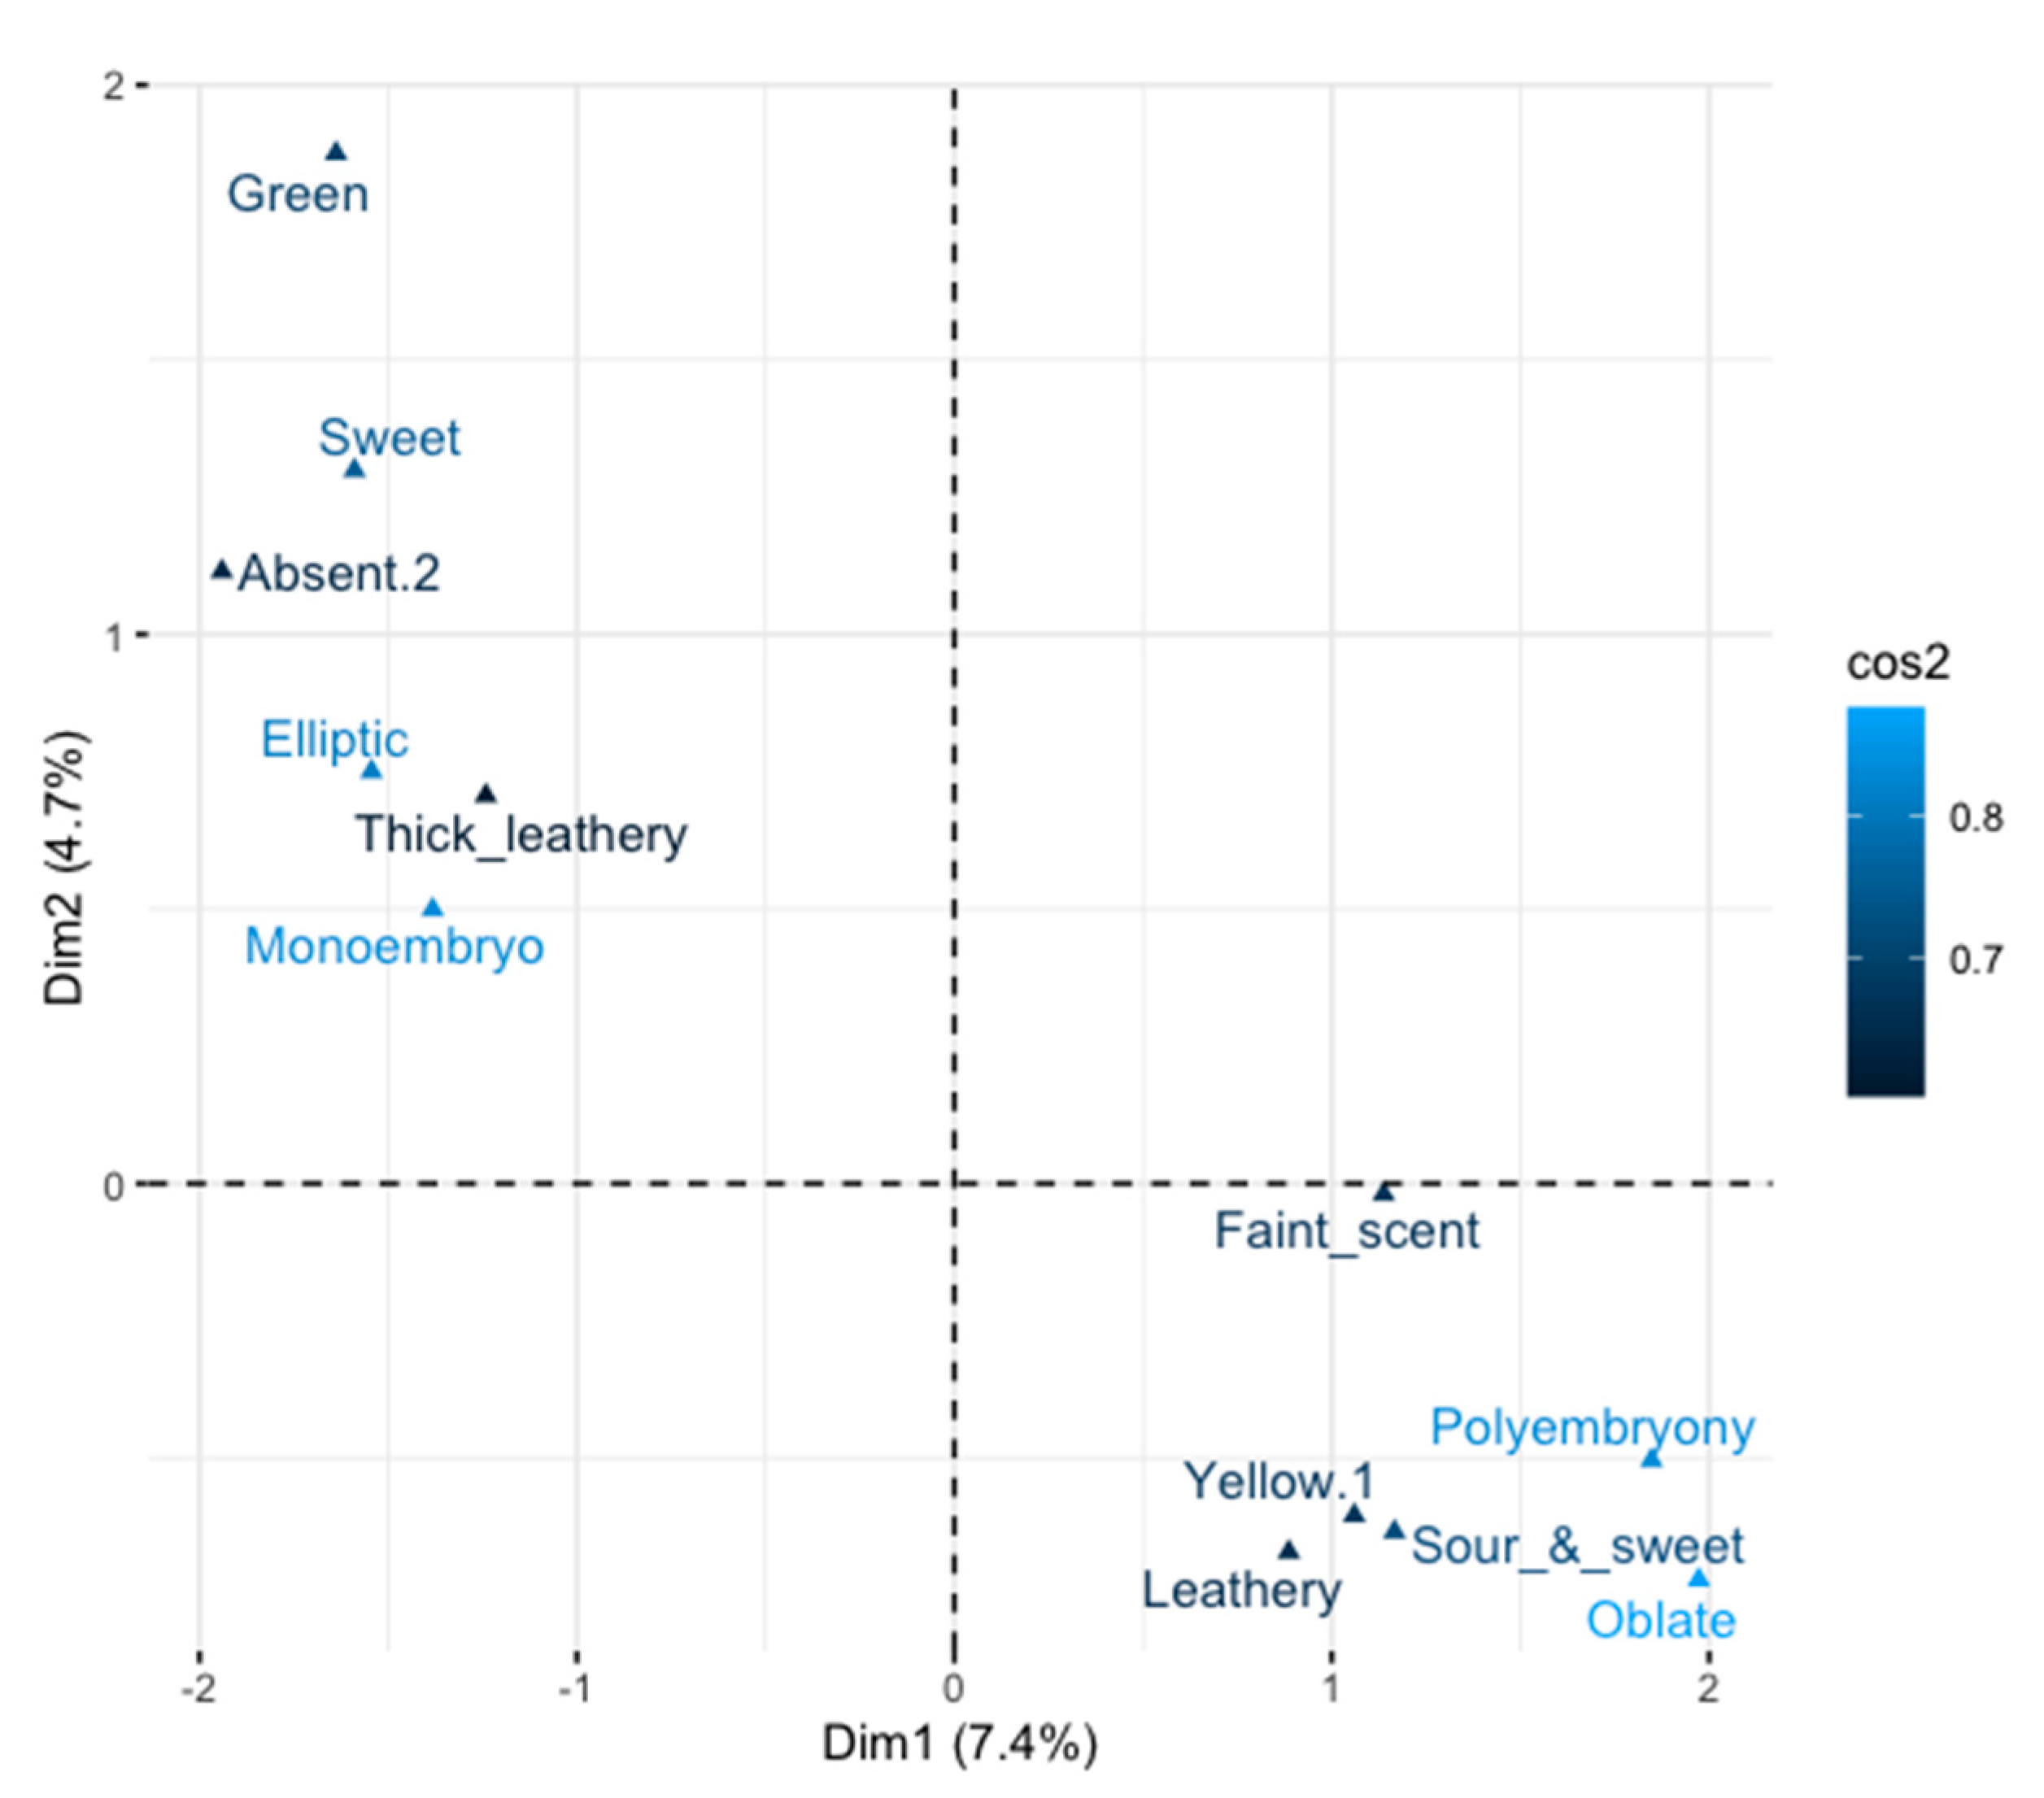
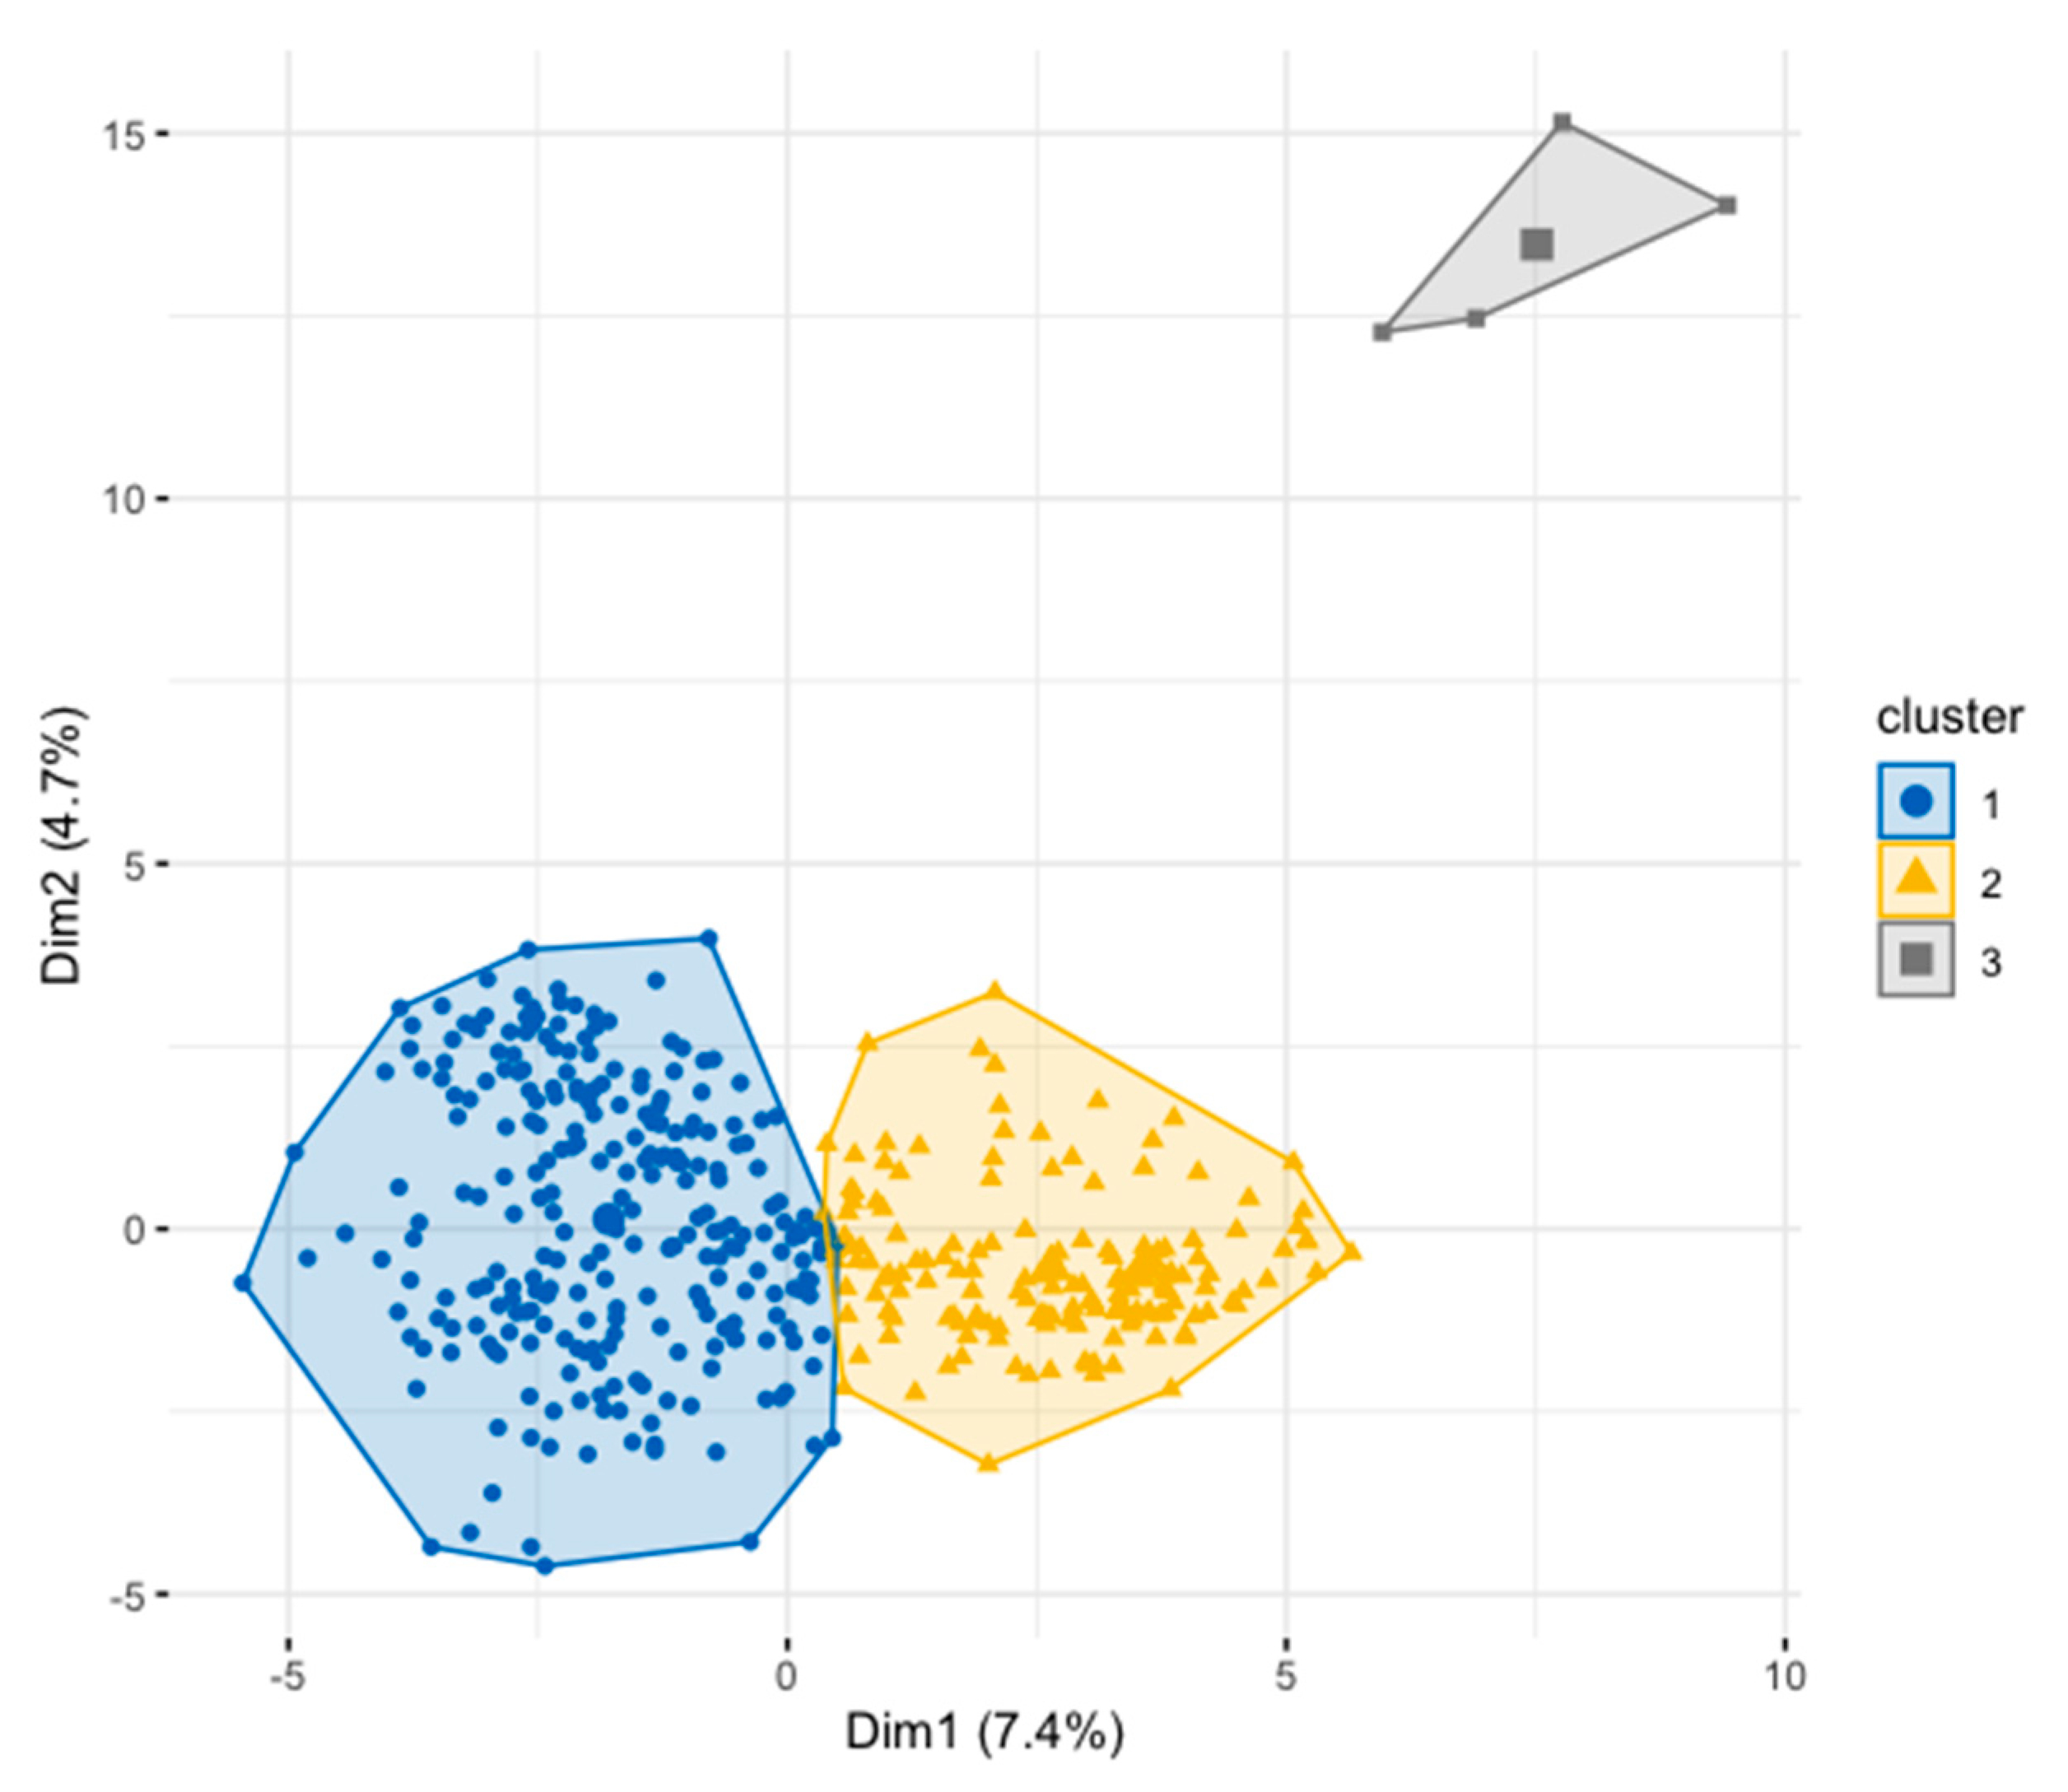
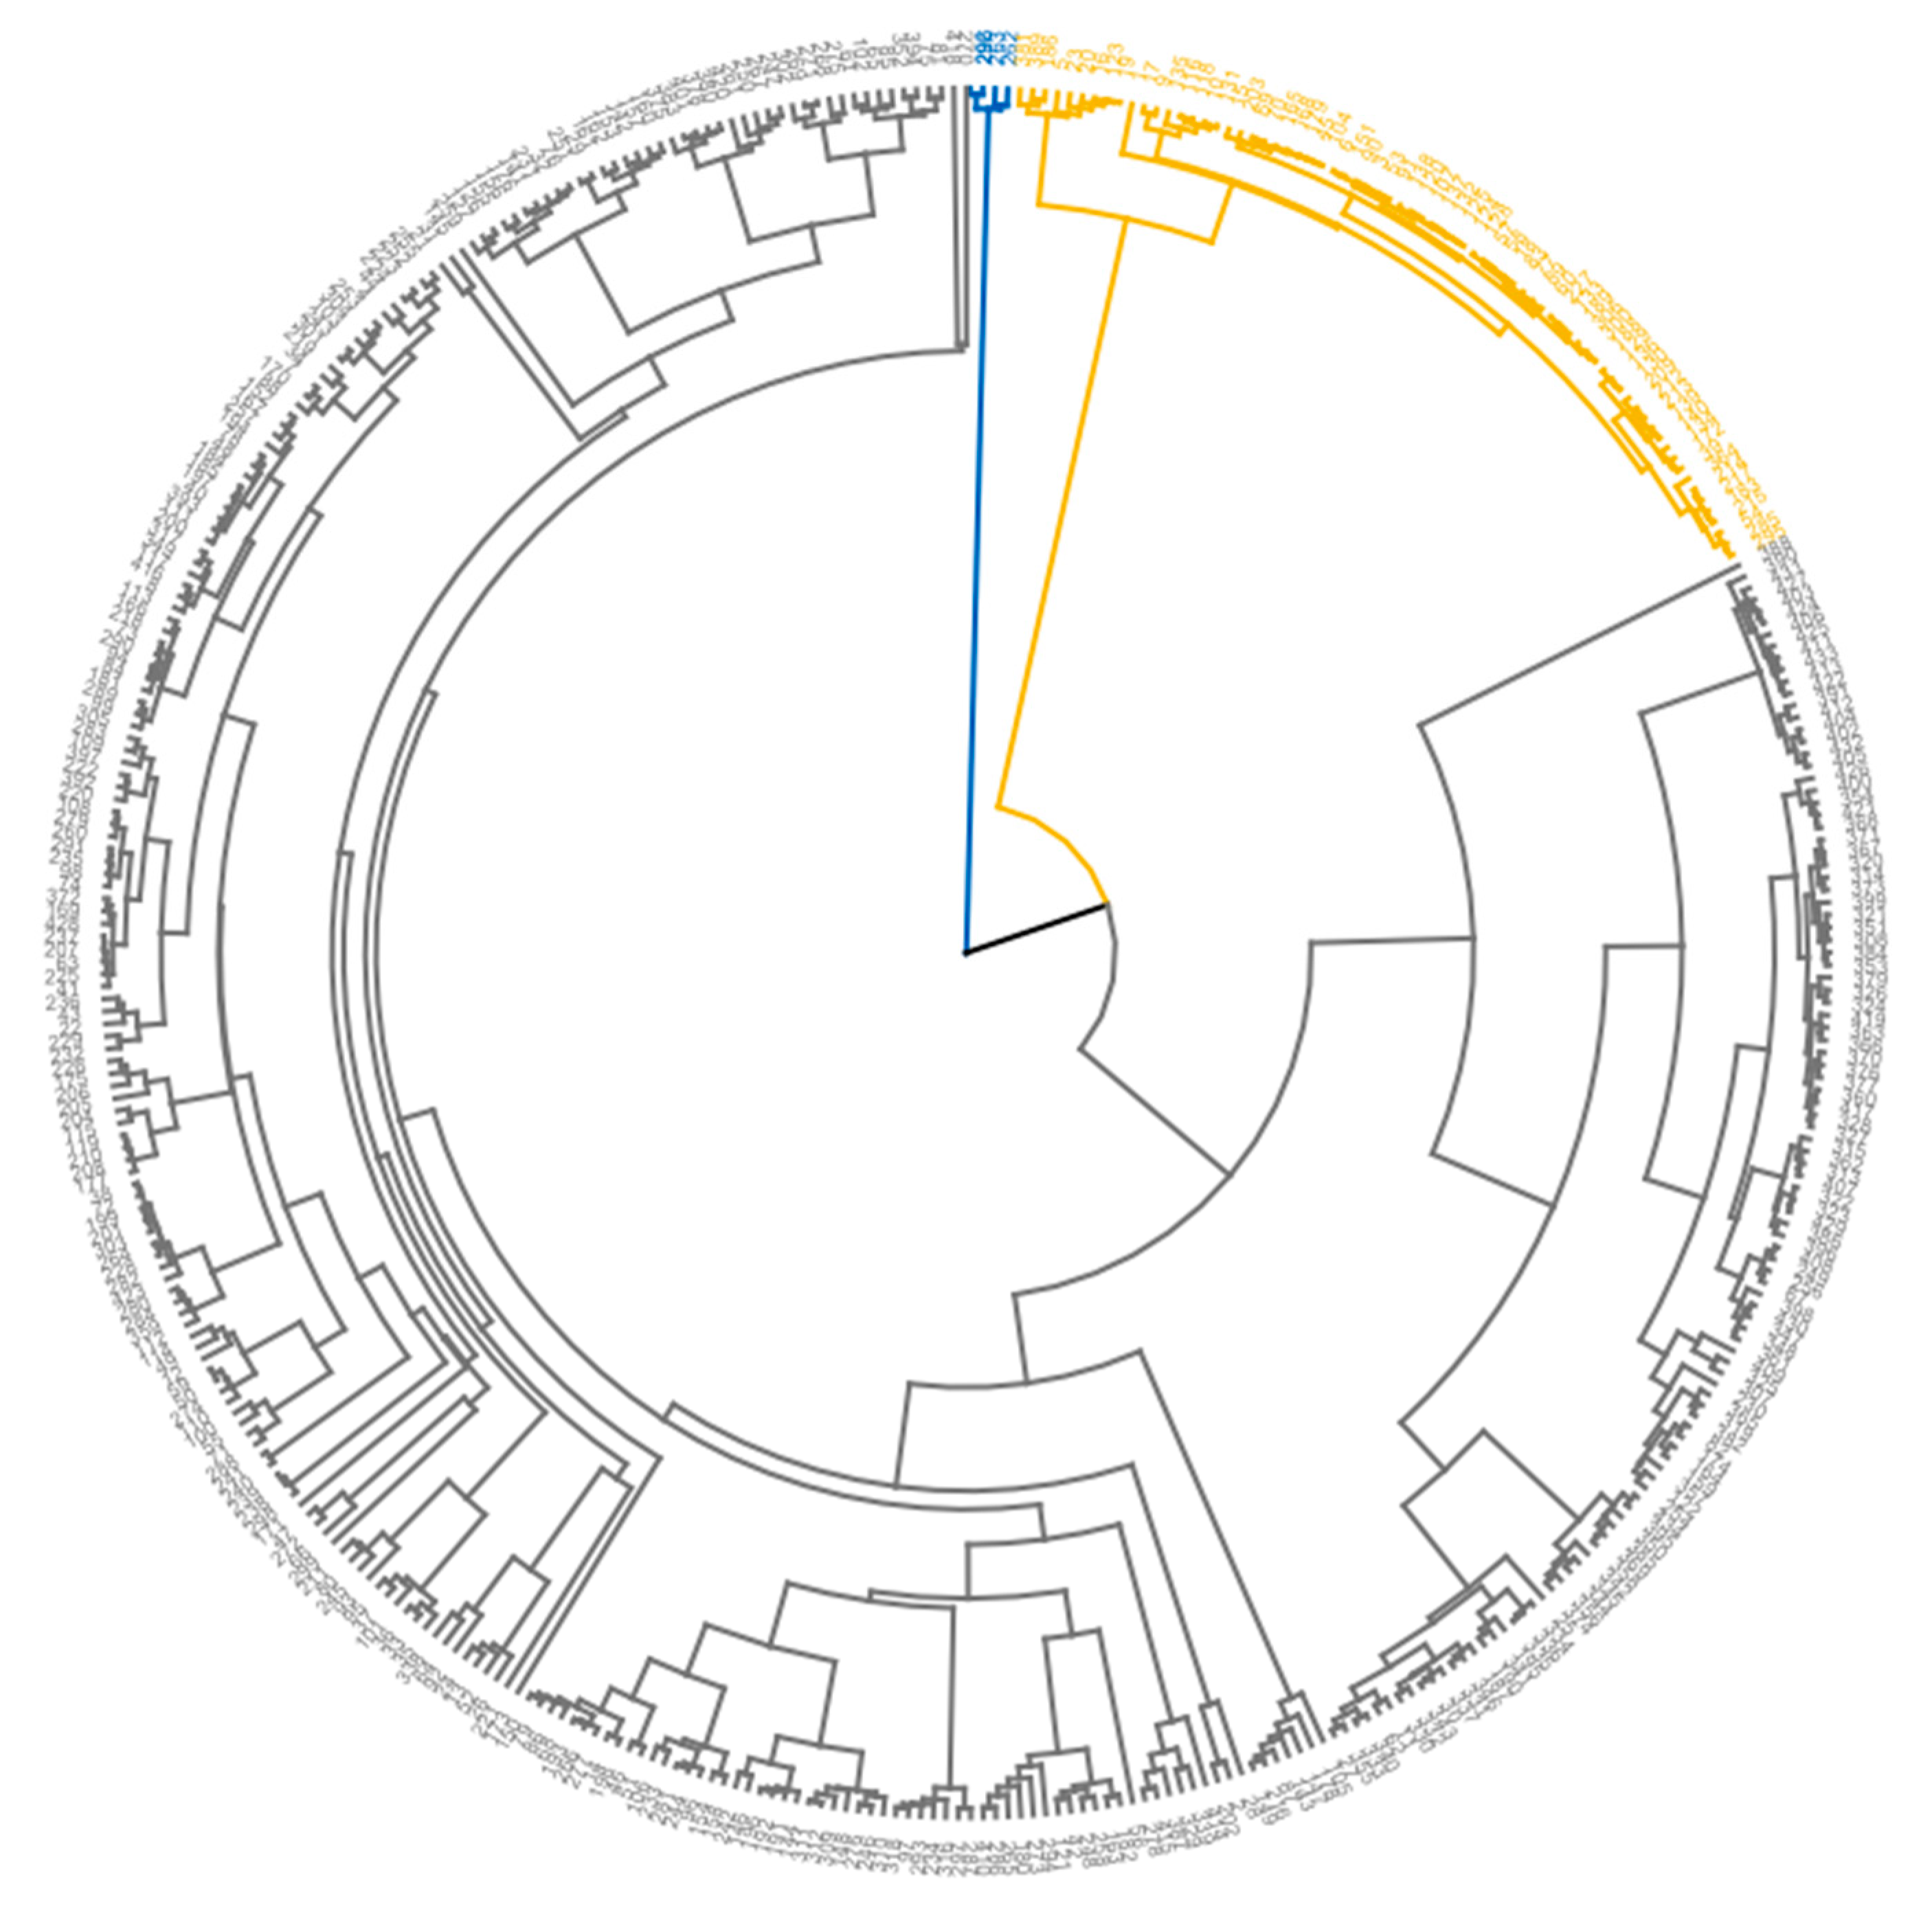
3.4. Relative Importance of Each Descriptor and Variability in the Germplasm

The Factor Analysis of Mixed Data (FAMD) performed on both quantitative and qualitative variables across the three regions of collection showed that the first 36 principal components have eigenvalues greater than 1 and accounted for 70.45% of the total variation in morphological traits. These components were kept for the hierarchical cluster analysis.
Quantitative traits including fruit thickness, fruit width, seed width, fruit length, pulp weight, fruit weight, edible rate, seed weight, peel weight, total soluble solid, fruit storage duration, leaf shape index, petiole length, and blade length were the most important variables which contributed to the classification of the accessions (Figure 6). The most discriminant qualitative traits were type of embryos, fruit shape, fruit aroma, fruit flavor, leaf texture, pericarp color, leaf surface, fruit break type, flesh color, leaf margin, inflorescence shape, anther color, quantity of pulp fiber, pulp fiber length, and edible quality (Figure 7). All the qualitative morphological traits except trunk girth and blade width contributed to the differentiation of the accessions.
The biplot of accessions grouped the accessions into three distinct groups with cluster 1 having the majority of individuals followed by cluster 2. Cluster 3 is made up of four accessions (Figure 8 and Figure 9).
The hierarchical cluster analysis revealed three clusters and depicts the relatedness and variability in the germplasm (Figure 9).
The Cluster 1 grouped 60.6% of all the accessions in the germplasm including all the accessions collected in Honghe, majority (86%) of the accessions collected in Lancang River and half of those collected in Nujiang. This cluster is characterized by a prevalence of monoembryonic accessions (Table S3). Leaves are characterized by lanceolate blade, wavy and entire texture, and wavy margin. The inflorescences are predominantly pyramidal with light purple anther. The fruits are mainly elliptic with pointed beak, shallow sinus, green and yellow pericarp color. The kernel is ellipsoid. This cluster is highly heterogenous in terms of length of pulp fiber. Fruits have generally no or faint scent aroma, sour and sweet and sweet flavor with medium edible quality (Table S3). Regarding the quantitative traits, accessions in Cluster 1 had distinctive leaf characteristic as exemplified by their high blade length, leaf shape index, petiole length. Accessions with high fruit soluble sugar content are found in this Cluster (Table 4).
Cluster 2 is composed of 38.48% of the accessions of which a minority (14%) is from Lancang River and about half of the accessions collected in Nujiang. In this Cluster, accessions are mainly polyembryonic, with lanceolate leaf blade, wavy leaf surface and margin, pyramidal inflorescence, light purple anther, oblate fruit shape, pointed fruit beak, shallow fruit sinus, yellow pericarp, golden fruit flesh, ellipsoid kernel, sour and sweet flavor, high quantity pulp fiber, long fiber, and medium edible quality (Table S3). The accessions in Cluster 2 have moderately higher fruit shelf life, fruit weight, peel weight, pulp weight, fruit length, fruit width, fruit thickness, seed weight, seed width, edible rate compared to the accessions of Cluster 1 and 3 (Table 4). Accessions with good fruit quality related traits (higher fruit weight, pulp weight, and edible rate) are found in this Cluster. Accessions in this cluster are valuable genetic resources for improvement of fruit quality.
Cluster 3 is composed of four accessions, namely YW-277, YW-278, YW-307, and YW-311. They are monoembryonic with lanceolate leaf blade, entire leaf surface, membracenous leaf texture, wavy leaf margin, and light purple anther. Fruits of these accessions are mainly oblate with mammiform beak, shallow sinus, yellow pericarp, golden yellow flesh, faint scent aroma, fresh and sweet and sour and sweet fruit flavor. This cluster grouped accessions with low and high quantity of pulp fiber, short and long pulp fiber, medium edible quality, and ellipsoid kernel shape (Table S3). The four accessions in this cluster were all collected from Nujiang (Table 4).
It is worth stressing that Clusters 1 and 2 have relatively large number of accessions and can be further divided into sub-groups.

4. Discussion

In this study, the diversity of 452 mango accessions from natural population collected in Yunnan Province in China, was assessed using 16 quantitative and 25 qualitative traits to identify potential parents for breeding programs and propose conservation strategies. Taken together, our results provide important insight into the variability of the studied mango germplasm. We also discussed the implications of our findings regarding mango genetic resources’ conservation and improvement.

4.1. Variability in the Mango Germplasm

The present study revealed a relatively low genetic diversity for traits related to the tree crown, leaf, and inflorescence contrary to the fruit related traits showing higher diversity within the mango germplasm. This confirms the importance of fruit related traits as good differentiation variables of mango accessions [39]. Phenological data showed that this germplasm was predominantly of medium flowering and maturity types. In the current germplasm YW-11, YW-14, and YW-25 are early maturing; YW-398, YW-399, and YW-400 are medium maturing, and YW-430, YW-439, and YW-441 are late maturing. Wang et al. [40] studied, in China, 16 introduced mango varieties from Australia having various maturity behaviors and showed the different applications that can be made, in view of their performance, in terms of integration in cropping system and breeding program. Having mango cultivars with diverse production windows during the year—early, medium, and late mature—in orchards is of high interest to the farmers as it allows them to supply the market all year round especially to substantially increase their income [11].
As for the dendrometric traits, the shape of the tree crown was less diversified among accessions in this study and was predominantly spherical with intermediate growth habit. Similarly, Rymbai et al. [41] studied eight mango cultivars from different agro-climatic areas in India and observed a monomorphism crown shape (semi-circular) for all the cultivars. These results are also in line with Toili et al. [39] who evaluated 98 accessions from Kenya and showed that the crown shape of 70% of the germplasm was semi-circular with a growth habit predominantly spreading. However, Rajan et al. [42] reported significant difference in canopy structure among 26 Indian mango cultivars. Collectively, these findings indicate that the crown shape and tree growth habit depend on the composition of the collection and the origin of the accessions.
The leaf and inflorescence related traits poorly differentiated the accessions. The inflorescences were mostly pyramidal with pentamerous flowers and light-yellow petal colors. Similar leaf and inflorescence related characteristics were observed for a collection of 18 mango varieties from Sri Lanka [43]. These authors highlighted that leaf and inflorescence related traits did not vary among the mango accessions studied.
Only the fruit related traits mostly varied among accessions. The fruits with elliptic and oblate shape with pointed beak were dominant; the flesh with golden yellow and orange yellow colors was dominant; the shallow fruit sinus and yellow pericarp are predominant. The organoleptic quality of the fruits is mainly depicted by sour and sweet taste, faint scent aroma, long fiber with an overall medium edible quality. Kernels are primarily ellipsoid followed by oblong shape. Ahmed and Mohamed [44] studying the diversity within 30 mango cultivars in Sudan using the fruits descriptors, reported high intraspecific diversity within the studied population. These authors reported variability mainly for the fruit morphometric traits (fruit size, weight, and circumference), the shape (fruit shape, apex shape, and slope of shoulder), the seed traits (length, width, thickness, and weight) and also for the fruit quality (pulp fiber content). Similarly, Kulkarni et al. [45] reported a large diversity for India mango collection made up of over 300 different mango accessions, based on the fruit size. Gitahi et al. [22] used both morphological and molecular markers to assess the diversity of 36 local mango accessions from Kenya and reported high morphological diversity based on the fruit traits versus a low genetic diversity based on SSR markers. These authors hypothesized that this difference is due to high environmental influence on the fruit traits and the proximity of the sampling locations to each other. In short, the variability revealed by the fruit traits compared to other tree morphometric traits in the present study confirms the fruit traits as the major descriptors to differentiate mango trees. Moreover, the fruit traits seem to be origin-dependent since the accessions having fruits with the best quality were found in the same cluster (from the same location).

4.2. Implications for Conservation and Utilization of Mango Genetic Resources

The morphological characterization performed in this study has crucial implications on both mango germplasm utilization and conservation. The high variability in important fruit quality traits suggests that the germplasm has a broad genetic base for those traits, and significant genetic advance can be made when they are targeted for selection. However, their heritability needs to be estimated for their better exploitation in breeding programs. High and positive correlations (R2 > 50%) between fruit quality traits suggest that the association among those traits is of biological interest [46] and can potentially influence selection strategies. In fact, indirect selection for peel weight which requires more time and resource to record can be estimated from fruit weight, which is more straightforward to measure. This strategy would be more efficient in terms of time and resource allocation [47].
A comprehensive assessment of genetic variability and relatedness of germplasm requires the use of clustering analysis. Clustering enables the grouping of accessions based on their similarities or dissimilarities [48]. Our mango germplasm was grouped into three main clusters. Two of the clusters have large number of accessions and can be further divided into sub-groups revealing a relatively high diversity in the germplasm. Even though morphological characterization is very relevant to appraise the diversity in a collection, most of the characters are influenced by environmental conditions, and the number of descriptors are not always enough to reveal the full extent of the variability. As such, grouping of accessions based on morphological traits may yield clusters of individuals that are morphologically different from each other in regard to major traits of interest [49]. We suggest that this study should be backed up with molecular characterization for a comprehensive assessment of the genetic diversity within the collection.
Genetic variability is the base of crop improvement. Breeders commonly select and cross elite lines within defined germplasm pool hoping to assemble better allele combinations in the offspring [50]. However, new genetic resources are needed to sustain the continued genetic gain. The present study identified potential materials to be incorporated in genetic improvement of mango for both monoembryonic and polyembryonic types. In fact, elite individuals from each of the three clusters are potential parents for hybridization and improvement of mango varieties [51,52]. Our results provide sound basis for selection of genetic resources to gain better understanding in the genetic architecture of important traits including edible quality, fruit weight, soluble sugar contents, and pulp weight. For instance, F1 mapping population can be developed by selecting contrasting parents from Clusters 1 and 2 to map quantitative traits loci (QTL) underlying edible rate and total soluble content [18,53]. Such endeavor would benefit from existing high-density genetic maps for mango [53]. In addition, we suggest the screening of the germplasm for tolerance to biotic (e.g., Anthracnose, fruit flies) and abiotic (e.g., drought, high and low temperatures) stresses to identify new sources of tolerance or resistance for mango improvement programs.
The principal component analysis as a data reduction technique enables the identification of variables that explains the most of the variation observed in the dataset [48]. Not all the variables were able to discriminate the accessions in our collection. Out of the 41 descriptors, 29 showed high contribution to the differentiation of the accessions. Further characterization may focus on the most discriminant variables identified in our study. For conservation purposes, we suggest that representative accessions from each cluster should be selected for conservation. This will help the maintenance of the diversity in the initial germplasm while enabling the curators to save time, space, and other resources allocated for the germplasm conservation. Similar approaches using morphological descriptors was applied to define core collection in chickpea genetic resources [54,55], maize [56], cassava [57] and yam [58]. Besides, the findings of this study could guide designing of on-farm conservation strategies of mango germplasm in their natural habitats. This involves awareness raising on the importance of mango genetic resources and identification of volunteer custodians. Successful on-farm conservation strategies would also depend on getting insight into the reasons underlying the conservation of genetic resources. For instance, in India, mango genetic resources custodians are mainly motivated by economic gain; prestige for having high diversity; exploitation of specific traits like taste and aroma; and material exchange with relatives, friends, and neighbors [59].

5. Conclusions

The diversity was evaluated in a collection of 452 mango accessions from China. There was a low genetic variability in the collection. The groups of accessions were formed with contrasting characteristics for qualitative and quantitative traits. There was a wide range of maturity groups providing opportunities for year-round mango production. The accessions YW-277, YW-278, YW-307, and YW-311 had excellent fruit quality traits. This study provides the basis for selection of parents for hybridization and to generate mapping populations and get further understanding into the genetic architecture of several traits of interest. Representative accessions from each cluster should be selected for conservation as a first step toward the definition of a working collection.

Supplementary Materials

The following are available online at https://0-www-mdpi-com.brum.beds.ac.uk/1424-2818/12/1/27/s1, Table S1, distribution of qualitative traits; Table S2, correlation matrix of the quantitative descriptors; Table S3, description of the clusters based on proportion (%) of categorical descriptors.

Author Contributions

Conceptualization, C.Z., Z.N., and Y.C.; data curation, C.Z.; formal analysis, D.X., T.B., X.L., and F.Z.; funding acquisition, Z.N., and Y.C.; investigation, C.Z., D.X., and T.B.; methodology, C.Z., T.B., X.L., and F.Z.; project administration, Z.N.; software, X.L.; supervision, Z.N. and Y.C.; validation, D.X. and Z.N.; visualization, D.X., X.L. and F.Z.; writing—original draft, C.Z. and D.X.; writing—review and editing, Y.C. All authors have read and agreed to the published version of the manuscript.

Funding

This research was supported by Yunnan Natural Science Foundation (2010CD005) and Yunnan Youth Foundation (2019FD079).

Conflicts of Interest

The author(s) declare(s) that there is no conflict of interests regarding the publication of this article.

References

  1. Saúco, V.G. Trends in world mango production and marketing. Acta Hortic. 2017, 1183, 351–363. [Google Scholar] [CrossRef]
  2. Douthett, B.D.G. The mango: Asia’s king of fruits. Ethnobot. Leafl. 2001, 2000, 4. [Google Scholar]
  3. Huang, C.Y.; Kuo, C.H.; Wu, C.H.; Kuan, A.W.; Guo, H.R.; Lin, Y.H.; Wang, P.K. Free radical-scavenging, anti-inflammatory, and antibacterial activities of water and ethanol extracts prepared from compressional-puffing pretreated mango (Mangifera indica L.) peels. J. Food Qual. 2018, 2018, 1025387. [Google Scholar] [CrossRef] [Green Version]
  4. Schulze-Kaysers, N.; Feuereisen, M.M.; Schieber, A. Phenolic compounds in edible species of the Anacardiaceae family—A review. RSC Adv. 2015, 5, 73301–73314. [Google Scholar] [CrossRef]
  5. Shah, K.A.; Patel, M.B.; Patel, R.J.; Parmar, P.K. Mangifera indica (Mango). Pharmacogn. Rev. 2019, 4, 42–48. [Google Scholar] [CrossRef] [PubMed]
  6. FAO. FAO Statistical Division. Available online: http://www.fao.org/statistics/en/ (accessed on 10 January 2020).
  7. Gao, A.; Chen, Y.; Luo, R.; Huang, J.; Zhao, Z.; Wang, W.; Wang, Y.; Dang, Z. Development status of Chinese mango industry in 2018. Adv. Agric. Hortic. Entomol. 2019, 2019, 1–6. [Google Scholar]
  8. Chen, Q.B. Perspectives on the mango industry in mainland China. In Proceedings of the IX International Mango Symposium, Sanya, China, 8–12 April 2013; pp. 25–36. [Google Scholar]
  9. Luo, C.; He, X.H.; Chen, H.; Hu, Y.; Ou, S.J. Genetic relationship and diversity of Mangifera indica L.: Revealed through SCoT analysis. Genet. Resour. Crop Evol. 2012, 59, 1505–1515. [Google Scholar] [CrossRef]
  10. Normand, F.; Lauri, P.; Legave, J.M. Climate change and its probable effects on mango production and cultivation. Acta Hortic. 2015, 1075, 21–32. [Google Scholar] [CrossRef]
  11. Khan, I.A.; Khan, A.S.; Rajwana, I.A.; Khan, A.A.; Azmat, M.A.; Raza, S.A. Premium quality mango genotypes for extended harvest season. HortScience 2016, 51, 1609–1612. [Google Scholar] [CrossRef] [Green Version]
  12. Bally, I.S.E.; Dillon, N.L. Mango (Mangifera indica L.). In Advances in Plant Breeding Strategies: Fruits; Al-Khayri, J.M., Jain, S.M., Johnson, D.V., Eds.; Springer International Publishing AG: Basel, Switzerland, 2018; pp. 811–896. ISBN 9783319919447. [Google Scholar]
  13. Rajan, S.; Hudedamani, U. Genetic resources of mango: Status, threats, and future prospects. In Conservation and Utilization of Horticultural Genetic Resources; Rajasekharan, P.E., Rao, V.R., Eds.; Springer Nature Singapore Pte Ltd.: Singapore, 2019; pp. 217–250. ISBN 9789811336683. [Google Scholar]
  14. Warschefsky, E.J.; von Wettberg, E.J.B. Population genomic analysis of mango (Mangifera indica) suggests a complex history of domestication. New Phytol. 2019, 222, 2023–2037. [Google Scholar] [CrossRef]
  15. FAO. The Second Report on the State of the World’s Plant Genetic Resources for Food and Agriculture; FAO: Rome, Italy, 2010. [Google Scholar]
  16. Dwivedi, S.L.; Ceccarelli, S.; Blair, M.W.; Upadhyaya, H.D.; Are, A.K.; Ortiz, R. Landrace germplasm for improving yield and abiotic stress adaptation. Trends Plant Sci. 2016, 21, 31–42. [Google Scholar] [CrossRef] [PubMed]
  17. Sennhenn, A.; Prinz, K.; Gebauer, J.; Whitbread, A.; Jamnadass, R.; Kehlenbeck, K. Identification of mango (Mangifera indica L.) landraces from Eastern and Central Kenya using a morphological and molecular approach. Genet. Resour. Crop Evol. 2014, 61, 7–22. [Google Scholar] [CrossRef]
  18. Khan, A.S.; Ali, S.; Khan, I.A. Morphological and molecular characterization and evaluation of mango germplasm: An overview. Sci. Hortic. (Amsterdam) 2015, 194, 353–366. [Google Scholar] [CrossRef]
  19. Luo, C.; He, X.H.; Chen, H.; Ou, S.J.; Gao, M.P.; Brown, J.S.; Tondo, C.T.; Schnell, R.J. Genetic diversity of mango cultivars estimated using SCoT and ISSR markers. Biochem. Syst. Ecol. 2011, 39, 676–684. [Google Scholar] [CrossRef]
  20. Rajwana, A.I.; Tabbasam, N.; Malik, A.U.; Malik, S.A.; Mehboob-ur-Rahman; Zafar, Y. Assessment of genetic diversity among mango (Mangifera indica L.) genotypes using RAPD markers. Sci. Hortic. (Amsterdam) 2008, 117, 297–301. [Google Scholar] [CrossRef]
  21. Ramessur, A.D.; Ranghoo-Sanmukhiya, V.M. RAPD marker-assisted identification of genetic diversity among mango (Mangifera indica) varieties in Mauritius. Int. J. Agric. Biol. 2011, 13, 167–173. [Google Scholar]
  22. Gitahi, R.; Kasili, R.; Kyallo, M.; Kehlenbeck, K. Diversity of threatened local mango landraces on smallholder farms in Eastern Kenya. For. Trees Livelihoods 2016, 25, 239–254. [Google Scholar] [CrossRef] [Green Version]
  23. Rajan, S.; Kumar, R.; Yadava, L.P.; Sharan, R.; Bhal, C.; Verma, J.P. Variability pattern in mango (Mangifera indica L.) accessions of diverse geographical origins. Acta Hortic. 2013, 992, 341–352. [Google Scholar] [CrossRef]
  24. Mussane, C.R.B.; Biljon, A.V.; Herselman, L. Morphological and genetic characterization of mango varieties in Mozambique. In Proceedings of the Second RUFORUM Biennial Meeting, Entebbe, Uganda, 20–24 September 2010; pp. 991–995. [Google Scholar]
  25. Ye, C.; Li, Y.; Li, Q.; Hua, W.; Bian, Z. Tropical Crop Germplasm Resources Data Standards (Chinese Edition); China Agriculture Press: Beijing, China, 2000; ISBN 978-7109135673. [Google Scholar]
  26. IPGRI. Descriptors for Mango (Mangifera indica); IPGRI: Rome, Italy, 2006; Volume 84, ISBN 9789290436522. [Google Scholar]
  27. Joshi, N.; Joshi, A. Urban tree canopy analysis. Pollut. Res. 2014, 33, 427–431. [Google Scholar]
  28. Cichy, K.A.; Snapp, S.S.; Blair, M.W. Plant growth habit, root architecture traits and tolerance to low soil phosphorus in an Andean bean population. Euphytica 2009, 165, 257–268. [Google Scholar] [CrossRef]
  29. Lenard, E. Habits of trees and shrubs in landscape design. Archit. Civ. Eng. Environ. 2008, 1, 13–20. [Google Scholar]
  30. SAC. Fresh Fruits and Vegetables—Sampling; GB/T 8855-2008; The Standardization Administration of China: Beijing, China, 2008.
  31. Jha, S.K.; Sethi, S.; Srivastav, M.; Dubey, A.K.; Sharma, R.R.; Samuel, D.V.K.; Singh, A.K. Firmness characteristics of mango hybrids under ambient storage. J. Food Eng. 2010, 97, 208–212. [Google Scholar] [CrossRef]
  32. Shannon, C.E. A mathematical theory of communication. Bell Syst. Technol. J. 1948, 27, 379–423. [Google Scholar] [CrossRef] [Green Version]
  33. Abdi, H. Bonferroni test. In Encyclopedia of Measurement and Statistics; Salkind, J.N., Ed.; SAGE: Thousand Oaks, CA, USA, 2007; pp. 103–107. [Google Scholar]
  34. Pagès, J. Multiple Factor Analysis by Example Using R; CRC Press: Boca Raton, FL, USA, 2014. [Google Scholar]
  35. Husson, F.; Lê, S.; Pagès, J. Exploratory Multivariate Analysis by Example Using R, 2nd ed.; CRC Press: Boca Raton, FL, USA, 2017. [Google Scholar]
  36. Sebastien, L.; Josse, J.; Husson, F. FactoMineR: An R package for multivariate analysis. J. Stat. Softw. 2008, 25, 1–18. [Google Scholar]
  37. Wei, T.; Simko, V. R Package “Corrplot”: Visualization of a Correlation Matrix, Version 0.84; CRAN: 2017. Available online: https://github.com/taiyun/corrplot (accessed on 10 January 2020).
  38. R Core Team. R: A Language and Environment for Statistical Computing; R Foundation for Statistical Computing: Vienna, Austria, 2019. [Google Scholar]
  39. Toili, M.; Rimberia, F.; Nyende, A.; Sila, D. Morphological diversity of mango germplasm from the Upper Athi River region of eastern Kenya: An analysis based on non- fruit descriptors. African J. Food, Agric. Nutr. Dev. 2016, 16, 10913–10935. [Google Scholar] [CrossRef]
  40. Wang, S.B.; Wu, H.X.; Ma, W.H.; Ma, X.W.; Zhan, R.L.; Yao, Q.S.; Sun, G.M.; Xie, J.H. Evaluation of sixteen introduced mango cultivars in Zhanjiang, China. Acta Hortic. 2013, 992, 211–220. [Google Scholar] [CrossRef]
  41. Rymbai, H.; Laxman, R.H.; Dinesh, M.R.; Sunoj, V.S.J.; Ravishankar, K.V.; Jha, A.K. Diversity in leaf morphology and physiological characteristics among mango (Mangifera indica) cultivars popular in different agro-climatic regions of India. Sci. Hortic. (Amsterdam) 2014, 176, 189–193. [Google Scholar] [CrossRef]
  42. Rajan, S.; Kumar, R.; Negi, S.S. Variation in canopy characteristics of mango (Mangifera indica L.) cultivars from diverse eco-geographical regions. J. Appl. Hort 2001, 3, 95–97. [Google Scholar]
  43. Krishnapillai, N.; Wilson Wijeratnam, R.S. Morphometric analysis of mango varieties in Sri Lanka. Aust. J. Crop Sci. 2016, 10, 784–792. [Google Scholar] [CrossRef]
  44. Ahmed, T.H.M.; Mohamed, Z.M.A. Diversity of mango (Mangifera indica L.) cultivars in Shendi Area: Morphological fruit characterization. Int. J. Res. Agric. Sci. 2015, 2, 2348–3997. [Google Scholar]
  45. Kulkarni, M.M.; Burondkar, M.M.; Dalvi, N.V.; Salvi, B.R.; Haldankar, P.M.; Bhattacharyya, T. Mango fruit size diversity found in Konkan. Adv. Agric. Res. Technol. J. 2019, 3, 43–46. [Google Scholar]
  46. Skinner, D.Z.; Bauchan, G.R.; Auricht, G.; Hughes, S. A method for the efficient management and utilization of large germplasm collections. Crop Sci. 1999, 39, 1237–1242. [Google Scholar] [CrossRef]
  47. Maia, M.C.C.; de Araújo, L.B.; dos Santos Dias, C.T.; de Oliveira, L.C.; Vasconcelos, L.F.L.; de Carvalho Júnior, J.E.V.; Simeão, M.; Bastos, Y.G.M. Selection of mango rosa genotypes in a breeding population using the multivariate-biplot method. Ciência Rural 2016, 46, 1689–1694. [Google Scholar] [CrossRef] [Green Version]
  48. Jolliffe, I.T. Principal Component Analysis, 2nd ed.; Bickel, P., Diggle, P., Fienberg, S., Krickeberg, K., Olkin, I., Wermuth, N., Zeger, S., Eds.; Springer: New York, NY, USA, 2002. [Google Scholar]
  49. Prohens, J.; Blanca, J.M.; Nuez, F. Morphological and molecular variation in a collection of eggplants from a secondary center of diversity: Implications for conservation and breeding. J. Am. Soc. Hortic. Sci. 2005, 130, 54–63. [Google Scholar] [CrossRef] [Green Version]
  50. Cobb, J.N.; Juma, R.U.; Biswas, P.S.; Arbelaez, J.D.; Rutkoski, J.; Atlin, G.; Hagen, T.; Quinn, M.; Ng, E.H. Enhancing the rate of genetic gain in public-sector plant breeding programs: Lessons from the breeder’s equation. Theor. Appl. Genet. 2019, 132, 627–645. [Google Scholar] [CrossRef] [PubMed] [Green Version]
  51. Negi, S.S.; Rajan, S.; Kumar, R. Developing new mango varieties through hybridization. Acta Horticulturae 2000, 509, 159–160. [Google Scholar] [CrossRef]
  52. Vasanthaiah, H.K.N.; Ravishankar, K.V.; Mukunda, G.K. Mango. In Genome Mapping and Molecular Breeding in Plants. Volume 4: Fruits and Nuts; Kole, C., Ed.; Springer: Berlin/Heidelberg, Germany, 2007. [Google Scholar]
  53. Luo, C.; Shu, B.; Yao, Q.; Wu, H.; Xu, W.; Wang, S. Construction of a high-density genetic map based on large-scale marker development in mango using specific-locus amplified fragment sequencing (SLAF-seq). Front. Plant Sci. 2016, 7, 1–8. [Google Scholar] [CrossRef] [Green Version]
  54. Upadhyaya, H.D.; Ortiz, R. A mini core subset for capturing diversity and promoting utilization of chickpea genetic resources in crop improvement. Theor. Appl. Genet. 2001, 102, 1292–1298. [Google Scholar] [CrossRef] [Green Version]
  55. Archak, S.; Tyagi, R.K.; Harer, P.N.; Mahase, L.B.; Singh, N.; Dahiya, O.P.; Nizar, M.A.; Singh, M.; Tilekar, V.; Kumar, V.; et al. Characterization of chickpea germplasm conserved in the Indian National Genebank and development of a core set using qualitative and quantitative trait data. Crop J. 2016, 4, 417–424. [Google Scholar] [CrossRef] [Green Version]
  56. Malosetti, M.; Abadie, T. Sampling strategy to develop a core collection of Uruguayan maize landraces based on morphological traits. Genet. Resour. Crop Evol. 2001, 48, 381–390. [Google Scholar] [CrossRef]
  57. Bhattacharjee, R.; Dumet, D.; Ilona, P.; Folarin, S.; Franco, J. Establishment of a cassava (Manihot esculenta Crantz) core collection based on agro-morphological descriptors. Plant Genet. Resour. 2012, 10, 119–127. [Google Scholar] [CrossRef]
  58. Girma, G.; Bhattacharjee, R.; Lopez-Montes, A.; Gueye, B.; Ofodile, S.; Franco, J.; Abberton, M. Re-defining the yam (Dioscorea spp.) core collection using morphological traits. Plant Genet. Resour. 2018, 16, 193–200. [Google Scholar] [CrossRef]
  59. Gajanana, T.; Dinesh, M.; Rajan, S.; Vasudeva, R.; Singh, S.K.; Lamers, H.A.; Parthasarathy, V.; Sthapit, B.; Rao, V.R. Motivation for on-farm conservation of mango (Mangifera indica) Diversity in India—A case study. Indian J. Plant Genet. Resour. 2015, 28, 1. [Google Scholar] [CrossRef] [Green Version]
Figure 1. Collection sites of the mango germplasm resources in China.
Diversity 12 00027 g001
Figure 2. Diversity of the fruit shape within the mango germplasm. Accession name is in brackets.
Diversity 12 00027 g002
Figure 3. Diversity of color of the fruit flesh within the mango germplasm. Accession name is in brackets.
Diversity 12 00027 g003
Figure 4. Diversity of color of the fruit pericarp within the mango germplasm. Accession name is in brackets.
Diversity 12 00027 g004
Figure 5. Correlogram for quantitative traits. Positive and negative correlations are displayed in blue and in red color, respectively. Correlation coefficients are proportional to color intensity, and the size of the circle is proportional to the correlation coefficients.
Diversity 12 00027 g005
Figure 6. Correlation circle based on principal component analysis; only variables significantly represented on the principal components (cos2 > 0.5) are displayed.
Diversity 12 00027 g006
Figure 7. Biplot of qualitative variables significantly represented on the principal components 1 and 2.
Diversity 12 00027 g007
Figure 8. Cluster plots showing the number of clusters of the mango accessions revealed by the hierarchical cluster analysis based on both quantitative and qualitative data.
Diversity 12 00027 g008
Figure 9. Dendrogram showing the grouping of accessions. Grey, yellow, and blue colors represent Clusters 1, 2, and 3, respectively.
Diversity 12 00027 g009
Table 1. Diversity of qualitative traits in the germplasm as revealed by Shannon–Weaver index.
TraitsShannon–Weaver Diversity Index
Crown shape0.3
Leaf blade shape0.8
Leaf surface0.7
Leaf texture1.0
Leaf apex shape0.1
Leaf margin0.6
Inflorescence shape0.4
Type flower1.1
Flesh color1.5
Petals color0.1
Anther color0.6
Fruit shape1.2
Fruit beak type0.6
Fruit sinus type0.6
Pericarp color1.3
Flowering habit0.4
Fruit maturity characteristics0.5
Kernel shape0.8
Type embryos0.8
Fruit aroma1.3
Fruit flavor1.2
Tree growth habit0.5
Quantity fiber pulp1
Fiber length pulp1
Edible quality0.7
Average0.8 ± 0.3
Table 2. Descriptive statistics for the morphological quantitative descriptors.
Quantitative DescriptorsMean ± SDCoefficient of Variation (%)Range
Dendrometric traits
Trunk girth (cm)426 ± 10134314–753
Blade length (cm)21 ± 3.71712.7–37.7
Blade width (cm)5.6 ± 1173.2–9.7
Leaf shape index3.8 ± 0.5142.3–6.7
Petiole length (cm)4.1 ± 1232.1–12.6
Fruit traits
Storage duration of fruits (days)3.7 ± 1.1302–9
Fruit weight (g)88.9 ± 47.65310.4–272
Peel weight (g)13.4 ± 5.5412.1–33.9
Pulp weight (g)56.8 ± 40.4713.2–225
Fruit length (cm)7.6 ±1.8232.5–12.4
Fruit width (cm)4.5 ± 0.9211.2–7.5
Fruit thickness (cm)4 ± 0.7181–6
Total soluble solid17.4 ± 4.0231.8–61.6
Edible rate (%)58.3 ± 14.12414–86.5
Seed traits
Seed weight (g)19.1 ± 6.9361–51
Seed width (cm)6.7 ± 1.6242.4–11.1
Table 3. Comparison of the performance of the studied mango germplasm among the three regions of collection using the quantitative descriptors.
Quantitative DescriptorsMean ± SDp-Value
NujiangLancang RiverHonghe
Leaf traits
Blade width (cm)5.7 ± 0.95.4 ± 1.25.8 ± 1.10.034
Leaf shape index3.8 ± 0.54.0 ±0.63.9 ± 0.40.001
Petiole length (cm)4.0 ± 0.94.4 ± 1.34.5 ± 0.6<0.001
Fruit traits
Storage duration of fruits (days)3.9 ± 1.23.2 ± 0.63.0 ± 0.60.000
Fruit weight (g)93.3 ± 51.781.2 ± 33.665.7 ± 14.80.001
Peel weight (g)12.5 ± 5.616.4 ± 4.714.3 ± 3.50.000
Pulp weight (g)63.1 ± 43.242.5 ± 26.630.4 ± 9.50.000
Seed weight (g)18.1 ± 7.122.4 ± 5.621.1 ± 4.20.000
Total soluble solid17.0 ± 4.218.4 ± 3.019.0 ± 3.0<0.001
Edible rate (%)61.9 ± 13.749.2 ± 9.244.9 ± 8.30.000
p value is from ANOVA analysis.
Table 4. Characteristics of clusters based on discriminant quantitative variables.
Quantitative DescriptorsCluster 1Cluster 2Cluster 3p Value
Leaf traits
Blade length (cm)21.7 ± 420.8 ± 3.118 ± 2.00.012
Leaf shape index3.9 ± 0.63.7 ± 0.43.5 ± 0.20.000
Petiole length (cm)4.3 ± 13.9 ± 0.83.7 ± 0.30.001
Fruit traits
Storage duration of fruits (days)3.4 ± 14.1 ± 1.23.0 ± 0.00.000
Fruit weight (g)59.8 ± 21.9135.1 ± 37.482.5 ± 25.30.000
Peel weight (g)11.9 ± 4.715.8 ± 5.817.2 ± 2.50.000
Pulp weight (g)31.1 ± 14.597 ± 32.3950.1 ± 20.30.000
Fruit length (cm)6.6 ± 1.29.4 ± 1.77 ± 2.090.001
Fruit width (cm)3.9 ± 0.65.4 ± 0.84 ± 1.020.000
Fruit thickness (cm)3.6 ± 0.54.3 ± 3.23.6 ± 0.80.000
Seed weight (g)17.1 ± 6.522.6 ± 619.7 ± 3.50.000
Seed width (cm)5.8 ± 1.18.3 ± 1.76.2 ± 1.880.001
Total soluble solid18.4 ± 4.515.8 ± 2.516.9 ± 1.50.000
Edible rate (%)50.6 ± 10.670.5 ± 8.358.9 ± 13.30.000

