Article

Genomic Phylogeography of Gymnocarpos przewalskii (Caryophyllaceae): Insights into Habitat Fragmentation in Arid Northwestern China

1
State Key Laboratory of Desert and Oasis Ecology, Xinjiang Institute of Ecology and Geography, Chinese Academy of Sciences, Urumqi 830011, China
2
National Key Laboratory of Plant Molecular Genetics, CAS Center for Excellence in Molecular Plant Sciences, Institute of Plant Physiology and Ecology, Shanghai Institutes for Biological Sciences, Chinese Academy of Sciences, Shanghai 200032, China
*
Author to whom correspondence should be addressed.
Submission received: 10 July 2020 / Revised: 13 August 2020 / Accepted: 17 August 2020 / Published: 31 August 2020
(This article belongs to the Special Issue Evolutionary Ecology and Conservation of Native Plants)

Abstract

:
Extensive range of deserts and gobis (rocks) had promoted habitat fragmentation of species in arid northwestern China. Distribution of endangered Gymnocarpos przewalskii Maxim. covers most of gobis (rocks) and desert terrain across arid regions of northwestern China. In the present study, we had employed genomic phylogeographical analysis to investigate population structure of G. przewalskii and test the effect of environmental conditions on spatial pattern of genetic diversity. Results showed four groups were identified from east to west: Edge of the Alxa Desert, Hexi Corridor, Hami Basin, and North edge of the Tarim Basin. Genetic diversity was at an equal level among four groups. General linear model (GLM) analysis showed spatial pattern of genetic diversity was significant correlated with three habitat variables including habitat suitability at present (Npre) and last glacial maximum (LGM) (NLGM) periods, and locality habitat stability (NStab). It concluded that habitat fragmentation had triggered lineage divergences of G. przewalskii in response to long-term aridification. Genome-wide single nucleotide polymorphisms (SNPs) could increase the ability of clarifying population structures in comparison with traditional molecular markers. Spatial pattern of genetic diversity was determined by fragmented habitats with high habitat suitability (Npre and NLGM) and stability (NStab). At last, we propose to establish four conservation units which are in consistent with the population grouping to maintain the genetic integrity of this endangered species.

1. Introduction

Habitat fragmentation played an important role in the process of terrestrial species evolution. Many types of fragmentation were shown in the species natural habitats, including islands, mountain tops, and landscape fragment [1,2]. These fragmented habitats usually displayed complex effects of genetic structure among intraspecific populations. For example, islands have acted as geographical barriers to limit gene flow among different populations in archipelago regions [3]. Mountain tops also can be regarded as sky islands to increase genetic divergence within alpine plants [4,5]. Fragmented landscape could led to the loss of rare alleles in some small populations [6]. Moreover, another type of fragmentation exists in arid lands. Due to the impact of arid environments, species trend to shrink in several fragmented ranges with suitable habitat. Investigating the course of species evolution could make us well understand the influences of habitat fragmentation in arid lands.
In northwestern China, extremely arid environment has triggered the development of extensive range of deserts and gobis (rocks) (Figure 1). The reason of the initiation of aridity in the study area was deemed to be the uplift of surrounding mountain ranges, such as the Pamir and Himalaya Mountains and the block of moisture-carrying airflow from the west and south [7]. The long-term process of enhancing aridification was experienced in northwestern China. It underwent increased aridity and onset of desert conditions during the late Miocene, but the presence of deserts in eastern part of northwestern China was during the Pleistocene [7,8]. In response to this process, xerophytes were hypothesized to promote lineage splits and genetic divergences. For example, lineage splits in the genera of Atraphaxis and Ixiolirion were primarily caused by variation of desert habitats during the Pleistocene [9,10]. Intraspecies populations could be diverged into several groups due to the habitat fragmentation following the process of enhancing aridification, like Nitraria sphaerocarpa Maxim. [11], Amygdalus mongolica (Maxim.) Ricker [12], and Populus euphratica Oliv. [13]. In contrast, another type of xerophytic plants could adapt to the changes of aridity and display a continuous distribution range in this region. They usually did not exhibit a pattern of genetic divergence among different populations, like Zygophyllum xanthoxylon (Bunge) Maxim. [14] and Clematis songorica Bunge [15].
Endangered Gymnocarpos przewalskii Maxim. is a small shrublet and endemically distributed in arid regions of northwestern China (Figure 1). It is recorded as the first conservation level in the China Plant Red Data Book [16]. The habitats of this species are gobis (rocks), deserts, dry riverbeds, and gravelly hill slopes. At present, it owns fragmented distributions east from the Alxa Desert, through the Hexi Corridor and the Hami Basin, and west to the Tarim Basin (Figure 1). This region covers most of gobis (rocks) and desert terrain over arid northwestern China. G. przewalskii is considered as a good model plant to say how evolutionary history of xerophytic plants responded to habitat fragmentations along the process of enhancing aridification in the study area. This endangered G. przewalskii has also encountered loss of habitat due to environmental changes and human activities. Understanding of population genetic structure would be crucial to inform management plans and establish effective conservation strategies for this endangered species. However, previous studies did not clarify the population structure using several traditional molecular markers [17]. Moreover, the defined population structures were inconsistent among chloroplast DNA, the internal transcribed spacers of ribosome DNA (nrITS), and microsatellite (SSR) data. Geographically, populations of G. przewalskii were well structured and divided into several fragmented groups. Whether this species owned a complex genetic structure, or the truth of its genetic structure was shielded by cpDNA and ITS markers, is a fascinating question.
Nowadays, the genome-wide SNPs are most frequently used in molecular evolution and phylogeography [18]. It was proved that genome-wide SNPs had high ability to distinguish population structures and resolve evolutionary history for organisms [19,20]. Several next-generation sequencing technologies were developed and commonly used, such as Restriction-site Associated DNA Sequencing (RAD-seq) [21], Genotyping-by-Sequencing (GBS-seq) [22], and Specific-Locus Amplified Fragment Sequencing (SLAF-seq) [23]. In the present study, we had employed GBS sequencing technology to generate the genome-wide SNPs data of G. przewalskii populations across the full range. Based on the sampling strategy and molecular approaches, we aimed to (1) clarify population structure of G. przewalskii in response to habitat fragmentation, (2) test the effect of historical and current environmental conditions on the spatial pattern of genetic diversity for G. przewalskii populations with fragmented distributions, (3) identify conservation units to maintain the genetic integrity of this endangered species.

2. Materials and Methods

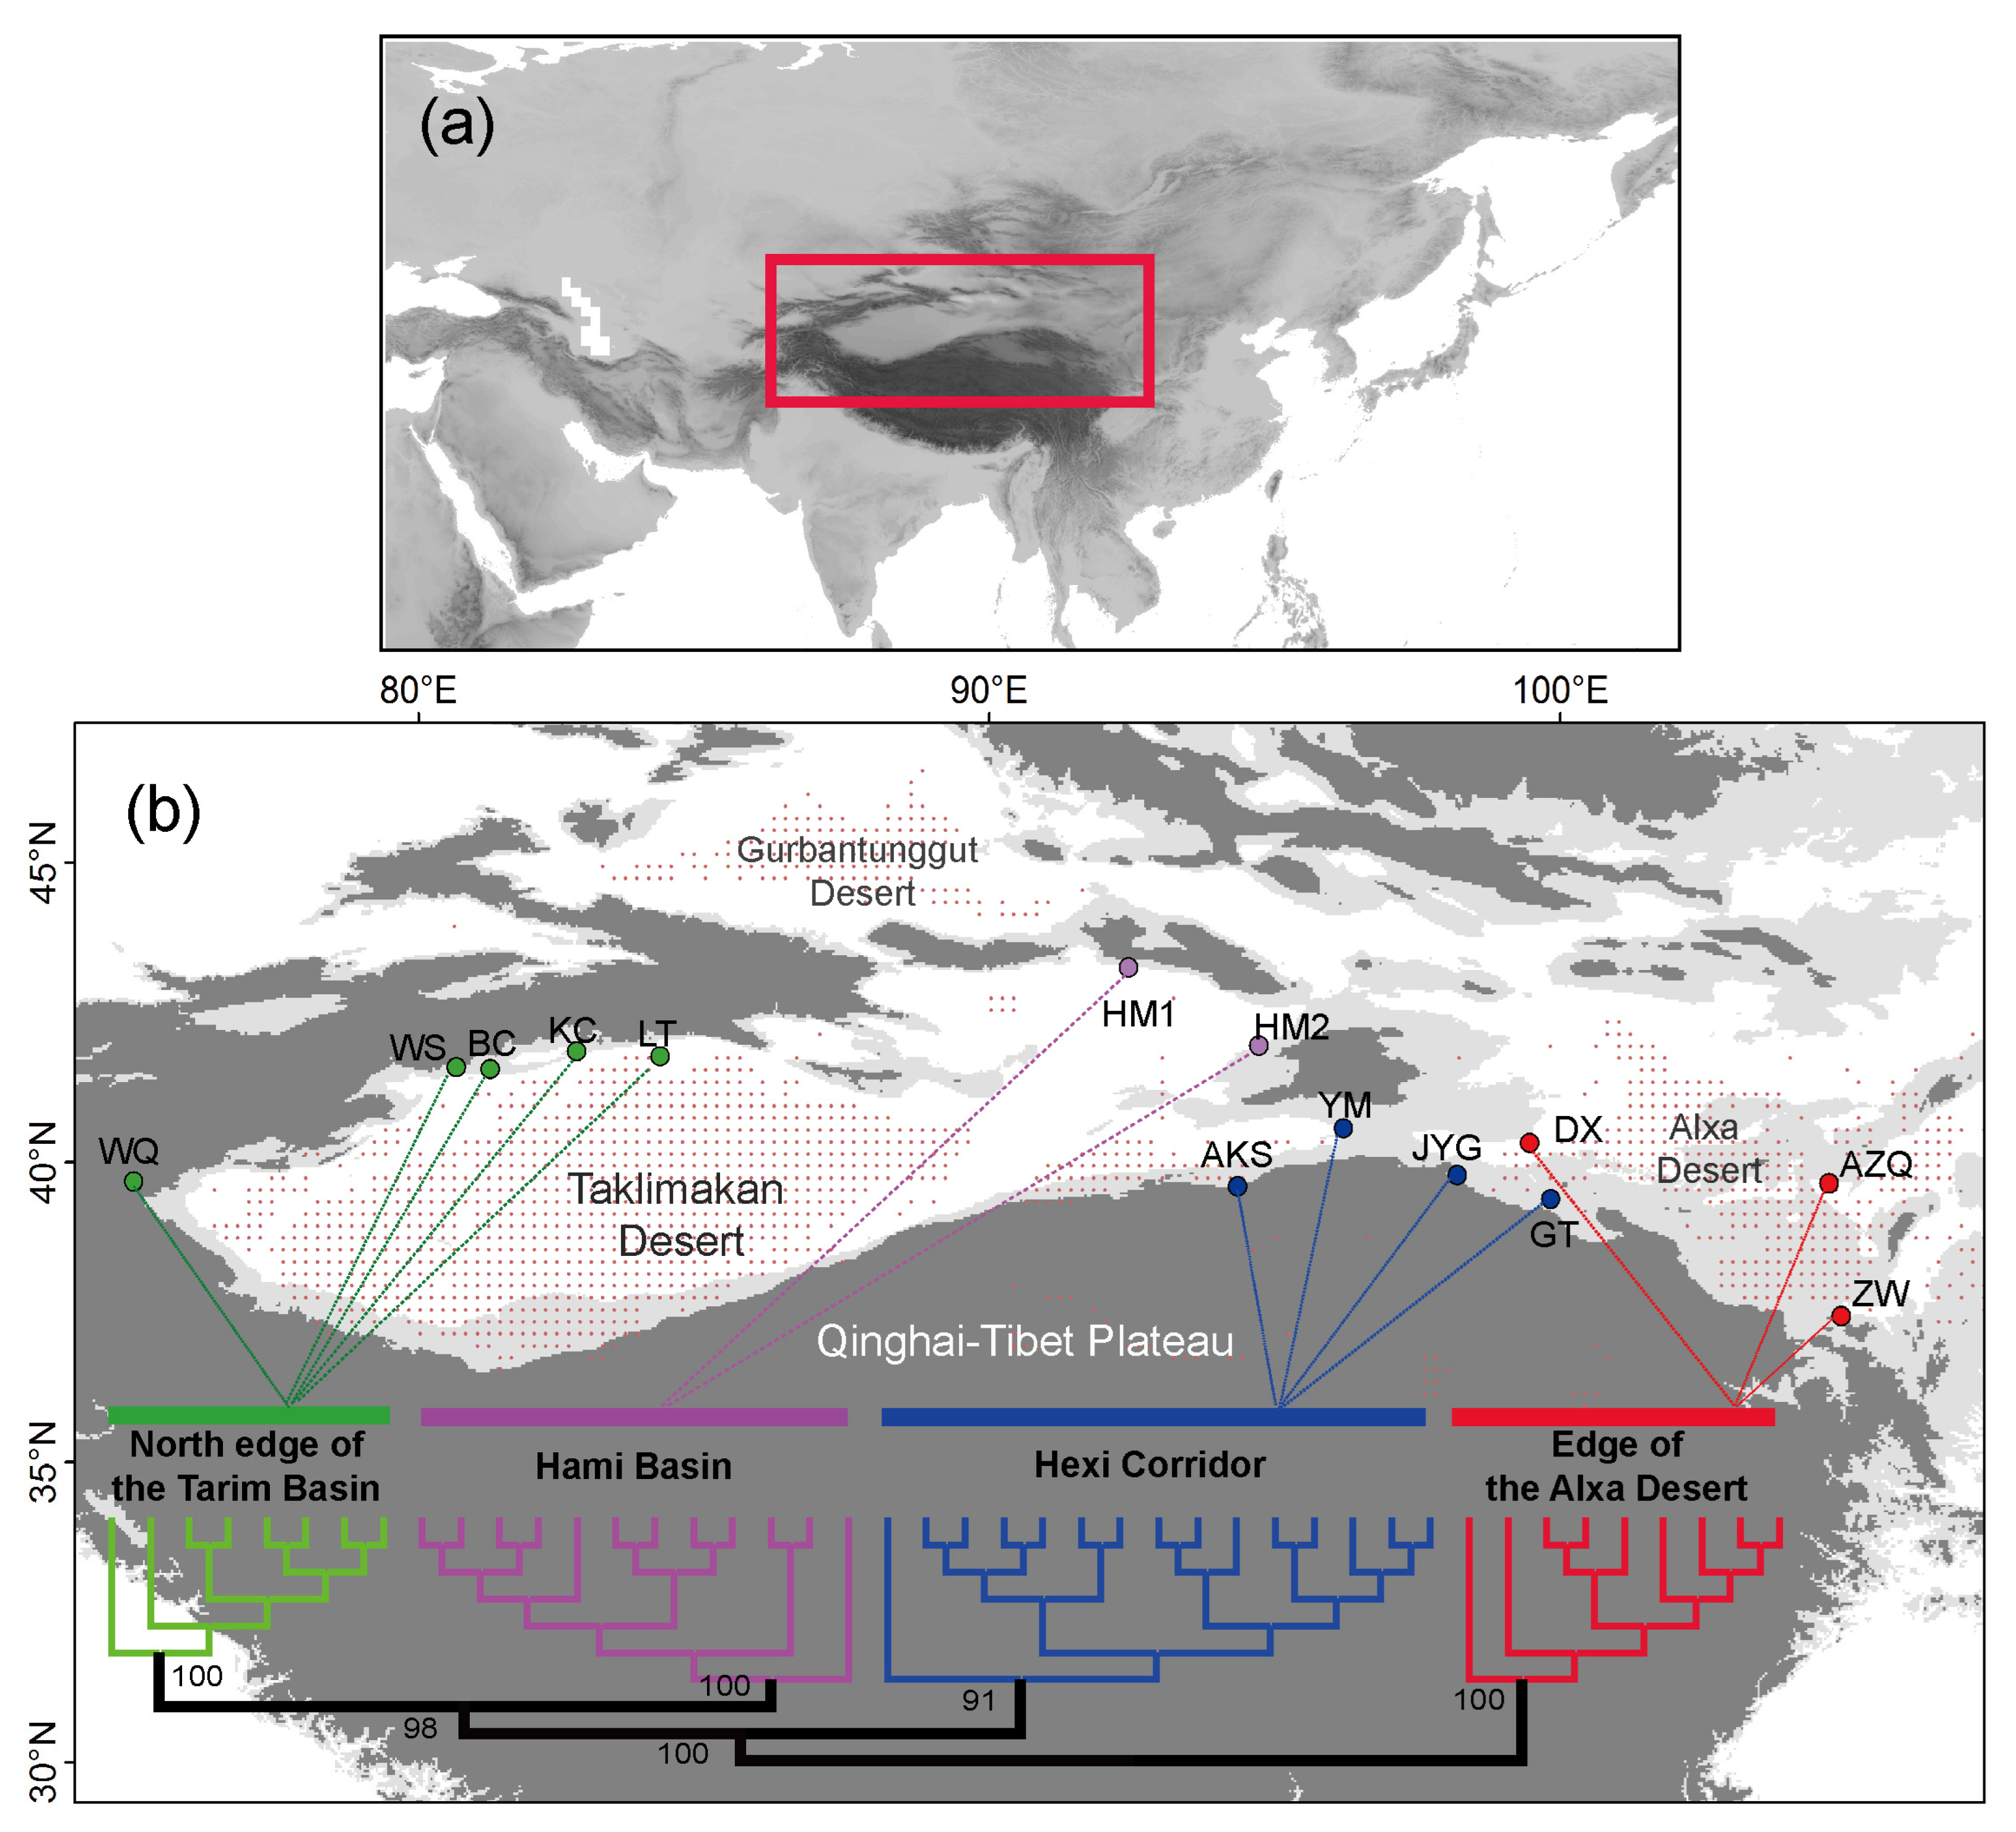
2.1. Plant Collection and DNA Extraction

Within the full distribution range of G. przewalskii, a total of 44 individuals from 14 populations were sequenced to generate genome-wide SNPs (Figure 1, Table 1). The leaf materials of all sequenced individuals were collected from the field and used in the previous study [17]. They were dried and stored with silica gel in the laboratory. Total genomic DNA was extracted using the DNeasy Plant Mini Kit (Qiagen) following the manufacturer’s instructions.

2.2. GBS Sequencing and SNP Calling

Libraries from genomic DNA of each of the 44 individuals was constructed through GBS-seq methodology [24] at Novogene Co. Ltd. in Beijing, China. According to this method, the DNA was firstly digested with high-fidelity restriction enzymes. Libraries were created by uniquely barcoding each of the individual from the respective site and then pooling barcoded individual. The libraries were pooled for multiplexed Polymerase Chain Reactions (PCRs), and then the PCR products were purified. The sequencing was performed with an Illumina Hiseq PE150 platform. All raw reads were processed for quality control and filtered under the following criteria: paired reads were discarded if the number of N’s in either read exceeded 10%, and the number of low quality (Q ≤ 5) bases in a single read was restricted to less than 50%. The sample with largest number of tags was initially clustered to pseudo-reference genome. Clean reads from the other sequenced samples were mapped to the pseudo-reference genome using BWA software with the parameters ‘mem -t 4 -k 32 -M’ [25]. After the alignment, SNPs were identified using SAMtools [26]. The output of SNPs was further filtered under the parameters ‘dp2-miss0.5-maf0.05′. These thresholds were used to clean the low-quality SNPs with complete degree < 0.5, coverage depth < 2 and rare SNPs filter of MAF < 0.05. Then, the dataset of high-quality SNPs was used for the following analysis. All GBS-seq data of G. przewalskii were deposited in the GenBank (SRA accession: PRJNA649343).

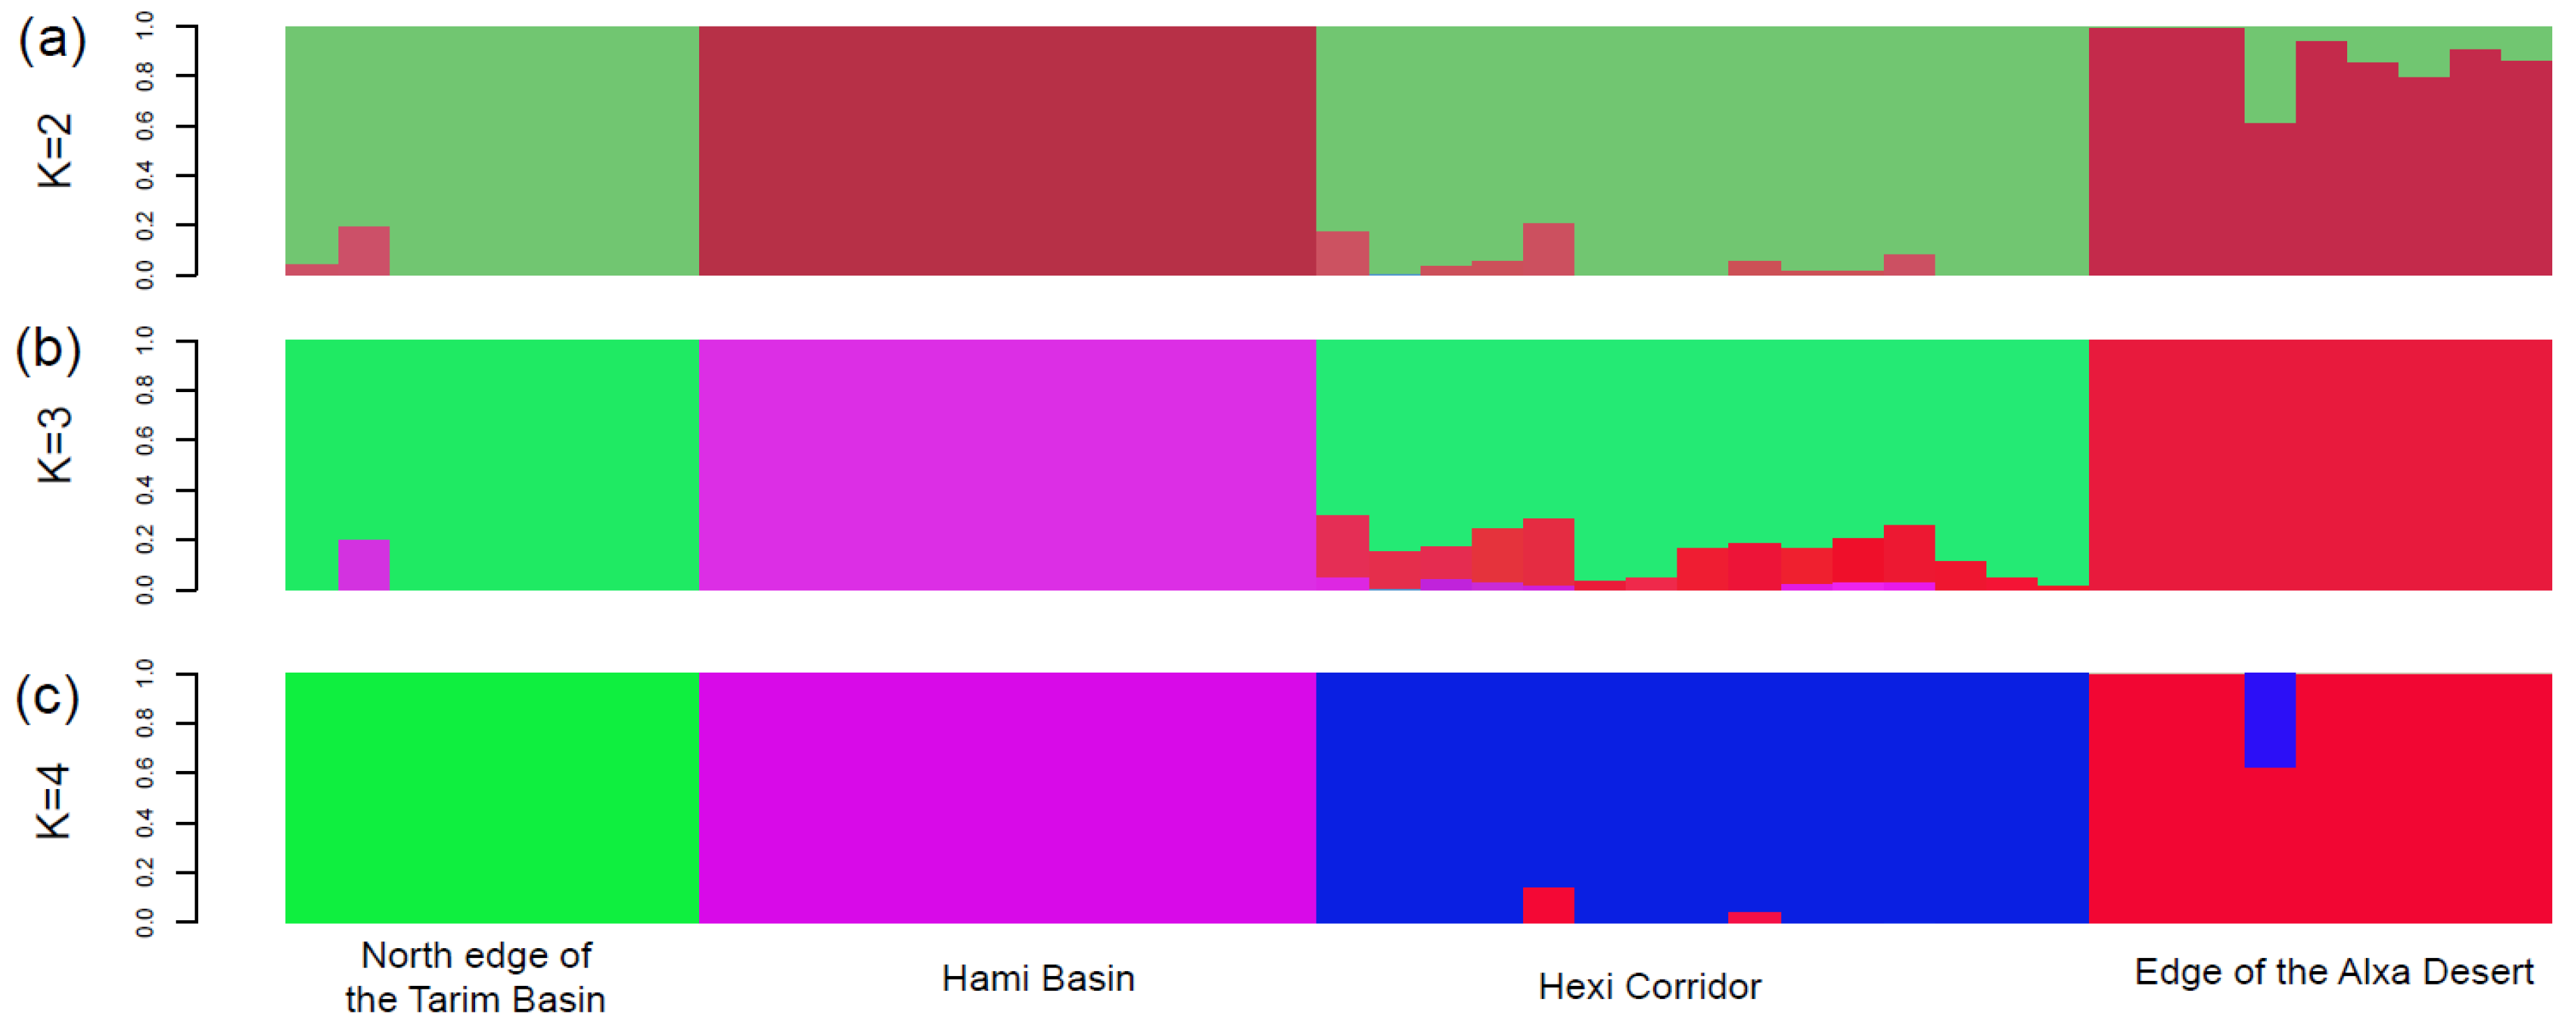
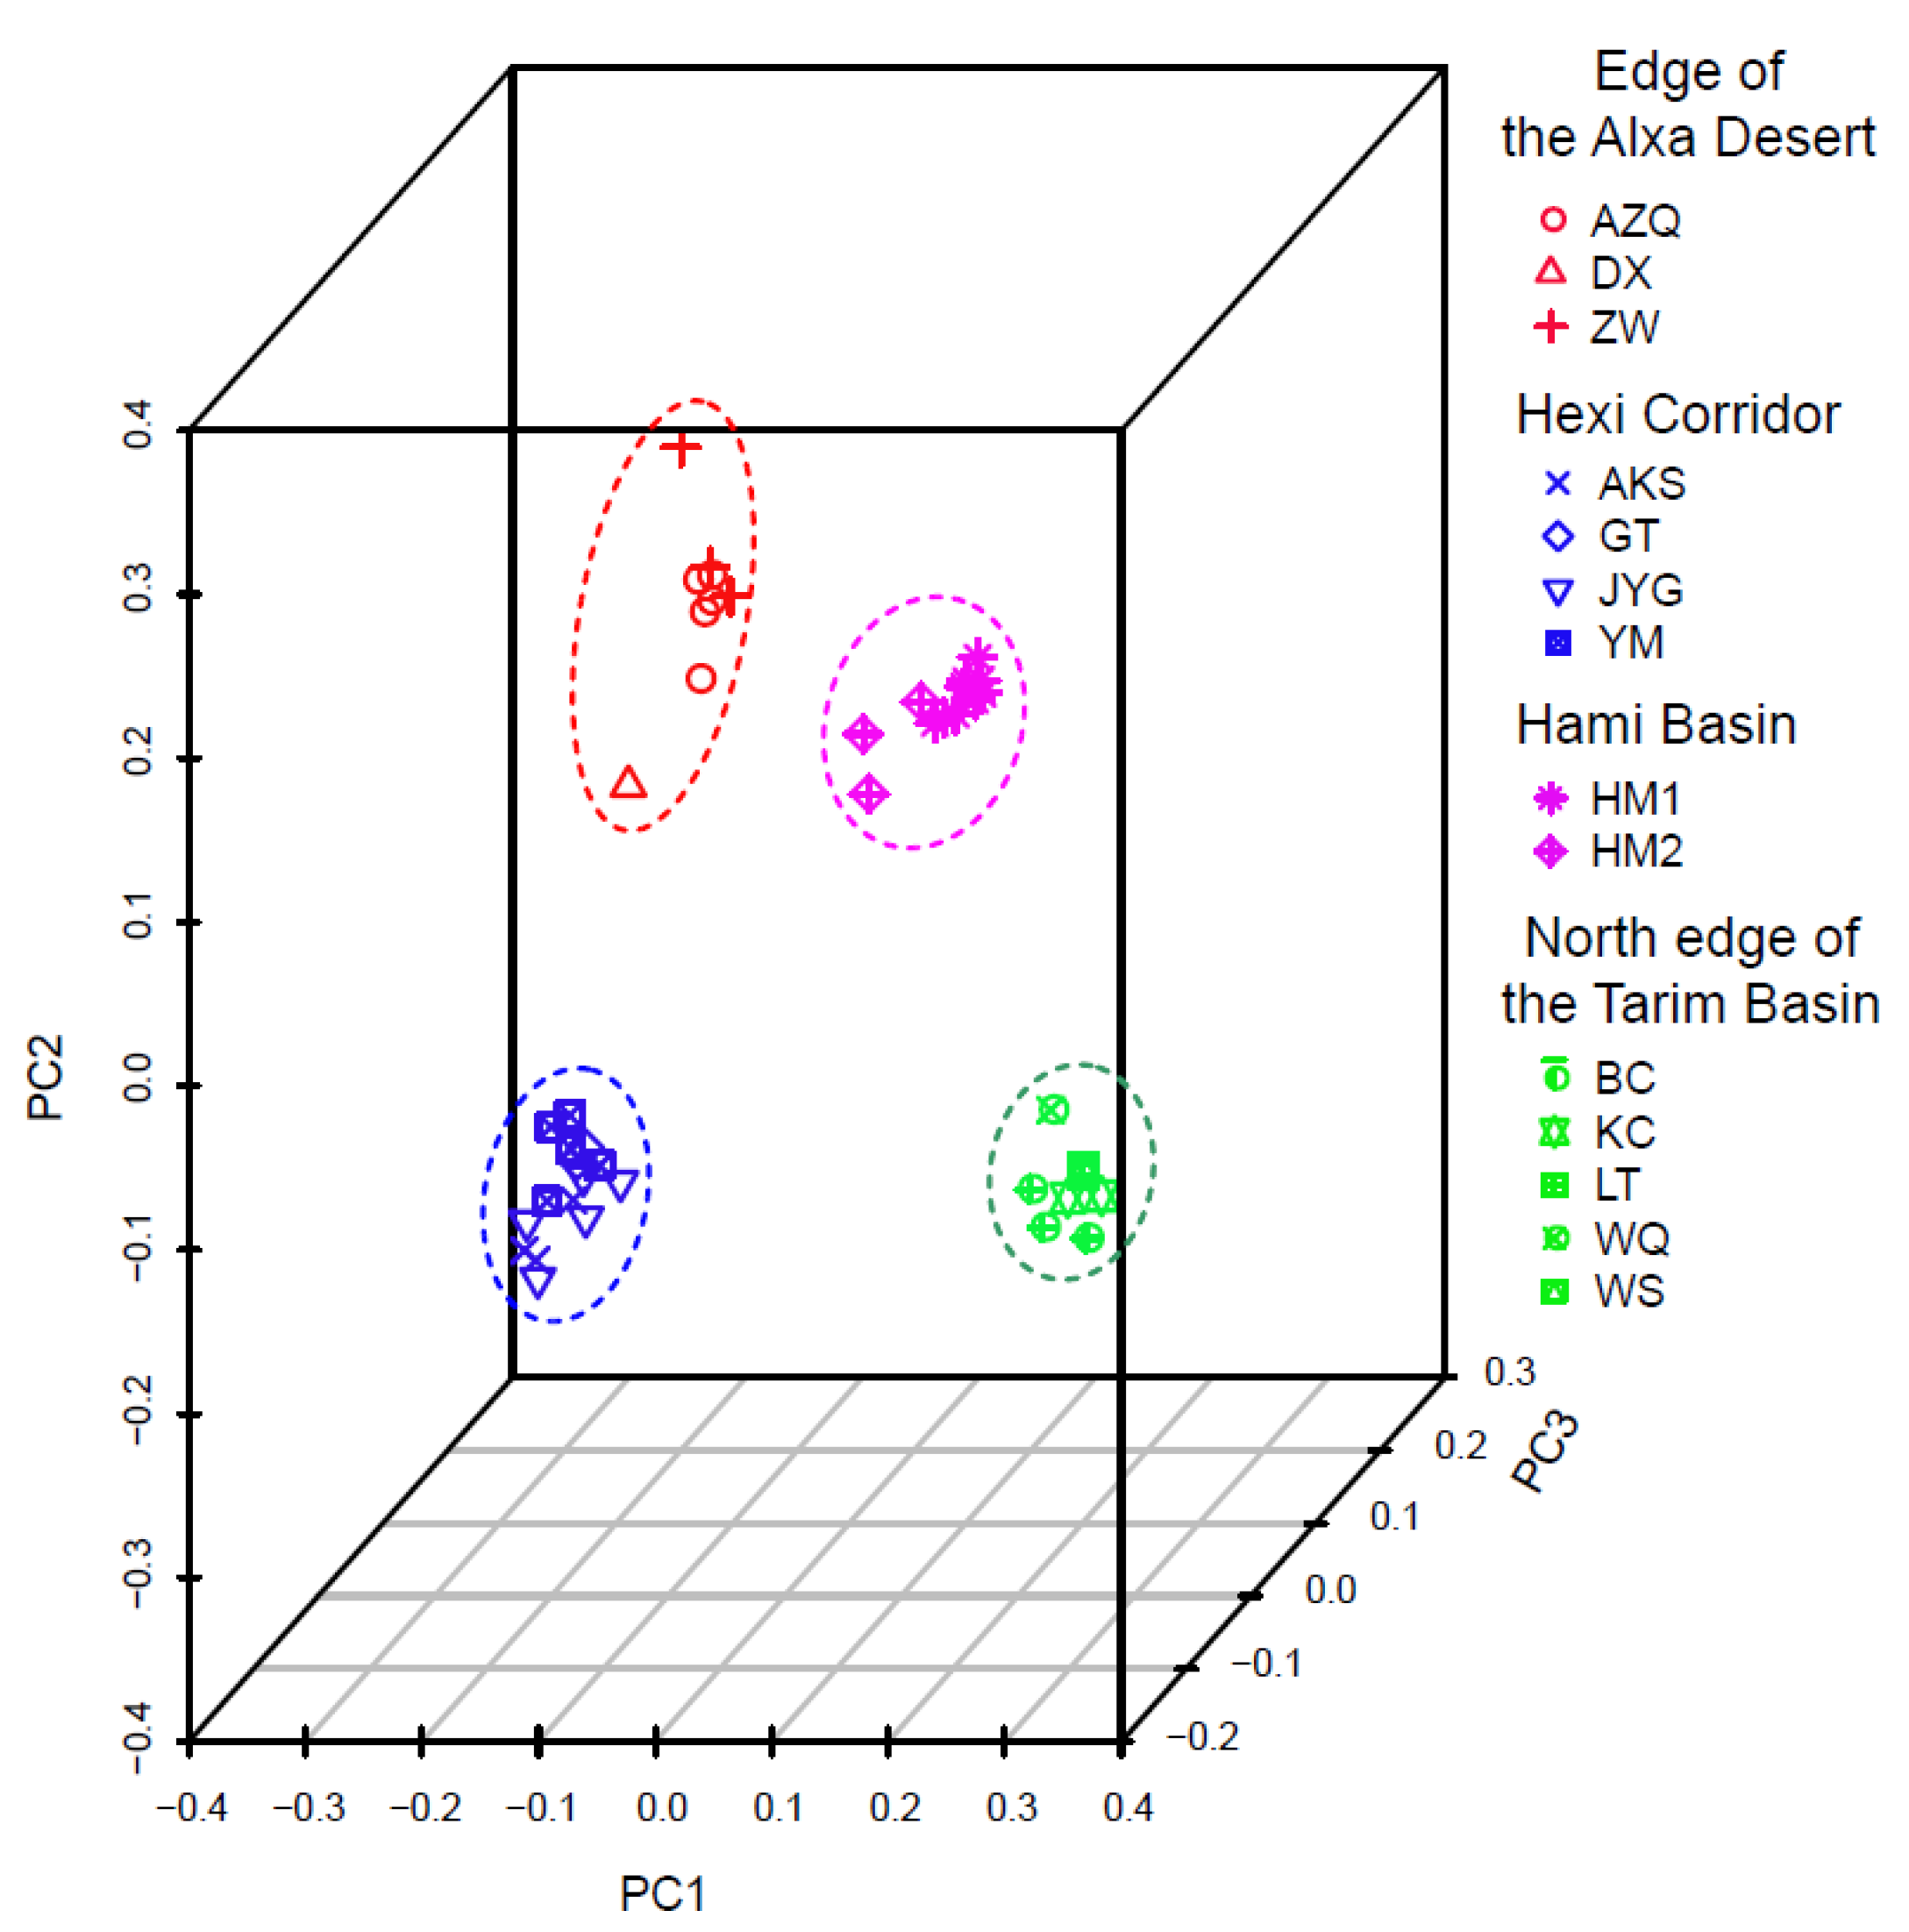
2.3. Genetic Structure Analyses

Firstly, a neighbor-joining (NJ) phylogenetic tree of 44 individuals from 14 populations was constructed using the program MEGA-X ver. 10.1.8 [27] based on the genetic distance matrix. The robustness of nodes was assessed through bootstrap resampling (BP) with 1000 repetitions. The isolation by distance was also tested based on the correlation between genetic distance matrix and geographical distance matrix among these 14 populations. Then, population structure of these 44 individuals was investigated using the program of ADMIXTURE ver. 1.3.0 [28]. This program infers the ancestry of the sampled individuals based on large SNP genotype datasets using a block relaxation algorithm. To use ADMIXTURE, you need an input file and an idea of K, your belief of the number of ancestral populations. When the numbers of ancestral populations to be defined (K values), a good value of K value will exhibit a low cross-validation (CV) error compared to other K values. The K value was set ranging from 1 to 8 when running the program. Finally, the PCA was calculated for the 44 individuals using the GCTA ver. 1.93.2 program [29]. Meanwhile, three indexes of genetic diversity were estimated using the software of ARLEQUIN ver. 3.5.2.2 [30] for these four defined population groups according to the inferences of population structure (see details in Results), including Nucleotide diversity (π), Observed heterozygous (Ho), and Expected heterozygous (He).

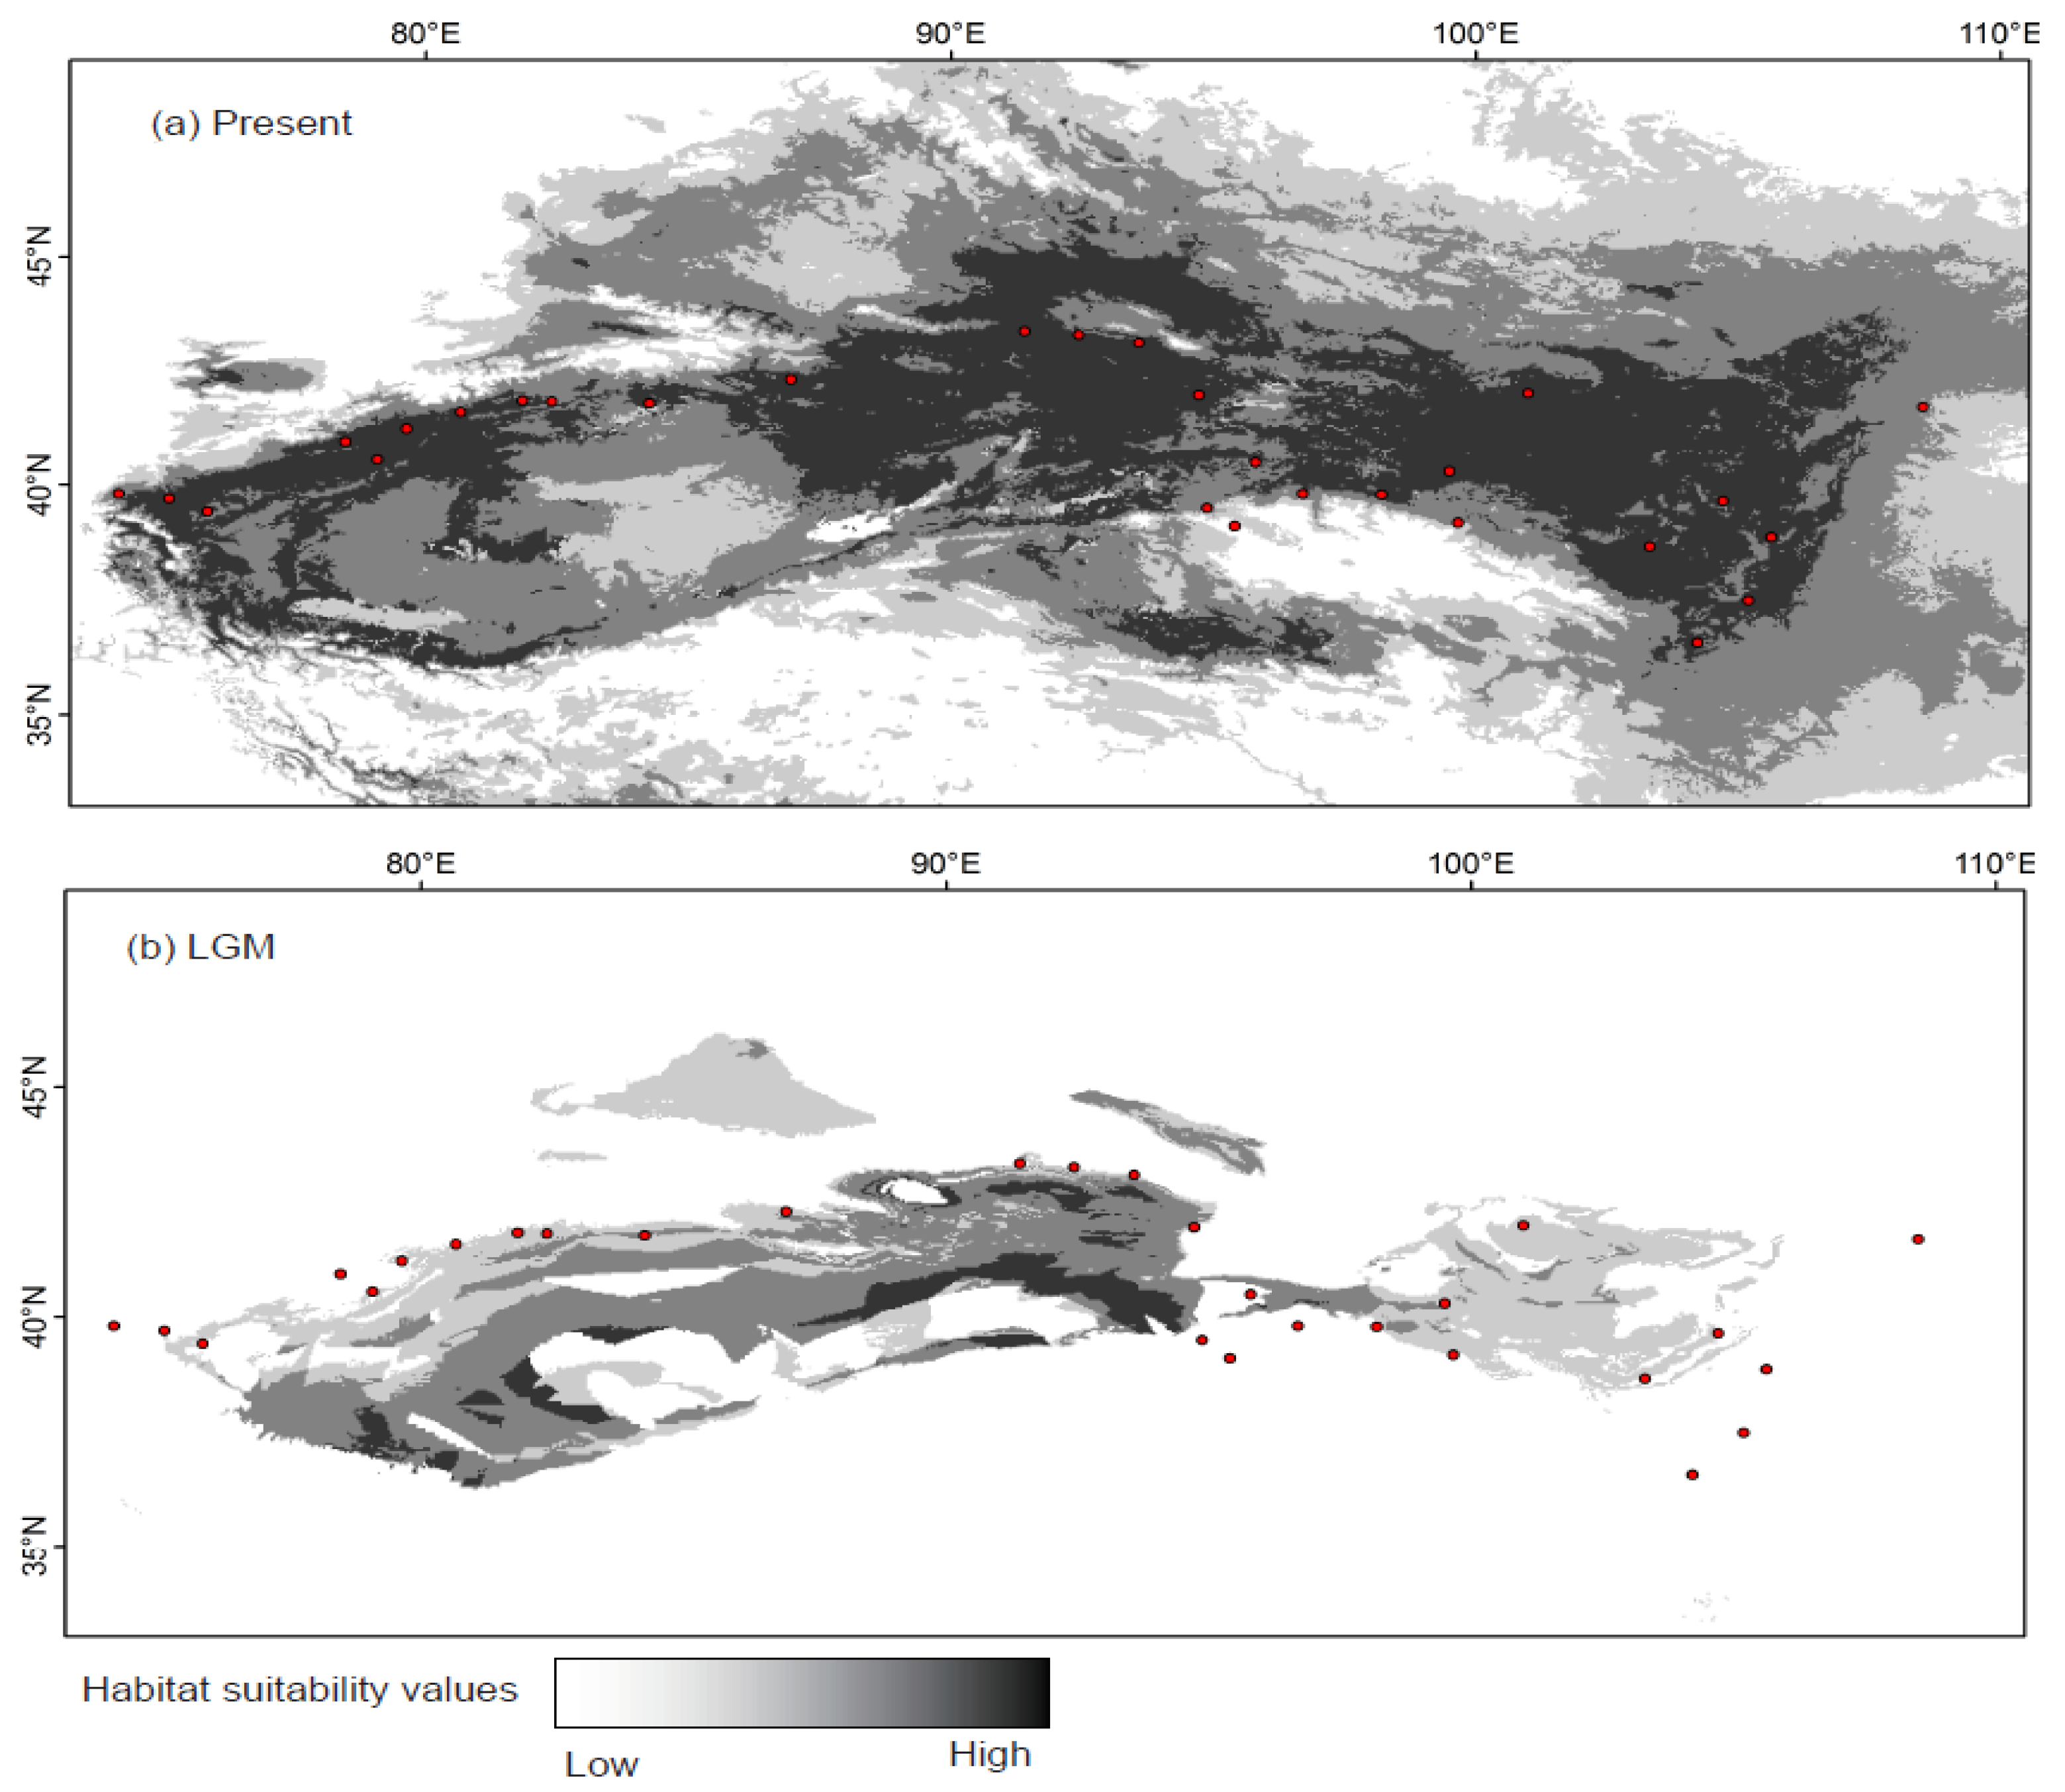
2.4. Species Distribution Model

Present-day occurrence locations of G. przewalskii were acquired from our field surveys and the Chinese Virtual Herbarium (CVH; http://www.cvh.org.cn/cms). After removing the overlapping points, a total of 29 occurrence points for G. przewalskii were used in the species distribution modelling (SDM) analyses. Here, 22 occurrence points were acquired from field surveys, and 7 points were viewed from the CVH. For running the SDMs, 19 bioclimatic variables at a resolution of 2.5 arcmin were initially downloaded from the WorldClim Database (http://www.worldclim.org; [31]). To avoid model over-fitting, we calculated the correlation coefficients of these 19 bioclimatic variables, and retained the least correlated variables (Spearman’s < 0.8). At last, ten remained bioclimatic variables were used in the SDMs to model the potential distributions of this species. Last glacial maximum (LGM) distribution of this species was also modeled with the ten corresponding LGM bioclimatic variables under the Model for Interdisciplinary Research on Climate- Earth System Model (MIROC-ESM model) and the Community Climate System Model version 4 (CCSM4 model), at a resolution of a 2.5 arcmin, which downloaded from the WorldClim database (http://www.-worldclim.org) [31]. Present-day and LGM potential distributions of G. przewalskii were generated with SDM methodology using the maximum entropy approach as implemented in MAXENT, version 3.3.3k [32]. Model performance was evaluated by the area under the receiver operating characteristic curve (AUC) of a receiver operating characteristic plot.

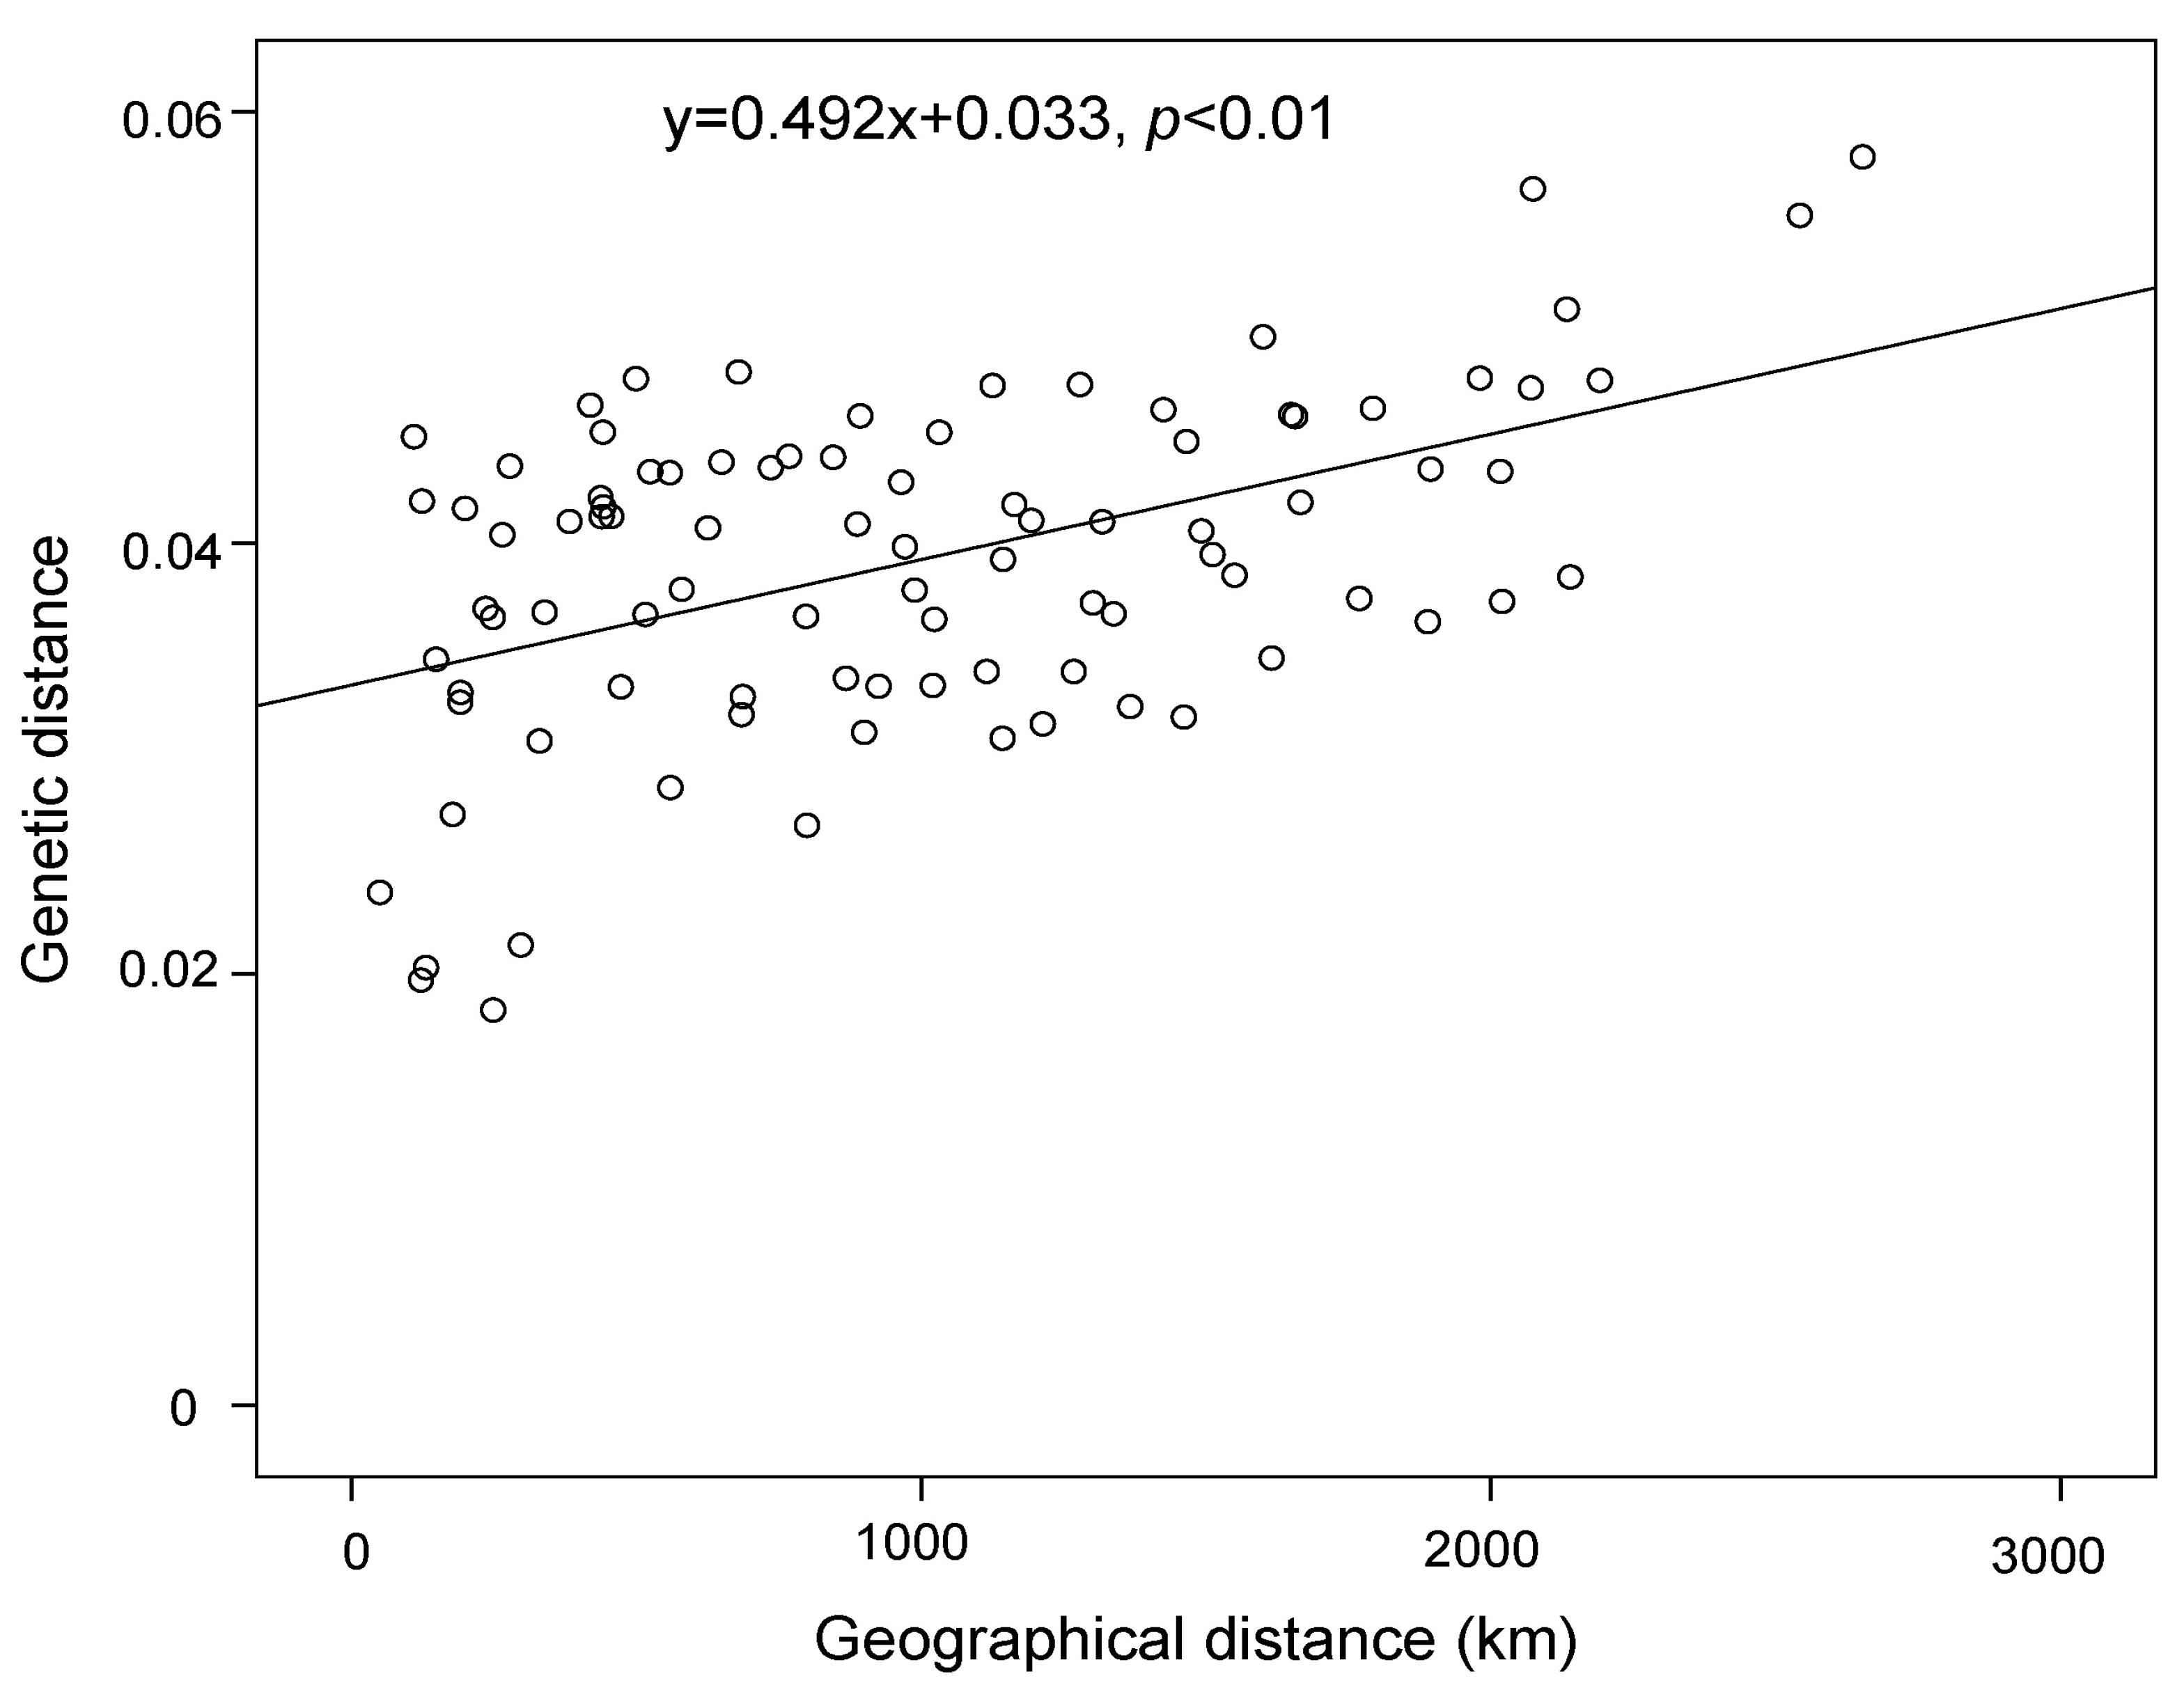
2.5. Landscape Genetic Analysis

A general linear model (GLM) analysis was performed in R v3.5.0 (http://www.r-project.org/) in order to evaluate the effect of geographical and environmental factors on the intra-population genetic diversity of G. przewalskii. During the analysis processing, the initial model included all explanatory covariates of the six environmental factors, and the most suitable models were selected based on a backward elimination procedure. The environmental variables were eliminated in GLM analysis that were not well explained the intra-population genetic diversity. For this analysis, we used the values of genetic diversity at the population level from Jia and Zhang [17] based on SSR data. The molecular method of SSR had high ability to survey the population genetic polymorphisms than other DNA fragments. For the SSR data, 136 individuals from 17 populations were sampled. These populations were the same population to the dataset of genomic SNPs with the addition of three neighboring populations in North edge of the Tarim Basin and Hexi Corridor. To avoid the collinearity for the same type of indices, two indices were used to measure the spatial genetic diversity in the GLM analysis, including allelic richness(Ar) and expected heterozygosity (He). Latitude and longitude of G. przewalskii populations were treated as the geographical factors. Six environmental factors were also used as explanatory covariates: present (Epre) and LGM (ELGM) period environment, environmental change since LGM (Echange), habitat suitability of the sampling locality at present (Npre) and LGM (NLGM) periods, and locality habitat stability (NStab). These six environment factors were computed according to the method of Jiang et al. [33] and Jiang et al. [34]. Present (Epre) and LGM (ELGM) period environment were estimated by the principal components summarizing the overall variation of 10 least correlated climate variables among sampling localities during the present and LGM periods. Environmental change since LGM (Echange) was the absolute values of standardized PC1 scores from the present period (Epre) minus scores from the LGM period (ELGM). Habitat suitability of the sampling locality at present (Npre) and LGM (NLGM) periods were extracted from the SDM layers of the potential distributions of this species. Locality habitat stability (NStab) was calculated by the absolute values of present habitat suitability (Npre) minus LGM habitat suitability (NLGM).

3. Results

A total of 44 G. przewalskii individuals were sequenced using the GBS-seq method. The numbers of mapped reads for each sample was range from 3,227,827 to 12,713,348. The mapping rate ranged from 77.17% to 95.07%. The total number of tags was from 2,330,973 to 11,267,342, and the average depth of sequencing was from 13.34× to 19×. The number of SNPs was 308,918, and filtered 28,035 high-integrity SNPs in the following analyses.
A NJ phylogenetic tree were constructed based on the pairwise genetic distances among these 44 individuals using the obtained genomic SNPs (Figure 1). In the cluster dendrogram, it showed four major clades from east to west: Edge of the Alxa Desert, Hexi Corridor, Hami Basin, and North edge of the Tarim Basin (Figure 1). Group of Edge of the Alxa Desert included 9 individuals from populations of AZQ, ZW, and DX; while Group of Hexi Corridor included 15 individuals from populations of GT, JYG, YM, and AKS (Table 1). Group of Hami Basin included 12 individuals from populations of HM1 and HM2; while Group of North edge of the Tarim Basin included 8 individuals from populations of LT, KC, BC, WS, and WQ (Table 1). These four clades were supported by high bootstrap values (Figure 1). The pattern of isolation by distance was approved by the significantly correlation between genetic distance and geographical distance among these 14 populations (p < 0.01; Figure 2).
Increasing trend of the CV error values were shown when the K values changed from 1 to 8. According to genetic clustering of these 44 individuals, four population groups were divided when the K value was at 4. They were Group of Edge of the Alxa Desert, Group of Hexi Corridor, Group of Hami Basin, and Group of North edge of the Tarim Basin (Figure 3c). This structure of population grouping was consistent with the topology of the NJ phylogenetic tree. When the K value was set as 3, Group of Hexi Corridor and Group of North edge of the Tarim Basin were integrated into one group (Figure 3b). After setting the K value as 2, Group of Edge of the Alxa Desert and Group of Hami Basin were merged into another group (Figure 3a). The PCA analysis also showed these 44 individuals were compacted in four groups in the three-dimensional coordinate axis (Figure 4). They were Group of Edge of the Alxa Desert, Group of Hexi Corridor, Group of Hami Basin, and Group of North edge of the Tarim Basin. According to the four population groups, genetic diversity of each group was estimated. The values of nucleotide diversity (π) for these four groups from east to west were 0.2181 (±0.1087), 0.2370 (±0.1155), 0.2269 (±0.1115), and 0.2223 (±0.1116) (Table 1). The values of observed heterozygous/expected heterozygous (Ho/He) were 0.3825 (±0.2348)/0.3251 (±0.1441), 0.3279 (±0.2202)/ 0.2753 (±0.1384), 0.3422 (±0.2196)/0.2947 (±0.1409), and 0.4196 (±0.2524)/0.3442 (±0.1491), respectively (Table 1).
Good performances of present and LGM SDMs of G. przewalskii were indicated by the high AUC values of 0.990/0.996 for the training and test data. The MIROC-ESM bioclimatic model and the CCSM4 bioclimatic model generated the same range of LGM distributions. The modeling distributions were shown in the Figure 5. At present, G. przewalskii had larger potential distributions with high level of habitat suitability values (Npre) in Edge of the Alxa Desert, Hexi Corridor, Hami Basin, and North edge of the Tarim Basin (Figure 5a). Comparatively, the potential distributions of this species were shrunken significantly during the LGM period (Figure 5b). The LGM distributions disappeared in marginal locations of Edge of the Alxa Desert and Hexi Corridor. GLM analysis indicated that the model that explains the two indexes of the genetic diversity (allelic richness Ar and expected heterozygosity He) of G. przewalskii were significant correlated with three habitat variables, including habitat suitability at present (Npre), LGM (NLGM) periods, and locality habitat stability (NStab) (Table 2).

4. Discussion

4.1. Clarifying Population Structure of G. przewalskii from the Genome-Wide SNPs

According to the distribution range of G. przewalskii, populations were reasonable to be divided into four geographical groups, including Group of Edge of the Alxa Desert, Group of Hexi Corridor, Group of Hami Basin, and Group of North edge of the Tarim Basin (Figure 1). In the present study, we had yielded a clear population structure with four lineages accordant to the defined geographical groups (Figure 1, Figure 3 and Figure 4). Previous studies had also investigated the population structures of G. przewalskii using the cpDNA fragments, nrITS, and SSR markers [17]. Although they approved to divide the range of G. przewalskii into four geographical groups, distinct genetic divergence was not obtained among the four groups using the three types of traditional molecular markers. For example, haplotypes of cpDNA fragments were mixed among Edge of the Alxa Desert, Hexi Corridor, and Hami Basin. NrITS had only distinguished the lineage of Edge of the Alxa Desert, while SSR seemed powerless to identify these population groups. These phenomena were possibly resulted from slow level of mutation rate or a small number of loci used for traditional molecular markers in previous study. Lessoning from the case of G. przewalskii, it could be necessary to reconsider the ambiguous population structure of species that previously investigated by traditional molecular markers. Genome-wide SNPs could possess the ability to further resolution of mixed population structures and identification of deeper-level structures than the traditional molecular markers [35,36].
Here, we found a significant pattern of isolation by distance (Figure 2) among the 14 populations of G. przewalskii. The fragment distributions could explain evolutionary mechanism of genetic divergence for this endangered plant species from arid northwestern China. The outcrossing-entomophily breeding system of this species hindered its long-distance transmission ability for gene flow [15]. Under the fragmented distribution pattern and long-distance range along the longitudinal change (Figure 1), gene flow was limited and lineage divergence then occurred among these isolated population groups (Figure 3). The formation for this fragmentation was hypothesized to cause by the historical aridification. The study area had experienced long-term process of enhancing aridification in response to the retreat of the proto-Paratethys and global cooling [37]. The initial desert environment of the Asian interior began to form at the Late Miocene, such as the Taklimakan Desert [38]. Up to Pleistocene and Holocene, ranges of gobis (rocks) and deserts had undergone continuous expansion in this region [8]. Under the background of long-term historical aridification, the distribution range of xeromorphic plants from arid northwestern China had possibly shrunken and fragmented. This fragmented pattern of population structure were also reported in Nitraria sphaerocarpa and Nitraria roborowskii from the study area [11].

4.2. Effect of Historical and Current Environmental Conditions on the Spatial Genetic Pattern of G. przewalskii

From the SDM modeling of present and LGM distributions of G. przewalskii (Figure 5), habitat suitability values (Npre and NLGM) were in difference among the sampling populations. We found the genetic diversity was significantly correlated with the habitat suitability values, including habitat suitability at present (Npre) and LGM (NLGM) periods, and locality habitat stability (NStab) (Table 2). Previous studies have indicated the glacial refugia could have played an leading role in shaping spatial genetic pattern of this species [17]. Glacial refugia were usually characterized with high level of habitat stability (NStab) [39]. Results from the present study showed genetic diversity of G. przewalskii was affected not only by habitat stability (NStab), but also by the present (Npre) and the historical habitat suitability (NLGM) (Table 2). This pattern was most likely linked to the process of fragmentation when populations were preserved in several regions with high habitat suitability (Npre and NLGM). Under the pressure of climatic changes, the process of glacial–interglacial migration usually shaped high habitat suitability in refugial area but low habitat suitability in colonizing area (NLGM). Apart from the habitat variables, we did not identify any other environmental factors in shaping the variation of genetic diversity (Table 2). Although the full distribution of G. przewalskii was in a west–east belt across the arid Northwestern China, we did not detect a significant tendency of genetic diversity along the longitudinal gradient (Table 2). In response to enhancing aridification, range of this species was divided into four population groups with similar level of genetic diversity. It indicates that this species did not experience long-distance migration and a long-term effect of gene drift, which was shown in forest plants of the study area, such as Clematis sibirica Mill. and Codonopsis clematidea (Schrenk) C. B. Cl. [15]. During the course of evolutionary history, G. przewalskii did not adapt to diversified environments, but preserved in fragmented locations with suitable habitat. This feature could be one of the reasons for the endangerment of this species.

4.3. Conservation Implications

G. przewalskii is listed in the China Plant Red Data Book under the first conservation level [16]. Due to the harsh condition of habitats and human disturbance, it waits for an overhaul of measures to protect this endangered species. The maintenance of genetic diversity is one of critical issues in the conservation and management for long-term survival of endangered species. For endangered species with fragmented distributions, it suggested several conservation units should be established to preserve their genetic integrality [20]. In the present study, four independent evolutionary units were identified in the whole range of G. przewalskii using the genome-wide SNPs, including Group of Edge of the Alxa Desert, Group of Hexi Corridor, Group of Hami Basin, and Group of North edge of the Tarim Basin (Figure 1). Here, we also found genetic diversity was not significantly different among the four groups based on the genome-wide SNPs data (Table 1). This pattern of genetic diversity was consistent with previous studies using the traditional molecular markers [17]. Evolutionary history of fragmentation has shaped multiple hotspots of genetic diversity within G. przewalskii [15]. The genetic diversity within populations was not investigated by the genome-wide SNPs data in the present study, but it was previously reported on high level of intra-population genetic diversity [17]. Thus, we propose to consider strategies of conservation management based on the four effective evolutionary units in order to recover the genetic integrality of this endangered species.

5. Conclusions

Our present study analyzed population genetic structure and conservation management of an endangered plant G. przewalskii with fragmented distributions in arid northwestern China. Here, through the analysis of genome-wide SNPs, we found four population groups, owning the similar level of genetic diversity, were well distinguished within this species. Through a GLM analysis of relationship between intra-population genetic diversity and environmental factors, spatial genetic diversity was significant correlated with high habitat suitability (Npre and NLGM) and stability (NStab). Based on these results, we propose that four conservation units should be established to recover the genetic integrality of this endangered species. Further, it is suggested that protection of suitable habitats was urgent to prevent the potential losses of genetic diversity and increase its adaptability to environmental changes. Future studies on conservation genetics of G. przewalskii should also highlight the possible genetic mechanism to promote its endangered status and clarify the genetic basis of adaptability to environmental changes.

Author Contributions

Conceptualization, H.-X.Z.; data curation, H.-X.Z. and S.-W.J.; formal analysis, H.-X.Z. and Q.W.; funding acquisition, H.-X.Z.; investigation, H.-X.Z.; methodology, H.-X.Z.; project administration, H.-X.Z.; visualization, H.-X.Z.; writing—original draft, H.-X.Z.; and writing—review and editing, H.-X.Z. and Q.W. All authors have read and agreed to the published version of the manuscript.

Funding

This research was funded by National Natural Science Foundation of China (31870323, 31700287), the Outstanding Youth Science and Technology Talents Training Project of Xinjiang Uygur Autonomous Region (2019Q034) and Youth Innovation Promotion Association of Chinese Academy of Sciences (No. 2019428).

Conflicts of Interest

The authors declare no conflict of interest.

References

  1. Haddad, N.M.; Brudvig, L.A.; Clobert, J.; Davies, K.F.; Gonzalez, A.; Holt, R.D.; Lovejoy, T.E.; Sexton, J.O.; Austin, M.P.; Collins, C.D.; et al. Habitat fragmentation and its lasting impact on Earth’s ecosystems. Sci. Adv. 2015, 1, e1500052. [Google Scholar] [CrossRef] [PubMed] [Green Version]
  2. Perrino, E.V.; Tomaselli, V.; Costa, R.; Pavone, P. Conservation status of habitats (Directive 92/43 EEC) of coastal and low hill belts in a Mediterranean biodiversity hot spot (Gargano-Italy). Plant Biosyst. 2013, 147, 1006–1028. [Google Scholar] [CrossRef]
  3. Yuan, N.; Comes, H.P.; Cao, Y.N.; Guo, R.; Zhang, Y.H.; Qiu, Y.X. A comparative study on genetic effects of artificial and natural habitat fragmentation on Loropetalum chinense (Hamamelidaceae) in Southeast China. Heredity 2015, 114, 544–551. [Google Scholar] [CrossRef]
  4. Halbritter, D.A.; Storer, C.G.; Kawahara, A.Y.; Daniels, J.C. Phylogeography and population genetics of pine butterflies: Sky islands increase genetic divergence. Ecol. Evol. 2019, 9, 13389–13401. [Google Scholar] [CrossRef] [Green Version]
  5. Chen, J.H.; Huang, Y.; Brachi, B.; Yun, Q.Z.; Zhang, W.; Lu, W.; Li, H.N.; Li, W.Q.; Sun, X.D.; Wang, G.Y.; et al. Genome-wide analysis of Cushion willow provides insights into alpine plant divergence in a biodiversity hotspot. Nat. Commun. 2019, 10, 5230. [Google Scholar] [CrossRef] [Green Version]
  6. Edwards, C.E.; Albrecht, M.A.; Bassuener, B.; Yatskievych, G.A. Population genetic analysis reveals a predominantly selfing mating system and strong genetic structuring in a naturally fragmented, threatened plant. Conserv. Genet. 2019, 20, 1437–1448. [Google Scholar] [CrossRef]
  7. Yang, X.; Scuderi, L.; Paillou, P.; Liu, Z.; Li, H.; Ren, X. Quaternary environmental changes in the drylands of China—A critical review. Quat. Sci. Rev. 2011, 30, 3219–3233. [Google Scholar] [CrossRef]
  8. Guan, Q.; Pan, B.; Li, N.; Zhang, J.; Xue, L. Timing and significance of the initiation of present day deserts in the northeastern Hexi Corridor, China. Palaeogeogr. Palaeoclimatol. Palaeoecol. 2011, 306, 70–74. [Google Scholar]
  9. Xu, Z.; Zhang, M.L.; Cohen, J.I. Phylogeographic History of Atraphaxis Plants in Arid Northern China and the Origin of A. bracteata in the Loess Plateau. PLoS ONE 2016, 11, e0163243. [Google Scholar] [CrossRef]
  10. Li, Y.; Song, F.; Zhang, X.N.; Lv, G.H. Phylogeography suggest the Yili Valley being the glacial refuge of the genus Ixiolirion (Amaryllidaceae) in China. Syst. Biodivers. 2019, 17, 385–401. [Google Scholar] [CrossRef]
  11. Su, Z.; Lu, W.; Zhang, M. Phylogeographical patterns of two closely related desert shrubs, Nitraria roborowskii and N. sphaerocarpa (Nitrariaceae), from arid north-western China. Bot. J. Linn. Soc. 2016, 180, 334–347. [Google Scholar] [CrossRef] [Green Version]
  12. Ma, S.M.; Nie, Y.B.; Jiang, X.L.; Xu, Z.; Ji, W.Q. Genetic structure of the endangered, relict shrub Amygdalus mongolica (Rosaceae) in arid northwest China. Aust. J. Bot. 2019, 67, 128–139. [Google Scholar] [CrossRef]
  13. Zeng, Y.F.; Zhang, J.G.; Abuduhamiti, B.; Wang, W.T.; Jia, Z.Q. Phylogeographic patterns of the desert poplar in Northwest China shaped by both geology and climatic oscillations. BMC Evol. Biol. 2018, 18, 75. [Google Scholar] [CrossRef] [PubMed] [Green Version]
  14. Shi, X.J.; Zhang, M.L. Phylogeographical structure inferred from cpDNA sequence variation of Zygophyllum xanthoxylon across north-west China. J. Plant Res. 2015, 128, 269–282. [Google Scholar] [CrossRef]
  15. Zhang, H.X.; Zhang, M.L.; Sanderson, S.C. Spatial genetic structure of forest and xerophytic plant species in arid Eastern Central Asia: Insights from comparative phylogeography and ecological niche modelling. Biol. J. Linn. Soc. 2017, 120, 612–625. [Google Scholar] [CrossRef]
  16. Fu, L.G. China Plant Red Data Book; Science Press: Beijing, China, 1992. [Google Scholar]
  17. Jia, S.W.; Zhang, M.L. Pleistocene climate change and phylogeographic structure of the Gymnocarpos przewalskii (Caryophyllaceae) in the northwest China: Evidence from plastid DNA, ITS sequences, and Microsatellite. Ecol. Evol. 2019, 9, 5219–5235. [Google Scholar] [CrossRef] [Green Version]
  18. Cutter, A.D. Integrating phylogenetics, phylogeography and population genetics through genomes and evolutionary theory. Mol. Phylogenet. Evol. 2013, 69, 1172–1185. [Google Scholar] [CrossRef]
  19. Emerson, K.J.; Merz, C.R.; Catchen, J.M.; Hohenlohe, P.A.; Cresko, W.A.; Bradshaw, W.E.; Holzapfel, C.M. Resolving postglacial phylogeography using high-throughput sequencing. Proc. Natl. Acad. Sci. USA 2010, 107, 16196–16200. [Google Scholar] [CrossRef] [Green Version]
  20. Zhang, H.X.; Li, H.Y.; Li, Y.X. Identifying evolutionarily significant units for conservation of the endangered Malus sieversii using genome-wide RADseq data. Nord. J. Bot. 2018, 36, e01733. [Google Scholar] [CrossRef]
  21. Davey, J.L.; Blaxter, M.W. RADSeq: Next-generation population genetics. Brief. Funct. Genom. 2010, 9, 416–423. [Google Scholar] [CrossRef]
  22. Wallace, J.G.; Mitchell, S.E. Genotyping-by-Sequencing. Curr. Protoc. Plant Biol. 2017, 2, 64–77. [Google Scholar] [CrossRef] [PubMed]
  23. Sun, X.; Liu, D.; Zhang, X.; Li, W.; Liu, H.; Hong, W.; Jiang, C.; Guan, N.; Ma, C.; Zeng, H.; et al. SLAF-seq: An Efficient Method of Large-Scale De Novo SNP Discovery and Genotyping Using High-Throughput Sequencing. PLoS ONE 2013, 8, e58700. [Google Scholar] [CrossRef] [PubMed]
  24. Elshire, R.J.; Glaubitz, J.C.; Sun, Q.; Poland, J.A.; Kawamoto, K.; Buckler, E.S.; Mitchell, S.E. A Robust, Simple Genotyping-by-Sequencing (GBS) Approach for High Diversity Species. PLoS ONE 2011, 6, e19379. [Google Scholar] [CrossRef] [PubMed] [Green Version]
  25. Li, H.; Durbin, R. Fast and accurate short read alignment with Burrows-Wheeler transform. Bioinformatics 2009, 25, 1754–1760. [Google Scholar] [CrossRef] [Green Version]
  26. Li, H.; Handsaker, B.; Wysoker, A.; Fennell, T.; Ruan, J.; Homer, N.; Marth, G.; Abecasis, G.; Durbin, R.; Genome Project Data Processing Subgroup. The Sequence Alignment/Map format and SAMtools. Bioinformatics 2009, 25, 2078–2079. [Google Scholar] [CrossRef] [Green Version]
  27. Sudhir, K.; Glen, S.; Li, M.; Christina, K.; Koichiro, T. MEGA X: Molecular Evolutionary Genetics Analysis across computing platforms. Mol. Biol. Evol. 2018, 35, 1547–1549. [Google Scholar]
  28. Alexander, D.H.; Novembre, J.; Lange, K. Fast model-based estimation of ancestry in unrelated individuals. Genome Res. 2009, 19, 1655–1664. [Google Scholar] [CrossRef] [Green Version]
  29. Yang, J.; Lee, S.H.; Goddard, M.E.; Visscher, P.M. GCTA: A Tool for Genome-wide Complex Trait Analysis. Am. J. Hum. Genet. 2011, 88, 76–82. [Google Scholar] [CrossRef] [Green Version]
  30. Excoffier, L.; Lischer, H.E.L. Arlequin suite ver 3.5: A new series of programs to perform population genetics analyses under Linux and Windows. Mol. Ecol. Resour. 2010, 10, 564–567. [Google Scholar] [CrossRef]
  31. Hijmans, R.J.; Cameron, S.E.; Parra, J.L.; Jones, P.G.; Jarvis, A. Very high resolution interpolated climate surfaces for global land areas. Int. J. Climatol. 2005, 25, 1965–1978. [Google Scholar] [CrossRef]
  32. Phillips, S.J.; Anderson, R.P.; Schapire, R.E. Maximum entropy modeling of species geographic distributions. Ecol. Model. 2006, 190, 231–259. [Google Scholar] [CrossRef] [Green Version]
  33. Jiang, X.L.; Deng, M.; Li, Y. Evolutionary history of subtropical evergreen broad-leaved forest in Yunnan Plateau and adjacent areas: An insight from Quercus schottkyana (Fagaceae). Tree Genet. Genomes 2016, 12, 104. [Google Scholar] [CrossRef]
  34. Jiang, X.L.; An, M.; Zheng, S.S.; Deng, M.; Su, Z.H. Geographical isolation and environmental heterogeneity contribute to the spatial genetic patterns of Quercus kerrii (Fagaceae). Heredity 2018, 120, 219–233. [Google Scholar] [CrossRef] [PubMed] [Green Version]
  35. Edwards, S.V.; Shultz, A.J.; Campbell-Staton, S.C. Next-generation sequencing and the expanding domain of phylogeography. Folia Zool. 2015, 64, 187–206. [Google Scholar] [CrossRef]
  36. Reitzel, A.M.; Herrera, S.; Layden, M.J.; Martindale, M.Q.; Shank, T.M. Going where traditional markers have not gone before: Utility of and promise for RAD sequencing in marine invertebrate phylogeography and population genomics. Mol. Ecol. 2013, 22, 2953–2970. [Google Scholar] [CrossRef] [Green Version]
  37. Bougeois, L.; Dupont-Nivet, G.; de Rafelis, M.; Tindall, J.C.; Proust, J.N.; Reichart, G.J.; de Nooijer, L.J.; Guo, Z.; Ormukov, C. Asian monsoons and aridification response to Paleogene sea retreat and Neogene westerly shielding indicated by seasonality in Paratethys oysters. Earth Planet. Sci. Lett. 2018, 485, 99–110. [Google Scholar] [CrossRef]
  38. Sun, J.; Gong, Z.; Tian, Z.; Jia, Y.; Windley, B. Late Miocene stepwise aridification in the Asian interior and the interplay between tectonics and climate. Palaeogeogr. Palaeoclimatol. Palaeoecol. 2015, 421, 48–59. [Google Scholar] [CrossRef]
  39. Roberts, D.R.; Hamann, A. Glacial refugia and modern genetic diversity of 22 western North American tree species. Proc. R. Soc. B Biol. Sci. 2015, 282, 20142903. [Google Scholar] [CrossRef] [Green Version]
Figure 1. Highlight of the study area (a) and the geographical distribution of 14 sampled Gymnocarpos przewalskii populations (b). The bottom of (b) showed neighbor-joining (NJ) phylogenetic tree of 44 individuals from 14 sampled populations constructed with the genome-wide single nucleotide polymorphisms (SNPs) dataset. The numbers under the branches showed the bootstrap values of the nodes (%). Light–dark gradients of colors indicated the changes of elevation from low to high. The colored dots for 14 populations showed the different population groups.
Diversity 12 00335 g001
Figure 2. Correlation of pairwise genetic distance and geographical distance among the 14 sampled Gymnocarpos przewalskii populations.
Diversity 12 00335 g002
Figure 3. Genetic clustering of the 14 sampled Gymnocarpos przewalskii populations based on the genome-wide SNPs dataset. The patterns are shown with different K values at K = 2 (a), K = 3 (b), and K = 4 (c).
Diversity 12 00335 g003
Figure 4. Principal components analysis (PCA) plots of 44 individuals from 14 sampled Gymnocarpos przewalskii populations based on the first three principal components. The dash lines show the four population groups.
Diversity 12 00335 g004
Figure 5. Potential distributions with occurrence probability of Gymnocarpos przewalskii during (a) present-day and (b) last glacial maximum (LGM) based on the Model for Interdisciplinary Research on Climate- Earth System Model (MIROC-ESM) model. The dots show the occurrence points used in the species distribution modelling (SDMs).
Diversity 12 00335 g005
Table 1. Population information and genetic diversity of Gymnocarpos przewalskii.
RegionLocationLongitude/LatitudeNindπ (SD)Ho (SD)He (SD)
Edge of the Alxa Desert 90.2181 (0.1087)0.3825 (0.2348)0.3251 (0.1441)
AZQ104.71/39.655
ZW104.92/37.433
DX99.46/40.321
Hexi Corridor 150.2370 (0.1155)0.3279 (0.2202)0.2753 (0.1384)
GT99.83/39.382
JYG98.19/39.785
YM96.20/40.565
AKS94.34/39.593
Hami Basin 120.2269 (0.1115)0.3422 (0.2196)0.2947 (0.1409)
HM192.43/43.259
HM294.72/41.953
North edge of the Tarim Basin 80.2223 (0.1116)0.4196 (0.2524)0.3442 (0.1491)
LT84.23/41.771
KC82.77/41.852
BC81.25/41.553
WS80.66/41.591
WQ75.01/39.681
Nind the number of individuals analyzed, π the average nucleotide diversity, Ho the average observed heterozygosity, He the average expected heterozygosity, SD standard deviation.
Table 2. Values from best model for general linear model analysis between the genetic diversity of Gymnocarpos przewalskii with geography, environment and habitat factors based on the backward eliminating procedure.
Allelic Richness (Ar)Expected Heterozygosity (He)
EstSEtpEstSEtp
(Intercept)−5.846 × 1082.347 × 108−2.4900.03−8.255 × 1073.943 × 107−2.0940.06
Longitude----2.481 × 10−31.806 × 10−31.3730.19
Epre----1.467 × 10−29.424 × 10-31.5570.15
ELGM5.911 × 10−24.090 × 10−21.4450.17----
Npre5.846 × 1082.347 × 1082.4900.038.255 × 1073.943 × 1072.0940.06
NLGM−5.846 × 1082.347 × 108−2.4900.03−8.255 × 1073.943 × 107−2.0940.06
Nstab5.846 × 1082.347 × 1082.4900.038.255 × 1073.943 × 1072.0940.06
Epre present environment, ELGM LGM period environment, Echange environmental change since LGM, Npre habitat suitability of the sampling locality at present, NLGM habitat suitability of the sampling locality at LGM period, NStab locality habitat stability. Est estimate, SE standard error, t statistics of Student’s t test, p significance of Student’s t test, - eliminating variables. Significant p-values are in bold (p < 0.05), and marginally significant values (0.05 < p < 0.10) are italicized.

