
Flock Size Predicts Niche Breadth and Focal Wintering Regions for a Rapidly Declining Boreal-Breeding Passerine, the Rusty Blackbird

 ,
,  , and
, and
Abstract
:1. Introduction
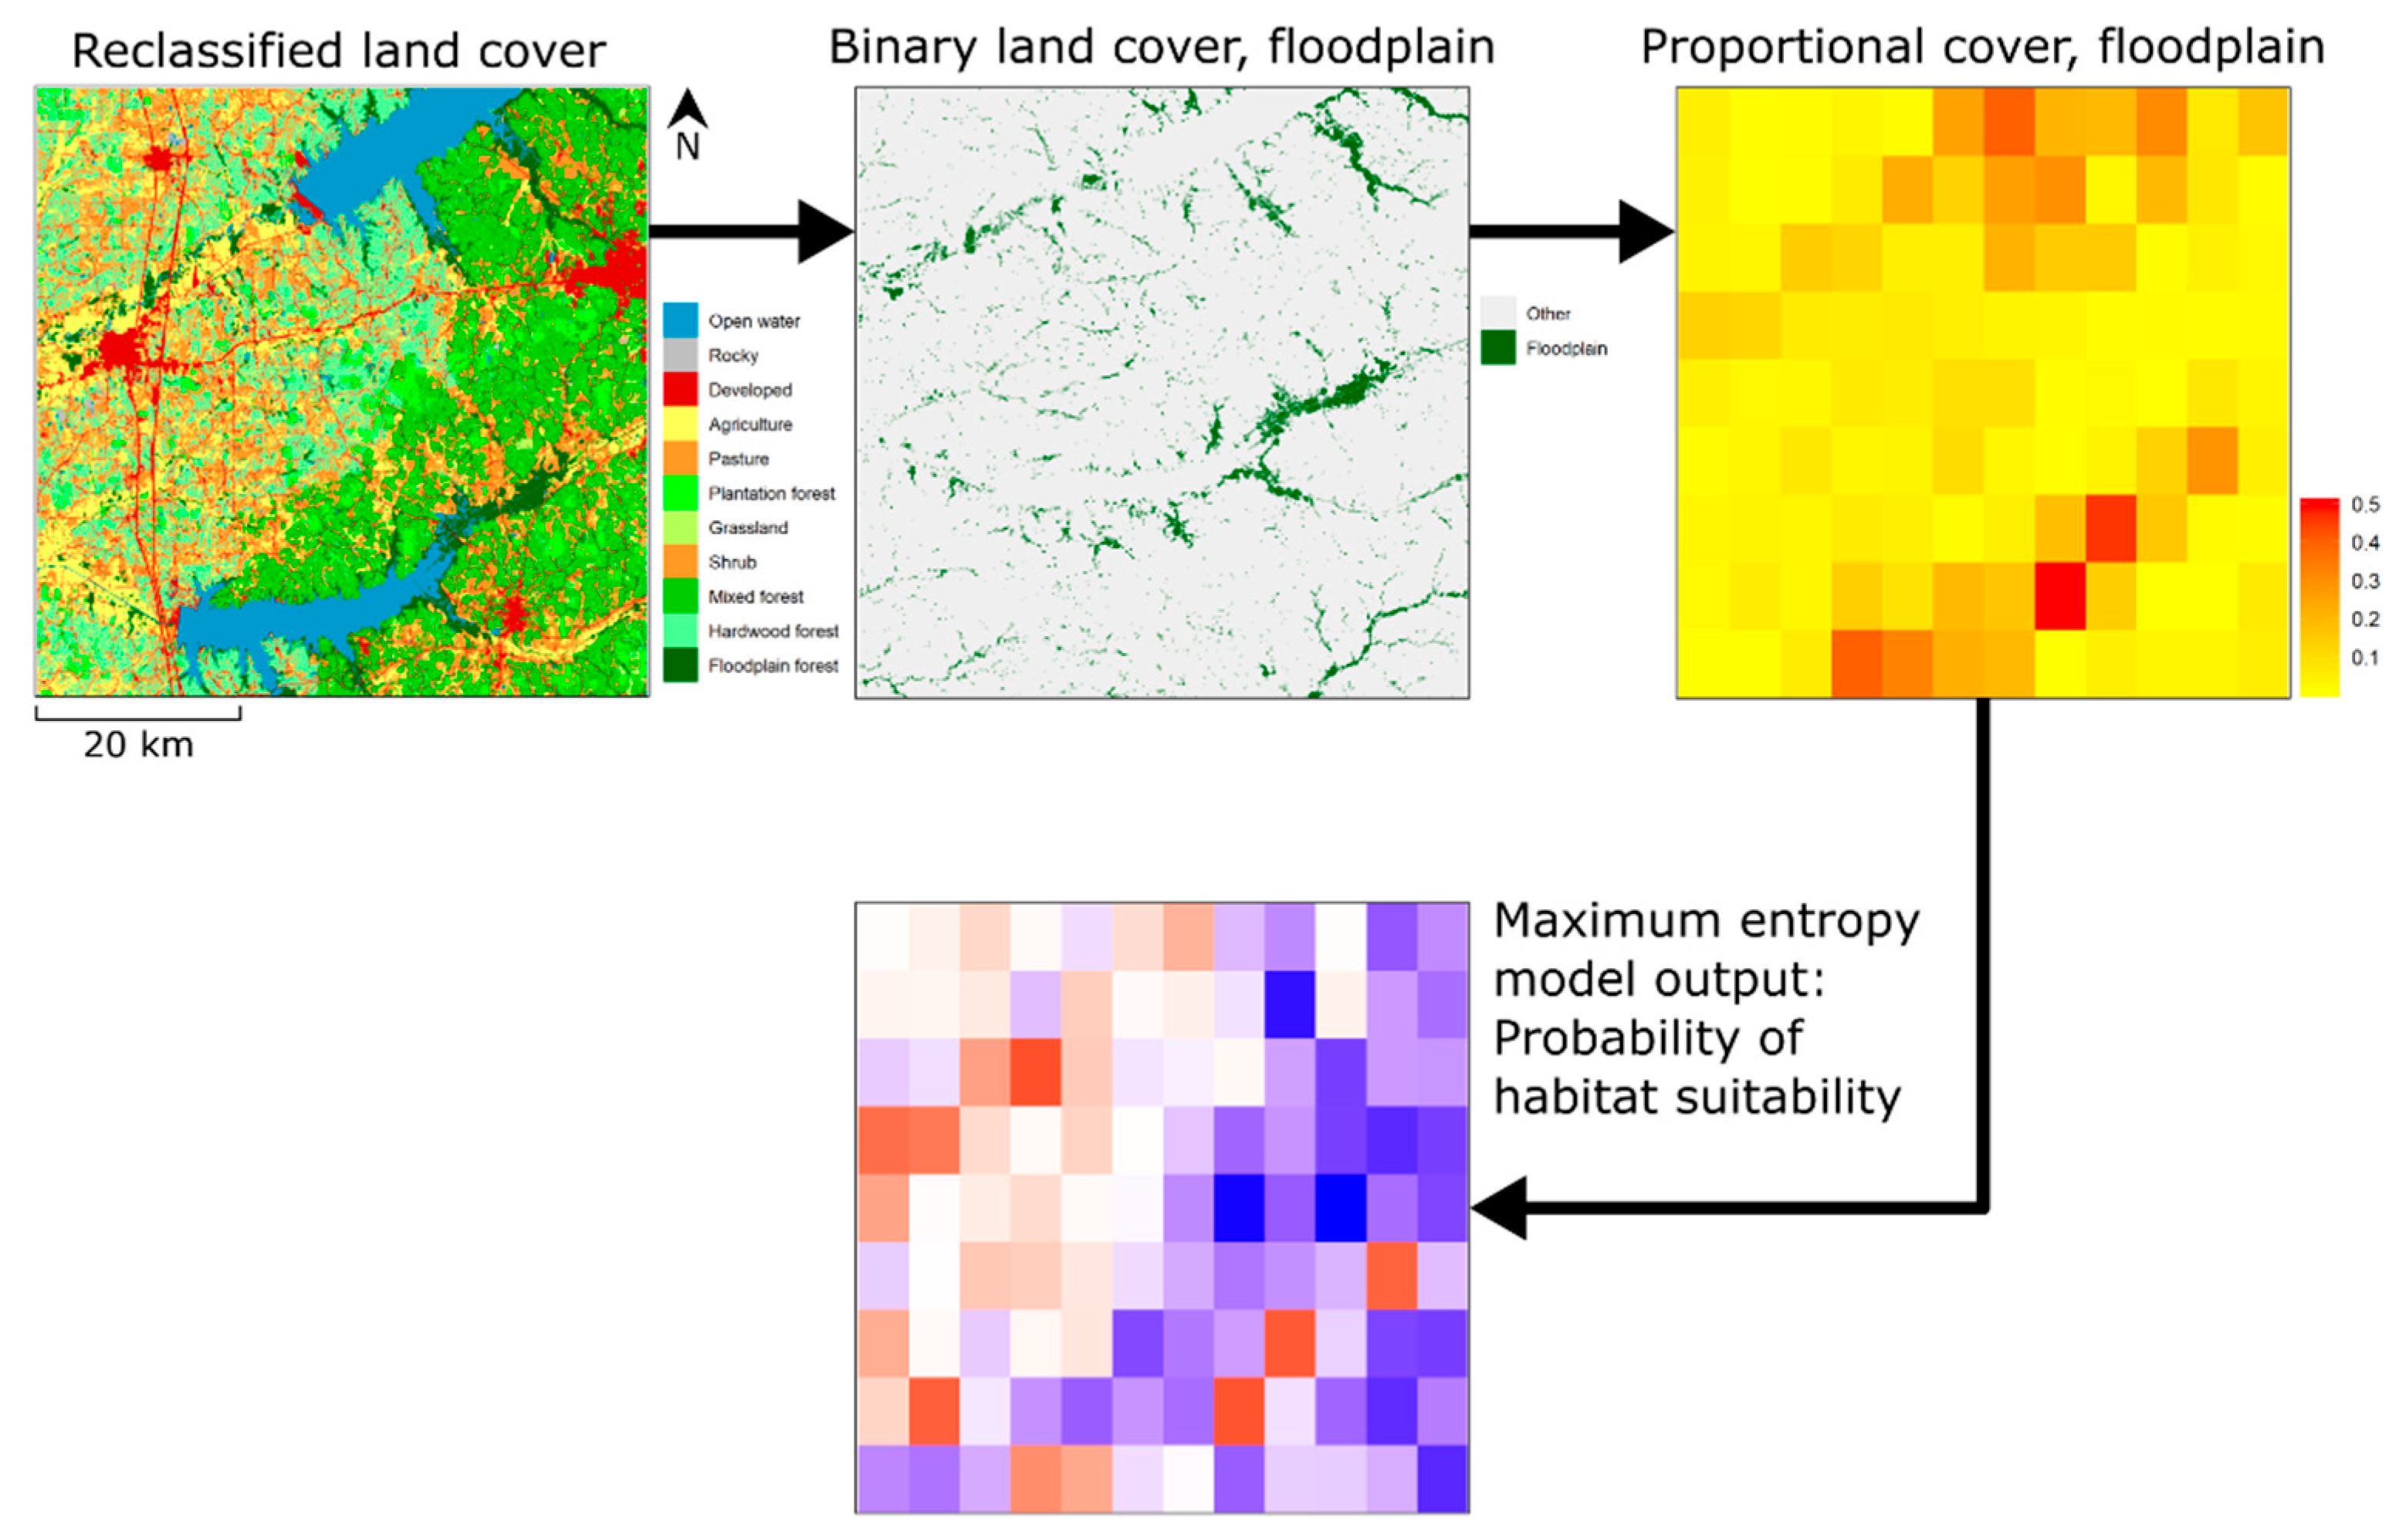
2. Methods
3. Model Evaluation
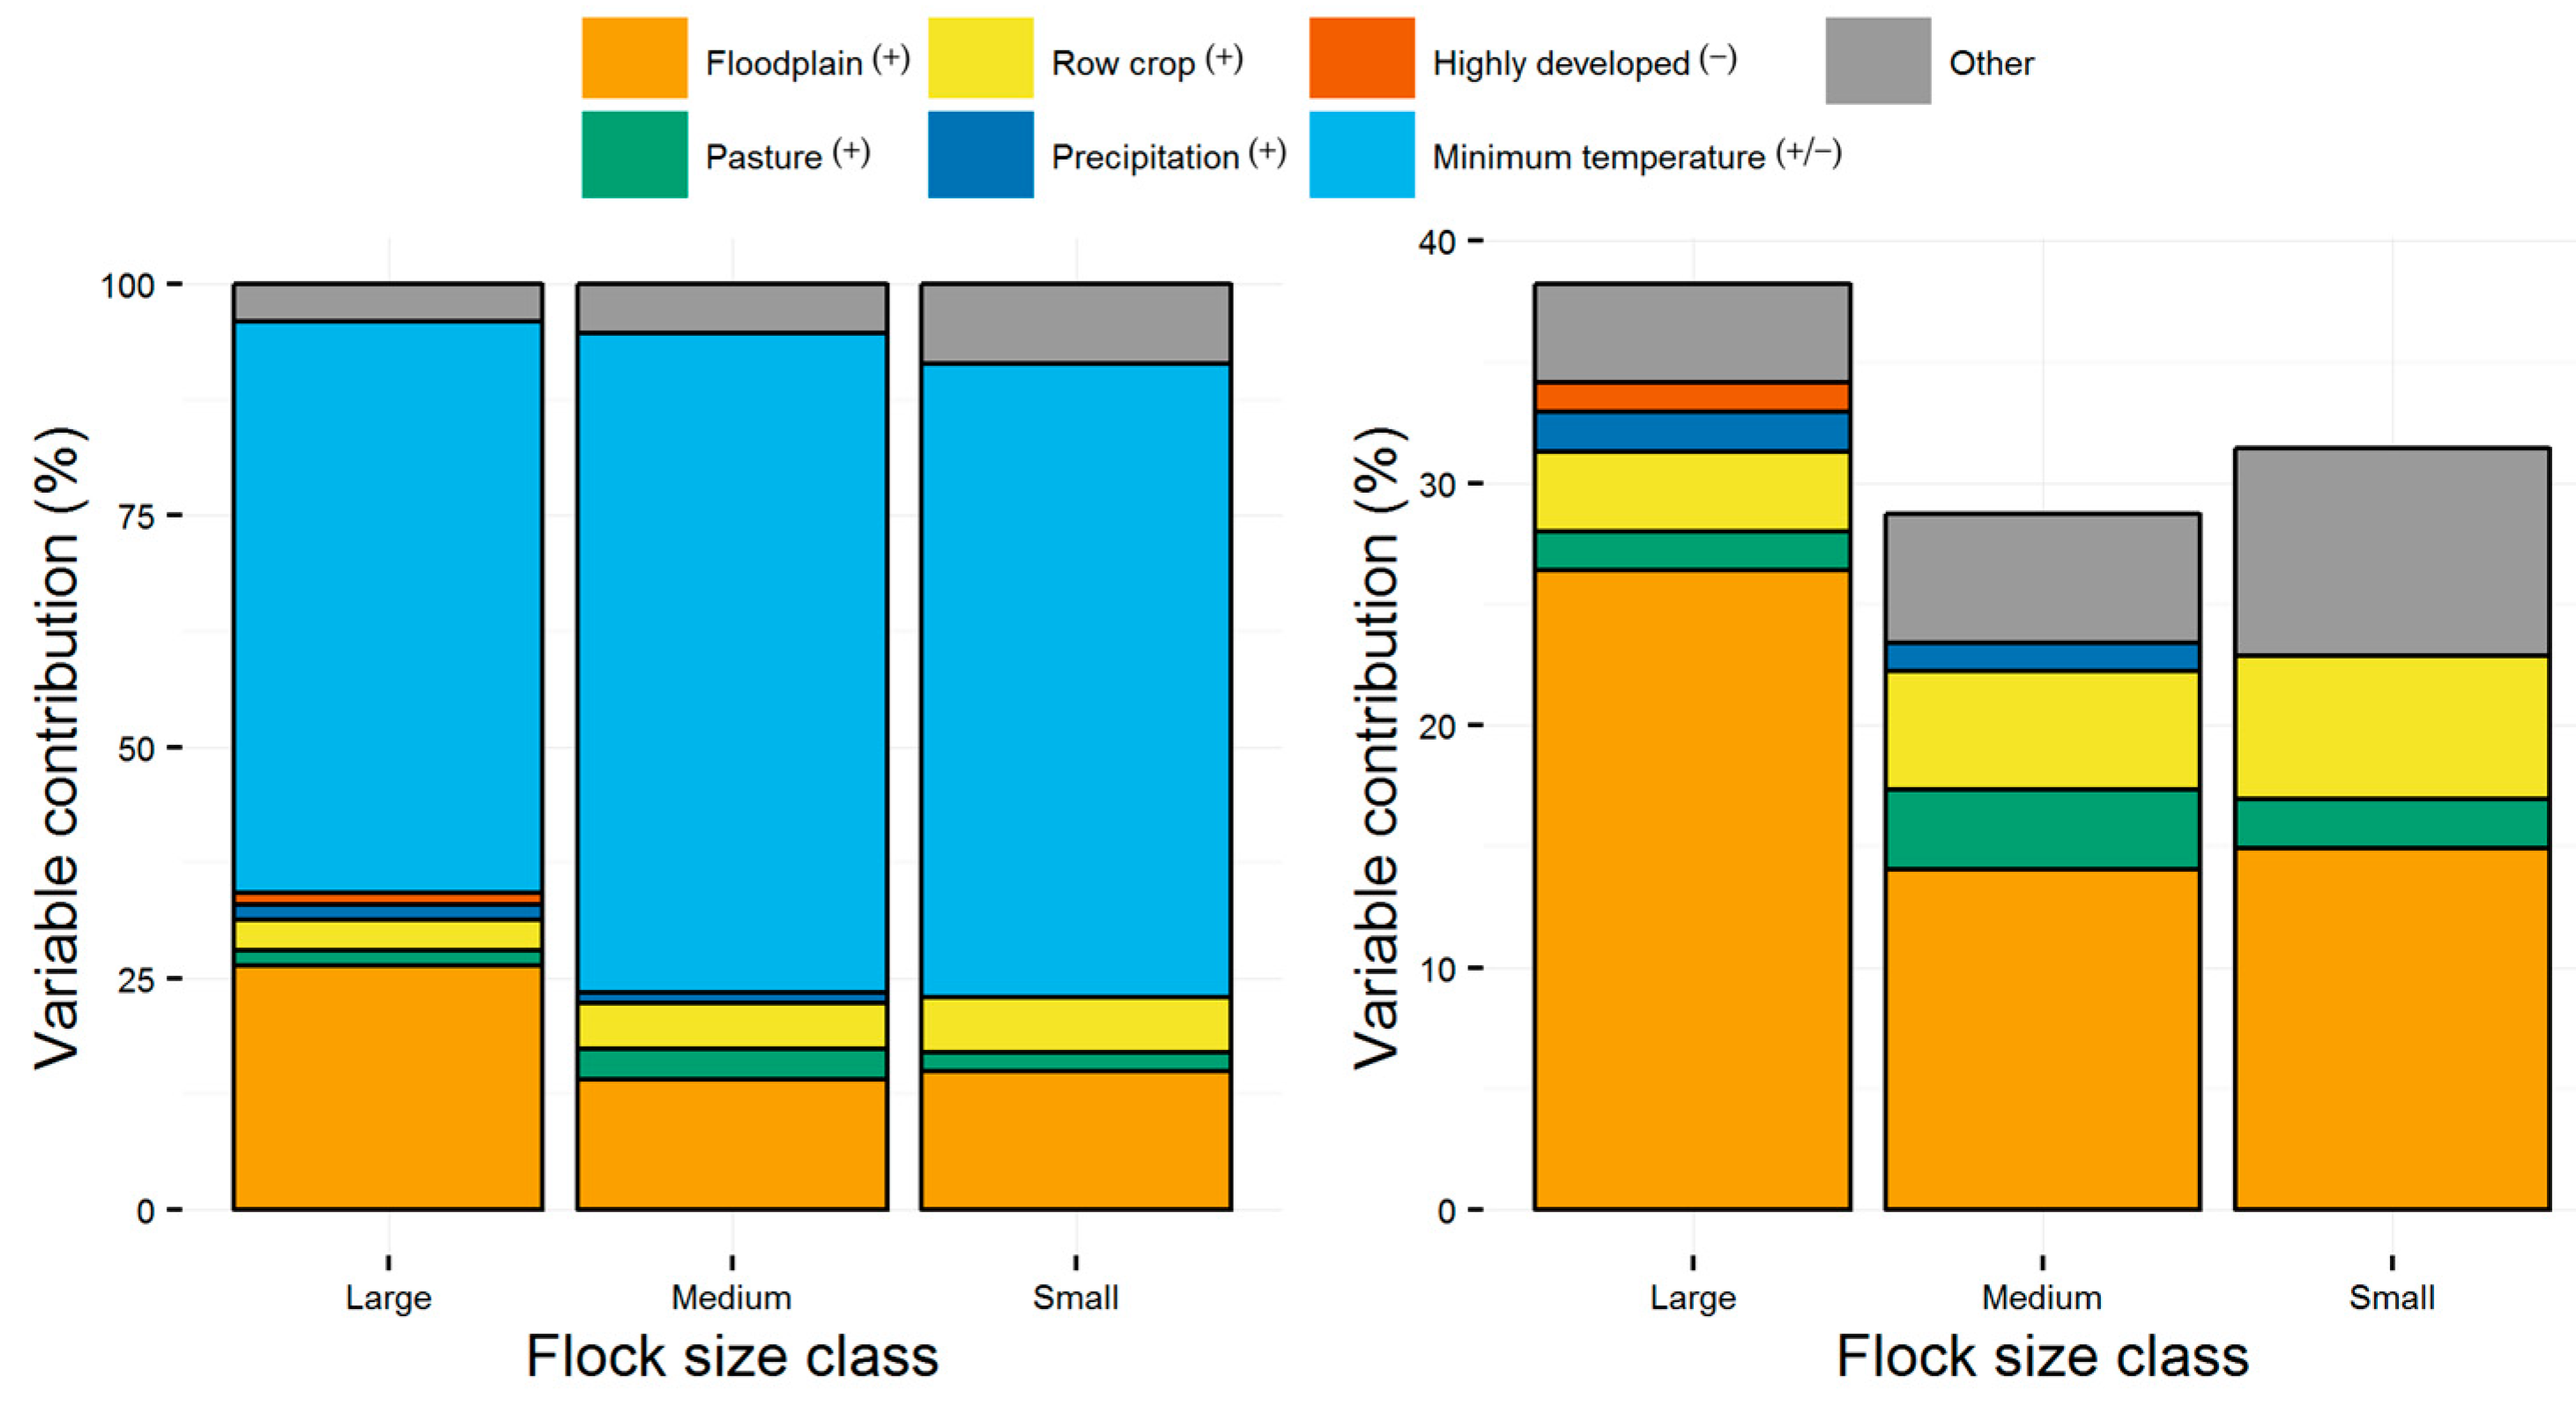
4. Influence of Environmental Variables
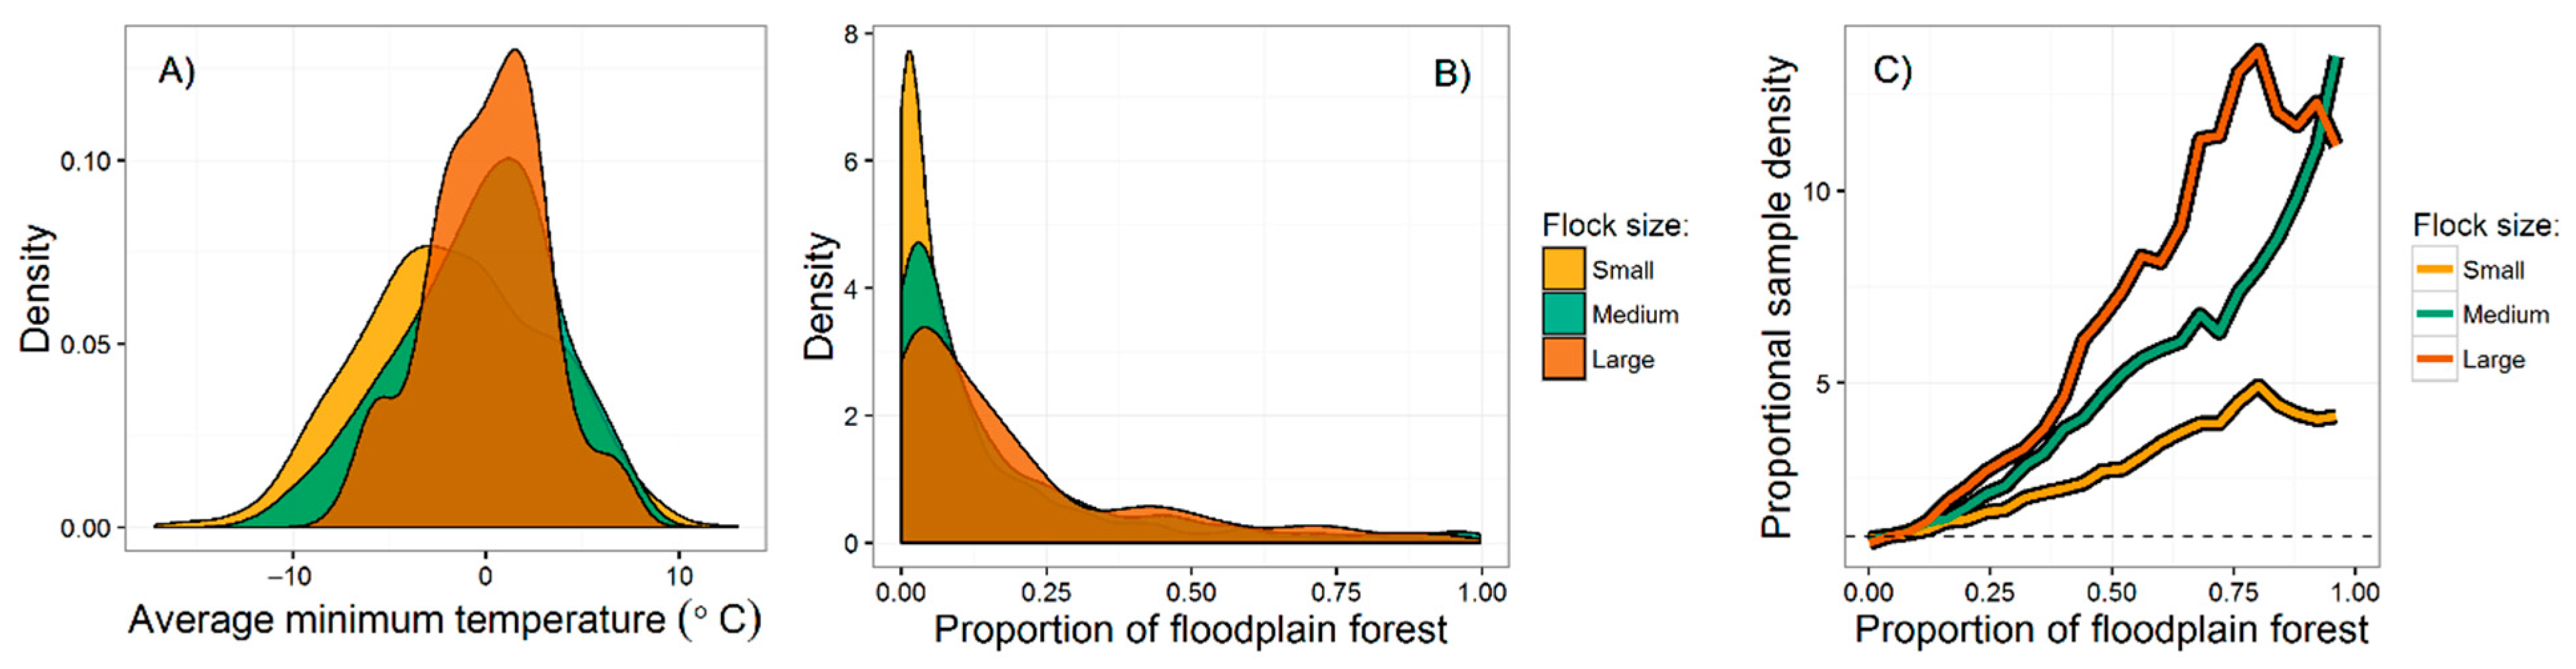
5. Difference in Environmental Niche by Flock Size
6. Results
7. Model Performance and Environmental Correlates by Flock Size
8. Environmental Niche
9. Discussion
10. Environmental Predictors of Occurrence
11. Larger Flocks Have a Narrower Niche Breadth
12. Regional Hotspots and Conservation
13. Did the Blitz Help Relative to eBird Alone?
Supplementary Materials
Author Contributions
Funding
Institutional Review Board Statement
Informed Consent Statement
Data Availability Statement
Acknowledgments
Conflicts of Interest
References
- Avery, M.L. Rusty Blackbird (Euphagus Carolinus), version 1.0. In Birds of the World; Poole, A.F., Ed.; Cornell Lab of Ornithology: Ithaca, NY, USA, 2020; Available online: https://birdsoftheworld.org/bow/species/rusbla/cur/introduction (accessed on 10 February 2018).
- Luscier, J.D.; Lehnen, S.E.; Smith, K.G. Habitat Occupancy by Rusty Blackbirds Wintering in the Lower Mississippi Alluvial Valley. Condor 2010, 112, 841–848. [Google Scholar] [CrossRef]
- Powell, L.L.; Hodgman, T.P.; Fiske, I.J.; Glanz, W.E. Habitat occupancy of Rusty Blackbirds (Euphagus carolinus) breeding in northern New England, USA. Condor 2014, 116, 122–133. [Google Scholar] [CrossRef]
- Greenberg, R.; Droege, S. On the Decline of the Rusty Blackbird and the Use of Ornithological Literature to Document Long-Term Population Trends. Conserv. Biol. 1999, 13, 553–559. [Google Scholar] [CrossRef] [Green Version]
- Greenberg, R.; Demarest, D.W.; Matsuoka, S.M.; Mettke-Hofmann, C.; Evers, D.; Hamel, P.B.; Luscier, J.; Powell, L.L.; Shaw, D.; Avery, M.L.; et al. Understanding Declines in Rusty Blackbirds. Boreal Birds North Am. 2011, 41, 107–126. [Google Scholar] [CrossRef]
- Sauer, J.R. The North American Breeding Bird Survey, Results and Analysis 1966–2015. Version 1.30.2015. USGS Patuxent Wildlife Research Center: Laurel, MD 2015. Available online: http://www.mbr-pwrc.usgs.gov.bbs/ (accessed on 15 August 2016).
- Powell, L.L.; Hodgman, T.P.; Glanz, W.E.; Osenton, J.D.; Fisher, C.M. Nest-Site Selection and Nest Survival of the Rusty Blackbird: Does Timber Management Adjacent to Wetlands Create Ecological Traps? Condor 2010, 112, 800–809. [Google Scholar] [CrossRef]
- Edmonds, S.T.; Evers, D.C.; Cristol, D.A.; Mettke-Hofmann, C.; Powell, L.L.; McGann, A.J.; Armiger, J.W.; Lane, O.P.; Tessler, D.F.; Newell, P.; et al. Geographic and Seasonal Variation in Mercury Exposure of the Declining Rusty Blackbird. Condor 2010, 112, 789–799. [Google Scholar] [CrossRef]
- Greenberg, R.; Matsuoka, S.M. Special section: Rangewide ecology of the declining Rusty Blackbird. Rusty Blackbird: Mysteries of a species in decline. Condor 2010, 112, 770–777. [Google Scholar] [CrossRef]
- Newell, P.J. Winter Ecology of the Rusty Blackbird (Euphagus Carolinus). Ph.D. Thesis, University of Georgia, Athens, GA, USA, 2013. [Google Scholar]
- Van Horne, B. Density as a Misleading Indicator of Habitat Quality. J. Wildl. Manag. 1983, 47, 893–901. [Google Scholar] [CrossRef]
- Borchert, S.M. Site-Specific Habitat and Landscape Associations of Rusty Blackbirds Wintering in Louisiana. Master’s Thesis, Louisiana State University, Baton Rouge, LA, USA, 2015. [Google Scholar]
- eBird Basic Dataset. Version: EBD_relNov-2017; Cornell Lab of Ornithology: Ithaca, NY, USA, 2017; p. 8. [Google Scholar]
- Beauchamp, G.; Belisle, M.; Giraldeau, L.A. Influence of conspecific attraction on the spatial distribution of learning foragers in a patchy habitat. J. Anim. Ecology 1997, 66, 671–682. [Google Scholar] [CrossRef]
- Pöysä, H. Group Foraging in Patchy Environments: The Importance of Coarse-Level Local Enhancement. Ornis Scand. 1992, 23, 159. [Google Scholar] [CrossRef]
- Stolen, E.D.; Collazo, J.A.; Percival, H.F. Group-Foraging Effects on Capture Rate in Wading Birds. Condor 2012, 114, 744–754. [Google Scholar] [CrossRef]
- Thiebault, A.; Mullers, R.H.; Pistorius, P.A.; Tremblay, Y. Local enhancement in a seabird: Reaction distances and foraging consequence of predator aggregations. Behav. Ecology 2014, 25, 1302–1310. [Google Scholar] [CrossRef]
- Ward, P.; Zahavi, A. The importance of certain assemblages of birds as “information-centres” for food-finding. Ibis 1973, 115, 517–534. [Google Scholar] [CrossRef]
- Pride, R.E. Optimal group size and seasonal stress in ring-tailed lemurs (Lemur catta). Behav. Ecol. 2005, 16, 550–560. [Google Scholar] [CrossRef] [Green Version]
- Hoare, D.; Couzin, I.; Godin, J.-G.; Krause, J. Context-dependent group size choice in fish. Anim. Behav. 2004, 67, 155–164. [Google Scholar] [CrossRef]
- Caraco, T. Time Budgeting and Group Size: A Theory. Ecology 1979, 60, 611–617. [Google Scholar] [CrossRef]
- Beerens, J.M.; Noonburg, E.G.; Gawlik, D.E. Linking dynamic habitat selection with wading bird foraging distributions across resource gradients. PLoS ONE 2015, 10, e0128182. [Google Scholar] [CrossRef]
- Gopi Sundar, K.S. Flock Size, Density and Habitat Selection of Four Large Waterbirds Species in an Agricultural Landscape in Uttar Pradesh, India: Implications for Management. Waterbirds 2006, 29, 365–374. [Google Scholar]
- Mettke-Hofmann, C.; Hamel, P.B.; Hofmann, G.; Zenzal, T.J., Jr.; Pellegrini, A.; Malpass, J. Competition and Habitat Quality Influence Age and Sex Distribution in Wintering Rusty Blackbirds. PLoS ONE 2015, 10, e0123775. [Google Scholar] [CrossRef]
- Wohner, P.J.; Cooper, R.J.; Greenberg, R.S.; Schweitzer, S.H. Weather affects diet composition of rusty blackbirds wintering in suburban landscapes. J. Wildl. Manag. 2015, 80, 91–100. [Google Scholar] [CrossRef]
- Arevalo, J.E.; Gosler, A.G. The behaviour of Treecreepers Certhia familiaris in mixed-species flocks in winter. Bird Study 1994, 41, 1–6. [Google Scholar] [CrossRef]
- Colwell, R.K.; Futuyma, D.J. On the Measurement of Niche Breadth and Overlap. Ecology 1971, 52, 567–576. [Google Scholar] [CrossRef]
- Hutchinson, G.E. Concluding remarks. Cold Spring Harb. Symp. Quant. Biol. 1957, 22, 415–427. [Google Scholar] [CrossRef]
- Levins, R. Evolution in Changing Environments; Princeton University Press: Princeton, NJ, USA, 1968. [Google Scholar]
- Sullivan, B.L.; Wood, C.L.; Iliff, M.J.; Bonney, R.E.; Fink, D.; Kelling, S. eBird: A citizen-based bird observation network in the biological sciences. Biol. Conserv. 2009, 142, 2282–2292. [Google Scholar] [CrossRef]
- Evans, B.S. Summary Report: Assessing Rusty Blackbird Habitat Suitability on Wintering Grounds and during Spring Migration Using A Large Citizen-Science Dataset; Smithsonian Migratory Bird Center: Washington, DC, USA, 2016; Available online: http://rustyblackbird.org/wp-content/uploads/RUBL_Blitz10pgReportEvans23jan2017.pdf (accessed on 10 February 2018).
- Hirzel, A.H.; Le Lay, G. Habitat suitability modelling and niche theory. J. Appl. Ecology 2008, 45, 1372–1381. [Google Scholar] [CrossRef]
- Kellner, C.J.; Brawn, J.D.; Karr, J.R. What Is Habitat Suitability and How Should It Be Measured? In Wildlife 2001: Populations; McCullough, D.R., Barrett, R.H., Eds.; Elsevier Applied Science: New York, NY, USA, 1992; pp. 476–488. [Google Scholar]
- Phillips, S.J.; Anderson, R.P.; Schapire, R.E. Maximum entropy modeling of species geographic distributions. Ecology Model. 2006, 190, 231–259. [Google Scholar] [CrossRef] [Green Version]
- Sullivan, B.L.; Aycrigg, J.L.; Barry, J.H.; Bonney, R.E.; Bruns, N.; Cooper, C.B.; Damoulas, T.; Dhondt, A.A.; Dietterich, T.; Farnsworth, A.; et al. The eBird enterprise: An integrated approach to development and application of citizen science. Biol. Conserv. 2014, 169, 31–40. [Google Scholar] [CrossRef]
- Rowcliffe, M. Activity: Animal Activity Statistics. R Package Version 1.3. 2019. Available online: https://CRAN.R-project.org/package=activity (accessed on 15 July 2019).
- Nouvellet, P.; Rasmussen, G.S.A.; Macdonald, D.W.; Courchamp, F. Noisy clocks and silent sunrises: Measurement methods of daily activity pattern. J. Zool. 2011, 286, 179–184. [Google Scholar] [CrossRef] [Green Version]
- Vazquez, C.; Rowcliffe, J.M.; Spoelstra, K.; Jansen, P.A. Comparing diel activity patterns of wildlife across latitudes and seasons: Time transformations using day length. Methods Ecology Evol. 2019, 10, 2057–2066. [Google Scholar] [CrossRef] [Green Version]
- Ridout, M.S.; Linkie, M. Estimating overlap of daily activity patterns from camera trap data. J. Agric. Biol. Env. Stat. 2009, 14, 322–337. [Google Scholar] [CrossRef]
- Dickinson, J.L.; Zuckerberg, B.; Bonter, D.N. Citizen science as an ecological research tool: Challenges and benefits. Annu. Rev. Ecology Evol. Syst. 2010, 41, 149–172. [Google Scholar] [CrossRef] [Green Version]
- Hortal, J.; Jiménez-Valverde, A.; Gómez, J.F.; Lobo, J.M.; Baselga, A. Historical bias in biodiversity inventories affects the observed environmental niche of the species. Oikos 2008, 117, 847–858. [Google Scholar] [CrossRef]
- Newbold, T.; Reader, T.; El-Gabbas, A.; Berg, W.; Shohdi, W.M.; Zalat, S.; El Din, S.B.; Gilbert, F. Testing the accuracy of species distribution models using species records from a new field survey. Oikos 2010, 119, 1326–1334. [Google Scholar] [CrossRef]
- Dudík, M.; Phillips, S.J.; Schapire, R.E. Correcting sample selection bias in maximum entropy density estimation. Adv. Neural Inf. Process. Syst. 2006, 18, 323–330. [Google Scholar]
- Elith, J.; Phillips, S.J.; Hastie, T.; Dudík, M.; Chee, Y.E.; Yates, C.J. A statistical explanation of MaxEnt for ecologists. Divers. Distrib. 2010, 17, 43–57. [Google Scholar] [CrossRef]
- Phillips, S.J.; Dudík, M.; Elith, J.; Graham, C.H.; Lehmann, A.; Leathwick, J.; Ferrier, S. Sample selection bias and occurrence-only distribution models: Implications for background and pseudo-absence data. Ecology Appl. 2009, 19, 181–197. [Google Scholar] [CrossRef] [Green Version]
- Anderson, R.P.; Raza, A. The effect of the extent of the study region on GIS models of species geographic distributions and estimates of niche evolution: Preliminary tests with montane rodents (genus Nephelomys) in Venezuela. J. Biogeogr. 2010, 37, 1378–1393. [Google Scholar] [CrossRef]
- Hijmans, R.J.; van Etten, J.; Cheng, J.; Mattiuzzi, M.; Sumner, M.; Greenberg, J.A.; Lamigueiro, O.P.; Bevan, A.; Racine, E.B.; Shortridge, A.; et al. Raster: Geographic Data Analysis and Modeling. In R Package Version 2.8-19. 2015. Available online: https://CRAN.R-project.org/package=raster (accessed on 27 September 2020).
- R Core Team 2013. R: A Language and Environment for Statistical Computing; R Foundation for Statistical Computing: Vienna, Austria, 2013; Available online: http://www.r-project.org/ (accessed on 10 March 2012).
- PRISM Climate Group. Oregon State University. Available online: http://prism.oregonstate.edu (accessed on 1 June 2013).
- Scott, J.M.; Davis, F.; Csuti, B.; Noss, R.; Butterfield, B.; Groves, C.; Anderson, H.; Caicco, S.; D’Erchia, F.; Edwards, T.C., Jr.; et al. Gap Analysis: A Geographic Approach to Protection of Biological Diversity. In Wildlife Monographs; John Wiley & Sons: Hoboken, NJ, USA, 1993; pp. 3–41. [Google Scholar]
- Hijmans, R.J.; Phillips, S.; Leathwick, J.; Elith, J.; Hijmans, M.R.J. Package ‘Dismo’. Circles 2017, 9, 1–68. [Google Scholar]
- Merow, C.; Smith, M.J.; Silander, J.A. A practical guide to MaxEnt for modeling species’ distributions: What it does, and why inputs and settings matter. Ecography 2013, 36, 1058–1069. [Google Scholar] [CrossRef]
- Duan, R.Y.; Kong, X.Q.; Huang, M.Y.; Fan, W.Y.; Wang, Z.G. The predictive performance and stability of six species distribution models. PLoS ONE 2014, 9, e112764. [Google Scholar] [CrossRef] [Green Version]
- Swets, J.A. Measuring the accuracy of diagnostic systems. Science 1988, 240, 1285–1293. [Google Scholar] [CrossRef] [Green Version]
- Shcheglovitova, M.; Anderson, R.P. Estimating optimal complexity for ecological niche models: A jackknife approach for species with small sample sizes. Ecology Model. 2013, 269, 9–17. [Google Scholar] [CrossRef]
- Simpson, G.L. Permute: Functions for Generating Restricted Permutations of Data. R Package Version 0.9-5. 2019. Available online: https://CRAN.R-project.org/package=permute (accessed on 10 March 2012).
- Warren, D.L.; Glor, R.E.; Turelli, M. ENMTools: A toolbox for comparative studies of environmental niche models. Ecography 2010, 33, 607–611. [Google Scholar] [CrossRef]
- Phillips, S.J.; Elith, J. On estimating probability of presence from use-availability or presence-background data. Ecology 2013, 94, 1409–1419. [Google Scholar] [CrossRef] [PubMed] [Green Version]
- Warren, D.L.; Glor, R.E.; Turelli, M. Environmental niche equivalency versus conservatism: Quantitative approaches to niche evolution. Evolution 2008, 62, 2868–2883. [Google Scholar] [CrossRef] [PubMed]
- Heibl, C.; Calenge, C. Phyloclim: Integrating Phylogenetics and Climatic Niche Modeling. In R Package Version 0.9-4. 2013. Available online: https://CRAN.R-project.org/package=phyloclim (accessed on 27 September 2020).
- Brown, C.R.; Baxter, C.; Pashley, D.N. The Ecological Basis for the Conservation of Migratory Birds in the Mississippi Alluvial Valley. In Strategies for Bird Conservation: The Partners in Flight Planning Process; Bonney, R., Pashley, D.N., Cooper, R.J., Niles, L., Eds.; Cornell Lab of Ornithology: Ithaca, NY, USA, 1999; pp. 3–6. [Google Scholar]
- Wehrle, B.W.; Kaminski, R.M.; Leopold, B.D.; Smith, W.P. Aquatic invertebrate resources in Mississippi forested wetlands during winter. Wildlife Society Bulletin 1995, 23, 774–783. [Google Scholar]
- Faulkner, S.P. Urbanization impacts on the structure and function of forested wetlands. Urban Ecosyst. 2004, 7, 89–106. [Google Scholar] [CrossRef]
- Lockaby, B.G. Floodplain ecosystems of the Southeast: Linkages between forests and people. Wetl 2009, 29, 407–412. [Google Scholar] [CrossRef]
- Harmar, O.P.; Clifford, N.J.; Thorne, C.R.; Biedenharn, D.S. Morphological changes of the Lower Mississippi River: Geomorphological response to engineering intervention. River Res. Appl. 2005, 21, 1107–1131. [Google Scholar] [CrossRef]
- Hefner, J.M.; Brown, J.P. Wetland trends in the southeastern U.S. Wetlands 1984, 4, 1–11. [Google Scholar] [CrossRef]
- Hefner, J.M.; Wilen, B.O.; Dahl, T.E.; Frayer, W.E. Southeastern Wetlands: Status and Trends, Mid-1970s to Mid-1980s; U.S. Fish and Wildlife Service and U.S. Environmental Protection Agency: Atlanta, GA, USA, 1994.
- Rudis, V.A. Regional forest fragmentation effects on bottomland hardwood community types and resource values. Landsc. Ecology 1995, 10, 291–307. [Google Scholar] [CrossRef]
- Twedt, D.J.; Loesch, C.R. Forest area and distribution in the Mississippi alluvial valley: Implications for breeding bird conservation. J. Biogeogr. 1999, 26, 1215–1224. [Google Scholar] [CrossRef]
- Niven, D.K.; Sauer, J.R.; Butcher, G.S. Christmas bird count provides insights into population change in land birds that breed in the boreal forest. Am. Birds 2004, 58, 10–20. [Google Scholar]
- DeLeon, E.E. Ecology of Rusty Blackbirds Wintering in Louisiana: Seasonal Trends, Flock Compositions and Habitat Associations. Master’s Thesis, Louisiana State University, Baton Rouge, LA, USA, 2012. [Google Scholar]
- Batema, D.L.; Kaminski, R.M.; Magee, P.A. Wetland invertebrate communities and management of hardwood bottomlands in the Mississippi Alluvial Valley. In Ecology and Management of bottomland Hardwood Systems: The State of our Understanding; Fredrickson, L.H., King, S.L., Kaminski, R.M., Eds.; Gaylord Memorial Laboratory Special Publication 10, University of Missouri-Columbia: Puxico, MO, USA, 2005; pp. 173–190. [Google Scholar]
- Fredrickson, L.H.; Batema, D.L. Greentree Reservoir Management Handbook; Gaylord Memorial Lab, University of Missouri: Puxico, MO, USA, 1992. [Google Scholar]
- White, D.C. Lowland hardwood wetland invertebrate community and production in Missouri. Arch. Hydrobiol. 1985, 103, 509–533. [Google Scholar]
- Johnson, J.A.; Matsuoka, S.M.; Tessler, D.F.; Greenberg, R.; Fox, J.W. Identifying Migratory Pathways Used by Rusty Blackbirds Breeding in Southcentral Alaska. Wilson J. Ornithol. 2012, 124, 698–703. [Google Scholar] [CrossRef]
- Wright, J.R.; Powell, L.L.; Tonra, C.M. Automated telemetry reveals staging behavior in a declining migratory passerine. Auk 2018, 135, 461–476. [Google Scholar] [CrossRef] [Green Version]
- Harrison, X.A.; Blount, J.D.; Inger, R.; Norris, D.R.; Bearhop, S. Carry-over effects as drivers of fitness differences in animals. J. Anim. Ecology 2010, 80, 4–18. [Google Scholar] [CrossRef]
- Marra, P.P.; Cohen, E.B.; Loss, S.R.; Rutter, J.E.; Tonra, C.M. A call for full annual cycle research in animal ecology. Biol. Lett. 2015, 11, 20150552. [Google Scholar] [CrossRef]
- Saupe, E.E.; Qiao, J.; Hendricks, J.R.; Portell, R.W.; Junter, S.J.; Sobseron, J.; Lieberman, B.S. Niche breadth and geographic range size as determinants of species survival on geological time scales. Glob. Ecology Biogeogr. 2015, 24, 1159–1169. [Google Scholar] [CrossRef]
- Johnson, D.D.; Kays, R.; Blackwell, P.G.; Macdonald, D.W. Does the resource dispersion hypothesis explain group living? Trends Ecology Evol. 2002, 17, 563–570. [Google Scholar] [CrossRef]
- Battin, J. When Good Animals Love Bad Habitats: Ecological Traps and the Conservation of Animal Populations. Conserv. Biol. 2004, 18, 1482–1491. [Google Scholar] [CrossRef]
- Kawecki, T.J. Adaptation to Marginal Habitats. Annu. Rev. Ecology Evol. Syst. 2008, 39, 321–342. [Google Scholar] [CrossRef] [Green Version]
- Powell, L.L.; Ames, E.M.; Wright, J.R.; Matthiopoulos, J.; Marra, P.P. Interspecific competition between resident and wintering birds: Experimental evidence and consequences of coexistence. Ecology 2020, in press. [Google Scholar] [CrossRef]
- Johnson, M.D. Measuring habitat quality: A review. Condor 2007, 109, 489–504. [Google Scholar] [CrossRef]
- Studds, C.E.; Marra, P.P. Rainfall-induced changes in food availability modify the spring departure programme of a migratory bird. Proc. R. Soc. B Biol. Sci. 2011, 278, 3437–3443. [Google Scholar] [CrossRef]
- Bearhop, S.; Hilton, G.M.; Votier, S.C.; Waldron, S. Stable isotope ratios indicate that body condition in migrating passerines is influenced by winter habitat. Proc. R. Soc. Lond. Ser. B 2004, 271, 215–218. [Google Scholar] [CrossRef] [Green Version]
- Latta, S.C.; Faaborg, J. Demographic and population responses of Cape May Warblers wintering in multiple habitats. Ecology 2002, 83, 2502–2515. [Google Scholar] [CrossRef]
- Rintamäki, P.T.; Stone, J.R.; Lundberg, A.; Moore, F. Seasonal and diurnal body-mass fluctuations for two nonhoarding species of Parus in Sweden modeled using path analysis. Auk 2003, 120, 658–668. [Google Scholar] [CrossRef]
- Young, R.C.; Kitaysky, A.S.; Barger, C.P.; Dorresteijn, I.; Ito, M.; Watanuki, Y. Telomere length is a strong predictor of foraging behavior in a long-lived seabird. Ecosphere 2015, 6, 1–26. [Google Scholar] [CrossRef]
- Hobson, K.A.; Greenberg, R.; Van Wilgenburg, S.L.; Mettke-Hofmann, C. Migratory Connectivity in the Rusty Blackbird: Isotopic Evidence From Feathers of Historical and Contemporary Specimens. Condor 2010, 112, 778–788. [Google Scholar] [CrossRef] [Green Version]
- Omernik, J.M. Ecoregions: A spatial framework for environmental management. In Biological Assessment and Criteria: Tools for Water Resource Planning and Decision Making; Davis, W.S., Simon, T.P., Eds.; Lewis Publishers: Boca Raton, FL, USA, 1995; pp. 49–62. [Google Scholar]
- Omernik, J.M. Perspectives on the Nature and Definition of Ecological Regions. Environ. Manag. 2004, 34, S27–S38. [Google Scholar] [CrossRef]
- Omernik, J.M.; Griffith, G.E. Ecoregions of the Conterminous United States: Evolution of a Hierarchical Spatial Framework. Env. Manag. 2014, 54, 1249–1266. [Google Scholar] [CrossRef]
- Webster, G.R.; Samson, S.A. On Defining the Alabama Black Belt: Historical Changes and Variations. Southeast. Geogr. 1992, 32, 163–172. [Google Scholar] [CrossRef]
- Barone, J.A. Historical occurrence and distribution of prairies in the Black Belt of Mississippi and Alabama. Castanea 2005, 70, 170–183. [Google Scholar] [CrossRef]
- Cleland, H.F. Black Belt of Alabama. Geogr. Rev. 1920, 10, 375–387. [Google Scholar] [CrossRef]
- Wilson, T.H. Natural history of the black belt prairie. J. Ala. Acad. Sci. 1981, 52, 10–19. [Google Scholar]
- Phillips, S.J.; Dudík, M.; Schapire, R.E. A Maximum Entropy Approach to Species Distribution Modeling. In Proceedings of the Twenty-First International Conference on Machine Learning, Banff, AB, Canada, 4–8 July 2004; ACM: New York, NY, USA, 2004. [Google Scholar]
- Elith, J.; Graham, C.H.; Anderson, R.P.; Dud’ik, M.; Ferrier, S.; Guisan, A.; Hijmans, R.J.; Huettmann, F.; Leathwick, J.R.; Lehmann, A. Novel methods improve prediction of species’ distributions from occurrence data. Ecography 2006, 29, 129–151. [Google Scholar] [CrossRef] [Green Version]
- Guillera-Arroita, G.; Lahoz-Monfort, J.J.; Elith, J. Maxent is not a presence–absence method: A comment on Thibaud et al. Methods Ecology Evol. 2014, 11, 1192–1197. [Google Scholar] [CrossRef]
- Li, W.; Guo, Q.; Elkan, C. Can we model the probability of presence of species without absence data? Ecography 2011, 34, 1096–1105. [Google Scholar] [CrossRef]
- Lahoz-Monfort, J.J.; Guillera-Arroita, G.; Wintle, B.A. Imperfect detection impacts the performance of species distribution models. Glob. Ecology Biogeogr. 2014, 23, 504–515. [Google Scholar] [CrossRef]
- Guillera-Arroita, G.; Lahoz-Monfort, J.J.; Elith, J.; Gordon, A.; Kujala, H.; Lentini, P.E.; McCarthy, M.A.; Tingley, R.; Wintle, B.A. Is my species distribution model fit for purpose? Matching data and models to applications. Glob. Ecology Biogeogr. 2015, 24, 276–292. [Google Scholar] [CrossRef]
- Gaston, K.J.; Blackburn, T.M.; Greenwood, J.J.D.; Gregory, R.D.; Quinn, R.M.; Lawton, J.H. Abundance-occupancy relationships. J. Appl. Ecology 2000, 37, 39–59. [Google Scholar] [CrossRef]


| Sampling Method | Flock Size Class | |||
|---|---|---|---|---|
| Small (1–19) | Medium (20–99) | Large (>99) | Total | |
| Blitz | 281 | 128 | 86 | 495 |
| eBird | 387 | 234 | 93 | 714 |
| Total | 668 | 362 | 179 | 1209 |
| Land Cover Variable | Variable Coefficient (λ) | Variable Contribution (%) | ||||
|---|---|---|---|---|---|---|
| Flock Size | Flock Size | |||||
| Small | Medium | Large | Small | Medium | Large | |
| Highly developed | −0.83 | 1.2 | ||||
| Low-intensity development | 1.17 | 1.41 | 1.3 | 1.1 | ||
| Floodplain | 1.84 | 2.44 | 3.33 | 14.9 | 14.1 | 26.4 |
| Mixed forest | 2.33 | 2.9 | ||||
| Pasture | 0.70 | 1.58 | 1.47 | 2.1 | 3.3 | 1.6 |
| Row crop | 1.09 | 1.93 | 2.08 | 5.9 | 4.9 | 3.3 |
| Shrub | −3.26 | −2.29 | 3.7 | 1.1 | ||
| Emergent wetand | 2.50 | 1.5 | ||||
| Woody Wetland | 1.63 | 2.9 | ||||
| Woodland | −1.73 | −1.64 | 1.9 | 1.3 | ||
| Environmental Variable | Small vs. Medium Flocks | Small vs. Large Flocks | Medium vs. Large Flocks | |||
|---|---|---|---|---|---|---|
| D | p-Value | D | p-Value | D | p-Value | |
| High-intensity dev. | 0.058 | 0.197 | 0.084 | 0.164 | 0.066 | 0.573 |
| Low-intensity dev. | 0.053 | 0.324 | 0.057 | 0.623 | 0.360 | 0.993 |
| Floodplain forest | 0.112 | <0.001 | 0.208 | <0.001 | 0.139 | 0.001 |
| Hardwood forest | 0.096 | 0.005 | 0.045 | 0.866 | 0.113 | 0.055 |
| Mixed forest | 0.024 | 0.994 | 0.099 | 0.064 | 0.096 | 0.153 |
| Grassland | 0.117 | <0.001 | 0.084 | 0.164 | 0.079 | 0.338 |
| Pasture | 0.046 | 0.489 | 0.055 | 0.663 | 0.062 | 0.651 |
| Row crop | 0.036 | 0.788 | 0.098 | 0.066 | 0.096 | 0.146 |
| Shrub | 0.028 | 0.956 | 0.014 | 0.002 | 0.141 | 0.007 |
| Upland forest | 0.046 | 0.489 | 0.022 | 1.000 | 0.050 | 0.873 |
| Emergent wetland | 0.034 | 0.836 | 0.099 | 0.065 | 0.0696 | 0.516 |
| Woody wetland | 0.061 | 0.183 | 0.116 | 0.018 | 0.087 | 0.240 |
| Woodland | 0.010 | 0.003 | 0.139 | 0.002 | 0.040 | 0.979 |
| Precipitation | 0.088 | 0.013 | 0.153 | 0.001 | 0.093 | 0.179 |
| Minimum temperature | 0.170 | <0.001 | 0.271 | <0.001 | 0.112 | 0.030 |
Publisher’s Note: MDPI stays neutral with regard to jurisdictional claims in published maps and institutional affiliations. |
© 2021 by the authors. Licensee MDPI, Basel, Switzerland. This article is an open access article distributed under the terms and conditions of the Creative Commons Attribution (CC BY) license (http://creativecommons.org/licenses/by/4.0/).
Share and Cite
Evans, B.S.; Powell, L.L.; Demarest, D.W.; Borchert, S.M.; Greenberg, R.S. Flock Size Predicts Niche Breadth and Focal Wintering Regions for a Rapidly Declining Boreal-Breeding Passerine, the Rusty Blackbird. Diversity 2021, 13, 62. https://0-doi-org.brum.beds.ac.uk/10.3390/d13020062
Evans BS, Powell LL, Demarest DW, Borchert SM, Greenberg RS. Flock Size Predicts Niche Breadth and Focal Wintering Regions for a Rapidly Declining Boreal-Breeding Passerine, the Rusty Blackbird. Diversity. 2021; 13(2):62. https://0-doi-org.brum.beds.ac.uk/10.3390/d13020062
Chicago/Turabian StyleEvans, Brian S., Luke L. Powell, Dean W. Demarest, Sinéad M. Borchert, and Russell S. Greenberg. 2021. "Flock Size Predicts Niche Breadth and Focal Wintering Regions for a Rapidly Declining Boreal-Breeding Passerine, the Rusty Blackbird" Diversity 13, no. 2: 62. https://0-doi-org.brum.beds.ac.uk/10.3390/d13020062