Article

16S rRNA–Based Analysis Reveals Differences in the Bacterial Community Present in Tissues of Choromytilus chorus (Mytilidae, Bivalvia) Grown in an Estuary and a Bay in Southern Chile

1
Laboratorio de Ecología Microbiana Aplicada (EMALAB), Departamento de Ciencias Químicas y Recursos Naturales, Universidad de La Frontera, Ave. Francisco Salazar, Temuco 01145, Chile
2
Scientific and Technological Bioresource Nucleus (BIOREN), Universidad de La Frontera, Ave. Francisco Salazar, Temuco 01145, Chile
3
Centro de Modelación y Computación Científica, Universidad de La Frontera, Ave. Francisco Salazar, Temuco 01145, Chile
4
Office of Industry-Academia-Government and Community Collaboration, Hiroshima University, 1-3-2 Kagamiyama, Higashi-Hiroshima City, Hiroshima 739-8511, Japan
*
Author to whom correspondence should be addressed.
Submission received: 12 March 2021 / Revised: 1 May 2021 / Accepted: 10 May 2021 / Published: 14 May 2021
(This article belongs to the Special Issue Microbial Diversity in Aquatic Systems)

Abstract

:
Microbiota associated with bivalves have drawn considerable attention because studies have suggested their relevance to the fitness and growth of marine bivalves. Although the mussel Choromytilus chorus is a valuable resource for Chilean aquaculture and fisheries, its microbiota is still unknown. In this study, the composition and predicted functions of the bacterial community in tissues of C. chorus specimens grown in an estuary (Nehuentue) and a bay (Hueihue) were investigated. Using 16S rRNA genes as targets, the bacterial abundance in tissues was estimated by quantitative PCR and sequenced via Illumina MiSeq. The abundances of bacteria ranged from 103 to 105 copies of 16S rRNA genes g−1 tissue. In the Nehuentue estuary, the bacterial communities in the tissues were dominated by the Tenericutes phylum, whereas the Tenericutes and Proteobacteria phyla dominated in mussels from Hueihue Bay. Higher numbers of operational taxonomic units (OTUs) were observed in tissues from the Nehuentue Estuary than in those from Hueihue Bay. Differences in bacterial community compositions in tissues between both locations were confirmed by nonmetric multidimensional scaling (nMDS) and Venn diagram analysis. In addition, linear discriminant analysis effect size (LEfSe) revealed that the Mollicutes class and Actynomycetales order were key phylotypes in tissues from the Nehuentue Estuary and Hueihue Bay, respectively. Our analysis also predicted a high abundance of sequences assigned to heterotrophy; however, relatively high functional diversity was also found in tissues from Hueihue Bay. This work represents our first attempt to elucidate the C. chorus microbiota in contrasting Chilean aquatic environments.

1. Introduction

The production of marine bivalves for human consumption at the global level represents more than 15 million tons per year, where 89% and 11% come from aquaculture and fishery, respectively [1]. Chile is recognized as the fourth-highest producing country of mussels worldwide [2]; therefore, the culture and fishery of mussels are of large economic and social importance in some coastal regions of southern Chile. In this context, Choromytilus chorus (Molina, 1873), locally named “Choro Malton” or “Choro Zapato,” is a native mussel distributed along Chilean coasts (from 4 to 20 m depth) with a tolerance rate constant between 24 and 30% salinity [3] and primarily adhere to rocky substrates [4]. In southern Chile, C. chorus is grown by both extensive and intensive cultivation practices in aquaculture facilities or collected from natural banks located in protected bays, such as the archipelagos of Chiloe Island [5]. C. chorus is also grown extensively on sandy substrates in estuaries by artisanal fishermen, representing the main economic and touristic activity in some southern Chilean areas, such as the Nehuentue estuary. Traditionally, it has been believed by the local Nehuentue community that the brackish water, a mixture of seawater and river freshwater, gives C. chorus a unique flavor and organoleptic characteristics compared to those of mussels exclusively grown in seawater and concomitantly have higher commercial value. However, this assumption has not been scientifically proven to date, and various programs developed by Chilean governmental agencies (e.g., National Institute for the Sustainable Development of Artisanal Fisheries and Small Scale Aquaculture; http://www.fap.cl/indespa/) and universities (e.g., Agroindustry Institute; http://agroindustria.ufro.cl/index.php) are focused on characterizing C. chorus and strengthening its extensive aquaculture based on scientific-technological innovation. Despite the proven relevance of biological interactions for aquatic organisms, host-microbiota interactions in C. chorus have not been considered in these programs.
C. chorus is a filter feeder, similar to other mussel and bivalve species, and eat planktonic microorganisms, including bacteria that are suspended in the water column as food that can be captured and used as nutrient sources or passed through the intestine and released through the anus [6]. However, bacteria in the digestive tract of bivalves can also adhere, colonize, proliferate, and interact, thereby establishing themselves as part of the permanent and autochthonous microbiota of the host [7]. Studies have suggested that the microbiota in bivalves can be influenced by local factors [8,9] and can contribute beneficial functions to the host, such as the improvement of digestive tract development, the increase in an immune response against pathogen attack, and the provision of essential nutrients (e.g., vitamins, enzymes, and fatty acids) [10,11]. In contrast, studies have also revealed the occurrence of pathogenic bacteria in the microbiota, including both zoonotic pathogens (e.g., Vibrio splendidus, Vibrio aestuariuanus, and Nocardia crassostreae) and human pathogens (e.g., Vibrio parahaemolyticus and Vibrio vulnificus) [12,13,14,15]. Similarly, studies have also linked shifts in microbiota composition to bivalve mass mortality events [16,17,18]. In this context, the microbiota in some bivalve species has been characterized, revealing differences (or compartmentalization) between tissues [19], where external tissues (shell and mantle) show a variable microbiota close to bacteria present in the surrounding aquatic environments. In contrast, internal tissues (intestine and hemolymph) harbor a more stable microbiota involved in nutrient acquisition and defense against pathogens [9]. However, studies on the response of microbiota of mussels to local environmental conditions have not been reported to date.
Most microbiological studies on bivalves in Chile have identified and controlled bacterial pathogens during their attack of larval and juvenile bivalves at aquaculture facilities [20,21], including scallops [22,23], oysters [24,25], and mussels [26,27]. However, to our knowledge, studies on microbiome interactions and their role (or influence) on the life cycle of mussels have not been considered thus far, particularly in determining the differences in the composition and functions of the bacterial community in the microbiota of mussels grown in contrasting environments. In this context, the primary objective of the present study was to determine and compare the compositions and predicted functions of the bacterial communities present in the digestive glands and intestinal tissues of C. chorus grown in southern Chile.

2. Material and Methods

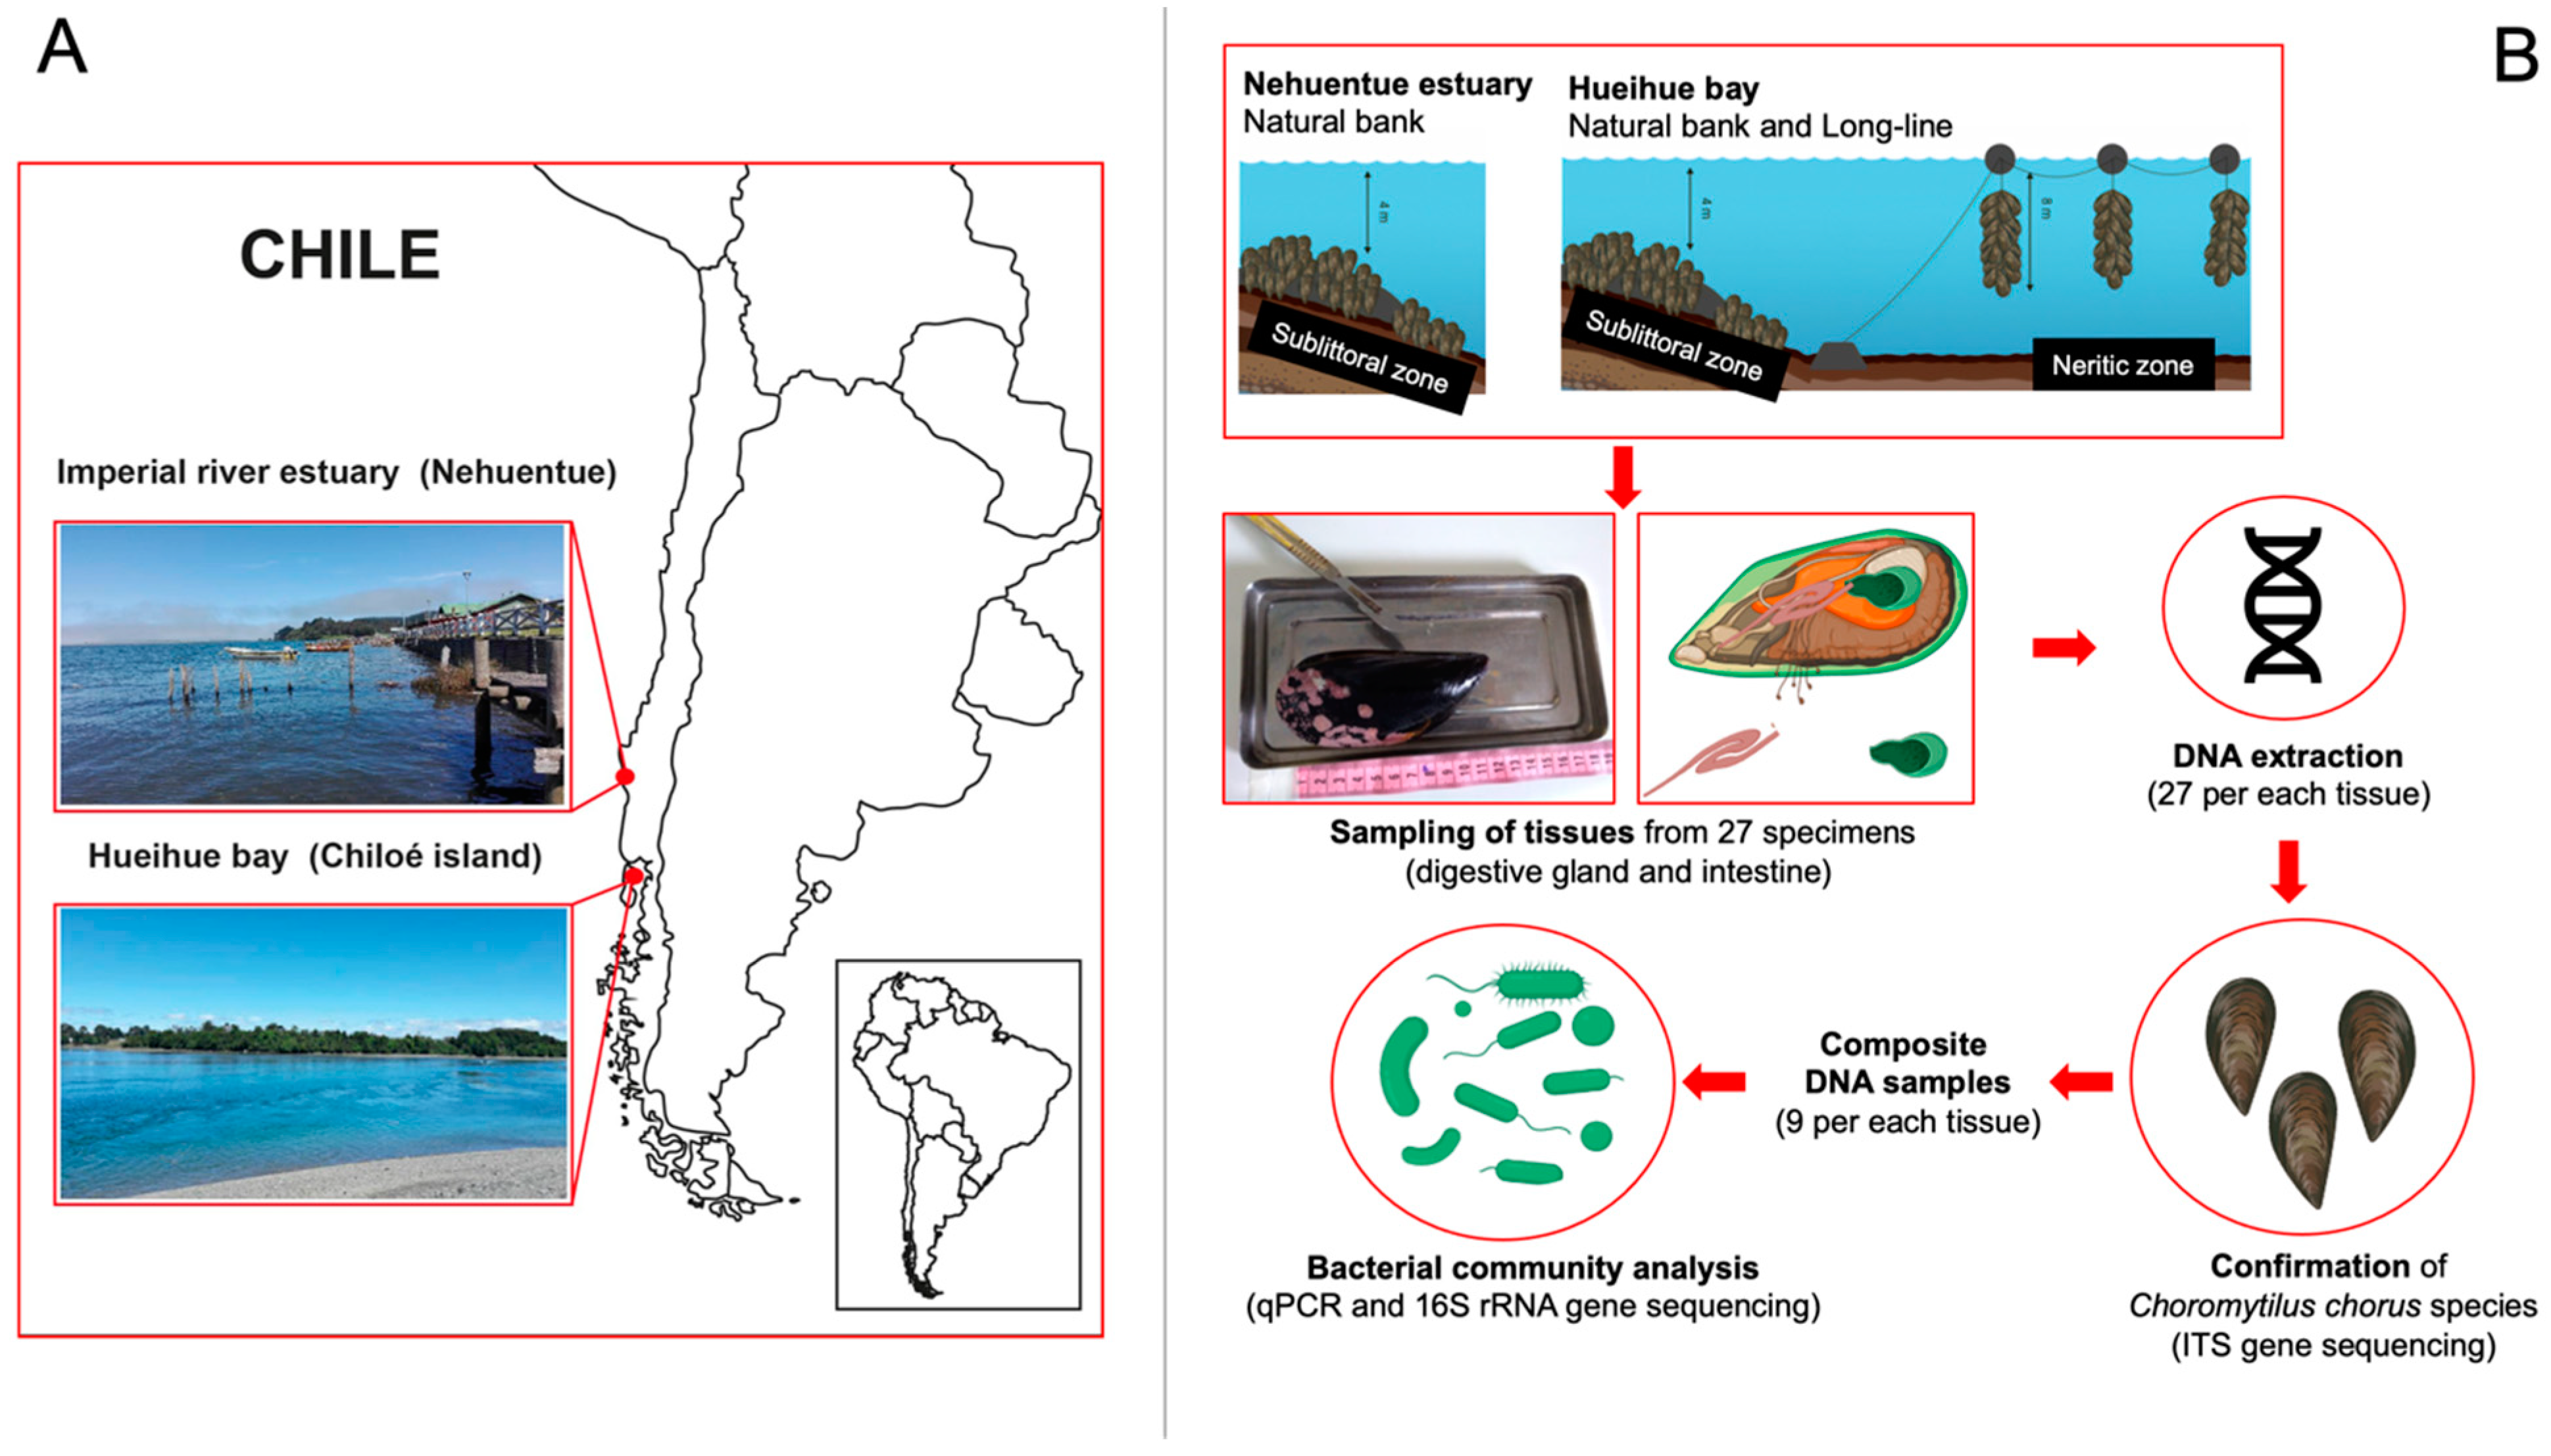
2.1. Collection of Specimens

Specimens of C. chorus were collected by diving from banks managed by Nehuentue artisanal fishermen and the Cholche Culture Company (CCC) and located in the Imperial River estuary (38°44′23″ S, 73°25′43″ W) and Hueihue Bay (41°53′46″ S, 73°31′00″ W) with average conductivities and temperatures of 23 mS cm−1 and 9 °C, and 33 mS cm−1 and 11 °C, respectively (Figure 1A). Specimens of C. chorus were collected from collectors in a long–line system managed by CCC in Hueihue Bay. After collection, the specimens were placed in a polystyrene box, immediately transported on ice, and processed at the Applied Microbial Ecology Laboratory of La Frontera University.

2.2. Samples

The experimental design is presented in Figure 1B. Twenty-seven specimens of C. chorus of similar size (average shell length, 12 cm) were randomly chosen from each location and thoroughly washed with sterile distilled water, and then the tissue surface was externally disinfected with 70% ethanol. The selected specimens were then aseptically dissected, taking tissue samples of ~0.02 g of digestive glands and intestinal tissues. Both tissues are commonly used as model tissues in environmental and biological studies of bivalves [28,29]. The samples were placed in sterile propylene tubes (2 mL) and stored at −20 °C until molecular analysis.

2.3. DNA Extraction

The commercial DNeasy PowerSoil kit (Qiagen, Inc., Germantown, MD, USA) was used to extract total DNA from each tissue sample (27 specimens × 2 tissues = 54 total DNA extracts), following the instructions of the manufacturer. The quantities of extracted DNAs were determined with a Qubit 4 fluorometer and Invitrogen Qubit assay kit (Thermo Fisher Scientific, Waltham, VT, USA). Extracts exhibiting an A260/A280 absorbance ratio ~1.8, as revealed by a microplate spectrophotometer (Multiskan GO, Thermo Fisher Scientific, Inc., Waltham, VT, USA), were selected for molecular analysis.

2.4. Collection of Choromytilus Chorus

As banks in coastal waters can be colonized by other mussel species (e.g., Mytilus chilensis and Aulacomya ater), 27 extracts from intestines were randomly chosen and used to confirm the collection of Choromytilus chorus by endpoint PCR and sequencing using a specific molecular marker for the internal transcribed spacer (ITS 1, 290 bp length) region of mollusks described by Meyer [30]. The primers 1FP (5′–GTT TCC GTA GCT GAA CCT GC–3′) and 2RP (5′–GTC TGA TCT GAG GTC–3′) were added (0.5 µL each of 8 µM work solutions) to a PCR mixture containing 5 µL of PCR buffer 5×, 3 µL of MgCl2 (25 mM), 2.5 µL of dNTPs (25 mM each), 0.13 µL of GoTaq Flexi DNA polymerase (5 U µL−1; Promega Co., Madison, WI, USA), 12.9 µL of free nuclease water and 0.5 µL of DNA extract (5 µM). PCR conditions were run with a hot start at 94 °C for 7 min, followed by 30 cycles of denaturation at 93 °C for 1 min, annealing at 45 °C for 1 min and extension at 72 °C for 2 min. A final extension was performed at 72 °C for 9 min. The amplified DNA fragments were run on 1× TBE 1.5% agarose gels and visualized with a UV transilluminator. Then, the amplified DNA fragments were sequenced in an ABI 3700 Sanger sequencer (Applied Biosystems Inc., Foster city, CA, USA). The sequences were cleaned up and trimmed by the Geneious program (Biomatters Ltd., Auckland, New Zealand; version Pro 5.0.3) and compared with those sequences deposited in GenBank from the National Center for Biotechnology Information (NCBI) using the nucleotide BLAST tool (https://blast.ncbi.nlm.nih.gov/Blast.cgi). The sequences were deposited in the NCBI GenBank database under accession numbers MT534397 to MT534420.
Additionally, a maximum likelihood phylogenetic tree was built and visualized using representative sequences of the Mytilidae family as a reference and the longest high-quality sequences (20 from 27) of each collected group using the MEGAX program https://www.megasoftware.net/, version 10.0.5 [31].
After verification of the collection of C. chorus specimens, DNA samples in triplicate were randomly chosen and used to formulate nine composite DNA samples per tissue and then used for the analysis of abundance and bacterial community as follows.

2.5. Bacterial Abundance in Digestive Gland and Intestinal Tissues

Loads of total bacteria in tissue samples were estimated by quantitative PCR (qPCR) using the universal primers 799f (5′–AAC MGG ATT AGA TAC CCK G–3′) and 1115r (5′–AGG GTT GCG CTC GTT G–3′) described by Shade et al. [32]. The PCR mixture was prepared as follows: 7.5 µL of PowerUp SYBR Green Master Mix 5× (Applied Biosystems Inc., USA), 2.4 µL each primer (0.32 µM), 1.7 µL of free nuclease water, and 1 µL of DNA extract (20 nM). In this stage, the nine extracts described above were grouped into three composed samples per mussel group and used as a DNA template for the following molecular analysis in this study. PCR conditions were as follows: an enzyme activation step at 95 °C for 10 min, followed by 40 cycles of 15 s at 95 °C and 1 min of annealing plus extension at 60 °C. Each composing sample was subjected in triplicate to PCRs in a StepOnePlusTM real–TIME PCR system (Applied Biosystems Inc., Foster City, CA, USA).

2.6. Bacterial Community in Digestive Gland and Intestinal Tissues

The bacterial community composition in DNA extracts from tissue samples was also determined using each composed sample by high–throughput sequencing of the V3~V4 hypervariable region of the 16S rRNA gene, as described by Zhang et al. [33]. Libraries of 16S rRNA genes were prepared by PCR using the primers 341–ad (5′–CCT ACG GGN GGC WGC AGA CAC TCT TTC CCT ACA CGA CGC TCT TCC GAT CT–3′) and 805–ad (5′–GAC TAC HVG GGA CTG GAG TTC AGA CGT GCT CTT CCG ATC T–3′) using Illumina MiSeq reagent kit v3 (Illumina Inc., San Diego, CA, USA) and sequenced with a MiSeq sequencer (Illumina Inc., San Diego, CA, USA) using barcoded primers and the dual indexing method [34]. PCR conditions were run with a hot start of 95 °C for 2 min, followed by 1 cycle at 95 °C for 30 s, 35 cycles of 55 °C for 30 s, 1 cycle at 72 °C for 1 min and a final step of extension of 1 cycle at 75 °C for 5 min. Before sequencing, the quality of libraries was verified with an Agilent TapeStation 4150 (Agilent Technologies Inc., Santa Clara, CA, USA).

2.7. Bioinformatics and Statistical Analyses

The sequences were analyzed using QIIME2 (https://qiime2.org/) [35] built-in applications, as described below. A quality filter step was included using the DADA2 algorithm [36], where residual PhiX reads were removed, paired-end sequences were joined together using a quality-aware correcting model, and chimeric sequences were removed. The taxonomic assignment was determined using a model created with a Naïve Bayer classifier trained with V3~V4 regions of the 16S rRNA genes deposited in the green-genes v13.8 database [37]. Before downstream analyses, OTU tables were filtered to remove nonmicrobiota (e.g., chloroplast and mitochondria) sequences.
For statistical analyses, the sequence data were rarefied to a sampling depth of 11,000, and alpha diversity measurements were calculated as the Shannon Index, Inverse Simpson Index, and Pielou’s Evenness Index, and richness was as reported as operational taxonomic units (OTU) and Faith’s Phylogenetic Diversity. The beta diversity was further explored using nonmetric multidimensional scaling using the Bray-Curtis dissimilarity matrix to visualize the broad trends in bacterial communities, and the differences among the sites were evaluated using permutational multivariate analysis of variance (PERMANOVA) with 999 random permutations [38]. Statistical analyses were performed using functions from the vegan v2.5-6 package [39] contained in the R environment, and visualization was performed using the ggplot2 package in R, whereas the VennDiagram package and heatmap were used to identify shared OTUs and the closeness of bacterial communities between locations. Microbial differences were further explored using linear discriminant analysis effect size (LEfSe) [40], which was used to identify biologically relevant features for any group performing Kruskal-Wallis followed by a Wilcoxon Rank-Sum test for pairwise comparison, with a p-value of 0.05 as the cutoff. The results were then used to construct a linear discriminant model in which a log10 LDA score of 2.0 was set as a threshold to determine discriminant features. Additionally, to predict the potential function of the bacterial community, the FAPROTAX (https://pages.uoregon.edu/slouca/LoucaLab/archive/FAPROTAX/lib/php/index.php) database and software, which estimate putative metabolic or other ecologically relevant functions, were used with the current literature on cultured strains, as described by Louca et al. [41].
The raw data were deposited in the Sequence Read Archive (SRA) of NCBI under the BioProject accession number PRJNA638916.

3. Results

3.1. Collection of Choromytilus Chorus

The use of primer sets 1FP and 2RP and the sequencing of amplified DNA fragments allowed for confirmation of the collected specimens as members of the C. chorus species. The phylogenetic affiliation to C. chorus can be also observed in the three built with amplicons sequences and representative Mytilidae family deposited in GenBank (in Supplementary Material Figure S1).

3.2. Bacterial Abundances in Digestive Gland and Intestinal Tissues

Based on the slope of the DNA standard curve, the amplification efficiency averaged 108% (E = 10−1/−3.134 − 1) by qPCR. The qPCR did not show significant differences (p ≤ 0.05) in samples of digestive glands between the two locations, with values ranging from 1.3 × 10³ to 1.9 × 10³ of 16 rRNA gene copies per g−1 of tissue (Table 1). In contrast, higher abundances (but not significant; p ≤ 0.05) were observed in intestinal tissues of specimens collected from Nehuentue estuary (5.25 ± 2.49 × 10⁵ of 16 rRNA gene copies per g−1 of tissue) than in those collected from Hueihue Bay (1.85 ± 5.61 × 10³ and 6.82 ± 1.52 × 10⁴ of 16 rRNA gene copies per g−1 of tissue). Similarly, higher abundances (but not significant; p ≤ 0.05) were also observed in intestinal tissues than in the digestive gland tissues from the natural bank.

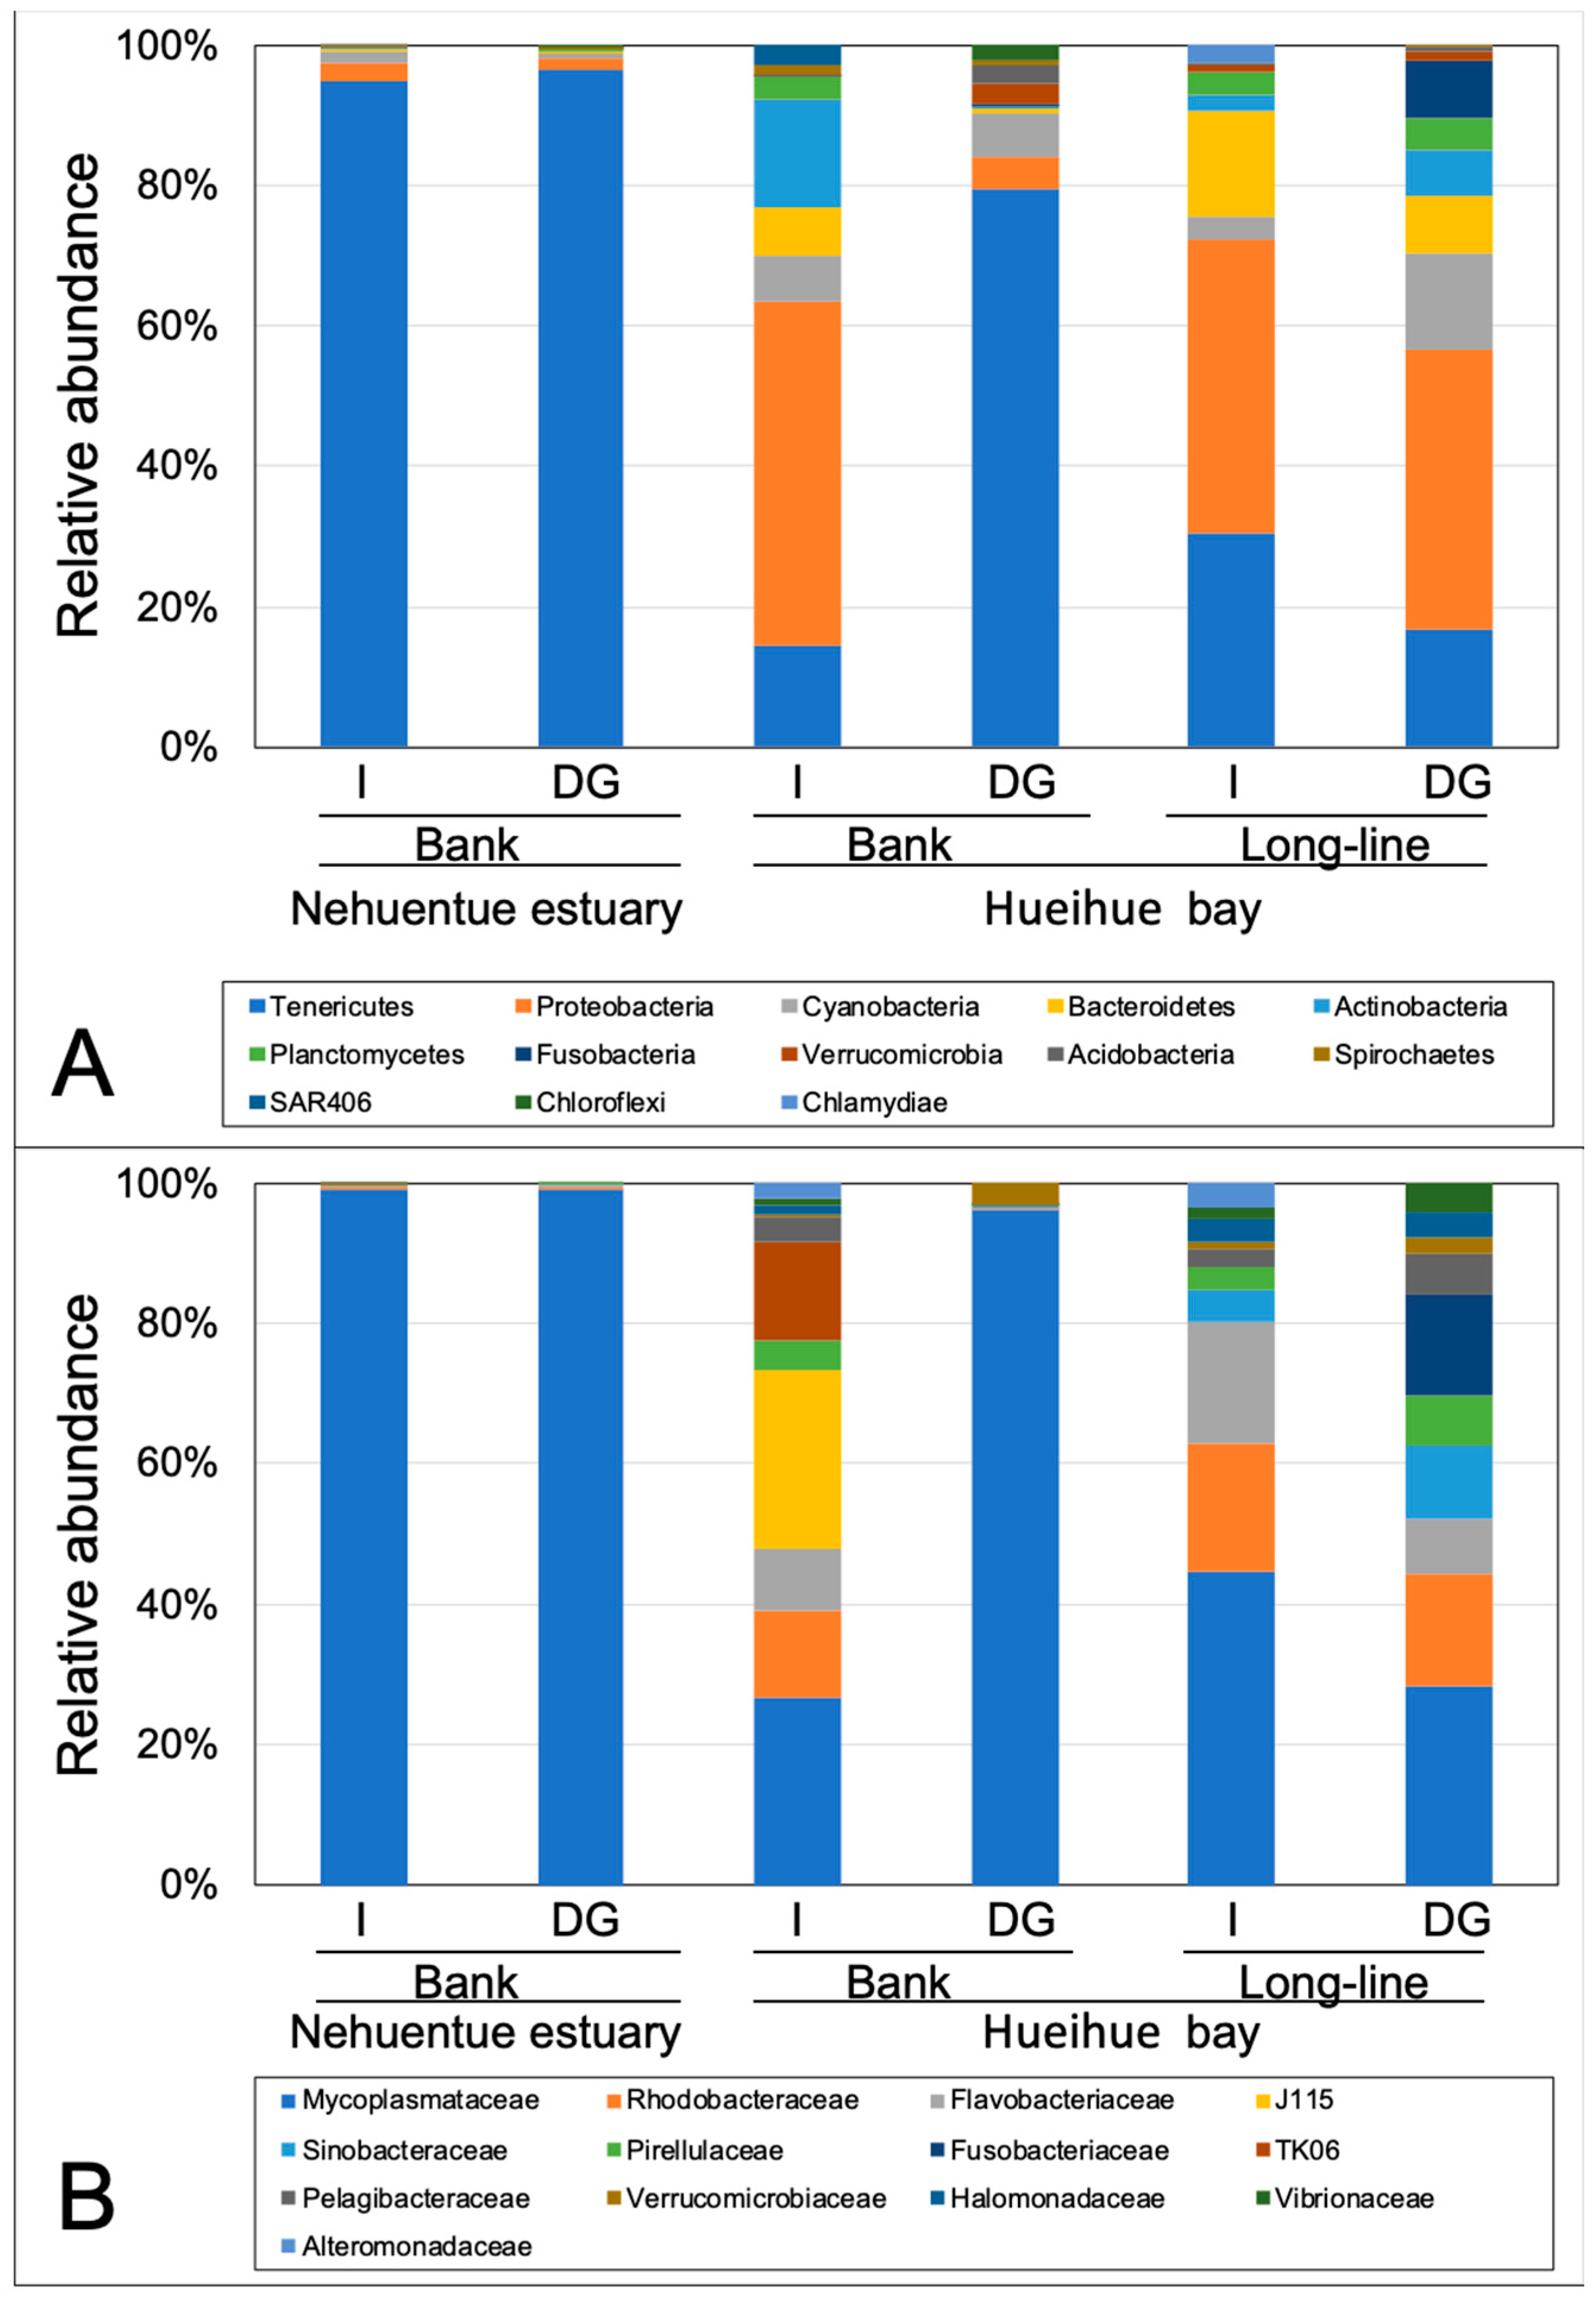
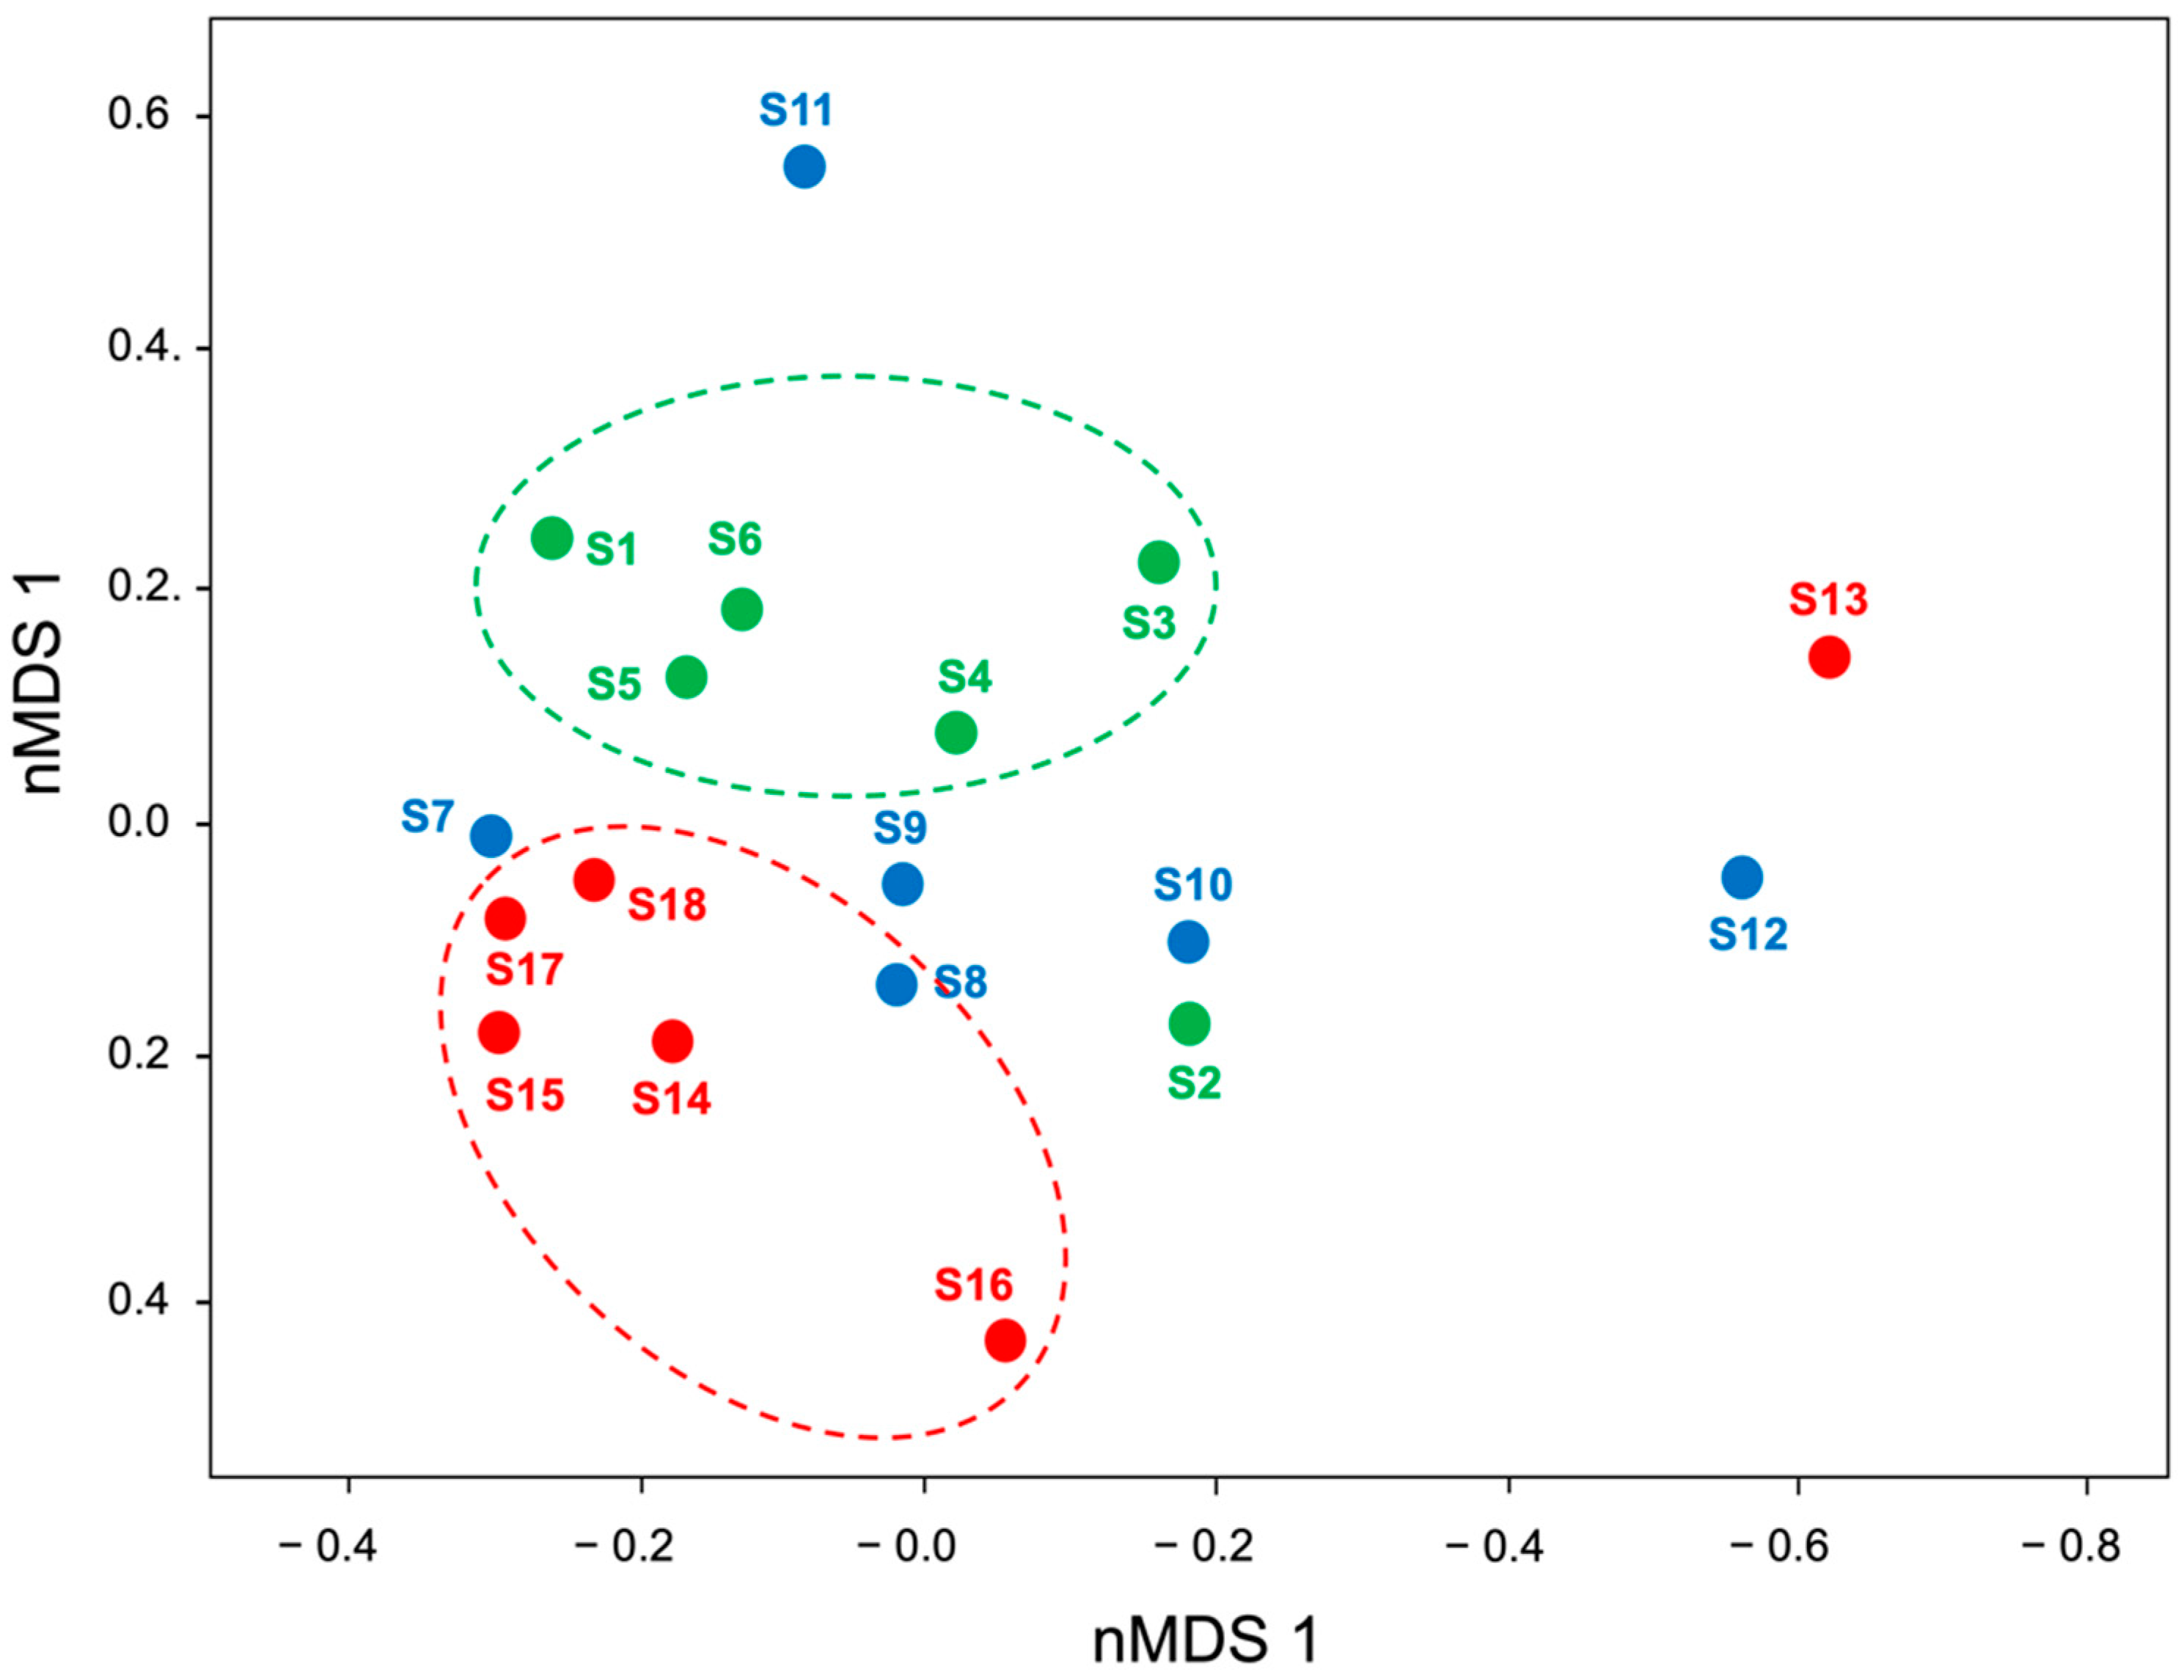
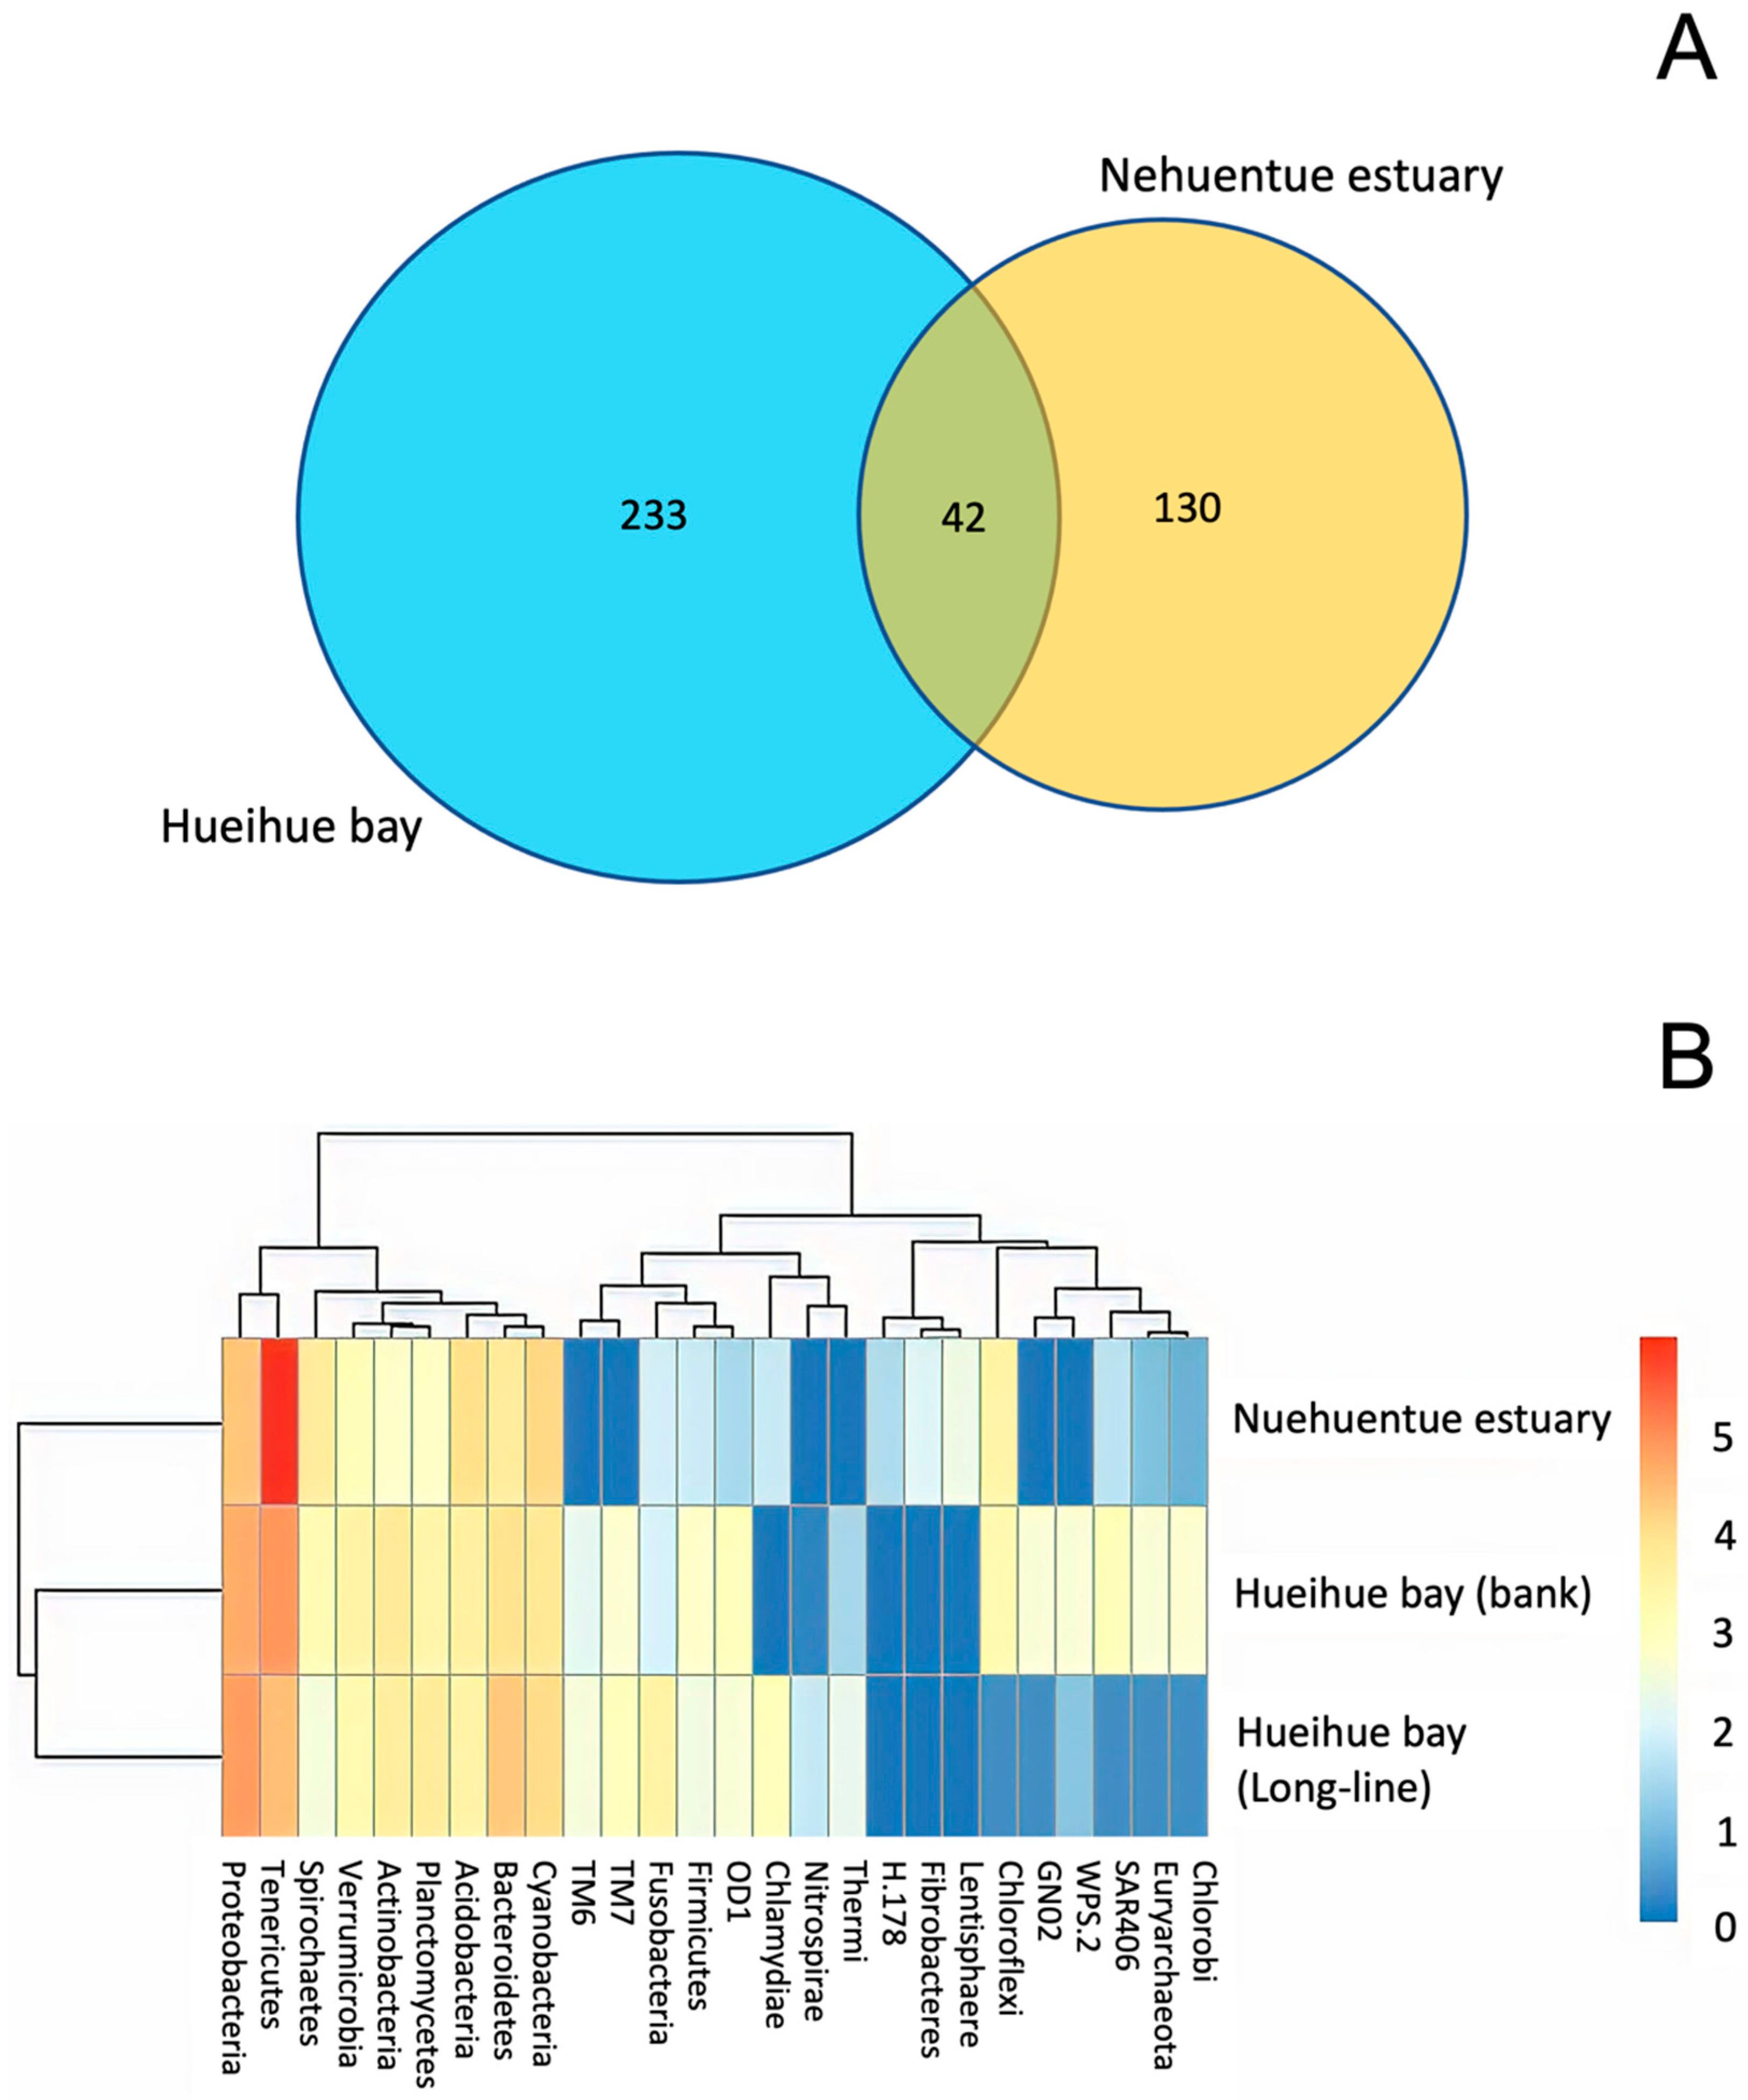
3.3. Bacterial Community in Digestive Gland and Intestinal Tissues

A summary of the Illumina sequencing data is shown in Table 2. The taxonomic assignment of sequences revealed that the bacterial communities in C. chorus specimens grown in the Nehuentue estuary were dominated by members of the Tenericutes phylum, with relative abundances of 91.1% and 95.7% for intestinal and digestive gland tissue samples, respectively (Figure 2A). The Tenericutes phylum was also the most abundant taxon (from 14% to 78%) in tissues of C. chorus specimens grown in Hueihue Bay, followed by the Proteobacteria phylum, with relative abundances ranging from 4.5% to 47.4% (Figure 2A). Other, less abundant taxa in tissues of C. chorus specimens from Hueihue Bay included Cyanobacteria (3.1% to 13.6%), Bacteroidetes (0.9% to 14.2%), Actinobacteria (0.3% to 14.9%), and Planctomycetes (0.1% to 4.6%) phyla. At the family level, members of Mycoplasmataceae were dominant in the bacterial communities in C. chorus specimens, particularly in those grown in the Nehuentue estuary, with values of 94.1% to 95.7% for the intestinal and digestive gland tissues (Figure 2B). In specimens collected from Hueihue Bay, other families with high relative abundances were Rhodobacteraceae (0.1% to 11.6%) and Flavobacteriaceae (0.13% to 11.1%) (Figure 2B). Interestingly, samples of intestinal tissue from specimens collected from Hueihue Bay also showed high abundances of members belonging to the J115 (13.5%) and TK06 (7.3%) groups at the family level.
In relation to alpha diversity, although the analysis did not show significant differences (p ≤ 0.05), higher numbers of OTUs were observed in tissue samples of C. chorus specimens from the Nehuentue Estuary than in those of C. chorus specimens from Hueihue Bay (Table 3). Coincidently, higher values of Faith’s Phylogenetic Diversity were observed in tissue samples from the Nehuentue Estuary than in those from Hueihue Bay (Table 3). Interestingly, the highest values of observed OTUs and Faith’s Phylogenetic Diversity were registered in intestinal tissue samples from the Nehuentue estuary, while the lowest values were registered in intestinal tissue samples from Hueihue Bay. In contrast, higher values of the Shannon Index, Inverse Simpson Index, and Pielou’s Evenness Index were determined for tissue samples of specimens from Hueihue Bay than in those collected from the Nehuentue Estuary (Table 2). It is also interesting that significantly (p ≤ 0.05) lower values of the Inverse Simpson Index and Pielou’s Evenness Index were registered in digestive gland samples from the Nehuentue Estuary than in the digestive gland samples from Hueihue Bay.
In relation to differences in the bacterial communities between tissue samples determined by beta diversity analysis, the analysis of nMDS revealed that tissue samples from specimens collected in the Nehuentue Estuary grouped separately with respect to those from Hueihue Bay, particularly samples from specimens collected in the long–line system (Figure 3). Specimens collected from the natural bank of Hueihue Bay showed a wider dispersion. The differences in the bacterial community between both locations were also confirmed by a Venn diagram, where most (89.6%) of OTUs (233 and 130 for Hueihue and Nehuentue, respectively) were not shared (Figure 4A). The heatmap analysis (Figure 4B) also showed differences between specimens collected from Nehuentue estuary with respect to those from Hueihue Bay.
The LEfSe analysis suggested Mollicutes classes (Tenericutes phylum) as key phylotypes in bacterial communities for tissues from the Nehuentue estuary, whereas the Actynomycetales order (Actinobacteria phylum) was a key phylotype in bacterial communities for tissues from Hueihue Bay (Figure 5A).
The differences in the microbiota present in tissue samples from C. chorus specimens collected from the Nehuentue estuary and Hueihue Bay were also observed when their functionality was analyzed and predicted by FAPROTAX; where a higher variety of functions were predicted in tissue samples from Hueihue Bay, particularly those from the long–line system, than in tissue samples from the Nehuentue estuary, where >98% of functions were categorized as heterotrophy and aerobic heterotrophy (Figure 5B). Relatively high abundances of sequences involved in heterotrophy and aerobic heterotrophy were also assigned in samples from Hueihue Bay, with values >60% and <97%. It is noteworthy that a relatively high variety of functions were predicted in samples from specimens collected in the long–line system, highlighting sequences involved in intracellular parasites and the degradation of pollutants, such as hydrocarbons, aromatic compounds, and aliphatic nonmethane hydrocarbons. Other functions found in the long–line system included nitrate reduction, fermentation, methylotrophy, phototrophy, photoautotrophy, and others.

4. Discussion

The verification of C. chorus species in collected specimens provided an identity from 99% to 100% with the ITS sequences of C. chorus deposited in GenBank by Santa Clara et al. [42]. Studies on populations of Mytilus of Chilean coasts are scarce. In this context, our study contributes a number of sequences from two specific unstudied geographical areas, characterizing the distribution of C. chorus along Chilean coasts with novel data as recommended by Aguilera-Muñoz et al. [43].
In relation to the bacterial abundances in the sampled tissues, qPCR revealed values ranging from 103 to 105 copies of 16 rRNA genes per g−1 of tissue. To our knowledge, and surprisingly and surprise, bacterial abundances in the digestive glands, intestines, digested contents, and feces of bivalves in aquatic environments thus far have not been reported using qPCR. However, using the plate counting method, similar abundances were observed in the tissues and hemolymph of the mussel Modiolus modiolus in Norway, with values of 2.9 × 10⁴ and 2.6 × 10⁴ CFU g−1 of tissue, respectively [44]. Our results are also similar to those found in the oyster Crassostrea Gigas grown in the Yellow Sea (China), with values from 102 to 105 CFU g−1 of tissue [45]. Compared with our data, those studies on bivalves have also shown significantly higher abundances in tissues of the clam Batissa Violacea (India) with values of 2.5 × 10⁶ CFU g−1 of tissue [46]. Higher values were also found in tissues of the mussel Perna Viridis from Port Dickson (Malaysia), with values reaching 8 × 10⁸ CFU g−1 [47].
Interestingly, higher abundances of bacteria were observed in the intestines than in the digestive glands. It is known that the microbiota in the intestines of marine organisms participates in diverse essential functions for the host (e.g., releasing nutrients by organic matter degradation); therefore, a higher abundance and activity of bacteria in the intestine than in the digestive glands was expected, as has been reported in other studies of mussels [48,49].
The use of high throughput sequencing using 16S rRNA as a target gene revealed that the Tenericutes phylum was the dominant taxon in both digestive glands and intestinal tissues, particularly in specimens collected from the Nehuentue estuary. Members of the Tenericutes phylum are commonly reported as abundant taxa in marine mollusks, including bivalves [50,51,52]. Members of the Tenericutes, Proteobacteria, and Bacteroidetes phyla were found to be dominant bacterial groups in the intestine of Mytilus Edulis collected from aquaculture facilities in Long Island Sound (Connecticut) on the northeastern coast of the USA [53]. Similarly, mussels from small lakes on the island of Maratua (Indonesia) were dominated by bacteria belonging to the Firmicutes and Tenericutes phyla [54]. Studies have also observed that despite changing environmental conditions and seasonality, these phyla can be stably maintained in tissues, postulating Tenericutes as stable taxa of the microbiota in digestive glands and intestines of bivalves [25,52]. In contrast, our results differ from those observed in tissues of M. Galloprovincialis in specimens collected from a long–line system in a cooperative farm located in Cesenatico city (Italy), where Firmicutes was the dominant phylum, which was comprised primarily of the Ruminococcaceae and Lachnospiraceae families [19].
In relation to taxa at the family level, our results agree with those observed in tissues of the mussel Brachidontes sp. grown in marine lakes in Indonesia, where the Mycoplasmataceae and Rhodobacteraceae families were the most abundant taxa [54]. Similarly, in the digestive glands of the oyster (Crassostrea Gigas) and clam (Ruditapes philippinarum) from France, the Mycoplasmaceae, Desulfobacteraceae, and Rhodobacteraceae families were reported as the most abundant taxa by Offret et al. [55]. Interestingly, byssus gland and hemolymph tissues of the oyster Pinctada margaritifera from lagoons of Takapoto atoll (French Polynesia), Rhodobacteraceae, and Flavo-bacteriaceae families were found as abundant taxa, but members of Myco-plasmataceae were not found [56].
Although significant differences (p ≤ 0.05) were not observed in all statistical parameters estimated in this study, in general terms, the analysis of alpha diversity showed higher observed OTUs and phylogenetic diversity in tissue samples from the Nehuentue estuary than in those from Hueihue Bay, whereas higher values of diversity (Shannon and Inverse Simpson indexes) and Pielou’s Evenness Index were found in tissue samples from Hueihue Bay. In this context, our values of the Simpson Index, Shannon Index, and observed OTUs were higher than those reported in samples of stomach and intestine of Mytilus edulis from Barnegat Bay (New Jersey, USA) [57]. Similarly, values of OTUs, Simpson Index, and Pielou’s Evenness in intestine and stomach tissues of oysters from coastal waters of Louisiana (USA) were also lower than those observed in our study [58]. In contrast, OTU values of tissues in different oysters from the Gulf of California in Mexico (intestines) [59] and the Atlantic beach of North Carolina, USA (digestive glands) [60] were higher than the values obtained in this study. The same tendency was observed by Pierce and Ward [53], where higher values of the Shannon Index and OTUs were found in the intestines of Mytilus edulis from Long Island Sound, New York, NY, USA.
The differences in the bacterial communities between the two locations were visualized by nMDS analysis, where tissue samples from the Nehuentue estuary clustered separately from those collected from Hueihue Bay, particularly in samples taken from the long–line system. These differences may be influenced by the shared and unique OTUs, as revealed by Venn diagram analysis, where a low proportion of OTUs were shared among both locations. This difference between the tissues of specimens from the two locations was also confirmed by heatmap analysis. Differences in the compositions and relative abundances of higher taxa in bivalve microbiota have been reported between Indonesian marine lakes by Cleary et al. [54]; however, mussel bacterial communities between marine lakes and coastal mangroves were not so different, although the environments are very different. Studies have also observed differences between the composition of the bacterial community in tissues at different stages of the oyster life cycle, but variations in the bacterial communities in oysters grown under the same conditions were not found [59]. Similarly, significant differences in diversity and evenness of OTUs between wild and hatchery mussels were not found by Aceves et al. [50], although species composition varied significantly.
Our analysis also suggested the occurrence of microbial indicators in tissue samples of C. chorus, where members of the Mollicutes classes (Tenericutes phylum) were predicted as key phylotypes in tissues from the Nehuentue estuary, whereas the Actynomycetales order (Actinobacteria phylum) was a key phylotype in tissues from Hueihue Bay. Key phylotypes or keystone taxa act as drivers of the structure and functioning of the microbiome and are likely essential for organism fitness and ecosystem functioning [61]. To our knowledge, few studies have described or suggested key taxa in the microbiota of bivalve tissues, particularly in Chile. In this sense, Vibrio and Arcobacter genera have been suggested as biomarkers in gut tissues of M. galloprovincialis grown under hatchery conditions (Dalia, China) and exposed to temperature stress (21–27 °C) for 7 days [62]. Members of the Tenericutes phylum and Mollicutes classes, particularly Acholeplasma [63], Like–Mycoplasma [50] and Mycoplasma genera, are commonly reported as components of bivalve microbiota. An increase in Mycoplasmatales order was also observed in the digestive gland and gut tissues of bivalves from the Bay of Brest (France) after the depuration process [55]. Members of the Actynomycetales order have also been found in connective tissues that round the digestive tract of mollusks [13].
In relation to the predicted functions of bacteria in the digestive glands and intestines of C. chorus, our results revealed that most bacterial groups are heterotrophs and mainly aerobic. Photoautotrophic functions have been reported to be highly abundant in the intestines of clams and were dominated by cyanobacteria, the food source of these clams [64,65]. Heterotrophic bacteria have been traditionally isolated and studied as members of the bivalve microbiota and participate in essential functions for the host, such as nutrient degradation, enzyme activities, and biological metabolism [66,67,68]. Interestingly, functions related to intracellular parasites and pollutant degradation (such as hydrocarbons, aromatic compounds, and aliphatic nonmethane hydrocarbons) were predicted in samples from specimens collected in a long–line system in Hueihue Bay. Hueihue Bay is located in the Chiloe Island archipelago, which is an area with high industrial activity focused on intensive aquaculture (salmon and bivalve industry); therefore, the occurrence of pollutant-degrading bacteria in the microbiota of C. chorus from Hueihue Bay might be related to greater urbanization and anthropogenic influence in this region that in the Nehuentue estuary, which is less urbanized and where the main activities are related to tourism and artisanal fisheries. In addition, other functions were inferred, such as nitrate reduction, fermentation, phototrophy, and photoautotrophy, which have also been reported in other bivalves [69,70]. However, more studies on the roles of microbiota in hosts and in maintaining water quality in both locations are required to confirm this statement. Further studies should also be conducted to understand the functional significance of bacteria in the digestive systems of the mussels, the relevance of bivalves as reservoirs of human pathogens (e.g., V. vulnificus) in Chilean estuarine and coastal ecosystems, and the identification of factors that drive the differences between the bacterial communities in bivalves at the two studied sites.
Finally, it is necessary to mention that our study represents the first approach to elucidate the microbiota associated with C. chorus tissues; however, this was based on at a single seasonal sampling point, and therefore, our results should be considered with caution regarding the generality of the indicators and functionalities of the bacterial communities associated with the C. chorus, particularly with respect to those specimens in other geographical locations and other seasons. Further studies of the influence of environment, location, and seasonality are required to confirm or validate the results found in this study.

Supplementary Materials

The following are available online at https://0-www-mdpi-com.brum.beds.ac.uk/article/10.3390/d13050209/s1, Figure S1: Maximum Likelihood phylogenetic tree built with ITS sequences from the collected mussel tissues samples and representative members of Mytilidae family deposited in GenBank database from NCBI. The accession number in GenBank are presented within parentheses. The bar represents 20% divergence and a bootstrap of 1000 repetitions was used. In green: tissue samples of Choromytilus chorus specimens collected from natural bank in Nehuentue Estuary; In blue: tissue samples of C. chorus specimens collected from nat-ural bank in Hueihue Bay; In red: tissue samples of C. chorus specimens collected from long–line system in Hueihue Bay.

Author Contributions

Conceptualization, T.V., J.J.A. and M.A.J.; formal analysis, T.V., J.I.R., J.J.A. and M.A.J.; data curation, G.L.; investigation, T.V., J.I.R., G.L., J.J.A., M.C., N.G.I., M.A., K.A., S.F., K.Y., F.M. and M.A.J.; writing—original draft preparation, T.V., J.J.A. and M.A.J.; writing—review and editing, T.V., J.I.R., J.J.A., M.C., S.F., K.Y., F.M. and M.A.J.; funding acquisition, F.M. and M.A.J. All authors have read and agreed to the published version of the manuscript.

Funding

This study was funded by the Science and Technology Research Partnership for Sustainable Development (SATREPS; JST/JICA, Japan) project code JPMJSA1705 (to J.J.A., J.I.R., G.L., S.F., K.Y., F.M. and M.A.J.), The National Fund for Scientific and Technological Development (FONDECYT) project no. 1201386 (to M.A.J. and J.J.A.), FONDECYT postdoc fellowship no. 3180198 (to M.A.C.), Vicerrectoría de Investigación y Postgrado, Universidad de La Frontera (to G.L.), and the “Apoyo a Profesores Patrocinantes de Alumnos de Pre y Postgrado” program, code DI19-2016, Vicerrectoría de Investigación y Postgrado, Universidad de La Frontera (to T.V. and K.A.).

Institutional Review Board Statement

Not applicable.

Informed Consent Statement

Not applicable.

Data Availability Statement

All sequences reported in the figures are available in NCBI GenBank database (http://ncbi.nlm.nih.gov).

Acknowledgments

The authors would like to thank the Editor and three anonymous reviewers for criticism reading to improve the quality of the manuscript. The authors also thank to the Andrew Ogram (Department of Soil and Water Sciences, University of Florida, USA) for revision and editing of English language of the manuscript. In addition, the authors would like to acknowledge Luis Torralbo from “Instituto de Agroindustria” from Universidad de La Frontera and Guillermo Altamirano from “Sindicato de Mariscadores de Nehuentue” for their help during the collection and transport of C. chorus specimens from the Nehuentue estuary. The authors would also like to thank Javier Aros from “Programa Estratégico Regional Industria de La Mitilicultura” and Francisco Dubreuil from “Fundación Chinquihue” for their help during the collection and transport of C. chorus specimens from Hueihue Bay.

Conflicts of Interest

Authors declare no conflict of interest.

References

  1. Wijsman, J.W.M.; Troost, K.; Fang, J.; Roncarati, A. Global production of marine bivalves. Trends and challenges. In Goods and Services of Marine Bivalves; Smaal, A., Ferreira, J., Grant, J., Petersen, J., Strand, Ø., Eds.; Springer: Cham, Switzerland, 2019; Volume 2, pp. 7–26. [Google Scholar] [CrossRef] [Green Version]
  2. FAO. El estado mundial de la pesca y la acuicultura. In Food and Agriculture Organization of the United Nations; FAO: Rome, Italy, 2018; Available online: http://www.fao.org/3/I9540ES/i9540es.pdf (accessed on 12 May 2021).
  3. Reid, D.G.; Osorio, C. The shallow-water marine mollusca of the estero elefantes and laguna. san rafael, southern Chile. Bull. Br. Mus. Nat. Hist. London 2000, 66, 109–146. Available online: https://www.biodiversitylibrary.org/page/41005314#page/3/mode/1up (accessed on 12 May 2021).
  4. Navarro, J.M. The effects of salinity on the physiological ecology of Choromytilus chorus (Molina, 1782) (Bivalvia: Mytilidae). J. Exp. Mar. Biol. Ecol. 1988, 122, 19–33. [Google Scholar] [CrossRef]
  5. Campos, B.; Landaeta, M.F. Moluscos planctónicos entre el fiordo Reloncaví y el golfo Corcovado, sur de Chile: Ocurrencia, distribución y abundancia en invierno. Rev. Biol. Mar. Oceanogr. 2016, 51, 527–539. [Google Scholar] [CrossRef] [Green Version]
  6. Hazen, T.H.; Pan, L.; Gu, J.-D.; Sobecky, P.A. The contribution of mobile genetic elements to the evolution and ecology of Vibrios. FEMS Microbiol. Ecol. 2010, 74, 485–499. [Google Scholar] [CrossRef] [Green Version]
  7. La Valley, K.J.; Jones, S.; Gómez-Chiarri, M.; DeAlteris, J.; Rice, M. Bacterial Community Profiling of the Eastern oyster (Crassostrea virginica): Comparison of Culture-Dependent and Culture-Independent Outcomes. J. Shellfish. Res. 2009, 28, 827–835. [Google Scholar] [CrossRef] [Green Version]
  8. Pierce, M.L.; Ward, J.E.; Holohan, B.A.; Zhao, X.; Hicks, R.E. The influence of site and season on the gut and pallial fluid microbial communities of the eastern oyster, Crassostrea virginica (Bivalvia, Ostreidae): Community-level physiological profiling and genetic structure. Hydrobiol. 2016, 765, 97–113. [Google Scholar] [CrossRef]
  9. Rubiolo, J.A.; Botana, L.M.; Martínez, P. Insights into mussel microbiome. Microb. Communities Aquac. Ecosyst. 2019, 3, 95–120. [Google Scholar] [CrossRef]
  10. Austin, B. The bacterial microflora of fish, revised. Sci. World J. 2006, 6, 931–945. [Google Scholar] [CrossRef] [Green Version]
  11. Sweet, M.J.; Bulling, M.T. On the importance of the microbiome and pathobiome in coral health and disease. Front. Mar. Sci. 2017, 4, 1–11. [Google Scholar] [CrossRef] [Green Version]
  12. Cruz-Flores, R.; Cáceres-Martínez, J. Rickettsiales-like organisms in bivalves and marine gastropods: A review. Rev. Aquac. 2020, 12, 1–17. [Google Scholar] [CrossRef]
  13. Carella, F.; Carrasco, N.; Andree, K.B.; Lacuesta, B.; Furones, D.; De Vico, G. Nocardiosis in Mediterranean bivalves: First detection of Nocardia crassostreae in a new host Mytilus galloprovincialis and in Ostrea edulis from the gulf of Naples (Italy). J. Invertebr. Pathol. 2013, 114, 324–328. [Google Scholar] [CrossRef] [Green Version]
  14. Morris, J.J.G.; Acheson, D. Cholera and other types of vibriosis: A story of human pandemics and oysters on the half shell. Clin. Infect. Dis. 2003, 37, 272–280. [Google Scholar] [CrossRef]
  15. Travers, M.-A.; Miller, K.B.; Roque, A.; Friedman, C.S. Bacterial diseases in marine bivalves. J. Invertebr. Pathol. 2015, 131, 11–31. [Google Scholar] [CrossRef] [Green Version]
  16. Clerissi, C.; De Lorgeril, J.; Petton, B.; Lucasson, A.; Escoubas, J.-M.; Gueguen, Y.; Dégremont, L.; Mitta, G.; Toulza, E. Microbiota composition and evenness predict survival rate of oysters confronted to pacific oyster mortality syndrome. Front. Microbiol. 2020, 11, 311. [Google Scholar] [CrossRef] [Green Version]
  17. Milan, M.; Smits, M.; Rovere, G.D.; Iori, S.; Zampieri, A.; Carraro, L.; Martino, C.; Papetti, C.; Ianni, A.; Ferri, N.; et al. Host-microbiota interactions shed light on mortality events in the striped venus clam Chamelea gallina. Mol. Ecol. 2019, 28, 4486–4499. [Google Scholar] [CrossRef] [PubMed]
  18. Lasa, A.; Di Cesare, A.; Tassistro, G.; Borello, A.; Gualdi, S.; Furones, D.; Carrasco, N.; Cheslett, D.; Brechon, A.; Paillard, C.; et al. Dynamics of the Pacific oyster pathobiota during mortality episodes in Europe assessed by 16S rRNA gene profiling and a new target enrichment next-generation sequencing strategy. Environ. Microbiol. 2019, 21, 4548–4562. [Google Scholar] [CrossRef] [PubMed] [Green Version]
  19. Musella, M.; Wathsala, R.; Tavella, T.; Rampelli, S.; Barone, M.; Palladino, G.; Biagi, E.; Brigidi, P.; Turroni, S.; Franzellitti, S.; et al. Tissue-scale microbiota of the Mediterranean mussel (Mytilus galloprovincialis) and its relationship with the environment. Sci. Total. Environ. 2020, 717, 137209. [Google Scholar] [CrossRef]
  20. De La Fuente, M.; Miranda, C.; Faundez, V. Bacteriología asociada al cultivo de moluscos en Chile: Avances y perspectivas. Rev. Biol. Mar. Oceanogr. 2015, 50, 1–12. [Google Scholar] [CrossRef]
  21. Tello, M.; Valdes, N.; Vargas, R.; Rojas, J.; Parra, M.; Gajardo, M.; Gonzalez, A. Metagenomics, Basics, Methods and Applications; IntechOpen: Santiago, Chile, 2019; Volume 8, pp. 286–302. [Google Scholar] [CrossRef]
  22. Jorquera, M.; Silva, F.; Riquelme, C. Bacteria in the culture of the scallop Argopecten purpuratus (Lamarck, 1819). Aquac. Int. 2001, 9, 285–303. [Google Scholar] [CrossRef]
  23. Rojas, R.; Miranda, C.D.; Opazo, R.; Romero, J. Characterization and pathogenicity of Vibrio splendidus strains associated with massive mortalities of commercial hatchery-reared larvae of scallop Argopecten purpuratus (Lamarck, 1819). J. Invertebr. Pathol. 2015, 124, 61–69. [Google Scholar] [CrossRef]
  24. Romero, J.; Gonzalez, N.; Espejo, R. Marine Pseudoalteromonas sp. Composes most of the bacterial population developed in oysters spoiled during storage. J. Food Sci. 2002, 67, 2300–2303. [Google Scholar] [CrossRef]
  25. Trabal, N.; Mazón-Suástegui, J.M.; Vázquez-Juárez, R.; Asencio-Valle, F.; Morales-Bojórquez, E.; Romero, J. Molecular analysis of bacterial microbiota associated with oysters (Crassostrea gigas and Crassostrea corteziensis) in different growth phases at two cultivation sites. Microb. Ecol. 2012, 64, 555–569. [Google Scholar] [CrossRef]
  26. Aranda, C.P.; Yevenes, M.; Rodriguez-Benito, C.; Godoy, F.A.; Ruiz, M.; Cachicas, V. Distribution and growth of Vibrio parahaemolyticus in Southern Chilean clams (Venus antiqua) and Blue Mussels (Mytilus chilensis). Foodborne Pathog. Dis. 2015, 12, 1–7. [Google Scholar] [CrossRef]
  27. Larenas, J.; Perez, M.; Moraleda, C.; Godoy, M.; Larenas, C.; Acuña-Retamar, M. In vitro adhesion and infectiveness of Piscirickettsia salmonis on mussel shells Mytilus chilensis. Bull. Eur. Ass. Fish Pathol. 2019, 39, 114–121. Available online: https://eafp.org/download/2019-volume39/issue_3/39-3-114-larenas.pdf (accessed on 12 May 2021).
  28. Cremonte, F.; Puebla, C.; Tilleria, J.; Videla, V. Histopathological survey of the mussel Mytilus chilensis (Mytilidae) and the clam gari solida (psammobiidae) from southern Chile. Lat. Am. J. Aquat. Res. 2015, 43, 248–254. [Google Scholar] [CrossRef]
  29. Faggio, C.; Tsarpali, V.; Dailianis, S. Mussel digestive gland as a model tissue for assessing xenobiotics: An overview. Sci. Total. Environ. 2018, 636, 220–229. [Google Scholar] [CrossRef]
  30. Meyer, A. DNA technology and Phylogeny of fish. Gen. Evol. Aqua. Org. 1994, 5, 219–290. [Google Scholar]
  31. Letunic, I.; Bork, P. Interactive tree of life (iTOL) v4: Recent updates and new developments. Nucleic Acids Res. 2019, 47, W256–W259. [Google Scholar] [CrossRef] [Green Version]
  32. Shade, A.; McManus, P.S.; Handelsman, J. Unexpected diversity during community succession in the apple flower microbiome. mBio 2013, 4, 1–12. [Google Scholar] [CrossRef] [Green Version]
  33. Zhang, Q.; Acuña, J.J.; Inostroza, N.G.; Mora, M.L.; Radic, S.; Sadowsky, M.J.; Jorquera, M.A. Endophytic bacterial communities associated with roots and leaves of plants growing in chilean extreme environments. Sci. Rep. 2019, 9, 4950. [Google Scholar] [CrossRef] [Green Version]
  34. Gohl, D.M.; Vangay, P.; Garbe, J.; MacLean, A.; Hauge, A.; Becker, A.; Gould, T.J.; Clayton, J.B.; Johnson, J.B.C.T.J.; Hunter, R.; et al. Systematic improvement of amplicon marker gene methods for increased accuracy in microbiome studies. Nat. Biotechnol. 2016, 34, 942–949. [Google Scholar] [CrossRef] [Green Version]
  35. Kuczynski, J.; Stombaugh, J.; Walters, W.A.; González, A.; Caporaso, J.G.; Knight, R. Using QIIME to analyze 16S rRNA gene sequences from microbial communities. Curr. Protoc. Bioinform. 2011, 36, 10.7.1–10.7.20. [Google Scholar] [CrossRef] [PubMed] [Green Version]
  36. Callahan, B.J.; Mcmurdie, P.J.; Rosen, M.J.; Han, A.W.; Johnson, A.J.A.; Holmes, S.P. DADA2: High-resolution sample inference from Illumina amplicon data. Nat. Methods 2016, 13, 581–583. [Google Scholar] [CrossRef] [Green Version]
  37. McDonald, D.; Price, M.N.; Goodrich, J.K.; Nawrocki, E.P.; DeSantis, T.Z.; Probst, A.J.; Andersen, G.L.; Knight, R.; Hugenholtz, P. An improved greengenes taxonomy with explicit ranks for ecological and evolutionary analyses of bacteria and archaea. ISME J. 2011, 6, 610–618. [Google Scholar] [CrossRef]
  38. Anderson, M.J. A new method for non-parametric multivariate analysis of variance. Austral Ecol. 2001, 26, 32–46. [Google Scholar] [CrossRef]
  39. Oksanen, J.; Blanchet, F.G.; Friendly, M.; Kindt, R.; Legendre, P.; McGlinn, D. Vegan: Community Ecology Package v.2. Available online: https://cran.rproject.org/package=vegan (accessed on 12 May 2021).
  40. Segata, N.; Izard, J.; Waldron, L.; Gevers, D.; Miropolsky, L.; Garrett, W.S.; Huttenhower, C. Metagenomic biomarker discovery and explanation. Genome Biol. 2011, 12, R60. [Google Scholar] [CrossRef] [Green Version]
  41. Louca, S.; Parfrey, L.W.; Doebeli, M. Decoupling function and taxonomy in the global ocean microbiome. Science 2016, 353, 1272–1277. [Google Scholar] [CrossRef]
  42. SantaClara, F.J.; Espiñeira, M.; Cabado, A.G.; Aldasoro, A.; Gonzalez-Lavín, N.; Vieites, J.M. Development of a method for the genetic identification of mussel species belonging to mytilus, perna, aulacomya, and other genera. J. Agric. Food Chem. 2006, 54, 8461–8470. [Google Scholar] [CrossRef]
  43. Aguilera-Muñoz, F.; Valenzuela-Muñoz, V.; Gallardo-Escárate, C. Authentication of commercial chilean mollusks using ribosomal internal transcribed spacer (its) as specie-specific DNA marker. Gayana (Concepción) 2008, 72, 178–187. [Google Scholar] [CrossRef]
  44. Olafsen, J.A.; Mikkelsen, H.V.; Giæver, H.M.; Hansen, G.H. Indigenous bacteria in hemolymph and tissues of marine bivalves at low temperatures. Appl. Environ. Microbiol. 1993, 59, 1848–1854. [Google Scholar] [CrossRef] [Green Version]
  45. Cao, R.; Xue, C.-H.; Liu, Q. Changes in microbial flora of Pacific oysters (Crassostrea gigas) during refrigerated storage and its shelf-life extension by chitosan. Int. J. Food Microbiol. 2009, 131, 272–276. [Google Scholar] [CrossRef]
  46. Hatha, A.A.M.; Christi, K.S.; Singh, R.; Kumar, S. Bacteriology of the fresh water bivalve clam Batissa violacea (Kai) sold in the Suva market. S. Pac. J. Nat. Appl. Sci. 2005, 23, 48–50. [Google Scholar] [CrossRef] [Green Version]
  47. Rao, K.V.S.; Natarajan, K.; Kumar, L.V.; Manivel, V.; Ahmad, J.; Chatterji, A.; Ansari, Z.A. Extract from an Indian Green Mussel (Perna viridis) for Differentiation and Maturation of Dendric Cells. U.S. Patent 20030401622, 28 March 2003. Available online: https://europepmc.org/article/pat/us2004009596 (accessed on 12 May 2021).
  48. Moriarty, D.J. The role of microorganisms in aquaculture ponds. Aquaculture 1997, 151, 333–349. [Google Scholar] [CrossRef]
  49. Westerdahl, A.; Olsson, J.C.; Kjelleberg, S.; Conway, P.L. Isolation and characterization of turbot (scophtalmus maximus)-associated bacteria with inhibitory effects against Vibrio anguillarum. Appl. Environ. Microbiol. 1991, 57, 2223–2228. [Google Scholar] [CrossRef] [Green Version]
  50. Aceves, A.K.; Johnson, P.; Bullard, S.A.; LaFrentz, S.; Arias, C.R. Description and characterization of the digestive gland microbiome in the freshwater mussel villosa nebulosa (Bivalvia: Unionidae). J. Molluscan Stud. 2018, 84, 240–246. [Google Scholar] [CrossRef] [Green Version]
  51. Green, T.; Barnes, A. Bacterial diversity of the digestive gland of Sydney rock oysters, Saccostrea glomeratainfected with the paramyxean parasite, Marteilia sydneyi. J. Appl. Microbiol. 2010, 109, 613–622. [Google Scholar] [CrossRef]
  52. Lokmer, A.; Kuenzel, S.; Baines, J.F.; Wegner, K.M. The role of tissue-specific microbiota in initial establishment success of pacific oysters. Environ. Microbiol. 2016, 18, 970–987. [Google Scholar] [CrossRef] [Green Version]
  53. Pierce, M.L.; Ward, J.E. Gut microbiomes of the eastern oyster (Crassostrea virginica) and the Blue Mussel (Mytilus edulis): Temporal variation and the influence of marine aggregate-associated microbial communities. mSphere 2019, 4, e00730-19. [Google Scholar] [CrossRef] [Green Version]
  54. Cleary, D.F.R.; Becking, L.E.; Polónia, A.R.M.; Freitas, R.M.; Gomes, N.C.M. Composition and predicted functional ecology of mussel-associated bacteria in Indonesian marine lakes. Anton. Leeuw. Int. J G. 2015, 107, 821–834. [Google Scholar] [CrossRef]
  55. Weingarten, E.A.; Atkinson, C.L.; Jackson, C.R. The gut microbiome of freshwater unionidae mussels is determined by host species and is selectively retained from filtered seston. PLoS ONE 2019, 14, e0224796. [Google Scholar] [CrossRef] [PubMed]
  56. Offret, C.; Paulino, S.; Gauthier, O.; Château, K.; Bidault, A.; Corporeau, C.; Miner, P.; Petton, B.; Pernet, F.; Fabioux, C.; et al. The marine intertidal zone shapes oyster and clam digestive bacterial microbiota. FEMS Microbiol. Ecol. 2020, 96, fiaa078. [Google Scholar] [CrossRef] [PubMed]
  57. Dubé, C.E.; Ky, C.-L.; Planes, S. Microbiome of the black-lipped pearl oyster pinctada margaritifera, a multi-tissue description with functional profiling. Front. Microbiol. 2019, 10, 1548. [Google Scholar] [CrossRef] [PubMed]
  58. Schill, W.B.; Iwanowicz, D.; Adams, C. Endozoicomonas dominates the gill and intestinal content microbiomes of Mytilus edulis from Barnegat Bay, New Jersey. J. Shellfish. Res. 2017, 36, 391–401. [Google Scholar] [CrossRef]
  59. King, G.M.; Judd, C.; Kuske, C.R.; Smith, C. Analysis of stomach and gut microbiomes of the Eastern oyster (Crassostrea virginica) from Coastal Louisiana, USA. PLoS ONE 2012, 7, e51475. [Google Scholar] [CrossRef] [PubMed] [Green Version]
  60. Fernández, N.T.; Mazón-Suástegui, J.M.; Vázquez-Juárez, R.; Ascencio-Valle, F.; Romero, J. Changes in the composition and diversity of the bacterial microbiota associated with oysters (Crassostrea corteziensis, Crassostrea gigas and Crassostrea sikamea) during commercial production. FEMS Microbiol. Ecol. 2014, 88, 69–83. [Google Scholar] [CrossRef] [Green Version]
  61. Arfken, A.; Song, B.; Bowman, J.S.; Piehler, M. Denitrification potential of the eastern oyster microbiome using a 16S rRNA gene based metabolic inference approach. PLoS ONE 2017, 12, e0185071. [Google Scholar] [CrossRef]
  62. Banerjee, S.; Schlaeppi, K.; Van Der Heijden, M.G.A. Keystone taxa as drivers of microbiome structure and functioning. Nat. Rev. Microbiol. 2018, 16, 567–576. [Google Scholar] [CrossRef]
  63. Li, Y.-F.; Xu, J.-K.; Chen, Y.-W.; Ding, W.-Y.; Shao, A.-Q.; Liang, X.; Zhu, Y.-T.; Yang, J.-L. Characterization of gut microbiome in the mussel Mytilus galloprovincialis in response to thermal stress. Front. Physiol. 2019, 10, 1086–1118. [Google Scholar] [CrossRef] [Green Version]
  64. Harshbarger, J.; Chang, S. Chlamydiae (with phages), mycoplasmas, and richettsiae in Chesapeake Bay bivalves. Science 1977, 196, 666–668. [Google Scholar] [CrossRef]
  65. Sun, F.; Wang, Y.; Wang, C.; Zhang, L.; Tu, K.; Zheng, Z. Insights into the intestinal microbiota of several aquatic organisms and association with the surrounding environment. Aquaculture 2019, 507, 196–202. [Google Scholar] [CrossRef]
  66. Sun, F.; Xu, Z. Significant differences in intestinal microbial communities in aquatic animals from an aquaculture area. J. Mar. Sci. Eng. 2021, 9, 104. [Google Scholar] [CrossRef]
  67. Cavallo, R.A.; Acquaviva, M.I.; Stabili, L. Culturable heterotrophic bacteria in seawater and Mytilus galloprovincialis from a mediterranean area (Northern Ionian Sea—Italy). Environ. Monit. Assess. 2009, 149, 465–475. [Google Scholar] [CrossRef]
  68. Distel, D.L.; Altamia, M.A.; Lin, Z.; Shipway, J.R.; Han, A.; Forteza, I.; Antemano, R.; Limbaco, M.G.J.P.; Tebo, A.G.; Dechavez, R.; et al. Discovery of chemoautotrophic symbiosis in the giant shipwormKuphus polythalamia(Bivalvia: Teredinidae) extends wooden-steps theory. Proc. Natl. Acad. Sci. USA 2017, 114, E3652–E3658. [Google Scholar] [CrossRef] [Green Version]
  69. Zaccone, R.; Caruso, G.; Calì, C. Heterotrophic bacteria in the northern Adriatic Sea: Seasonal changes and ectoenzyme profile. Mar. Environ. Res. 2002, 54, 1–19. [Google Scholar] [CrossRef]
  70. Zheng, Z.; Liao, Y.; Ye, J.; Yang, C.; Adzigbli, L.; Wang, Q.; Du, X.; Deng, Y. Microbiota diversity in pearl oyster pinctada fucata martensii intestine and its aquaculture environment. Front. Mar. Sci. 2021, 8, 271. [Google Scholar] [CrossRef]
Figure 1. (A) Map showing the Nehuentue Estuary and Hueihue Bay, where specimens of Choromytilus chorus were collected from natural banks and from a long–line system, respectively. (B) Schematic of experimental design used in this study.
Diversity 13 00209 g001
Figure 2. Mean relative abundances (n = 3) of taxa at the phylum (A) and family (B) levels of bacterial communities in intestines (I) and digestive glands (DG) in tissue samples of Choromytilus chorus specimens grown in natural bank from Nehuentue Estuary, and natural bank and long–line system from Hueihue Bay.
Diversity 13 00209 g002
Figure 3. Nonmetric multidimensional scaling (nMDS) analysis of bacterial communities in tissue samples of Choromytilus chorus specimens grown in natural bank from Nehuentue Estuary (S1~S6, green dots), and natural bank (S7~S12, blue dots) and long–line system (S13~S18, red dots) from Hueihue Bay. The plot was generated by free packages of R software v 1.3.1093 (https://www.rproject.org/) with the Bray-Curtis similarity index.
Diversity 13 00209 g003
Figure 4. (A) Unique and shared OTUs among bacterial communities in tissue samples of Choromytilus chorus specimens grown in Nehuentue Estuary and Hueihue Bay. (B) Heatmap showing the taxonomy at the phylum level of bacterial communities in tissue samples of Choromytilus chorus specimens grown in Nehuentue Estuary and Hueihue Bay. The value from 0 to 5 represent log of relative abundance).
Diversity 13 00209 g004
Figure 5. (A) Key phylotypes of the bacterial community in tissue samples of Choromytilus chorus specimens grown in Nehuentue Estuary and Hueihue Bay as revealed by Linear discriminant analysis Effect Size (LEfSe). (B) Mean relative abundances of microbial functional groups of the bacterial community in tissue samples of Choromytilus chorus specimens grown in Nehuentue Estuary and Hueihue Bay as revealed by FAPROTAX software.
Diversity 13 00209 g005
Table 1. The abundance of total bacteria in the digestive gland and intestine tissues of Choromytilus chorus grown in estuary water (Nehuentue) and bay seawater (Hueihue). as revealed by quantitative PCR using 16S rRNA gene as a target.
Collection SiteTissue16 rRNA Gene (Copy No. g−1 Tissue)
Estuary (bank)Digestive gland1.32 ± 2.61 × 10³ † b *
Intestine5.25 ± 2.49 × 10⁵ a
Bay (bank)Digestive gland1.49 ± 2.32 × 10³ b
Intestine6.82 ± 1.52 × 10⁴ ab
Bay (long–line)Digestive gland1.95 ± 1.19 × 10³ b
Intestine1.85 ± 5.61 × 10³ b
The values represent mean ± standard error from n = 3. * Different letter in the same column denotes significant differences (p ≤ 0.05) by ANOVA followed by Tukey’s posthoc test.
Table 2. Summary of Illumina sequencing data.
Collection SiteTissueID SampleInput NumericFiltered NumericPercentage of Input Passed Filter NumericDenoised NumericNon-Chimeric NumericPercentage of Input
Non-Chimeric Numeric
Nehuentue estuary (bank)Digestive glandS4111,82092,77182.96%92,38484,14975.25%
S51,021,727841,98782.41%840,357646,71163.30%
S6128,850107,34983.31%106,66590,19770.00%
IntestineS1153,833128,78783.72%128,153115,09374.82%
S262,99652,25682.95%51,94046,33973.56%
S330,67723,61076.96%23,00019,25362.76%
Hueihue bay (bank)Digestive glandS1066,61855,22382.90%54,83148,42972.70%
S1149,62139,26579.13%39,06326,97454.36%
S1232,89322,96369.81%22,79412,72838.70%
IntestineS7102,54583,97381.89%83,33249,16447.94%
S829,50821,78073.81%21,59412,74543.19%
S922,69915,60068.73%15,50610,29745.36%
Hueihue bay (long-line)Digestive glandS1661,46348,88779.54%48,64931,91051.92%
S1723,18217,89677.20%17,81010,99347.42%
S1865,69853,65981.68%53,47830,90547.04%
IntestineS1383,00729,29435.29%28,80315,72318.94%
S1454,76542,00676.70%41,69325,16845.96%
S1555,98745,46181.20%45,23925,79546.07%
Table 3. Alpha diversity among bacterial communities in digestive gland and intestine tissues of Choromytilus chorus grown in estuary water (Nehuentue) and bay seawater (Hueihue).
Collection SiteTissueSobs Shannon
Index H’
Inverse Simpson
Index 1/λ
Pielous’s EvennessFaith’s Phylogenetic Diversity
Estuary (bank)Digestive gland90.66 ± 13.61 a*2.77 ± 0.25 a5.04 ± 0.028 a0.43 ± 0.03 b14.05 ± 3.12 a
Intestine113.66 ± 38.12 a2.99 ± 0.34 a15.20 ± 5.07 b0.45 ± 0.01 b11.21 ± 3.71 a
Bay (bank)Digestive gland82.00 ± 44.83 a4.89 ± 0.94 a4.83 ± 0.17 a0.81 ± 0.05 ab8.77 ± 4.29 a
Intestine41.33 ± 15.05 a2.92 ± 0.58 a5.00 ± 0.08 a0.56 ± 0.08 a6.86 ± 0.34 a
Bay (long–line)Digestive gland82.66 ± 26.40 a5.10 ± 1.23 a4.98 ± 0.01 a0.80 ± 0.13 a12.27 ± 1.51 a
Intestine55.66 ± 17.74 a4.94 ± 0.58 a4.48 ± 0.58 a0.87 ± 0.01 a7.94 ± 2.85 a
Sobs: number of OTUs observed at 97% sequence similarity. The values represent mean ± standard error from n = 3. * Different letter in the same column denotes significant differences (p ≤ 0.05) by ANOVA followed by Tukey’s posthoc test.
Publisher’s Note: MDPI stays neutral with regard to jurisdictional claims in published maps and institutional affiliations.

