
Effects of Ocean Currents in the Western Pacific Ocean on Net-Phytoplankton Community Compositions
by
 , and
, and
Zhuo Chen
1, 
Jun Sun
2,*,
Dawei Chen
3,
Shihao Wang
3,4,
Hao Yu
3,4,
Hongtao Chen
5 and
Min Wang
6 1
College of Biotechnology, Tianjin University of Science and Technology, Tianjin 300457, China
2
College of Marine Science and Technology, China University of Geosciences, Wuhan 430074, China
3
Research Centre for Indian Ocean Ecosystem, Tianjin University of Science and Technology, Tianjin 300457, China
4
Institute of Marine Science and Technology, Shandong University, Qingdao 266200, China
5
Key Laboratory of Marine Chemistry Theory and Technology, Ministry of Education, Ocean University of China, Qingdao 266100, China
6
College of Marine Life Science, Ocean University of China, Qingdao 266003, China
*
Author to whom correspondence should be addressed.
Diversity 2021, 13(9), 428; https://0-doi-org.brum.beds.ac.uk/10.3390/d13090428
Submission received: 20 August 2021
/
Revised: 3 September 2021
/
Accepted: 3 September 2021
/
Published: 5 September 2021
(This article belongs to the Special Issue Linking Plankton Diversity with Ecosystem Functioning and Services)
Abstract
:Phytoplankton are known as important harbingers of climate change in aquatic ecosystems. This study investigated phytoplankton community structure in the western Pacific Ocean (WPO) in 2017 and revealed the spatial variability of phytoplankton in community composition and abundance, as well as their relationship to physical processes and environmental factors. The phytoplankton community was mainly composed of Dinophyta (221), followed by Bacillariophyta (105), Cyanophyta (4), and Chrysophyta (2). The cyanobacteria Trichodesmium were the dominants throughout the study period. Correlation analysis showed that dinoflagellates were mainly affected by temperature, while diatoms were significantly correlated with nutrients (silicate, phosphate, nitrite, nitrate). Phytoplankton was divided into five groups by cluster analysis, and the distribution of different groups was related to circulation and hydrological characteristics. In contrast, the highest abundance of diatoms and dinoflagellates was found in the New Guinea Coastal Current (NGCC) region, while the highest abundance of cyanobacteria was found in the Northern Equatorial Counter Current (NECC) region. Overall, we found that not only temperature and salinity, but also ocean currents and nutrients, influence the distribution of phytoplankton communities in the WPO.
1. Introduction
As the most important producers in marine ecosystems, phytoplankton not only absorb carbon dioxide and regulate global climate change, but also provide energy through photosynthesis [1]. Phytoplankton communities play an important role in biogeochemical cycles and pelagic food webs, and they also support the energy needs of marine ecosystems [2]. They are widely distributed in the upper layer, and the distribution of phytoplankton species and their community structure are usually associated with the dominant marine environment (unique nutrient structure) [3]. The distribution of phytoplankton in seawater is usually strongly influenced by ocean circulation and mesoscale hydrographic features [4]. Some specific currents and water masses are inhabited by specific native species, a property that can be used to indicate water movement [5]. For this reason, the distribution of many phytoplankton species is closely related to unique environmental factors in many marine ecosystems.
The Pacific Ocean covers about a third of the earth and nearly half of the sea surface around the world. The boundaries of the tropical western Pacific Ocean (WPO) are very irregular, with numerous islands and complex ocean currents. Specifically, there are three dominant current systems in the region: the North Equatorial Current (NEC, 10°–25° N), the Northern Equatorial Counter Current (NECC) (4°–10° N), and the South Equatorial Current (SEC, 4° N–20° S) [6]. In addition, there are the New Guinea Coastal Current (NGCC) and the New Guinea Coastal Undercurrent (NGCU) on the coast of New Guinea. Owing to the high solar radiation throughout the year and the influence of the equatorial currents flowing, warm water accumulates in the western equatorial Pacific Ocean, forming the largest warm water region called the western Pacific warm pool (WPWP), with a thermocline thickness of 100–150 m, which was 3–6 °C higher than the eastern equatorial Pacific Ocean [7,8].
The study of phytoplankton in the Kuroshio region of the WPO dates to the 1970s, and a lot of work has been done by domestic and foreign scholars. The distribution and composition of plankton in the Kuroshio area were reported in detail by Kawarada et al. [9]. Shiro Fujioka [10] analyzed the Kuroshio water masses near the Sea of Japan and used phytoplankton as indicator species. In 1997, Sun [11] and Liu [12] further investigated the composition and abundance distribution of planktonic diatoms and dinoflagellates in the Ryukyu Islands and nearby waters. Chen [13] and Chen [14] proposed that the abundance of Trichodesmium was higher in the Kuroshio area due to the deeper nitrate thermocline and the lower nitrate concentration in the surface layer. The density of Trichodesmium in the Kuroshio region was very high. The available data need to be improved and updated. Although some quantitative assessments of the phytoplankton community structure of WPO have been obtained in previous studies, information on the influence of circulation on the phytoplankton composition in the region is lacking. Therefore, analyzing the distribution of the WPO phytoplankton community and the effects of species composition and circulation will provide indispensable information for future studies. In this study, the community structure of phytoplankton in the whole water column was explored by characterizing the community structure of net-phytoplankton in the investigated sea area. The relationships between phytoplankton and environmental factors and their responses to the effects of circulation were analyzed. Thus, certain information can be accumulated for the ecological study of phytoplankton in the region.
2. Material and Method
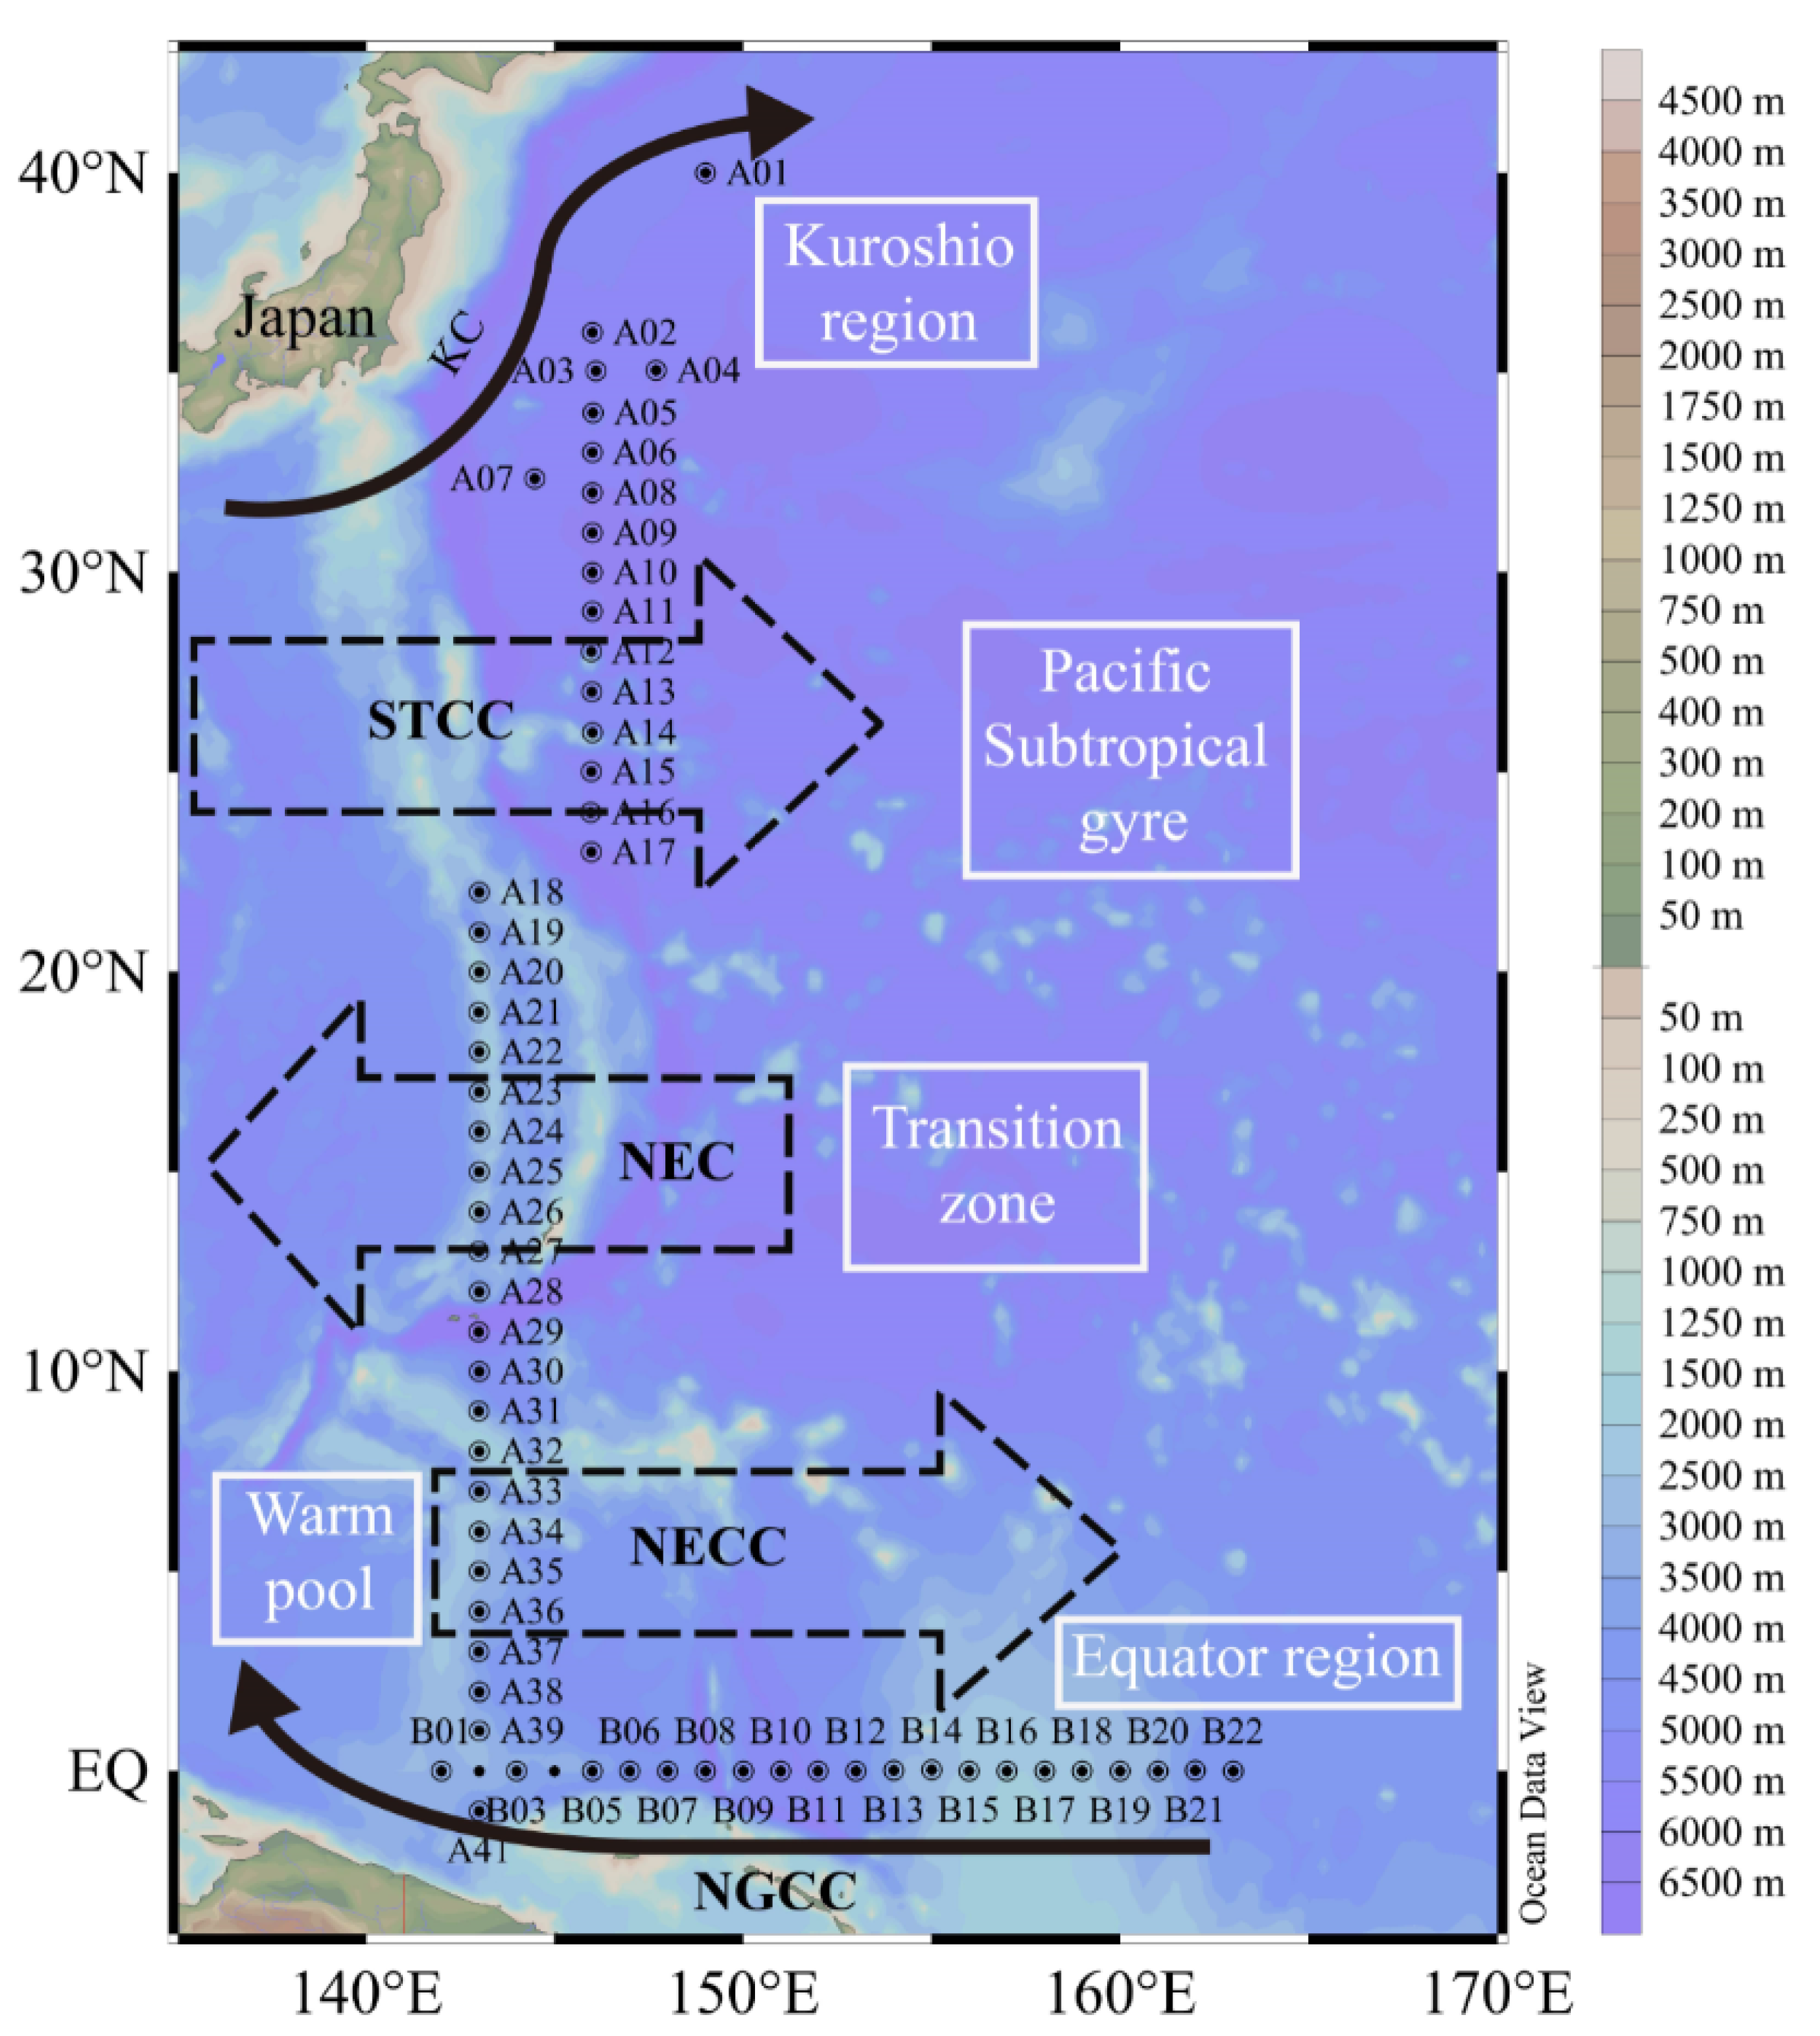
The cruise was carried out from 142–163° E and 1–40° N in the WPO onboard R/V “Dongfanghong 2”, covering 63 stations from October 6th to December 7th in 2017. As shown in Figure 1, the survey area was divided into two sections: Section A (stations assigned to the longitude of 143–146° E) and Section B (stations assigned along the equator). These stations were sampled between 0 and 200 m depth by vertical tows with the plankton net (mouth opening 0.25 m2, mesh size 20 μm). Samples were fixed in 5% buffered formalin and stored in the dark. In the laboratory, phytoplankton samples are observed under a microscope (AE2000, Motic, Xiamen, China) [15]. Phytoplankton identification was conducted as described by Jin [16], Isamu Y [17], and Sun [18]. Species identification was as close as possible to the species level.
Seawater samples were collected by a SeaBird CTD (SBE 9/11 plus) equipped with Go-Flo bottles, and temperature and salinity were recorded at the same time. The temperature and salinity of the water column were calculated by means of a trapezoidal integration of the different levels of seawater temperature and salinity. Nutrient samples from different layers were placed in PE bottles and stored at −20 °C for laboratory nutrient analysis [19]. Nitrate, nitrite, ammonium, phosphate, and silicate were also analyzed on board by spectrometric methods [20]. Chlorophyll a (chl a) samples were filtered through Whatman GF/F filters (0.7 μm) for seawater samples (1 L) and subsequently saved under –20 °C. Chl a was extracted in laboratory without light by 90% acetone, and then Turner fluorimeter (model 10-AU) was used to measure the chl a concentration [21]. The sampling layers were 5 m, 30 m, 75 m, 100 m, 150 m, and 200 m.
Dominance index (Y) was calculated to describe the species dominance in the phytoplankton community. The calculation equation was as follows:
where ni is the number of the individual species, N is the total number of all species, and fi is the occurrence frequency of the species in a sample.
The abundance of phytoplankton cells in water column was calculated through the trapezoidal integral method [24]:
where P is the average value of phytoplankton abundance in water column, Pi is the abundance value of phytoplankton in layer i, i + 1 is the layer i + 1, Dn is the maximum sampling depth, Di is the depth of layer i, and n is the sampling level.
Horizontal and depth-integrated distribution of phytoplankton and physiochemical parameters were projected using Ocean Data View 4.7.6 and ArcGIS 10.8. The histogram was plotted with Origin (Version 8.5). Pearson correlation and canonical correspondence analysis (CCA) between assemblages and physicochemical parameters were performed using the R package vegan (version 2.5–7) [25] to explain the relationship between the environmental parameters (temperature, salinity, and nutrients) and phytoplankton community structure.
3. Result
3.1. Phytoplankton Species Composition
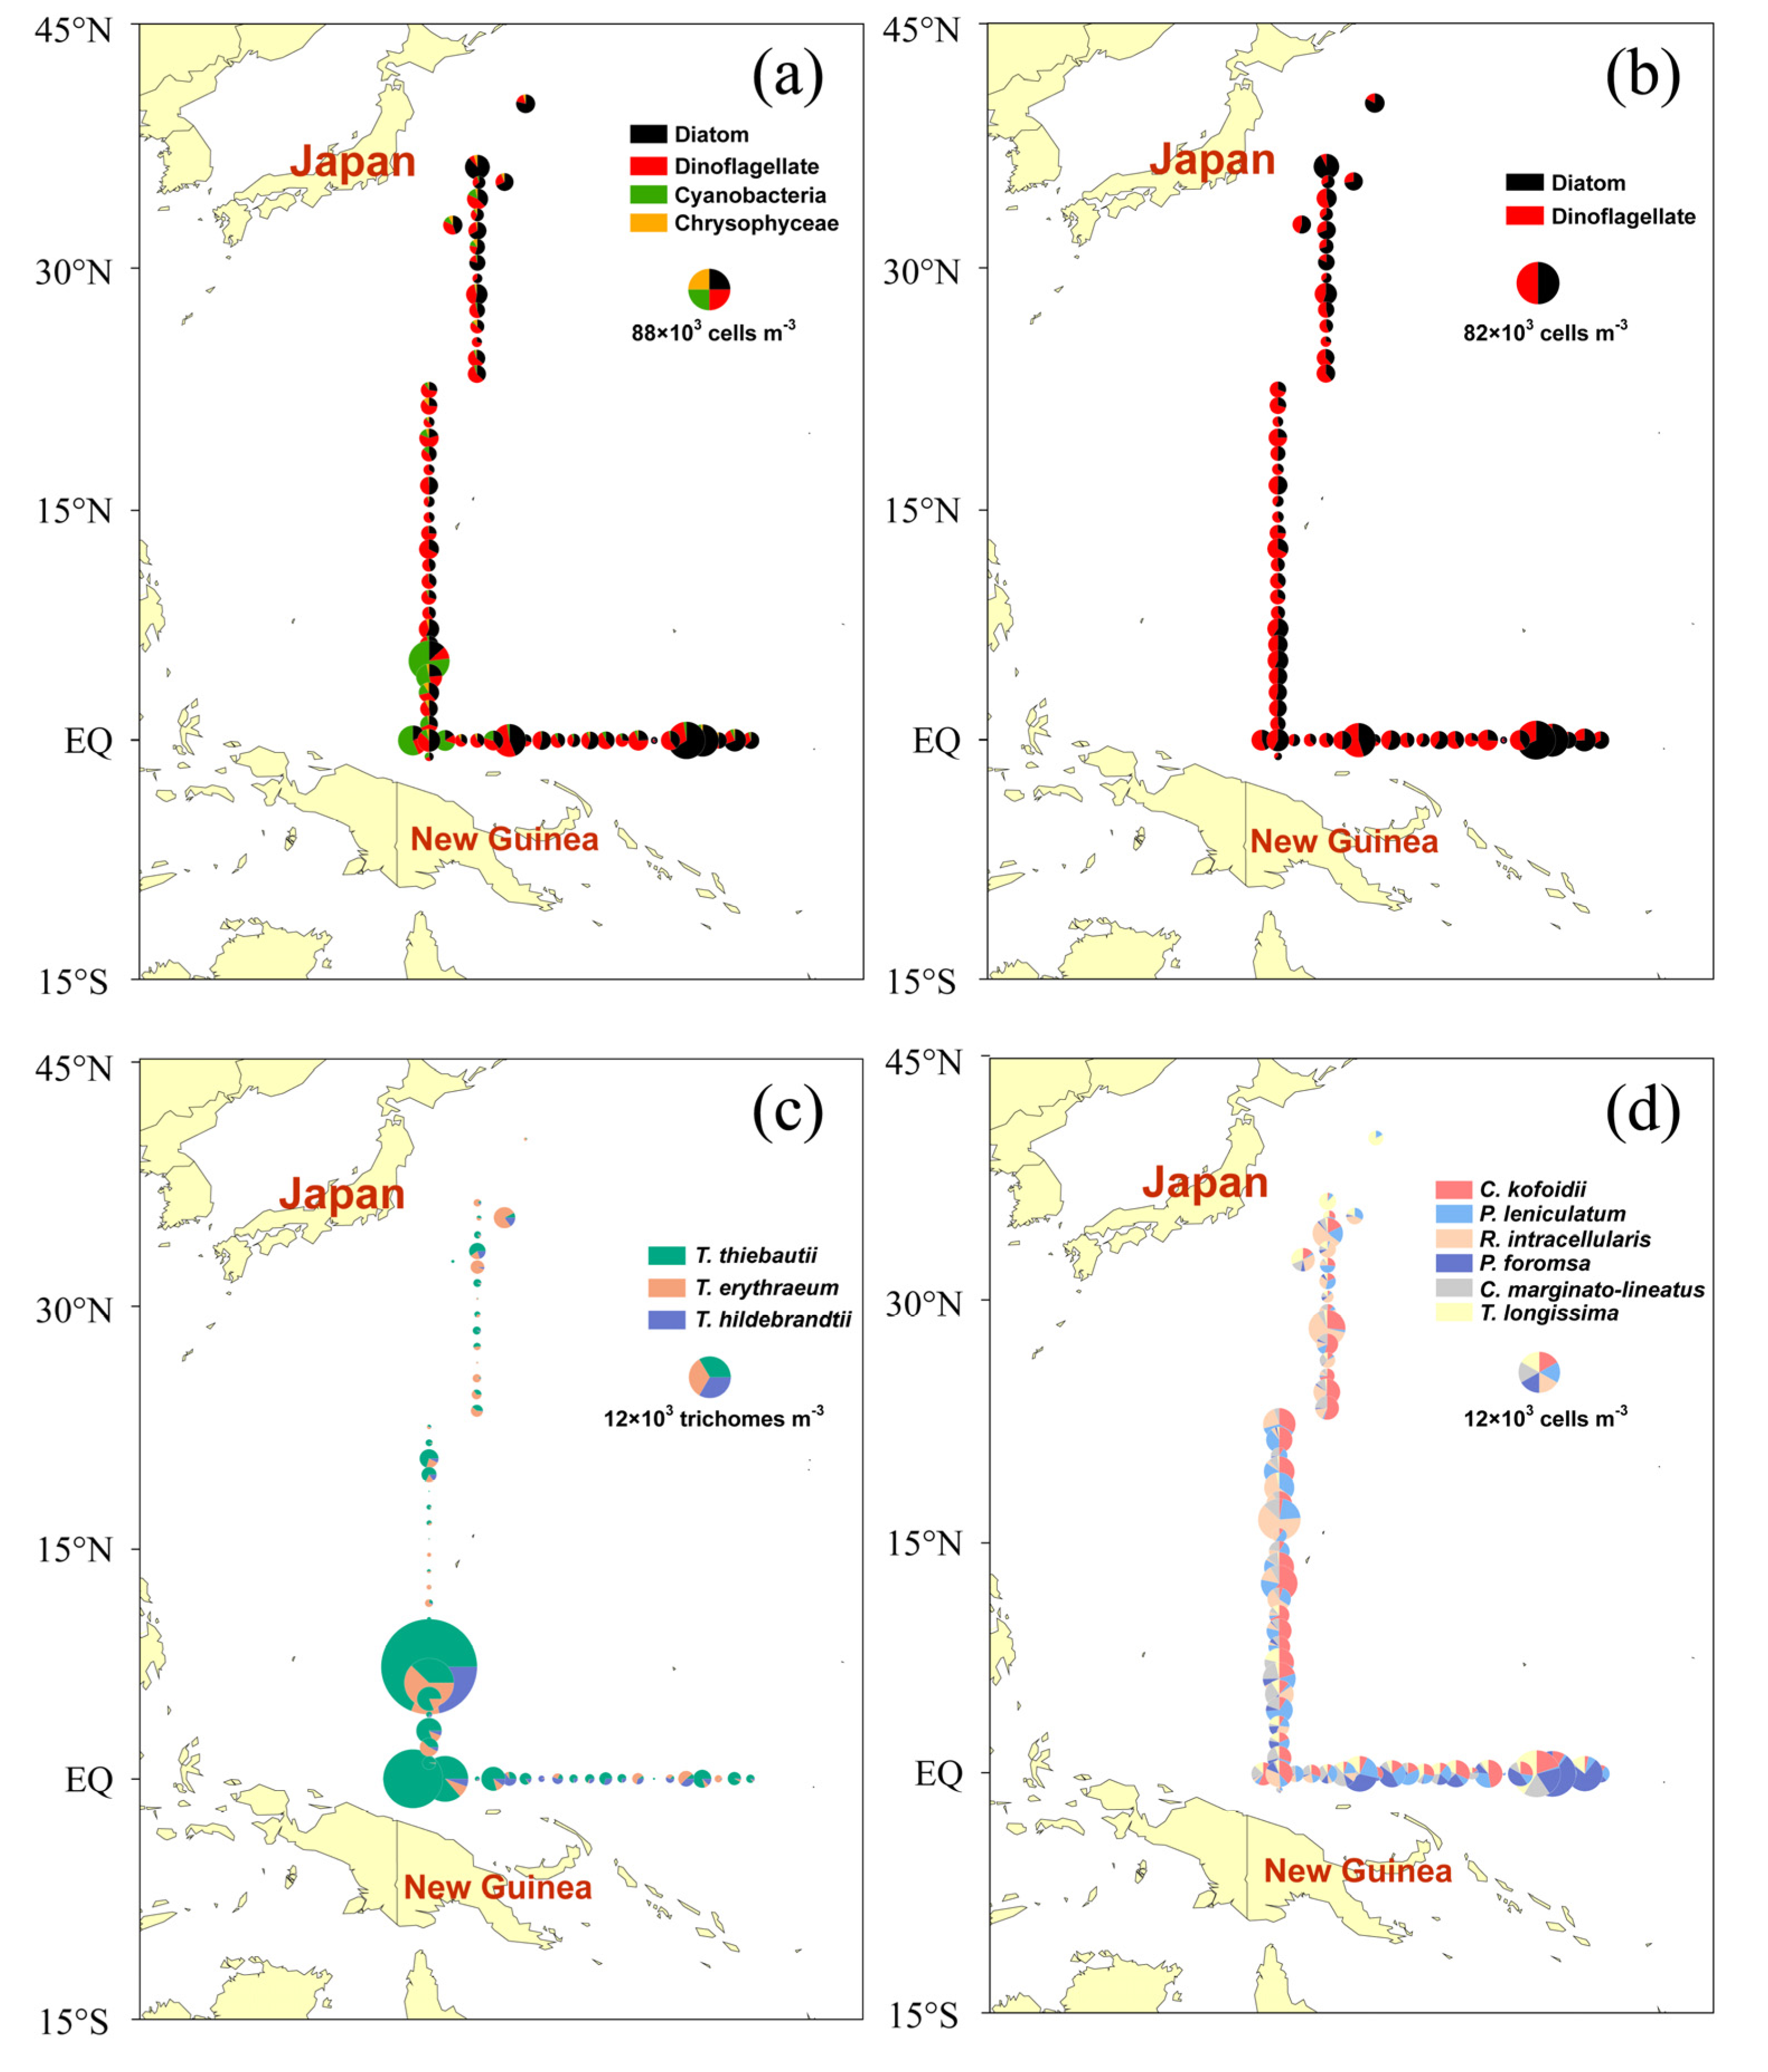
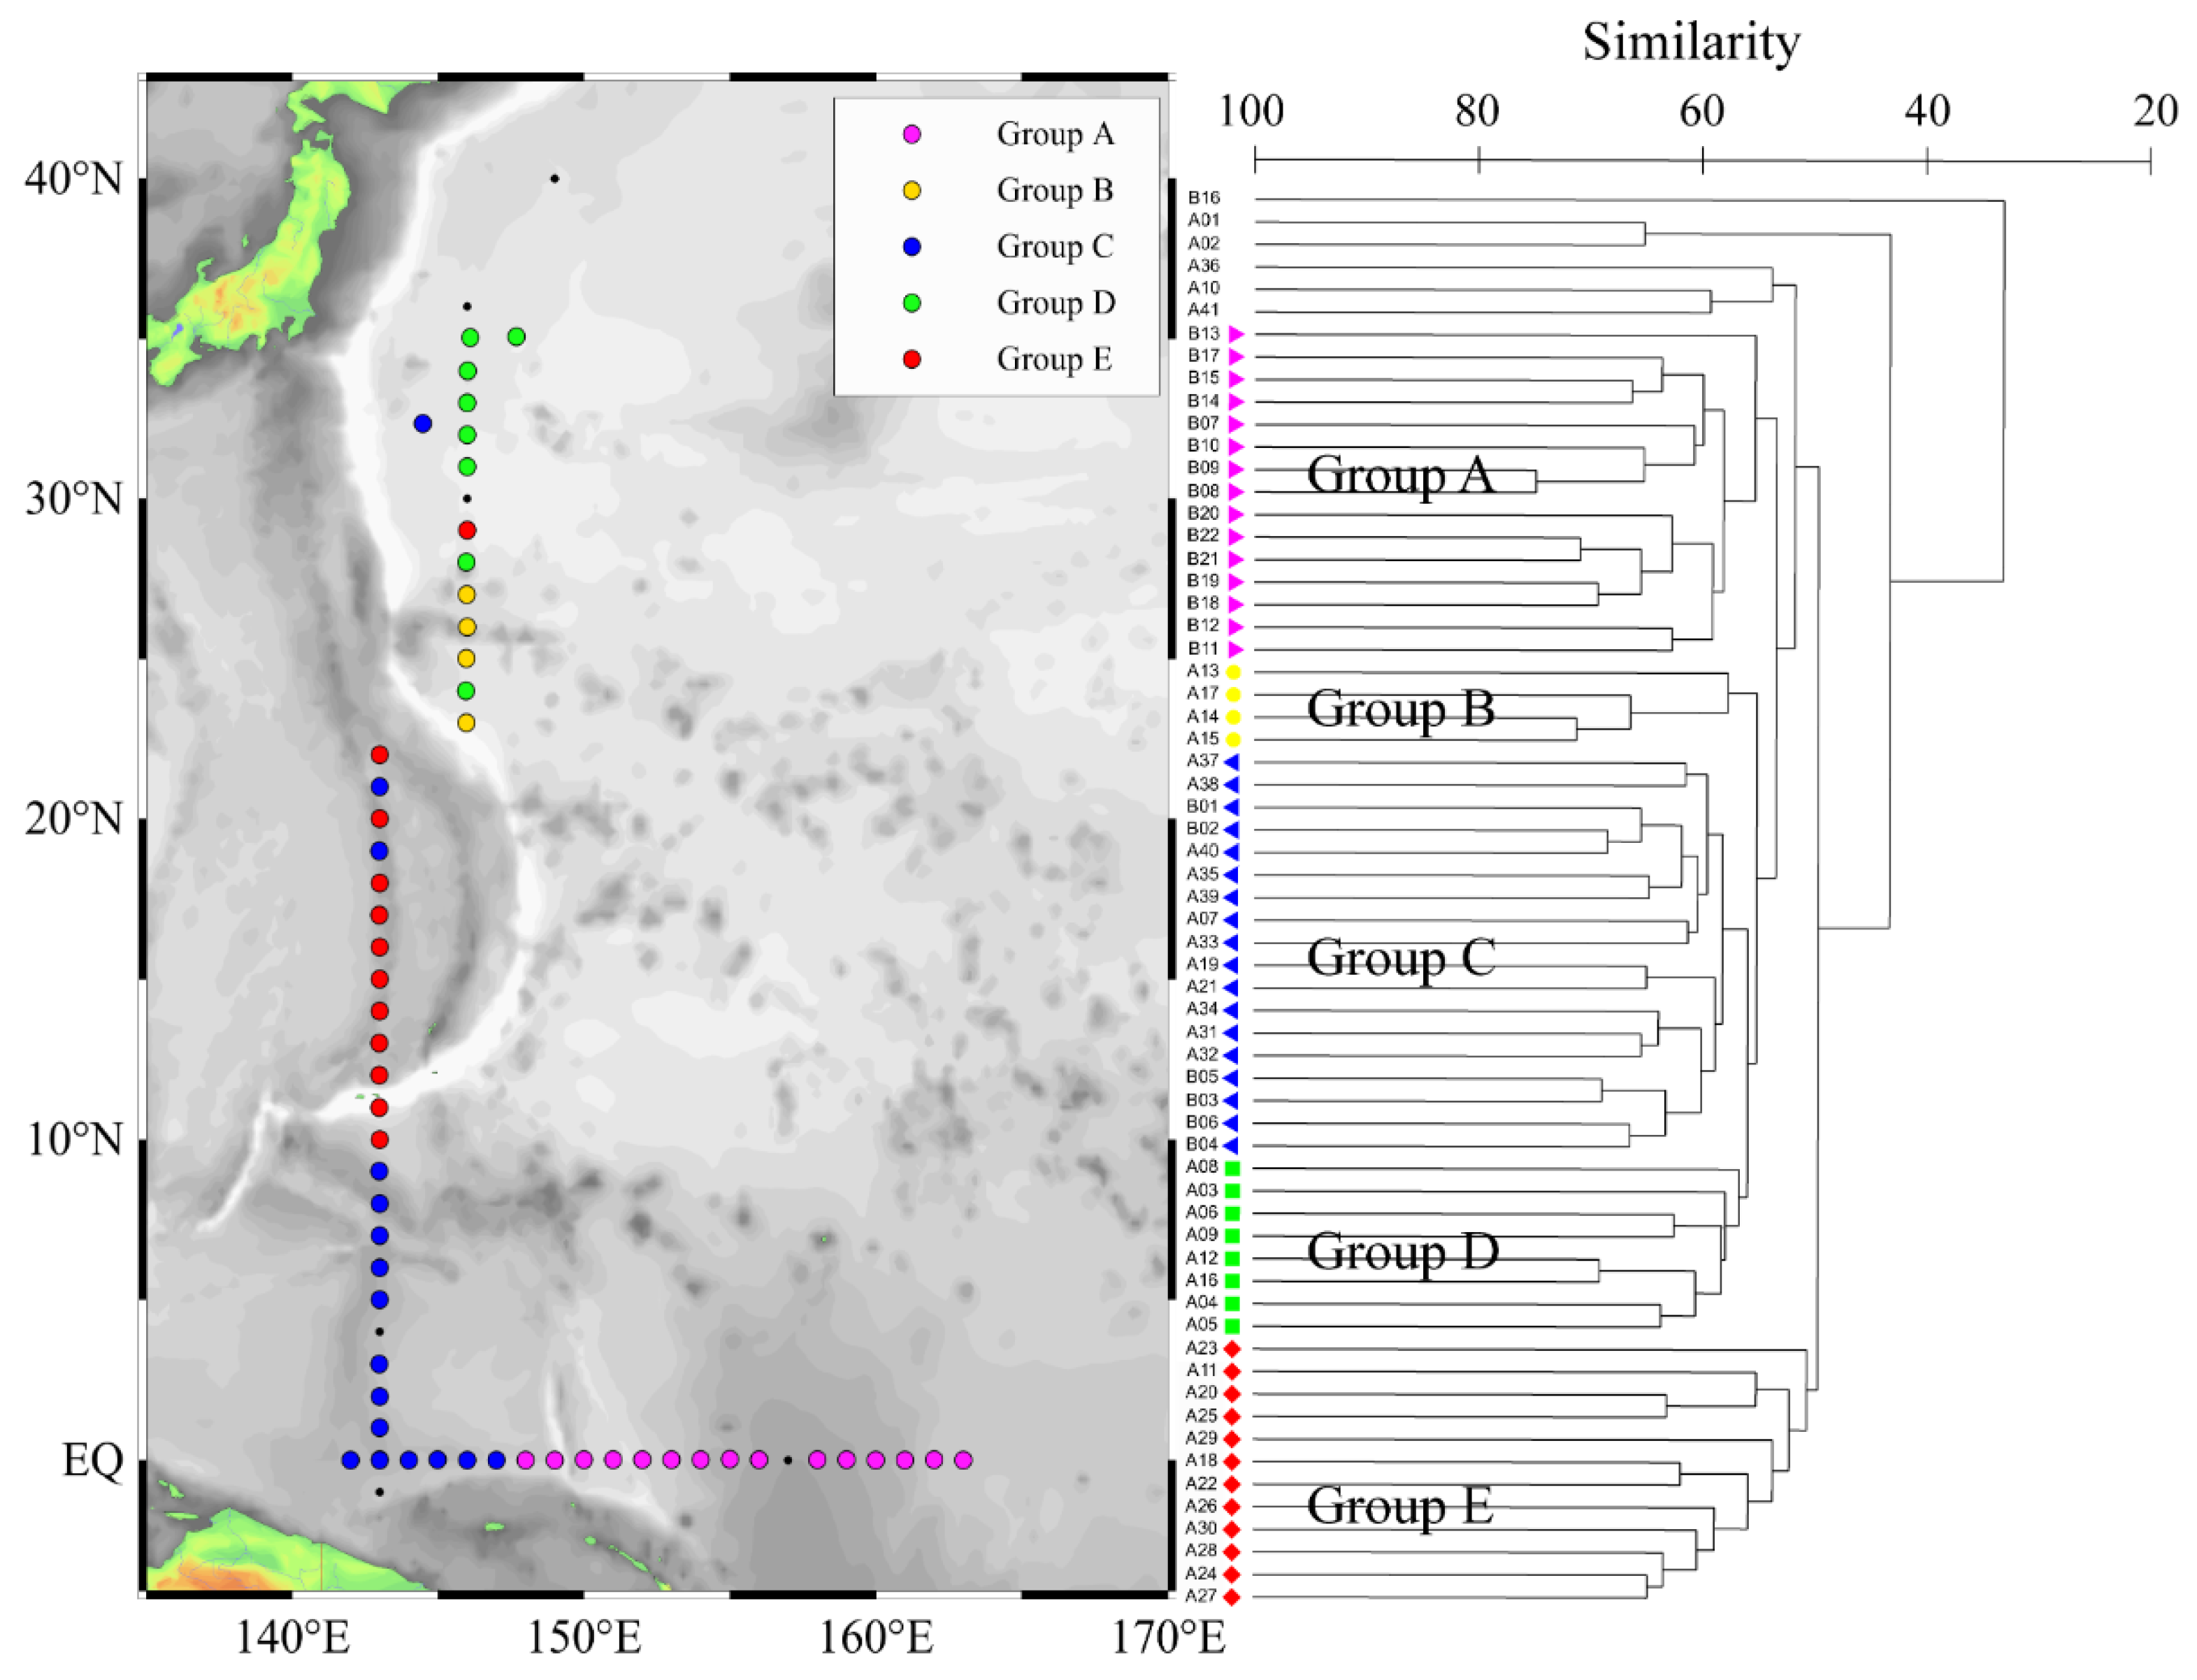
Phytoplankton samples from the WPO were analyzed, and 332 species belonging to 68 genera in 4 phyla were identified, including Bacillariophyta, Dinophyta, Cyanophyta, and Chrysophyta. There were 105 diatoms belonging to 37 genera (31.63% of total species), 221 species in 28 genera of dinoflagellates (66.57%), 4 cyanobacteria species, and 2 chrysophyceae species (Table 1). The distribution of phytoplankton (Figure 2a) is mainly determined by Cyanobacteria. The distribution of dinoflagellate (Figure 2b) shows that most of the sites of dinoflagellate are evenly distributed, and diatom is more dominant in some stations near the shore. Trichodesmium thiebautii is the main species of Trichodesmium and is abundantly distributed in the surveyed sea area (Figure 2c). The abundance of Trichodesmium reaches the maximum value (12.905 × 10³ cells m−3) at the A35 station of the investigated sea area. The distribution of dominant species (Figure 2d) shows that there is a rich diversity of phytoplankton in the investigated sea area. The dominant species of dinoflagellate in this survey is Ceratium kofoidii, and the maximum value appears at A28 station (5.619 × 10³ cells m−3). Planktoniella foromsa is the dominant species of diatom in this survey, and the maximum value appears at B19 station (13.276 × 10³ cells m−3). Thalassiothrix longissima is a common species of Kuroshio, which is dominant at A01 and A02 stations, and reaches the peak at B18 station with higher diatom abundance (Table 2). Cluster analysis was used to analyze the similarity of phytoplankton taxa. The results of the cluster analysis were used to analyze the similarity between phytoplankton taxa based on their abundance during the 2017 cruise. The cluster analysis revealed five distinct phytoplankton communities (Figure 3). Phytoplankton groups containing fewer than four stations were not considered as significant clusters. Clusters were assigned different color symbols and plotted in the sampling area (Figure 3).
3.2. Environmental Characteristics of the Survey Area
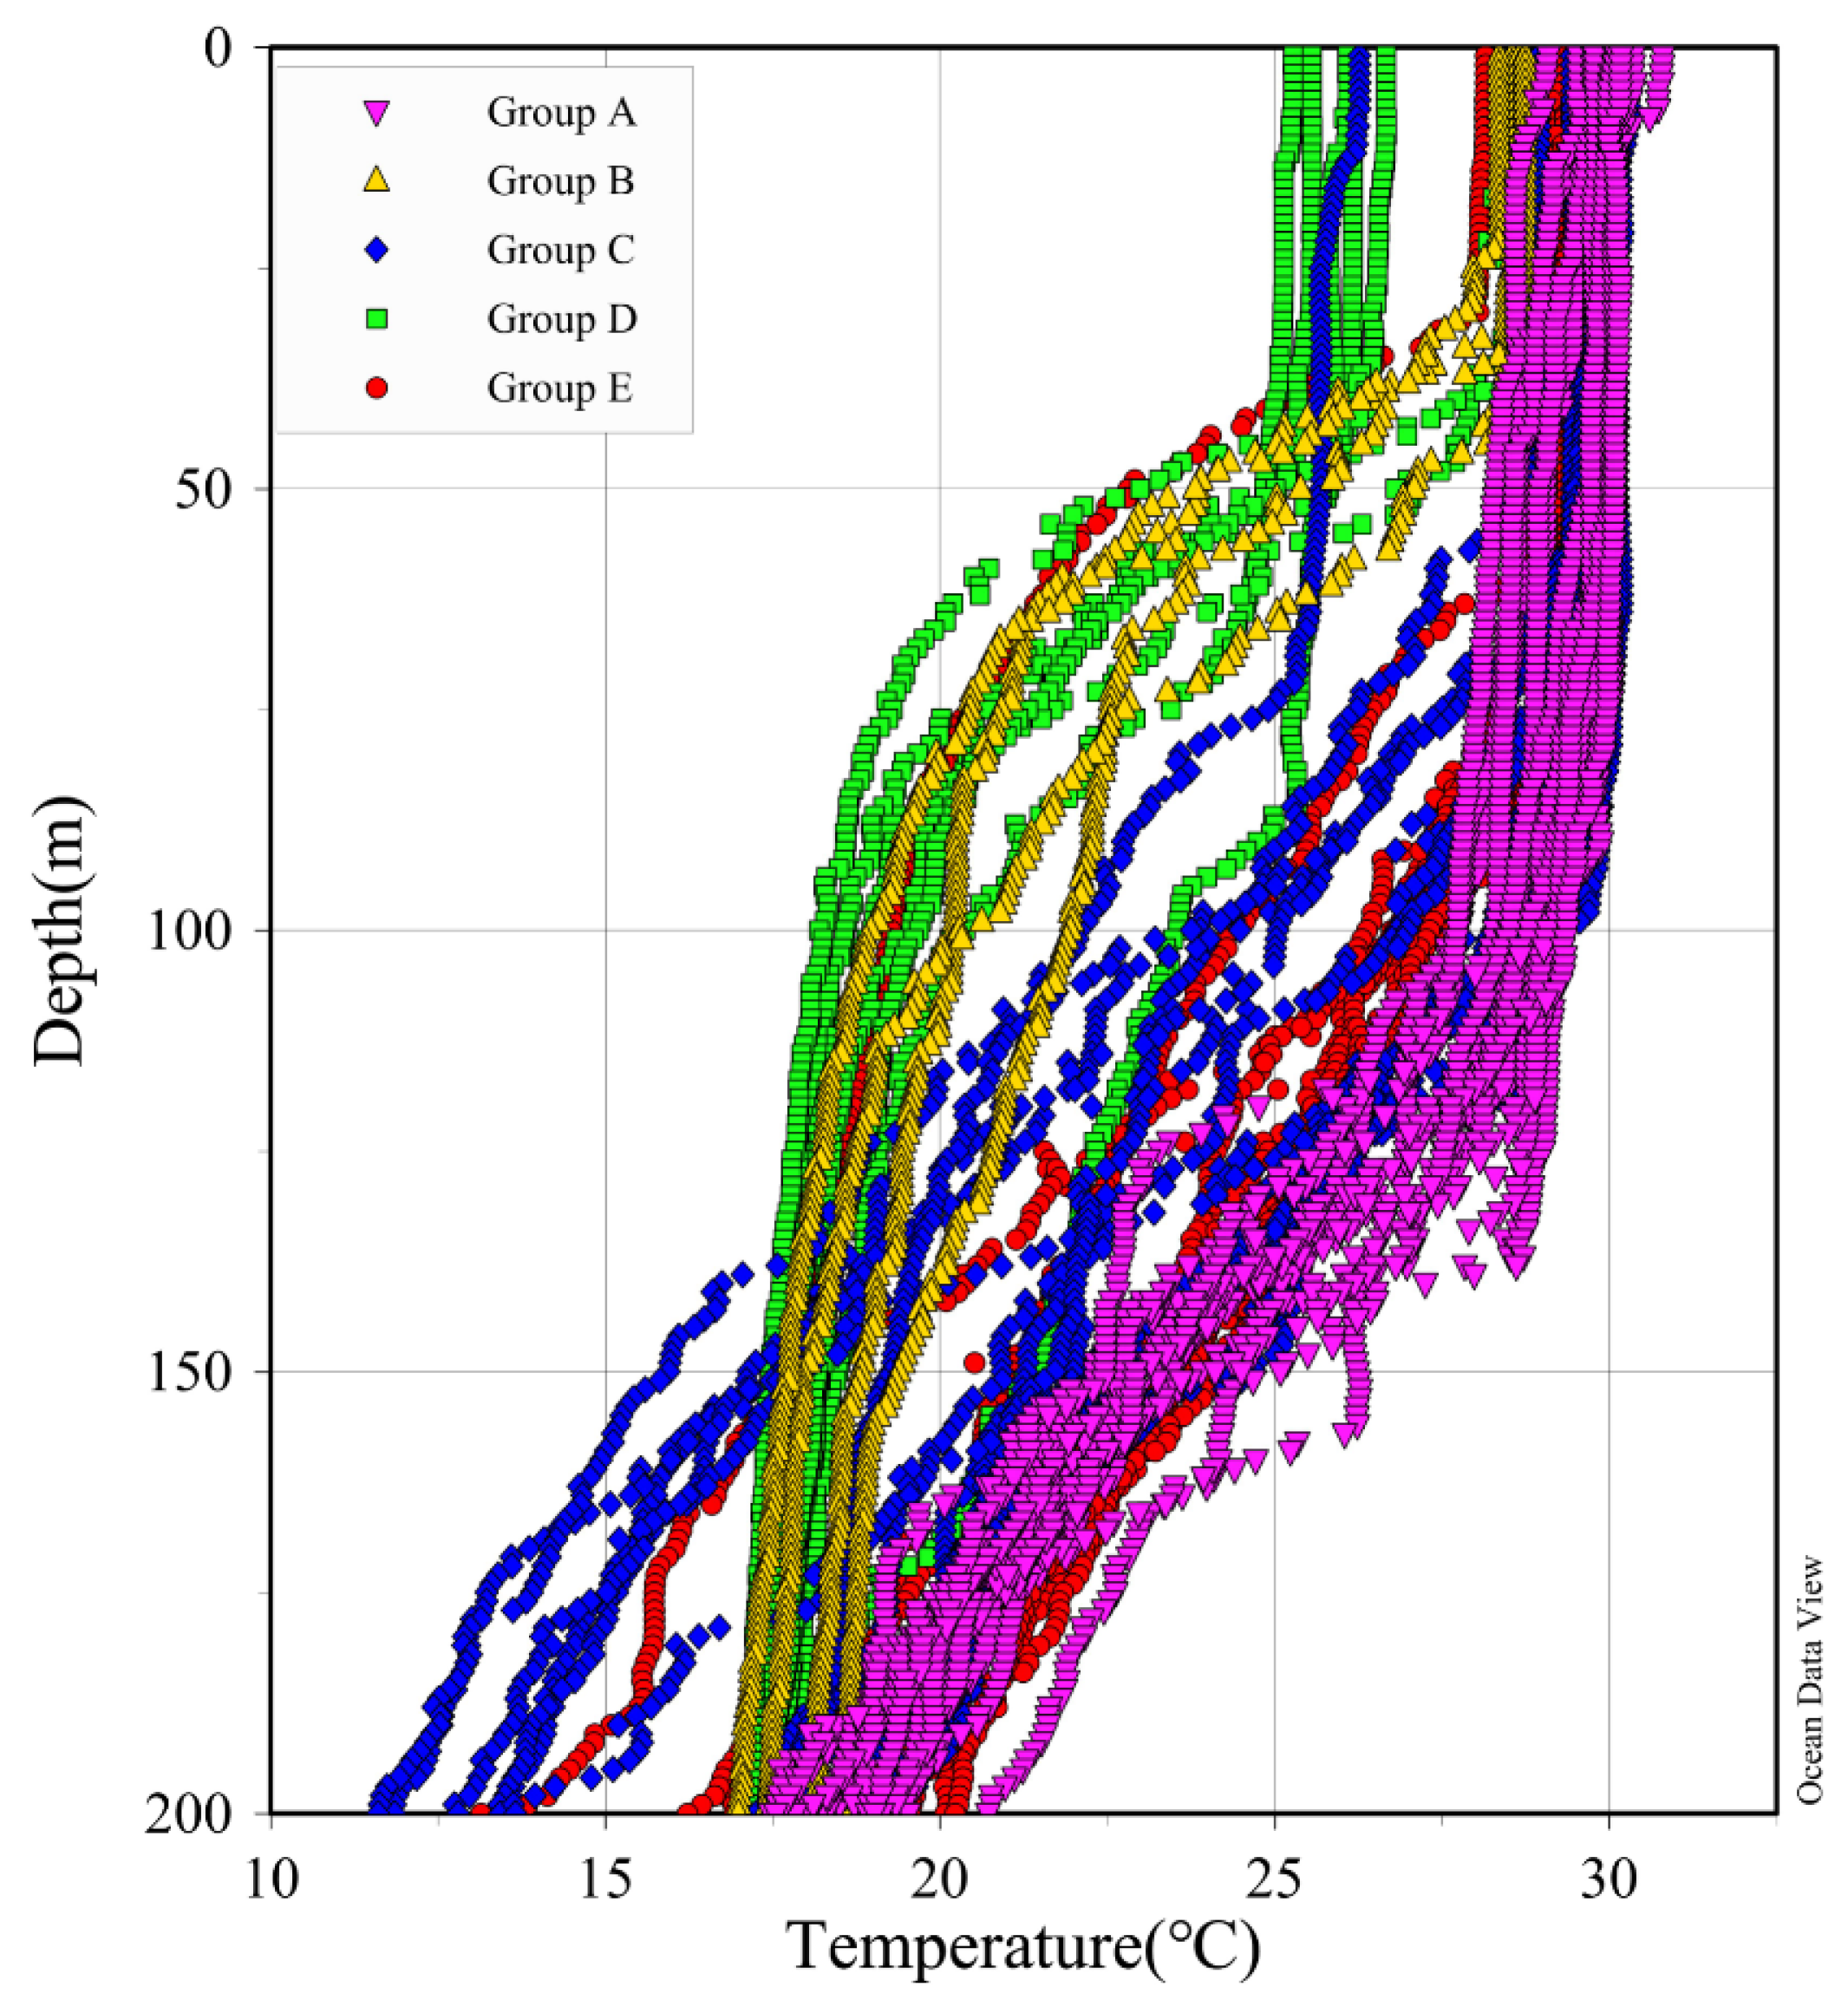
Phytoplankton clustering analysis divided the 63 stations surveyed into five groups (Figure 3). The different groups had different hydrological characteristics. These hydrological characteristics included temperature (T), salinity (S), chl a, silicate (SiO32−), phosphate (PO43−), nitrate (NO3−), nitrite (NO2−), and ammonium (NH4+). We found that the five groups had different characteristics. Group A had the highest mean temperature, the highest mean salinity, the highest mean nutrient concentration, and a deeper mixed layer with a thickness of about 125 m; Group B had the shallowest mixed layer with a thickness of about 30 m; Group C had the highest mean silicate concentration; Group D had the lowest mean temperature and the lowest mean salinity; and Group E had moderate mean temperature, salinity, and nutrient levels (Table 3, Figure 4).
3.3. Phytoplankton Community Structure of Five Groups
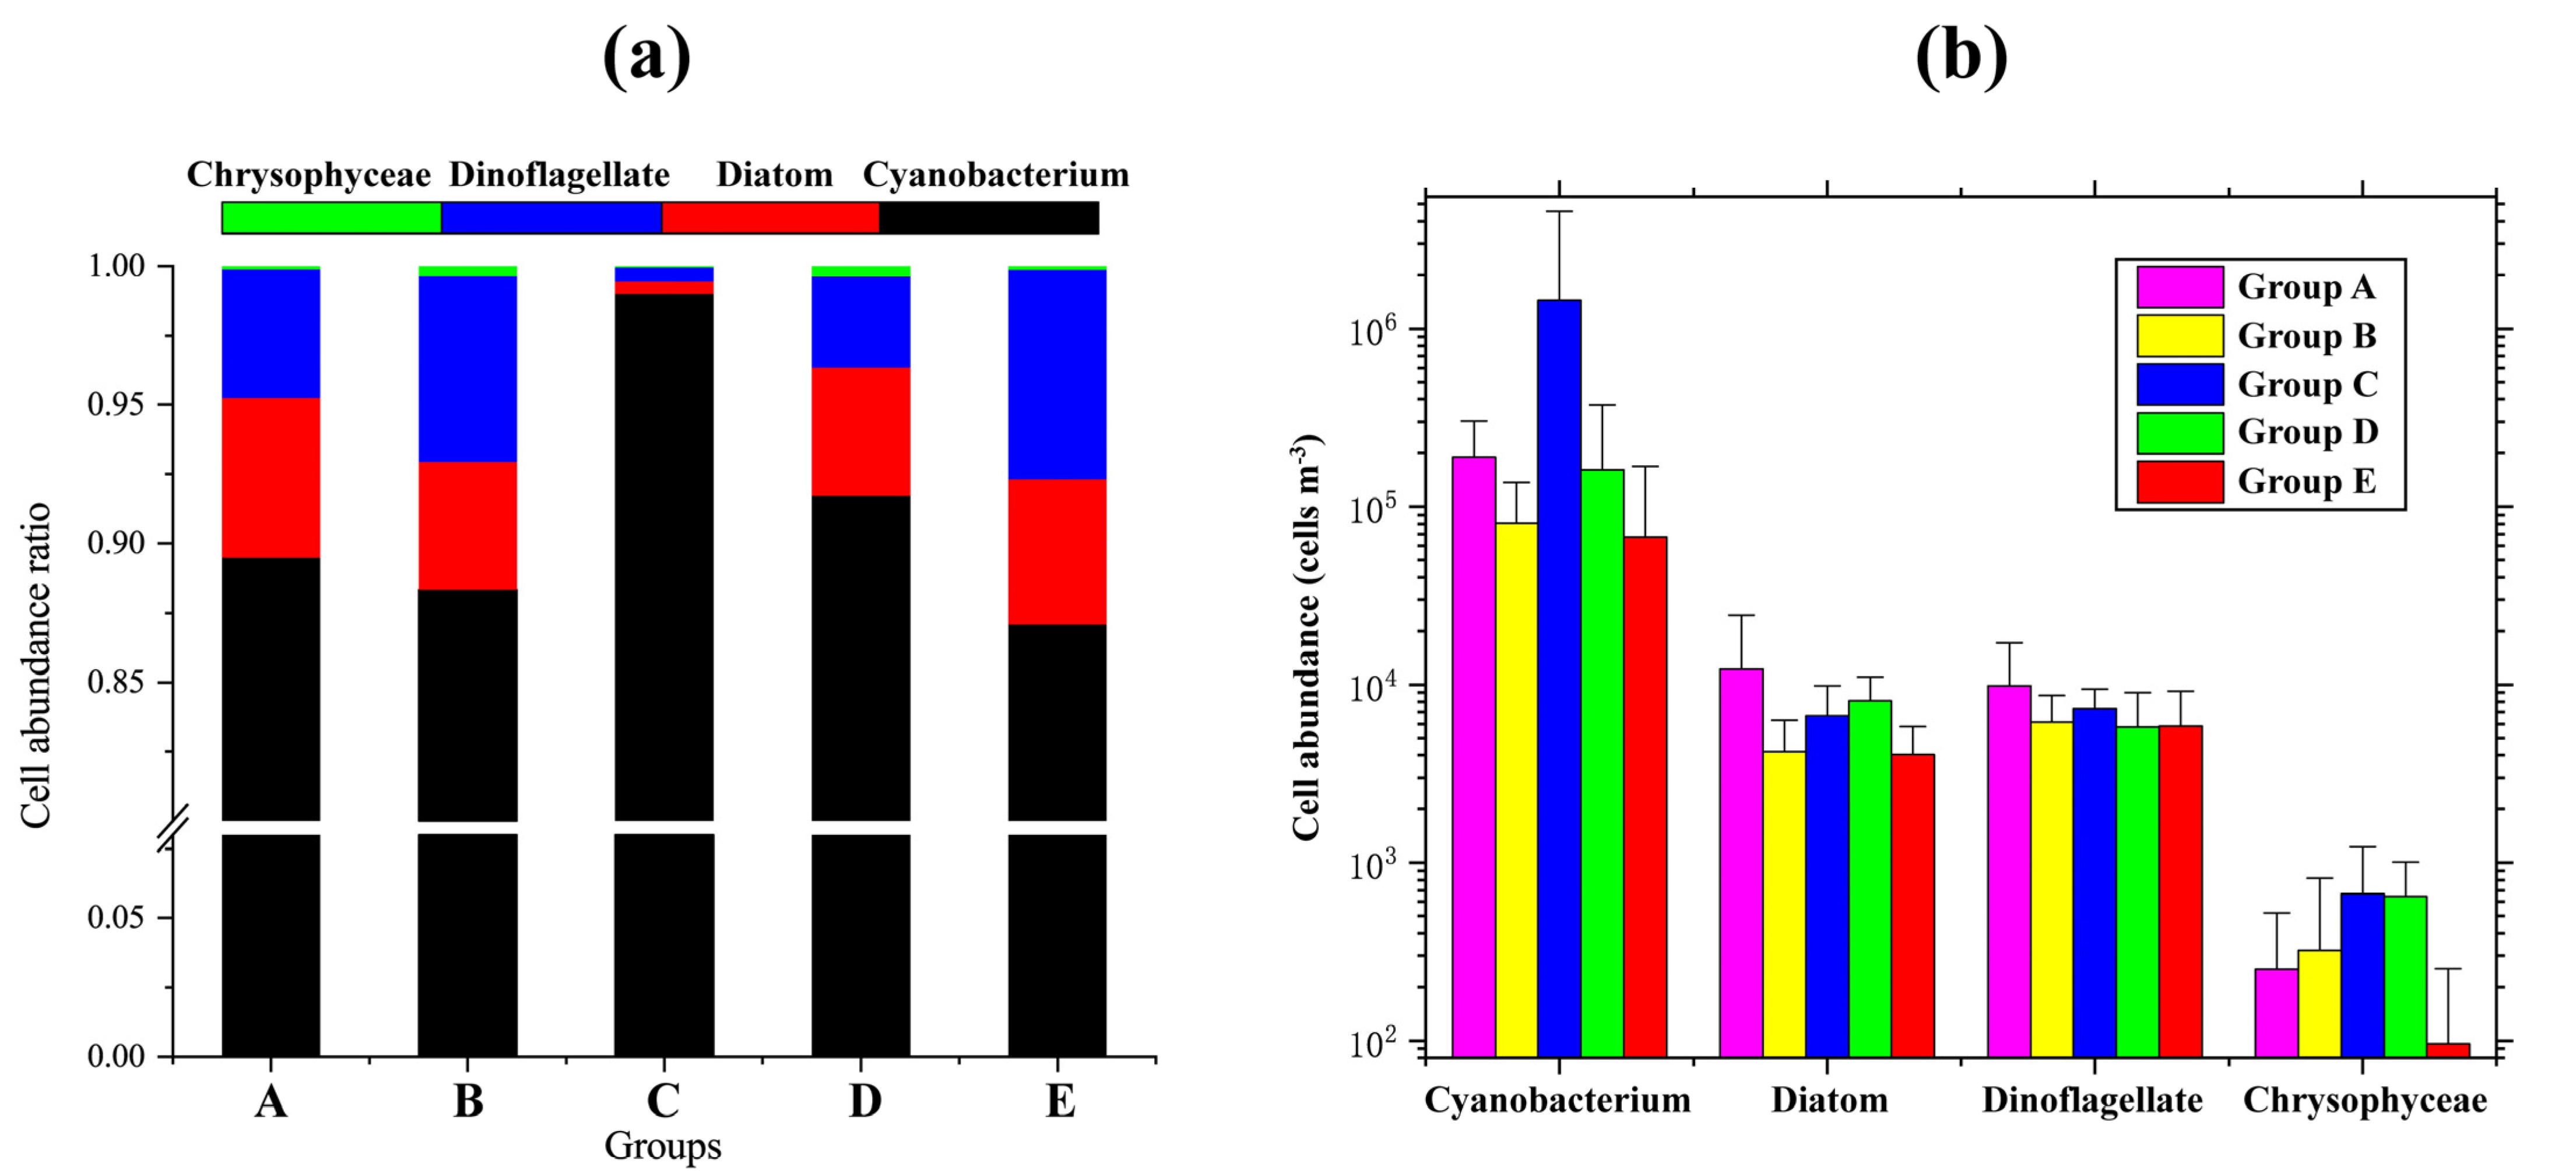
Cluster analysis showed that phytoplankton communities have a spatial distribution structure in the currents of the WPO. In the five groups, the phytoplankton had different proportions of cell abundance. The cell abundance of the four-phyla phytoplankton also differed in the five groups (Figure 5). The dominant species of phytoplankton had different mean cell abundance in the five groups (Table 4). Overall, the highest abundance of diatoms and dinoflagellates was in Group A, and the highest abundance of cyanobacteria in Group C.
Group A was distributed along the equator and mainly affected by the NGCC. The total phytoplankton abundance in Group A was not the highest (2.12 × 10⁵ cells m−3) among the five phytoplankton groups, but the abundance of diatoms and dinoflagellates in Group A was the highest (1.22 × 10⁴ cells m−3 and 0.98 × 10⁴ cells m−3). Cyanobacteria, diatoms, dinoflagellates, and chrysophyceaes accounted for 89.49%, 5.75%, 4.64%, and 0.12% of the total phytoplankton, respectively. The abundance of P. foromsa (2.39 × 10³ cells m−3) and T. longissima (9.88 × 10² cells m−3) was higher than other groups. Additionally, R. intracellularis was not found in Group A.
Group B contained sites affected by the STCC. P. leniculatum of Group B had the lowest abundance (1.77 × 10² cells m−3). Cyanobacteria accounted for 88.35%, diatoms 4.58%, dinoflagellates 6.72%, and chrysophyceaes 0.35% of the total phytoplankton. C. kofoidii had the highest abundance (1.31 × 10³ cells m−3) in Group B among the five groups.
Group C was mainly affected by the NECC. Group C had the highest abundance of total phytoplankton (1.45 × 10⁶ cells m−3). Group C of phytoplankton was mainly composed of cyanobacteria; cyanobacteria accounted for 98.99% of the total phytoplankton, diatoms accounted for 0.46% of the total phytoplankton, dinoflagellates accounted for 0.50% of the total phytoplankton, and chrysophyceaes accounted for 0.05% of the total phytoplankton. C. marginato-lineatus had the highest abundance (7.19 × 10² cells m−3) among the five groups in Group C.
Group D mainly contained stations affected by the STCC and KC. Cyanobacteria, diatoms, dinoflagellates and chrysophyceaes accounted for 91.71%, 4.63%, 3.29% and 0.37% of the total phytoplankton respectively. Fragilariopsis doliolus had the highest abundance (6.78 × 10² cells m−3) in Group D among the five groups.
Group E, located in the middle of the sampling area, was mainly affected by the NEC. Group E was the group with the lowest total phytoplankton abundance (7.71 × 10⁴ cells m−3), and the abundance (4.51 × 10³ cells m−3, 0.01 × 10³ cells m−3, 0.07 × 10³ cells m−3) of T. hildebrandtii, P. foromsa, and T. longissima in this group was also very low. Cyanobacteria, diatoms, dinoflagellates and chrysophyceaes accounted for 87.10%, 5.21%, 7.56%, and 0.13% of the total phytoplankton, respectively.
3.4. Phytoplankton Distribution in Relation to Environmental Factors
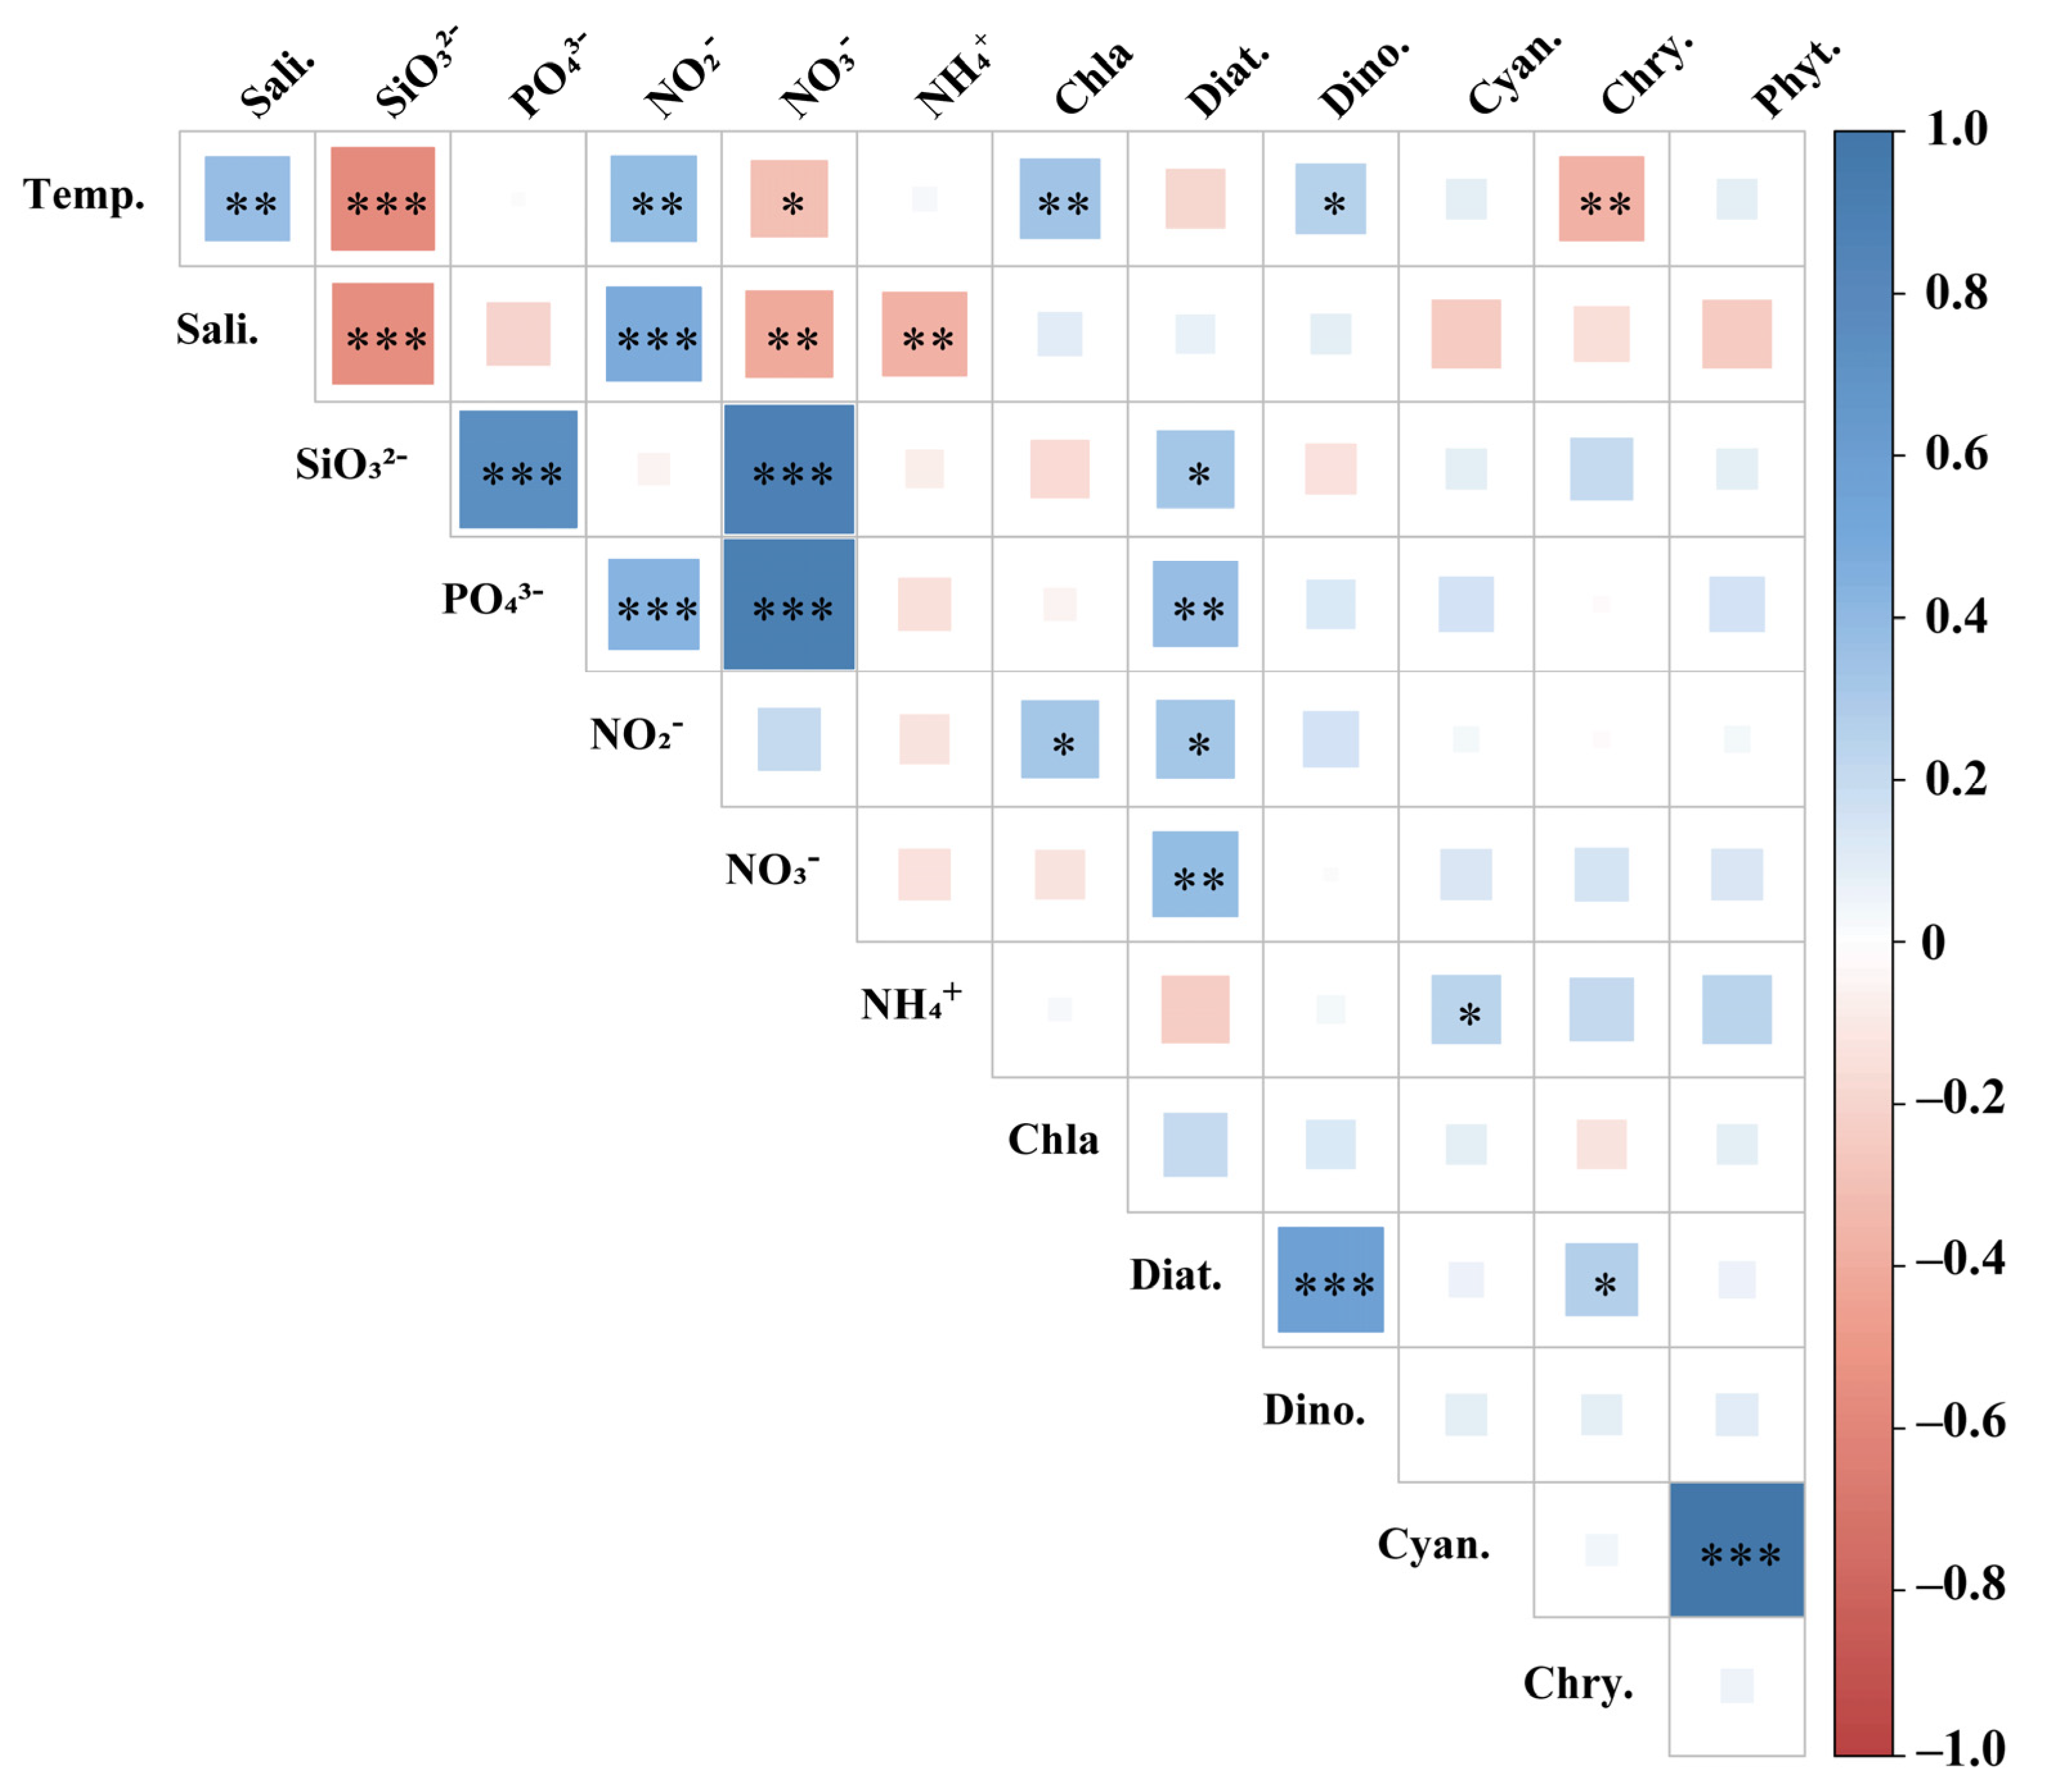
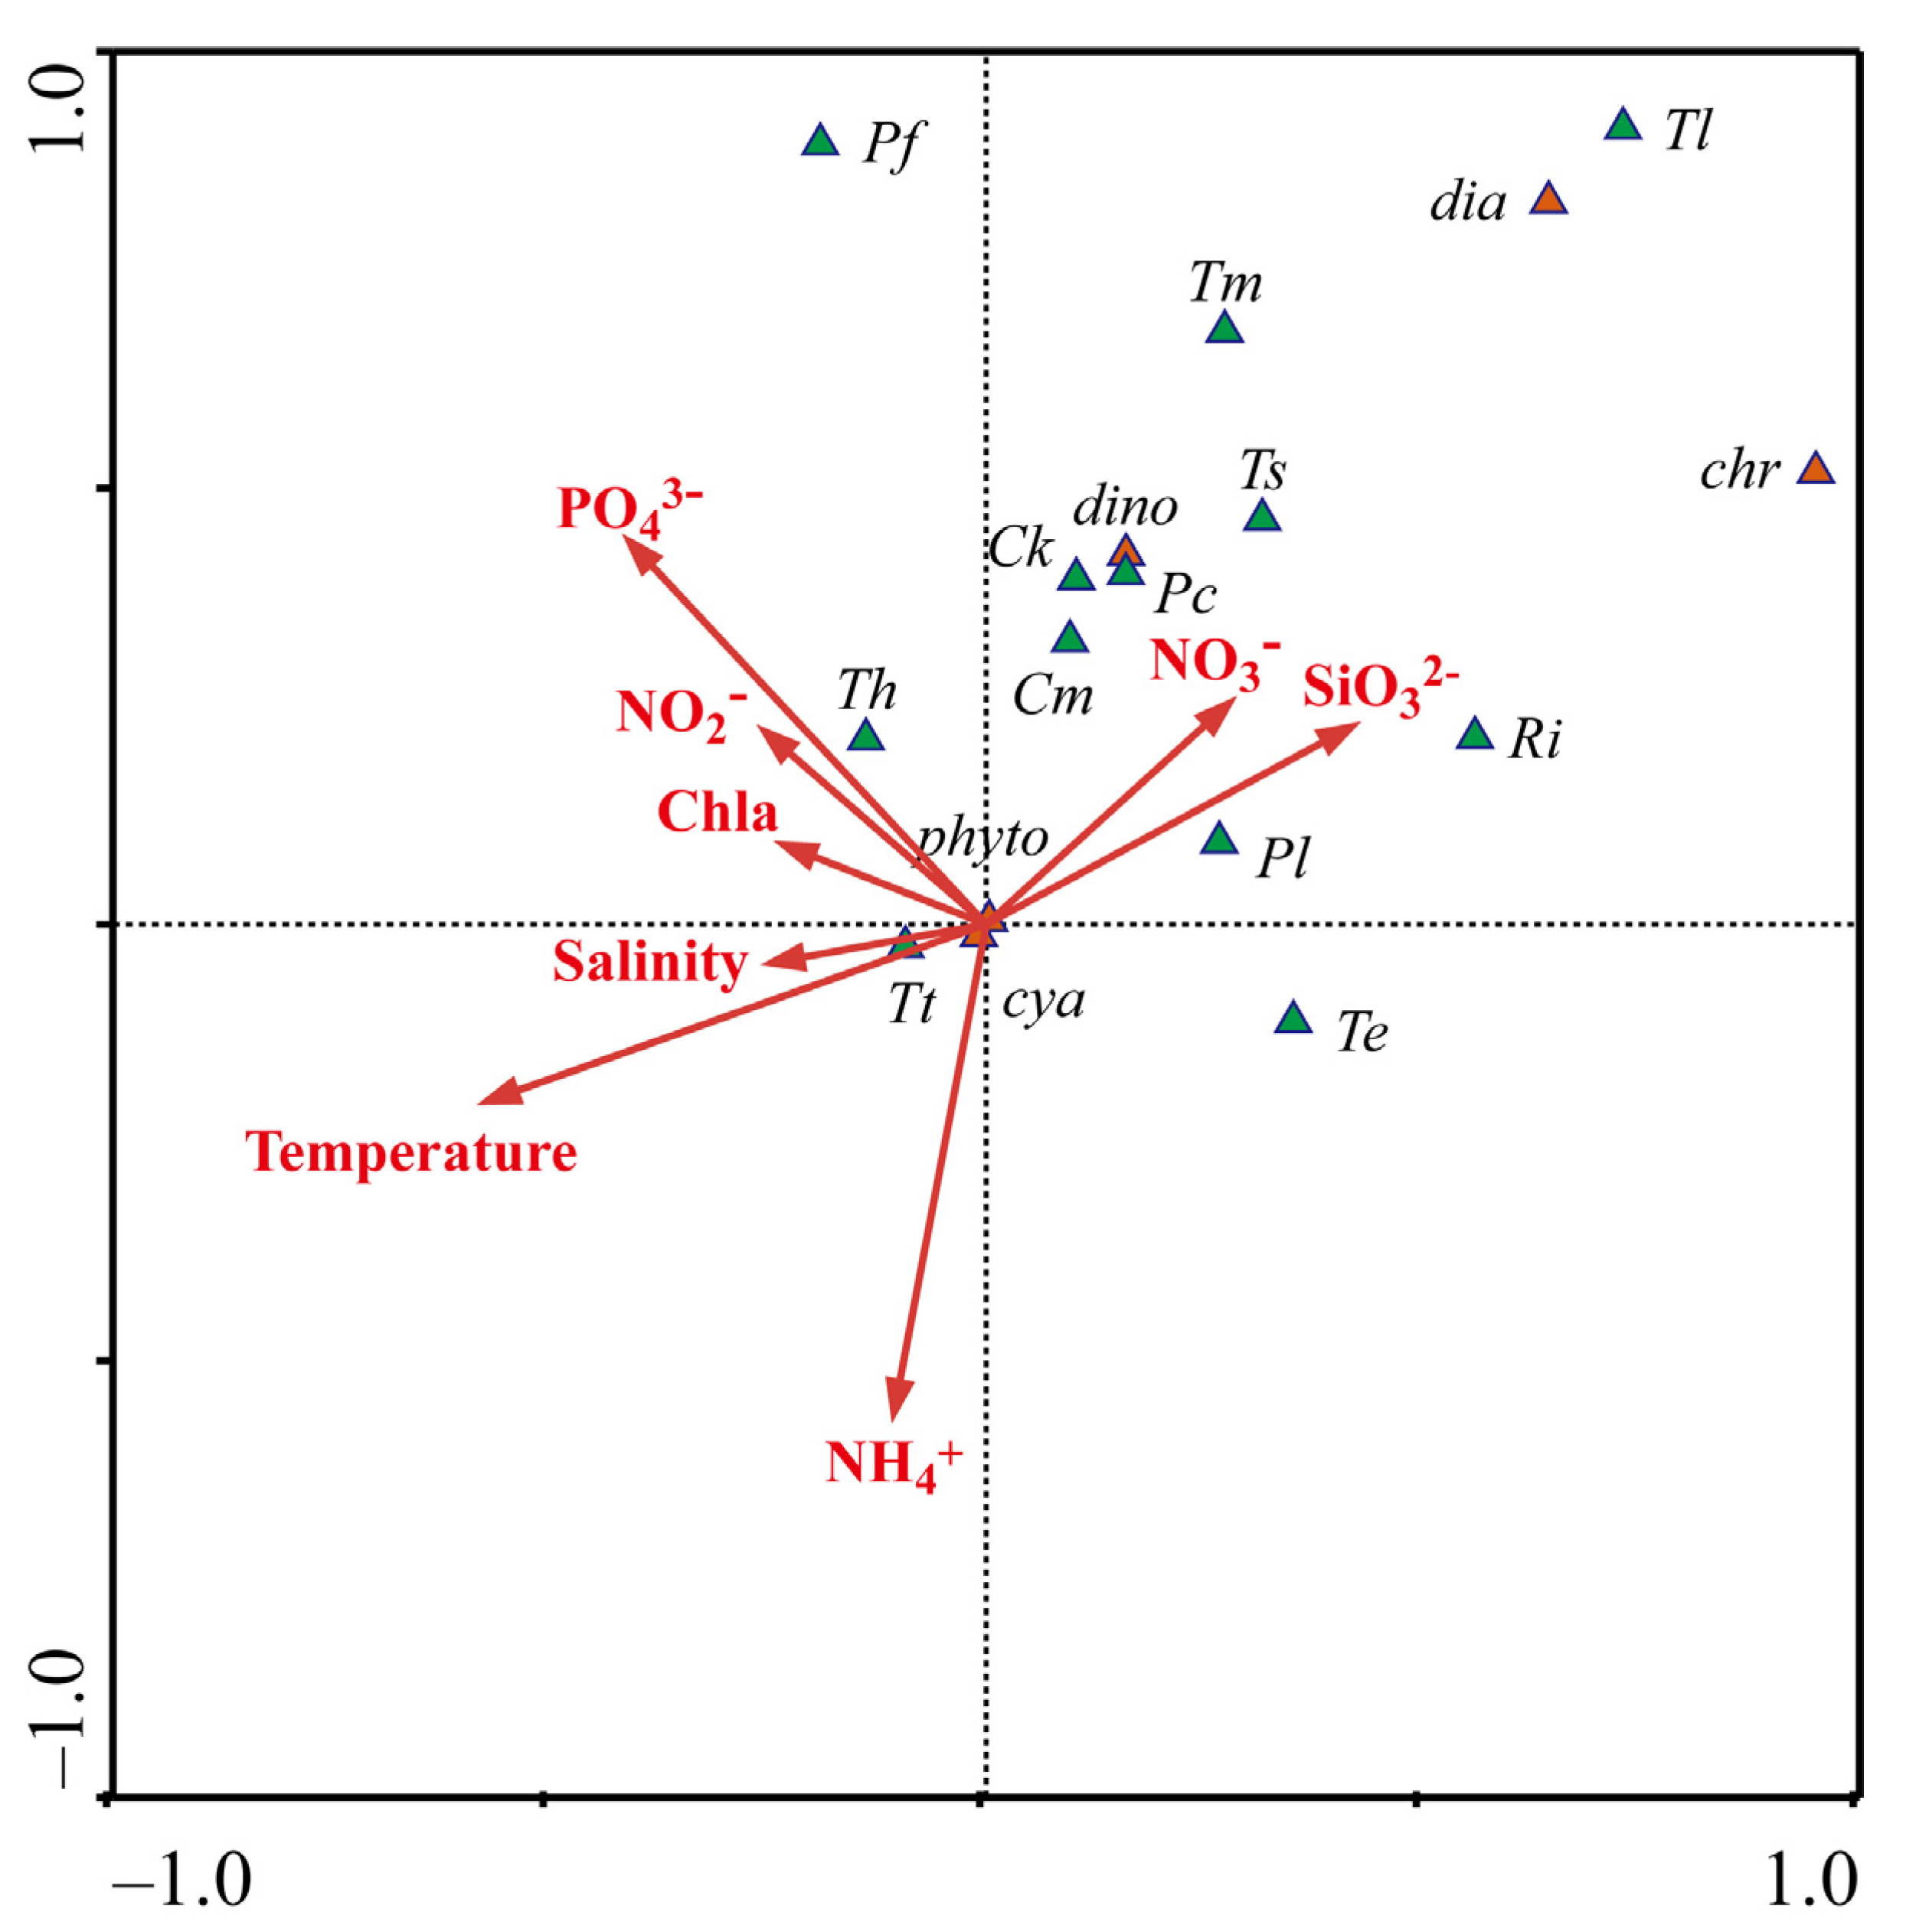
The influence of environmental factors on the phytoplankton community structure in the WPO was assessed using Pearson′s correlation (Figure 6) and CCA analysis (Figure 7). The phytoplankton community in the region was significantly influenced by environmental factors. Phytoplankton cell abundance was extremely significantly correlated with cyanobacteria (p < 0.001), indicating that cyanobacteria are the main component of phytoplankton in this survey area. Diatom was extremely significantly correlated with phosphate and nitrate (p < 0.01) and was also significantly correlated with silicate and nitrite (p < 0.05). This shows that the abundance of diatom is more affected by nutrients. There was a significant correlation between dinoflagellate and temperature (p < 0.05), and temperature plays an important role in the growth of dinoflagellate. Different dominant species had different responses to the aquatic environment. The abundance of T. erythraeum, P. compressum, C. marginato-linetus, and P. Leniculatum were positively correlated with nitrates and silicates concentration. The abundance of P. foromsa, T. hildebrandtii were positively correlated with phosphate and nitrite concentration.
4. Discussion
4.1. Hydrological Conditions and Corresponding Phytoplankton Community Structure
The study spanned five different hydrological characteristics distributed across the 40° N to equatorial cross-section, Kuroshio region, subtropical gyre, transitional zone, warm pool, and equator region [26,27,28,29]. The difference in salinity between the surface water in the transition zone and the Subsurface Chlorophyll Maximum (SCM) confirms the existence of positive precipitation budget phenomenon in this area [30]. However, at higher resolution, neither phytoplankton species richness nor species distribution can be strictly distinguished by hydrological characteristics (Figure 4 and Figure 5). On the contrary, according to the results obtained in this study, phytoplankton species composition and abundance tend to change gradually along the cross-section, resulting in some transition zones between different hydrological characteristics. For example, from the Kuroshio area to the transition area, nutrient conditions gradually changed to oligotrophic conditions, and correspondingly, the phytoplankton abundance gradually decreased [31]. The composition and abundance of phytoplankton community also changed spatially. Although some mesoscale vortexes and secondary mesoscale gyres may cause instability in local water bodies, this spatial distribution of diatoms occurs when nutrient gradients are kept changing along latitudes for a certain period. However, phytoplankton gradual adaptation to oligotrophic conditions depends on the species composition of diatoms and dinoflagellates [32,33,34].
In addition to changes in phytoplankton abundance between different hydrological characteristics, variations in diatoms and dinoflagellates abundance within the same hydrological characteristics were also found (Figure 4 and Figure 5), suggesting that mesoscale circulation could play an important role in phytoplankton distribution [35]. Due to their poor activity and high potential growth rate, diatoms can reproduce rapidly in circulation and in water with high nutrient content. However, the disadvantage of poor mobility comes with its advantage. The circulation can not only bring new nutrient supplements, but also enable diatoms to distribute evenly in the sea area with strong circulation [36]. This also explains the high diatom abundance in Group A under the influence of NGCC. In fact, dinoflagellates are more susceptible to circulations and vortices, and the more violent the circulations and vortices are, the more their growth is inhibited [37]. The effects of circulations and vortices on dinoflagellates include inhibition of cell division, destruction of cell morphology, and inhibition of nutrient transport [38]. The characteristics of high temperature, high salinity, and high flow rate in the Kuroshio area exactly inhibited the abundance of dinoflagellates in this area, which was consistent with the previous research results [39].
4.2. Distribution of Trichodesmium
In the present study, Trichodesmium was the dominant cyanobacteria species. Marine Trichodesmium has been considered the most critical autotrophic nitrogen-fixing cyanobacteria since the 1960s [40]. Trichodesmium can be divided into two forms: clusters and free filaments. Trichodesmium is suitable for living in waters above 20 °C and has a special cellular air sac structure that allows it to move vertically within the upper 100 m of the ocean water column [41]. In the process of water bloom formation by Trichodesmium, a large amount of nitrogen is often fixed in a relatively short period of time. Therefore, the study of the nitrogen fixation rate of Trichodesmium is crucial for estimating the rate of nitrogen fixation in the ocean [42]. Trichodesmium is an important nitrogen-fixing organism in the ocean and a major contributor to the new productivity of the oligotrophic sea area [43]. The abundance of Trichodesmium in the tropical oligotrophic sea area is an issue of great concern [44].
In this study, cyanobacteria bloom was observed near New Guinea. The discovery of high abundance of Trichodesmium near the coast is consistent with the results of Campbell [45]. However, until now, it has not been clear how environmental factors control the latitude distribution of Trichodesmium. According to our results, temperature has an impact on the spatial distribution of Trichodesmium, which is similar to previous observations of tropical and subtropical oceans [46,47]. The optimum temperature for the growth and nitrogen fixation of Trichodesmium was between 20 °C and 30 °C. Our results show that there was a positive correlation between temperature and Trichodesmium abundance (Figure 6).
At present, there have been reports on the abundances of other oligotrophic salts in the oceanic region: Bonnet found that Trichodesmium has the highest abundance of trichomes L−1 (1.85) in the equatorial WPO [48]; Zhang [49] found that the average abundances of Trichodesmium in the central, eastern, and southern Indian Ocean were 1.76, 0.87 and 1.52, respectively. Therefore, this study investigates the high abundance of Trichodesmium, which is consistent with previous studies. Previous studies have not clarified which factors are the main causes of Trichodesmium growth (possibly temperature, wind, iron, phosphorus, etc.) [50,51]. Many researchers believe that temperature is the most important factor affecting the growth of Trichodesmium [52]. However, we believe that there is no single positive correlation between temperature and Trichodesmium growth, which is consistent with the study by Chang [50]. In the tropical WPO, where the temperature was not restricted, Group A had the highest temperature, but the abundance of Trichodesmium in Group A was not the highest. The highest value of Trichodesmium was in Group C, which had the second-highest temperature (Table 3, Figure 5). The cluster analysis divided the five groups according to the abundance of phytoplankton, which was consistent with the currents (Figure 3). We believe that marine physical processes such as circulation and hydrological characteristics have a profound impact on the spatial distribution of phytoplankton in the WPO.
4.3. Dominant Species and Their Preferred Environmental Factors
The conditions suitable for phytoplankton are often different from one community to another and even from one species to another. Comparing the dominant phytoplankton species of five groups, we conclude that P. leniculatum was the dominant species in the study area. P. leniculatum belongs to Dinophyta, and it is widely distributed in the world, including the Pacific Ocean, the Indian Ocean, the waters near Madagascar, and the Andaman Sea [53]. In the study area, the abundance of P. leniculatum in Group B was the lowest, which was affected by STCC, and it had the lowest average nutrient concentration. CCA analysis showed that P. leniculatum in Group B had a positive correlation with nitrate and silicate. Different from others, C. kofoidii was distributed evenly and had a high abundance in the whole study area. C. kofoidii reached the highest abundance in Group B, which was critically affected by Pacific Subtropical gyre. Atmospheric nitrogen fixation in the ocean is an important source of new nitrogen in the surface waters, which stimulates phytoplankton productivity and provides fuel for biological pumps. Trichodesmium is the main group responsible for marine nitrogen fixation in tropical waters [42]. The R. intracellularis has been shown to provide significant nitrogen input to the ocean on a regional scale [54]. The results of this study show that R. intracellularis was not observed in the equatorial region, while there was a high abundance in the region of transitional zone and the Kuroshio region. CCA analysis showed that R. intracellularis prefers to bloom in areas with higher nitrate and silicate.
5. Conclusions
This study investigated phytoplankton community structure in the WPO in 2017 and revealed the spatial variability of phytoplankton in community composition and abundance, as well as their relationship with physical ocean processes and environmental factors. A total of 332 species of phytoplankton were identified in this survey. The highest abundance of phytoplankton was found in the NECC and equatorial regions. Trichodesmium was widely distributed in the study area and reached the peak in WPWP, dinoflagellates were mainly affected by temperature, and diatoms were significantly correlated with nutrients (phosphate, nitrate, silicate, and nitrite). Phytoplankton were divided into five groups by cluster analysis, and the distribution of different groups was related to circulation and hydrological characteristics. These results show that physical ocean processes such as circulation and hydrological characteristics have a profound influence on the spatial distribution of phytoplankton. Different currents divide phytoplankton into different groups in space. In this investigation, we found that not only temperature and nutrient salinity, but also currents and water mass movements, affect the distribution of phytoplankton communities in the WPO. Despite the baseline data and information provided by this study, the phytoplankton of the WPO remain a mystery to us, especially the distribution of phytoplankton throughout the water column and eddies. Therefore, more long-term community studies are needed to further explore the role of phytoplankton in the marine biogeochemistry of the WPO.
Author Contributions
Conceptualization, J.S.; Data curation, Z.C.; Formal analysis, Z.C.; Funding acquisition, J.S.; Investigation, Z.C. and D.C.; Resources, D.C., S.W., H.Y., H.C., M.W. and J.S.; Supervision, J.S.; Writing—original draft, Z.C.; Writing—review and editing, J.S. All authors have read and agreed to the published version of the manuscript.
Funding
This research was supported by the National Key Research and Development Project of China (2019YFC1407805), the National Natural Science Foundation of China (41876134, 41676112, and 41276124), the Tianjin 131 Innovation Team Program (20180314), and the Changjiang Scholar Program of Chinese Ministry of Education (T2014253) through grants to Jun Sun.
Institutional Review Board Statement
Not applicable.
Data Availability Statement
All data are available from the authors upon request.
Acknowledgments
We thank all the members of Dongfanghong 2 for supporting and securing our scientific investigation on this cruise. Thanks to the CTD data provided by Jiwei Tian ’s team at Ocean University of China.
Conflicts of Interest
The authors declare no conflict of interest.
References
- Sun, J. Marine phytoplankton and biological carbon sink. Acta Ecol. Sin. 2011, 31, 5372–5378. [Google Scholar]
- Wang, Y.; Kang, J.; Ye, Y.; Lin, G.; Yang, Q.; Lin, M. Phytoplankton community and environmental correlates in a coastal upwelling zone along western Taiwan Strait. J. Mar. Syst. 2016, 154, 252–263. [Google Scholar] [CrossRef]
- Ahmed, A.; Kurian, S.; Gauns, M.; Chndrasekhararao, A.V.; Mulla, A.; Naik, B.; Naik, H.; Naqvi, S.W.A. Spatial variability in phytoplankton community structure along the eastern Arabian Sea during the onset of south-west monsoon. Cont. Shelf Res. 2016, 119, 30–39. [Google Scholar] [CrossRef]
- Okazaki, Y.; Nakata, H.; Kimura, S. Effects of frontal eddies on the distribution and food availability of anchovy larvae in the Kuroshio Extension. Mar. Freshw. Res. 2002, 53, 403. [Google Scholar] [CrossRef]
- Moita, M.T.; Pazos, Y.; Rocha, C.; Nolasco, R.; Oliveira, P.B. Toward predicting Dinophysis blooms off NW Iberia: A decade of events. Harmful Algae 2016, 53, 17–32. [Google Scholar] [CrossRef] [Green Version]
- Wang, F.; Zhang, P.; Hu, D.X.; Seidel, H. Tropical Western Pacific circulation and seasonal changes. Sci. Bull. 2001, 46, 1998–2002. [Google Scholar] [CrossRef]
- Gordon, A.L.; Fine, R.A. Pathways of water between the Pacific and Indian oceans in the Indonesian seas. Nature 1996, 379, 146–149. [Google Scholar] [CrossRef]
- Yan, X.H.; Ho, C.R.; Zheng, Q.; Klemas, V. Temperature and size variabilities of the Western Pacific Warm Pool. Science 1992, 258, 1643–1645. [Google Scholar] [CrossRef]
- Kawarada, Y. Distribution of plankton in the waters neighboring Japan in 1966 (CSK). Oceanogr. Mag. 1968, 20, 187–212. [Google Scholar]
- Shiro, F. Illustrations of the Kuroshio-Waters; Chang Qi Publishing Culture Association: Hunan, China, 1990; pp. 1–170. [Google Scholar]
- Sun, J.; Liu, D.Y.; Qian, S.B. Planktonic diatoms in the Ryukyu Islands and adjacent waters-species composition and abundance distribution in summer 1997. In Chinese Oceanographic Anthology (II); Ocean University of China: Qingdao, China, 2000; pp. 170–182. (In Chinese) [Google Scholar]
- Liu, D.Y.; Sun, J.; Qian, S.B. Planktonic dinoflagellates in the Ryukyu Islands and adjacent waters-species composition and abundance distribution in summer 1997. In Chinese Oceanographic Anthology (II); Ocean University of China: Qingdao, China, 2000; pp. 158–169. (In Chinese) [Google Scholar]
- Chen, Y.; Sun, X.; Zhu, M.; Zheng, S.; Yuan, Y.; Denis, M. Spatial variability of phytoplankton in the Pacific western boundary currents during summer 2014. Mar. Freshw. Res. 2017, 68, 1887–1900. [Google Scholar] [CrossRef]
- Chen, Z.; Sun, J.; Zhang, G.C. Netz-phytoplankton community structure of the tropical Western Pacific Ocean in summer 2016. Mar. Sci. 2018, 42, 114–130. (In Chinese) [Google Scholar] [CrossRef]
- Sun, J.; Liu, D.Y. A quantative research and analysis method for marine phytoplankton: An introduction to Utermöhl method and Its modification. Adv. Mar. Sci. 2002, 20, 105–112. [Google Scholar] [CrossRef]
- Jin, D.X.; Chen, J.H. Chinese Marine Planktonic Diatoms; Shanghai Scientific & Technical Press: Shanghai, China, 1965; pp. 1–230. [Google Scholar]
- Isamu, Y. Illustrations of the Marine Plankton of Japan; Hoikusha Press: Tokyo, Japan, 1991; pp. 1–158. [Google Scholar]
- Sun, J.; Liu, D.Y. The Preliminary Notion on Nomenclature of Common Phytoplankton in China Sea Waters. Oceanol. Limnol. Sin. 2002, 33, 271–286. [Google Scholar] [CrossRef]
- Ehrhardt, M.A.; Kremling, K.; Almgren, T.; Grasshoff, K.M. Methods of seawater analysis. Chemie 1976. [Google Scholar] [CrossRef]
- Dai, M.; Wang, L.; Guo, X.; Zhai, W.; Li, Q.; He, B.; Kao, S.J. Nitrification and inorganic nitrogen distribution in a large perturbed river/estuarine system: The Pearl River estuary, China. Biogeosciences 2008, 5, 1227–1244. [Google Scholar] [CrossRef] [Green Version]
- Lorenzen, C.J. A method for the continuous measurement of in vivo chlorophyll concentration. Deep-Sea Res. Oceanogr. Abstr. 1966, 13, 223–227. [Google Scholar] [CrossRef]
- Hu, D.X.; Wu, L.X.; Cai, W.J.; Gupta, A.S.; Ganachaud, A.; Qiu, B.; Gordon, A.L.; Lin, X.P.; Chen, Z.H.; Shijian Hu, S.J.; et al. Pacific western boundary currents and their roles in climate. Nature 2015, 522, 299–308. [Google Scholar] [CrossRef]
- Lukas, R.; Firing, E.; Hacker, P.; Richardson, P.L.; Collins, C.A.; Fine, R.; Gammon, R. Observations of the Mindanao Current during the western equatorial Pacific Ocean circulation study. J. Geophys. Res. Oceans 1991, 96, 7089–7104. [Google Scholar] [CrossRef]
- Zhu, J.; Zheng, Q.N.; Hu, J.Y.; Lin, H.Y.; Chen, D.W.; Chen, Z.Z.; Sun, Z.Y.; Li, L.Y.; Kong, H. Classification and 3-D distribution of upper layer water masses in the northern South China Sea. Acta Oceanol. Sin. 2019, 38, 126–135. [Google Scholar] [CrossRef]
- Oksanen, J.F.; Blanchet, F.G.; Friendly, M.; Kindt, R.; Legendre, P.; McGlinn, D.; Minchin, P.R.; O’ Hara, R.B.; Simpson, G.L.; Solymos, P.; et al. Vegan: Community Ecology Package. Available online: https://cran.r-project.org/web/packages/vegan/index.html (accessed on 20 August 2021).
- Cravatte, S.; Delcroix, T.; Zhang, D.; Mcphaden, M.; Leloup, J. Observed freshening and warming of the western Pacific Warm Pool. Clim. Dyn. 2009, 33, 565–589. [Google Scholar] [CrossRef]
- Kitajima, S.; Furuya, K.; Hashihama, F.; Takeda, S.; Kanda, J. Latitudinal distribution of diazotrophs and their nitrogen fixation in the tropical and subtropical western North Pacific. Limnol. Oceanogr. 2009, 54, 537–547. [Google Scholar] [CrossRef]
- Sekine, Y.; Miyamoto, S. Influence of Kuroshio Flow on the Horizontal Distribution of North Pacific Intermediate Water in the Shikoku Basin. J. Oceanogr. 2002, 58, 611–616. [Google Scholar] [CrossRef]
- Xie, L.; Tian, J.; Hu, D.X.; Wang, F. A quasi-synoptic interpretation of water mass distribution and circulation in the western North Pacific II: Circulation. Chin. J. Oceanol. Limnol. 2009, 27, 630–639. [Google Scholar] [CrossRef]
- Lukas, R.; Lindstrom, E. The mixed layer of the western equatorial Pacific Ocean. J. Geophys. Res. Oceans 1991, 96, 3343. [Google Scholar] [CrossRef]
- Mathias, G.; Hisayuki, A.; Fuminori, H. Phosphorus stress of microphytoplankton community in the western subtropical North Pacific. J. Plankton Res. 2013, 35, 146–157. [Google Scholar] [CrossRef] [Green Version]
- Jeong, H.J.; Yoo, T.D.; Kim, J.S.; Seong, K.A.; Kang, N.S.; Kim, T.H. Growth, feeding and ecological roles of the mixotrophic and heterotrophic dinoflagellates in marine planktonic food webs. Ocean Sci. J. 2010, 45, 65–91. [Google Scholar] [CrossRef] [Green Version]
- Greta, B.; Fabio, R.J.V.; Alberto, A.; Eric, P.; Pierella, K.; Ferrante, M.I.; Patrick, W.; Alessandra, R.; Chris, B.; Remo, S.; et al. Meta-omics reveals genetic flexibility of diatom nitrogen transporters in response to environmental changes. Mol. Biol. Evol. 2019, 11, 2522–2535. [Google Scholar] [CrossRef] [Green Version]
- Luigi, C.; Quentin, C.; Damien, E.; Amos, K.; Eric, P.; Juan, J.P.K.; Fabio, R.J.V.; Emilie, V.; Samuel, C.; Shruti, M.; et al. Community-Level Responses to Iron Availability in Open Ocean Plankton Ecosystems. Glob. Biogeochem. Cycles 2019, 33, 391–419. [Google Scholar] [CrossRef]
- Girault, M.; Arakawa, H.; Barani, A.; Ceccaldi, H.J.; Gregori, G. Distribution of ultraphytoplankton in the western part of the North Pacific subtropical gyre during a strong La Niña condition: Relations with the hydrological conditions. Biogeosciences 2013, 10, 5947–5965. [Google Scholar] [CrossRef] [Green Version]
- Estrada, M.; Berdalet, E. Phytoplankton in a turbulent world. Sci. Mar. 1997, 61, 125–140. [Google Scholar] [CrossRef]
- Thomas, W.H.; Gibson, C.H. Quantified small-scale turbulence inhibits a red tide dinoflagellate, Gonyaulax polyedra Stein. Deep. Sea Res. Part. A Oceanogr. Res. Pap. 1990, 37, 1583–1593. [Google Scholar] [CrossRef]
- Smayda, T.J. Harmful algal blooms: Their ecophysiology and general relevance to phytoplankton blooms in the sea. Limnol. Oceanogr. 1997, 42, 1137–1153. [Google Scholar] [CrossRef]
- Sullivan, J.M.; Swift, E.; Donaghay, P.L.; Rines, J.E.B. Small-scale turbulence affects the division rate and morphology of two red-tide dinoflagellates. Harmful Algae 2003, 2, 183–199. [Google Scholar] [CrossRef]
- Dugdale, R.C.; Menzel, D.W.; Ryther, J.H. Nitrogen fixation in the Sargasso Sea. Deep Sea Res. 1961, 7, 297–300. [Google Scholar] [CrossRef]
- Laroche, J.; Breitbarth, E. Importance of the diazotrophs as a source of new nitrogen in the ocean. J. Sea Res. 2005, 53, 67–91. [Google Scholar] [CrossRef]
- Karl, D.; Michaels, A.; Bergman, B.; Capone, D.; Carpenter, E.; Letelier, R.; Lipschultz, F.; Paerl, H.; Sigman, D.; Stal, L. Dinitrogen fixation in the world’s oceans. Biogeochemistry 2002, 57–58, 47–98. [Google Scholar] [CrossRef]
- Toby, T.; Emilio, M.; Poulton, A.J.; Bowie, A.R.; Harbour, D.S.; Woodward, E.M.S. Large-scale latitudinal distribution of Trichodesmium spp. in the Atlantic Ocean. J. Plankton Res. 2003, 58, 405–416. [Google Scholar] [CrossRef]
- Capone, D.G.; Zehr, J.P.; Paerl, H.W.; Bergman, B.; Carpenter, E.J. Trichodesmium, a Globally Significant Marine Cyanobacterium. Science 1997, 276, 1221–1229. [Google Scholar] [CrossRef] [Green Version]
- Campbell, L.; Carpenter, E.J.; Montoya, J.P.; Kustka, A.B.; Capone, D.G. Picoplankton community structure within and outside a Trichodesmium bloom in the southwestern Pacific Ocean. Vie Milieu 2005, 55, 185–195. [Google Scholar]
- Stal, L.J.; Severin, I.; Bolhuis, H. The Ecology of Nitrogen Fixation in Cyanobacterial Mats; Springer: New York, NY, USA, 2010; Volume 675, pp. 31–45. [Google Scholar] [CrossRef]
- Zehr, J.P.; Ward, B.B. Nitrogen Cycling in the Ocean: New Perspectives on Processes and Paradigms. Appl. Environ. Microbiol. 2002, 68, 1015–1024. [Google Scholar] [CrossRef] [Green Version]
- Bonnet, S.; Biegala, I.C.; Dutrieux, P.; Slemons, L.O.; Capone, D.G. Nitrogen fixation in the western equatorial Pacific: Rates, diazotrophic cyanobacterial size class distribution, and biogeochemical significance. Glob. Biogeochem. Cycles 2009, 23, 45–62. [Google Scholar] [CrossRef] [Green Version]
- Zhang, D.S.; Wang, C.S.; Wang, X.G.; Liu, Z.S.; Gao, X.H. The large-scale distribution of Trichodesmium in the tropical and subtropical Pacific Ocean and the southern Indian Ocean. Acta Oceanol. Sin. 2010, 32, 148–154. [Google Scholar] [CrossRef]
- Chang, J.; Chiang, K.P.; Gong, G.C. Seasonal variation and cross-shelf distribution of the nitrogen-fixing cyanobacterium, Trichodesmium, in southern East China Sea. Cont. Shelf Res. 2000, 20, 479–492. [Google Scholar] [CrossRef]
- Karl, D.M.; Tien, G. Temporal variability in dissolved phosphorus concentrations in the subtropical North Pacific Ocean. Mar. Chem. 1997, 56, 77–96. [Google Scholar] [CrossRef]
- Capone, D.; Carpente, E. Nitrogen fixation by marine cyanobacteria: Historical and global perspectives. Bull. Linstitut Océanogr. 1999, 19, 235–256. [Google Scholar]
- Polat, S.; Koray, T. Planktonic dinoflagellates of the northern Levantine Basin, northeastern Mediterranean Sea. Eur. J. Protistol. 2007, 43, 193–204. [Google Scholar] [CrossRef] [PubMed]
- Carpenter, E.J.; Montoya, J.P.; Burns, J.A.; Mulholland, M.R.; Capone, D.G. Extensive bloom of a N2-fixing diatom/cyanobacterial association in the Tropical Atlantic Ocean. Mar. Ecol. Prog. Ser. 1999, 185, 273–283. [Google Scholar] [CrossRef] [Green Version]
Figure 1.
Study area and locations of the sampling stations in the WPO. Map of the WPO shows the major geographic names and the surface currents, including the Kuroshio Current (KC), the Subtropical Counter Current (STCC), the North Equatorial Current (NEC), the Northern Equatorial Counter Current (NECC), and the New Guinea Coastal Current (NGCC) [22,23].

Figure 2.
Horizontal distribution of phytoplankton abundance in the WPO. (a) Phytoplankton cell abundance of four-phyla (cells m−3); (b) phytoplankton cell abundance of diatoms and dinoflagellates (cells m−3); (c) phytoplankton cell abundance of Trichodesmium (trichomes m−3); (d) dominant species abundance (cells m−3).

Figure 3.
Location of the different phytoplankton groups in the WPO.

Figure 4.
The temperature profiles of the upper 200 m at the survey stations to distinguish the five groups (Group A–E).
Figure 4.
The temperature profiles of the upper 200 m at the survey stations to distinguish the five groups (Group A–E).

Figure 5.
Species composition and changes between groups of phytoplankton in the WPO. (a) The cell abundance ratio of the four-phyla phytoplankton in each group; (b) The cell abundance (cells m−3) of the four-phyla phytoplankton in each group.
Figure 5.
Species composition and changes between groups of phytoplankton in the WPO. (a) The cell abundance ratio of the four-phyla phytoplankton in each group; (b) The cell abundance (cells m−3) of the four-phyla phytoplankton in each group.

Figure 6.
Pearson′s correlation between phytoplankton and environmental factors. Samples number: n = 63, * For p < 0.05, ** for p < 0.01, *** for p < 0.001. Temp.: temperature; Sali.: salinity; Diat.: Diatom; Dino.: Dinoflagellate; Cyan.: Cyanobacteria; Chry.: Chrysophyceae; NO3−: nitrate; NO2−: nitrite, NH4+: ammonium, PO43−: phosphate, and SiO32−: silicate.

Figure 7.
Canonical Correlation Analysis of the dominant phytoplankton species and environmental factors in the surface layer in the WPO during autumn, 2017. dia: diatoms; dino: dinoflagellates; cya: cyanobacteria; chr: chrysophyceae; Tt: Trichodesmium thiebautii; Te: Trichodesmium erythraeum; Th: Trichodesmium hildebrandtii; Ck: Ceratium kofoidii; Pl: Prorocentrum leniculatum; Ri: Richelia intracellularis; Pf: Planktoniella foromsa; Cm: Coscinodiscus marginato-lineatus; Ts: Thalassiosira subtilis; Pc: Prorocentrum compressum; Tl: Thalassiothrix longissima; Tm: Thalassiosira minima.


Table 1.
The numbers of phytoplankton species and genera in the WPO.
| Phylum | Genera | Species | Ratio of Richness (%) |
|---|---|---|---|
| Bacillariophyta | 37 | 105 | 31.63 |
| Dinophyta | 28 | 221 | 66.57 |
| Cyanophyta | 2 | 4 | 1.20 |
| Chrysophyta | 1 | 2 | 0.60 |
Table 2.
Dominant phytoplankton species in the WPO.
| Species | Percentage (%) | Frequency (fi) | Dominance (Y) | Maximum (103 Cells m−3) | Average (103 Cells m−3) | Maximum Stations |
|---|---|---|---|---|---|---|
| T. thiebautii | 65.67 | 0.952 | 0.6254 | 8895.529 | 374.425 | A35 |
| Trichodesmium erythraeum | 19.46 | 0.889 | 0.1730 | 2128.430 | 110.979 | A36 |
| Trichodesmium hildebrandtii | 12.07 | 0.746 | 0.0900 | 2782.329 | 68.807 | A35 |
| C. kofoidii | 0.18 | 0.952 | 0.0017 | 5.619 | 1.037 | A28 |
| Prorocentrum leniculatum | 0.15 | 1.000 | 0.0015 | 3.300 | 0.845 | A36 |
| Richelia intracellularis | 0.14 | 0.698 | 0.0010 | 7.947 | 0.805 | A24 |
| P. foromsa | 0.12 | 0.794 | 0.0010 | 13.276 | 0.688 | B19 |
| Coscinodiscus marginato-lineatus | 0.10 | 0.968 | 0.0009 | 2.844 | 0.542 | B18 |
| Thalassiosira subtilis | 0.09 | 0.968 | 0.0009 | 3.433 | 0.512 | B07 |
| Prorocentrum compressum | 0.08 | 1.000 | 0.0007 | 1.836 | 0.425 | B07 |
| T. longissima | 0.08 | 0.937 | 0.0007 | 6.542 | 0.445 | B18 |
| Thalassiosira minima | 0.07 | 1.000 | 0.0007 | 2.540 | 0.415 | B19 |
Table 3.
Average (± standard deviations) values for nutrients (μmol L−1), temperature (°C), salinity, and chlorophyll a (μg L−1) for each phytoplankton community group identified by the cluster analysis in the WPO.
Table 3.
Average (± standard deviations) values for nutrients (μmol L−1), temperature (°C), salinity, and chlorophyll a (μg L−1) for each phytoplankton community group identified by the cluster analysis in the WPO.
| Group A | Group B | Group C | Group D | Group E | |
|---|---|---|---|---|---|
| PO43− | 0.37 ± 0.07 | 0.13 ± 0.08 | 0.27 ± 0.10 | 0.16 ± 0.06 | 0.13 ± 0.05 |
| NO2− | 0.23 ± 0.12 | 0.05 ± 0.01 | 0.12 ± 0.04 | 0.06 ± 0.01 | 0.09 ± 0.02 |
| NO3− | 2.66 ± 0.87 | 0.70 ± 0.52 | 2.15 ± 1.07 | 2.06 ± 0.79 | 0.66 ± 0.47 |
| NH4+ | 0.87 ± 0.21 | 1.32 ± 0.43 | 1.51 ± 0.56 | 0.86 ± 0.09 | 1.49 ± 0.62 |
| SiO32− | 1.83 ± 0.29 | 2.00 ± 0.17 | 2.23 ± 1.07 | 2.62 ± 0.60 | 1.57 ± 0.45 |
| temperature | 28.24 ± 0.45 | 23.50 ± 0.46 | 27.29 ± 1.49 | 22.72 ± 1.08 | 26.89 ± 1.48 |
| salinity | 35.06 ± 0.18 | 34.98 ± 0.11 | 34.54 ± 0.24 | 34.80 ± 0.08 | 34.62 ± 0.31 |
| chl a | 0.41 ± 0.11 | 0.27 ± 0.46 | 0.34 ± 0.08 | 0.31 ± 0.08 | 0.27 ± 0.08 |
Table 4.
List of phytoplankton community group characteristics (average ± standard deviations) identified by cluster analysis in the WPO.
Table 4.
List of phytoplankton community group characteristics (average ± standard deviations) identified by cluster analysis in the WPO.
| Group A | Group B | Group C | Group D | Group E | |
|---|---|---|---|---|---|
| Phytoplankton | 211,796 ± 129,387 | 91,379 ± 60,250 | 1,454,796 ± 3,127,957 | 175,003 ± 211,356 | 77,120 ± 101,440 |
| Diatoms | 12,176 ± 12,454 | 4188 ± 2124 | 6664 ± 3171 | 8109 ± 2944 | 4022 ± 1794 |
| Dinoflagellates | 9820 ± 7323 | 6136 ± 2530 | 7306 ± 2106 | 5748 ± 3264 | 5834 ± 3357 |
| Cyanobacteria | 189,548 ± 114,153 | 80,735 ± 55,865 | 1,440,161 ± 3,126,653 | 160,503 ± 210,271 | 67,168 ± 100,680 |
| Chrysophyceae | 252 ± 268 | 321 ± 496 | 665 ± 560 | 643 ± 361 | 96 ± 157 |
| T. thiebautii | 96,835 ± 102,200 | 44,784 ± 34,253 | 1,093,840 ± 2,302,347 | 23,845 ± 21,450 | 37,684 ± 64,710 |
| T. erythraeum | 37,156 ± 53,088 | 33,982 ± 41,793 | 162,062 ± 292,659 | 119,011 ± 173,439 | 23,111 ± 35,473 |
| T. hildebrandtii | 55,556 ± 49,123 | 1486 ± 2972 | 183,590 ± 649,917 | 15,922 ± 33,384 | 4509 ± 14,216 |
| C. kofoidii | 965 ± 908 | 1312 ± 830 | 1251 ± 921 | 918 ± 1059 | 1261 ± 1652 |
| P. leniculatum | 782 ± 629 | 177 ± 190 | 867 ± 612 | 495 ± 371 | 1443 ± 993 |
| R. intracellularis | 0 ± 0 | 483 ± 278 | 669 ± 690 | 1725 ± 2011 | 1865 ± 2174 |
| P. foromsa | 2389 ± 3473 | 55 ± 52 | 334 ± 261 | 83 ± 58 | 9 ± 16 |
| C. marginato-lineatus | 632 ± 812 | 545 ± 318 | 719 ± 583 | 259 ± 255 | 519 ± 434 |
| T. subtilis | 705 ± 978 | 473 ± 223 | 598 ± 498 | 536 ± 685 | 199 ± 163 |
| P. compressum | 524 ± 448 | 373 ± 388 | 482 ± 403 | 266 ± 183 | 428 ± 353 |
| T. longissima | 988 ± 1594 | 64 ± 63 | 388 ± 377 | 230 ± 110 | 65 ± 99 |
| T. minima | 583 ± 679 | 413 ± 309 | 403 ± 426 | 513 ± 306 | 300 ± 209 |
Publisher’s Note: MDPI stays neutral with regard to jurisdictional claims in published maps and institutional affiliations. |
© 2021 by the authors. Licensee MDPI, Basel, Switzerland. This article is an open access article distributed under the terms and conditions of the Creative Commons Attribution (CC BY) license (https://creativecommons.org/licenses/by/4.0/).
Share and Cite
MDPI and ACS Style
Chen, Z.; Sun, J.; Chen, D.; Wang, S.; Yu, H.; Chen, H.; Wang, M. Effects of Ocean Currents in the Western Pacific Ocean on Net-Phytoplankton Community Compositions. Diversity 2021, 13, 428. https://0-doi-org.brum.beds.ac.uk/10.3390/d13090428
AMA Style
Chen Z, Sun J, Chen D, Wang S, Yu H, Chen H, Wang M. Effects of Ocean Currents in the Western Pacific Ocean on Net-Phytoplankton Community Compositions. Diversity. 2021; 13(9):428. https://0-doi-org.brum.beds.ac.uk/10.3390/d13090428
Chicago/Turabian StyleChen, Zhuo, Jun Sun, Dawei Chen, Shihao Wang, Hao Yu, Hongtao Chen, and Min Wang. 2021. "Effects of Ocean Currents in the Western Pacific Ocean on Net-Phytoplankton Community Compositions" Diversity 13, no. 9: 428. https://0-doi-org.brum.beds.ac.uk/10.3390/d13090428
Note that from the first issue of 2016, this journal uses article numbers instead of page numbers. See further details here.