Article

Relationship between the Microbiome and Indoor Temperature/Humidity in a Traditional Japanese House with a Thatched Roof in Kyoto, Japan

1
Department of Architecture and Architectural Engineering, Graduate School of Engineering, Kyoto University, Kyotodaigaku-Katsura, Nishikyo-ku, Kyoto 615-8540, Japan
2
Office of Industry-Academia-Government and Community Collaboration, Hiroshima University, 1-3-2 Kagamiyama, Higashi-Hiroshima City, Hiroshima 739-8511, Japan
3
Center for HOlobiome and Built Environment (CHOBE), Hiroshima University, Hiroshima 739-8511, Japan
4
Department of Architectural Engineering, Faculty of Engineering, Hiroshima Institute of Technology, 2-1-1 Miyake, Saeki-ku, Hiroshima 731-5193, Japan
5
Faculty of Global Culture, Kyoto Seika University, 137 Iwakura Kinocho, Sakyo-ku, Kyoto 606-8588, Japan
6
Laboratory of Environmental Health Sciences, Department of Veterinary Science, School of Veterinary Medicine, Rakuno Gakuen University, Ebetsu, Hokkaido 069-8501, Japan
*
Authors to whom correspondence should be addressed.
Submission received: 30 August 2021 / Revised: 24 September 2021 / Accepted: 24 September 2021 / Published: 28 September 2021
(This article belongs to the Special Issue Microorganisms of Indoor Environment (Human-Made Environment))

Abstract

:
In our living environment, there are various microorganisms that are thought to affect human health. It is expected that excessive microbial suppression can have a negative effect on human health and that the appropriate control of the microbiome is beneficial to health. To understand how the physical environment, such as temperature and relative humidity, or housing itself affects the microbiome in a rural house, we measured temperature and humidity and collected microbial samples in a traditional Japanese house with a thatched roof. The relative humidity of outdoor air was over 60% most of the day throughout the year. Indoor and outdoor air temperature and humidity were closer to each other in summer than in winter. The DNA concentration of indoor surfaces correlated with the relative humidity, especially with the lowest annual relative humidity. In the thatched roof, outside surface relative humidity often reached 100%, and the occurrence of condensation can affect the DNA concentrations. A high percentage of archaea were detected in the house, which is not a common characteristic in houses. In addition, the microbial community was similar outdoors and indoors or in each room. These characteristics reflect the occupants’ behaviour, including opening the windows and partitions in summer. In the future, it will be necessary to conduct continuous surveys in various houses, including traditional and modern houses, in Japan.

1. Introduction

In modern life, we spend approximately 87% of our time indoors [1], and the impact of the living environment on human health is considered to be significant. Risk management for human health in the field of architecture is mainly based on air quality control, such as temperature/humidity control and dilution of carbon dioxide and VOCs by ventilation, and there has been little investigation from the viewpoint of microbiology in public health. Some studies have been conducted on methods of preventing mould growth and material degradation of exterior walls. Abe et al. evaluated the rate of mould growth in a given location based on temperature and relative humidity data [2]. Another study developed models for predicting mould growth with transient temperature and humidity conditions [3]. There is also a mathematical model for simulating mould growth on wood materials [4]. It is also well known that mould growth can be observed in buildings with dampness or water leaks [5]. It has been shown that condensation and housing characteristics can affect mite allergens [6,7]. Research on bacteria and viruses has focused on specific species, such as pathogens, and suppressing them. For example, the survival rate of influenza viruses is higher at low humidity and low temperature [8,9] and the infection rate is also higher at low humidity and low temperature [10].
Today, the microbiome in the building environment has gained increasing attention [11,12,13]. Recent studies have indicated that excessive microbial suppression may cause increased pathogenic microorganisms. For example, infections caused by antibiotic-resistant pathogens have occurred in hospital ICUs with excellent hygiene [14], and there is a problem of a high incidence of pulmonary nontuberculous mycobacterial disease in Japan [15]. Fujimura et al. showed that exposure to dog-associated house dust altered the gut microbiome of mice and protected them from airway allergens [16]. In the living environment, it has been reported that the risk of childhood asthma is low in non-farm houses where the microbial community is similar to that of farm houses [17]. Previous studies have mainly focused on modern building environments with pathogen related problems, such as in hospitals [18,19,20,21] or schools [22,23]. However, in Japan, there are no examples of investigations of bacterial and fungal communities in building environments using culture independent methods [24].
In the building environment, several factors have been proposed to affect microbial communities, including temperature, relative humidity, air exchange rate, and occupant density [25,26]. In a study of homes with asthmatic children, the use of air conditioners, the presence of pets, and occupants were shown to affect indoor bacterial and fungal communities [27]. Lax et al. found that in hospital rooms, the patient and the microbial community on the room surfaces interacted with each other [19]. They also found that the microbial community on indoor surfaces was influenced by occupants [28]. Danmiller et al. showed that occupant density had a significant effect on bacterial community composition [27]. With regard to building operation methods, Kembel et al. showed that indoor microbial communities change depending on ventilation methods [19]. It has also been shown that building materials affect microbial communities [5,29]. In addition, it is clear that physical environmental factors and their changes affect microbial communities, as evidenced by the fact that mould growth prediction models are based on time-series data of temperature and relative humidity [3,4] and that the growth of bacteria and fungi differs depending on relative humidity [30].
However, it is not clear how housing itself (thermal insulation performance, airtightness, building materials), the physical environment, such as temperature and relative humidity, which are affected by ways of living (ventilation, air conditioning), chemical substances (antimicrobial materials), or the outdoor environment (meteorological conditions) affect the microbial community in the living environment. This study aims to understand how the physical environment affects the microbiome in living environments. We especially focused on indoor air and surface temperature and humidity, since these factors strongly influence microbial growth and community structure.
We investigated a house located in a rural area surrounded by mountains and forests in Japan. It is a traditional Japanese wooden-frame house with mud walls, a thatched roof, and other natural materials, and it has an earth floor space. The reasons for selecting this subject were as follows. Some studies suggest that the microbial community is different between urban homes and rural homes [27] and that the microbiome in farm houses could have a positive effect on human health [17]. The subject house is expected to have a farmhouse-like environment in that it uses natural materials, has an earth floor space, and has a strong connection between the outdoors and indoors. This initial attempt will be complemented by future surveys to examine seasonal changes and investigations of various housing types in Japan.

2. Materials and Methods

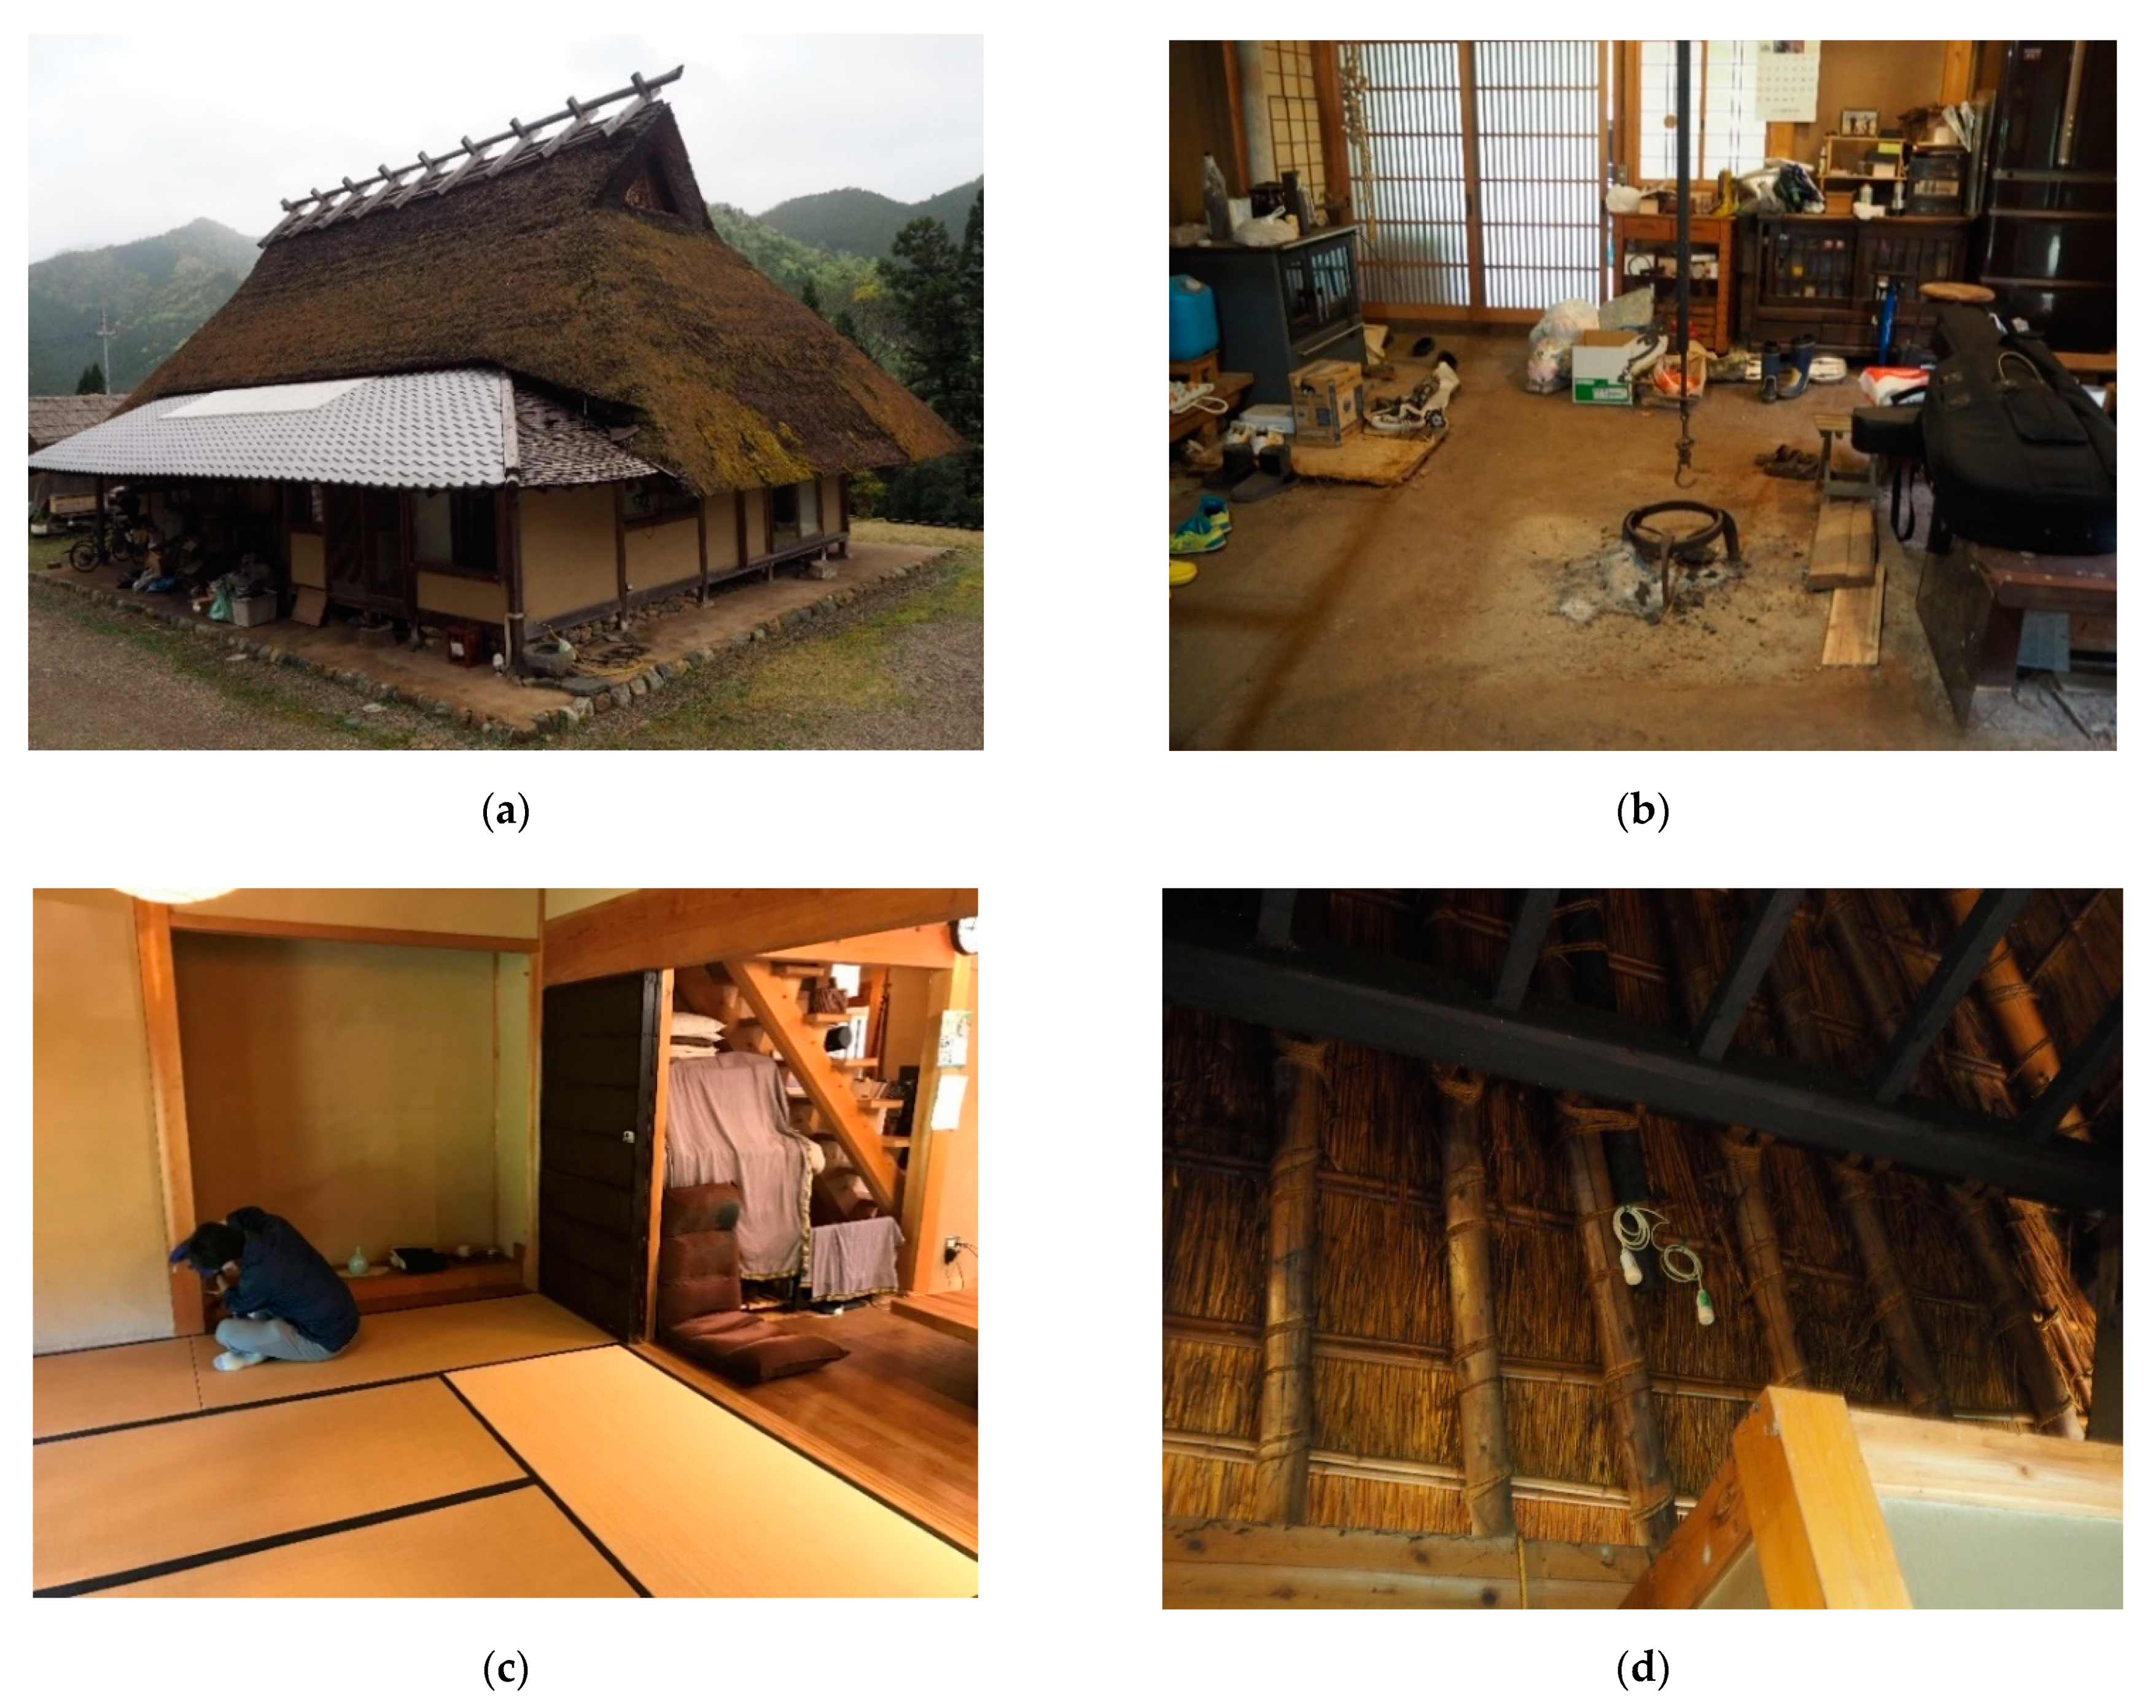
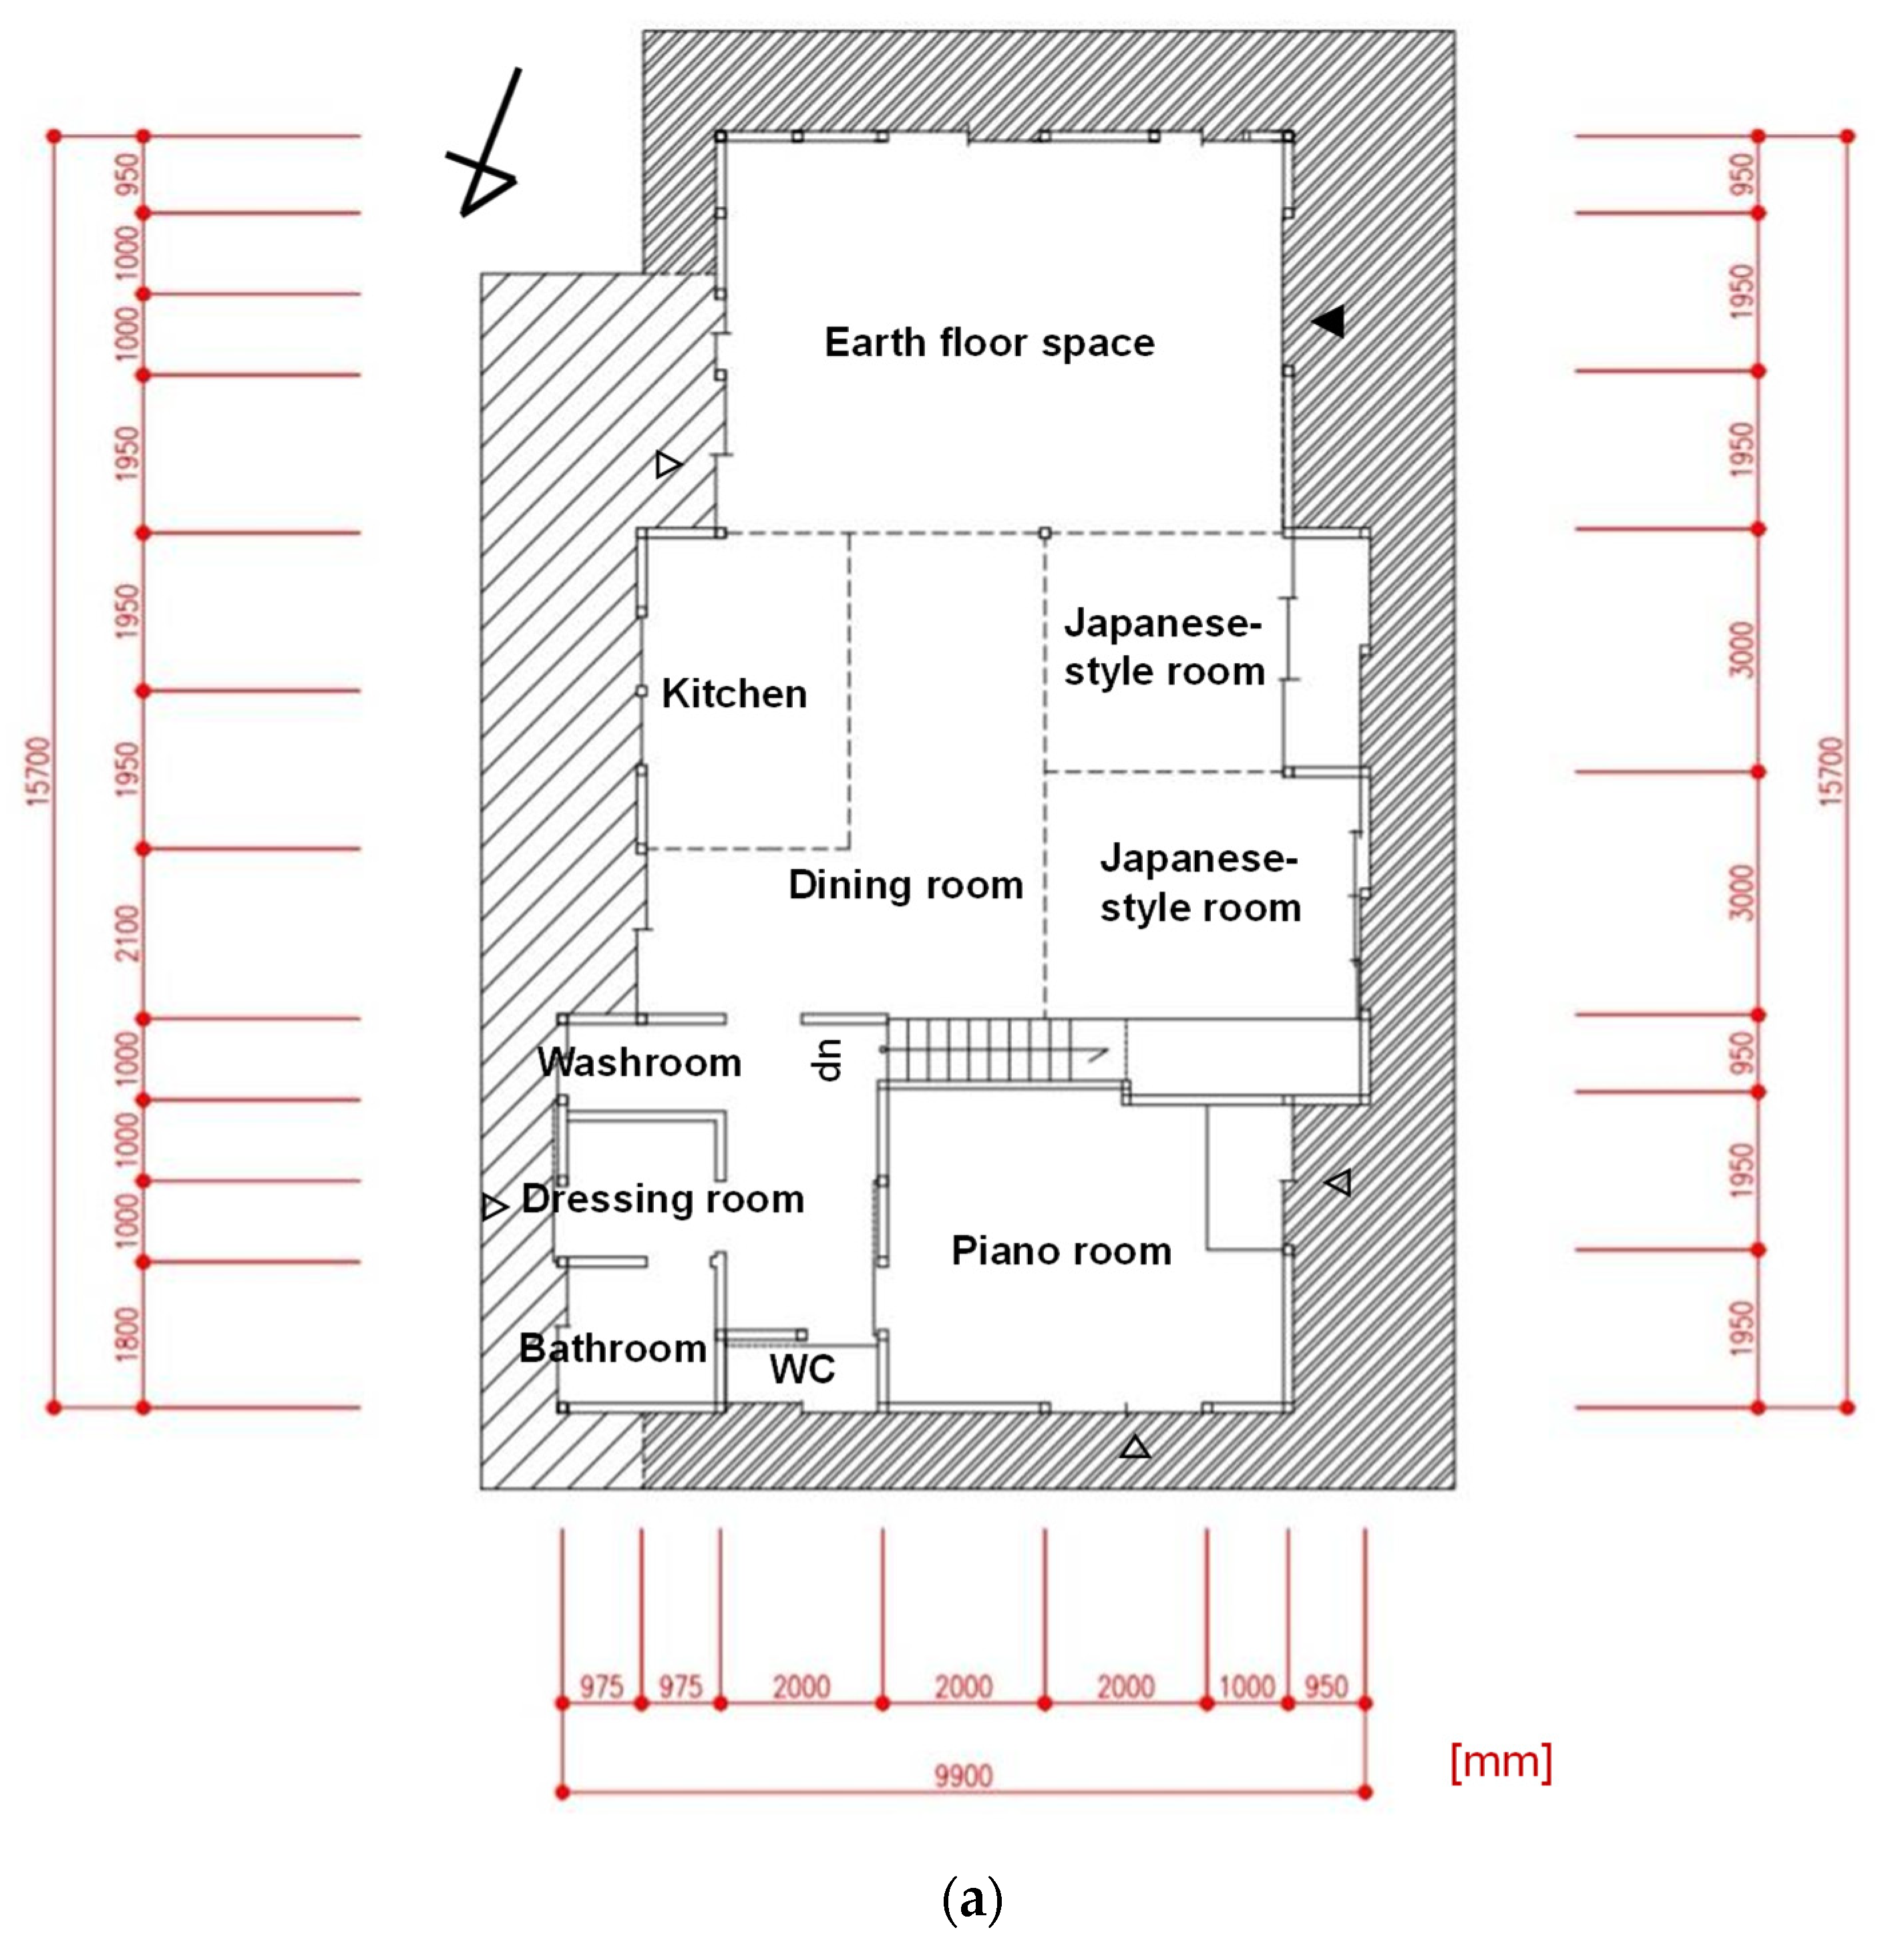
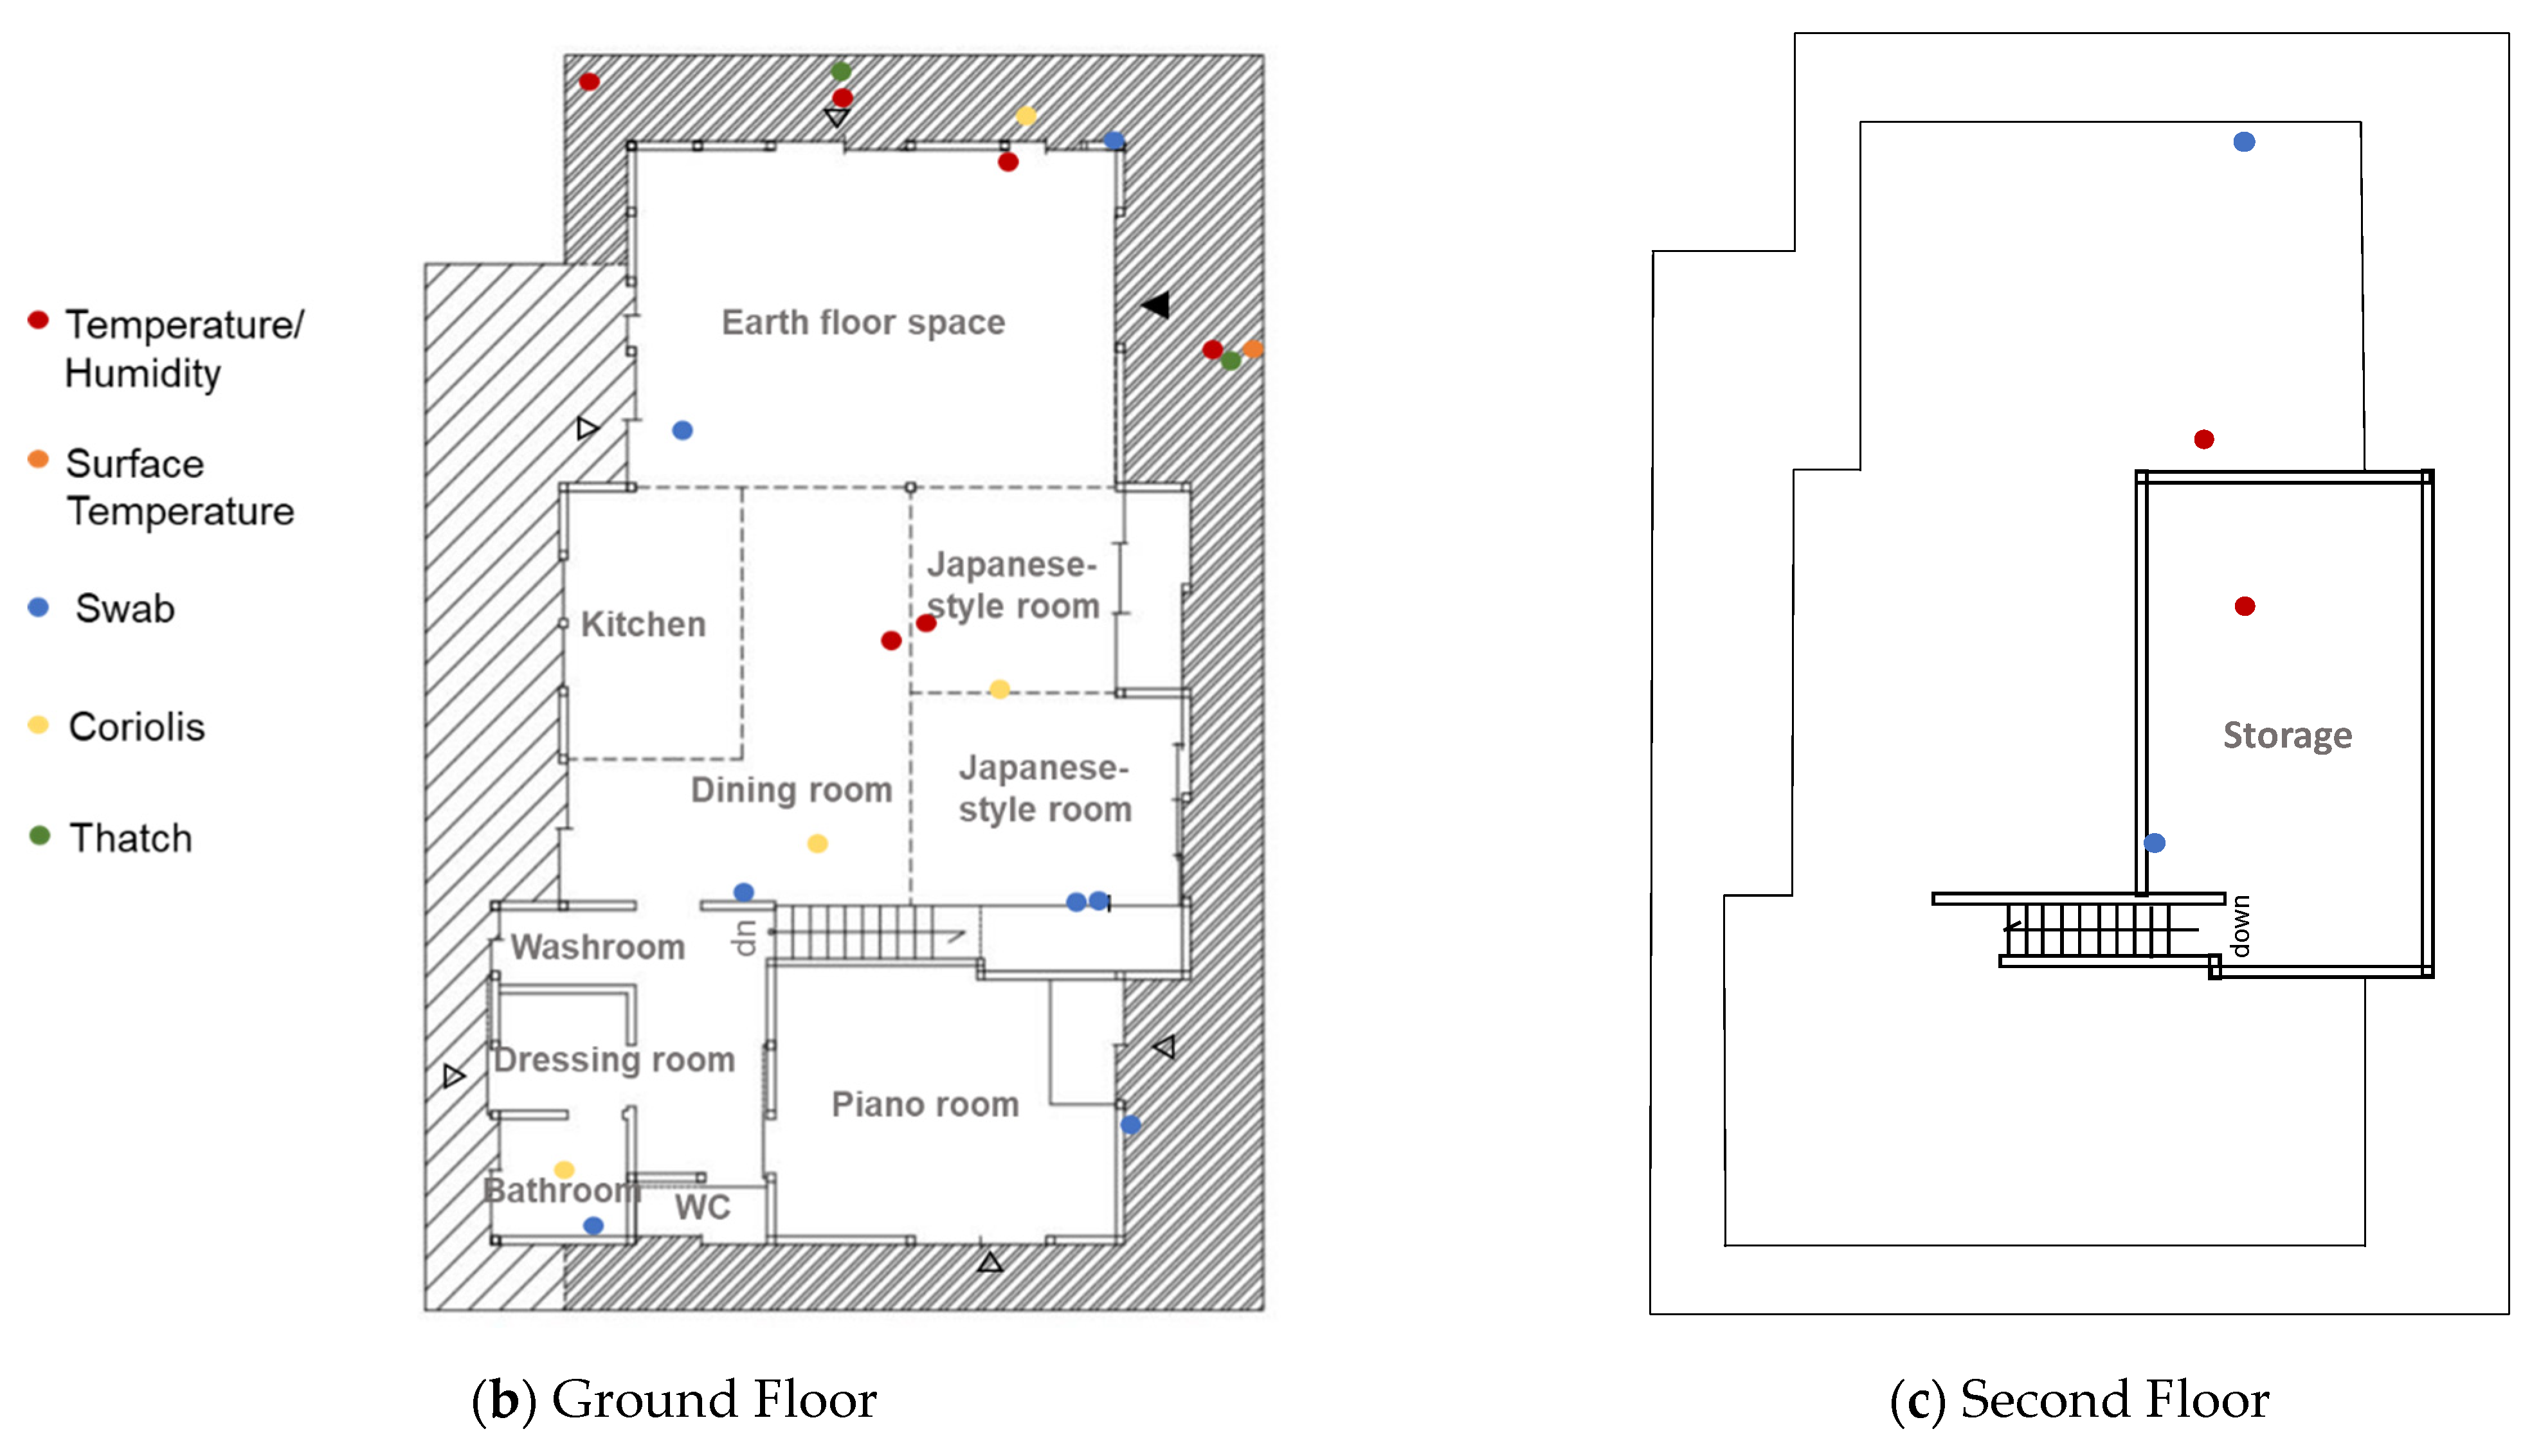
2.1. Research Site and Ways of Living

In this study, we focused on a thatched-roof house with natural materials such as mud walls in Miyama, Nantan City, Kyoto (N 35°16′ E 135°33′). Figure 1 shows photographs of the exterior of the house, the earth floor, the rooms, and the thatched roof seen from the inside. This area belongs to a humid subtropical climate. Miyama is surrounded by mountains and forests, and there are many thatched-roof houses in the town. Traditional Japanese wooden houses, such as thatched-roof houses, are characterized by their use of natural materials such as wood, plants, and soil and by their earth floor space. Low airtightness and open living style are also common in such houses. Such characteristics of traditional wooden houses are evident in the subject house. Two adults and one child live in the house. During the summer, occupants open the screen doors and room partitions to ensure ventilation and do not use air conditioners. In winter, they always use a wood-burning stove installed in the Japanese-style room. The smoke from the stove is exhausted into the earth floor space, and the indoor side of the thatched roof is covered with soot. Since 25 April 2018, we have been continuously conducting temperature and humidity surveys in the rooms and on and around the thatched roof to investigate the thermal environment in the house. On 6 September 2020, we collected temperature/humidity data and microbial samples.

2.2. Temperature/Humidity Measurements

Temperature/humidity measurements were taken continuously in the house beginning on 25 April 2018. prior to this study. The measurement points of temperature/humidity are shown in Figure 2. Outdoor air temperature/humidity was measured under the southeast eave using an outdoor temperature/humidity sensor (HOBO Pro V2 U23–002A, Onset Computer Corporation, Bourne, MA, USA) and a weather station (HOBO Weather Station Kits, Onset Computer Corporation, Bourne, MA, USA) located nearby. Indoor air temperature/humidity was measured using indoor temperature/humidity sensors (HOBO UX100–011A, Onset Computer Corporation, Bourne, MA, USA) in the earth floor space, the dining room, the Japanese-style room, the second-floor storage room, and the space under the ceiling. The temperature/humidity inside the thatched roof was measured using outdoor temperature/humidity sensors (HOBO Pro V2 U23–002A, Onset Computer Corporation, Bourne, MA, USA) at the south eave, the west eave, and the south side of the thatched roof (Figure 2). The surface temperature of the thatched roof was measured at the west eave using thermocouples (HOBO UX100–014 M, Onset Computer Corporation, Bourne, MA, USA). The measurement intervals for all locations were 30 min. The relative humidity of the thatched roof surface was approximated by a calculated value using the temperature of the roof surface and the water vapour pressure calculated by the temperature and the relative humidity of the outdoor air.

2.3. Microbial Sampling

On 6 September 2020, indoor and outdoor air samples were collected in phosphate-buffered saline (PBS) liquid by a biological air sampler (Coriolis Micro, Bertin Technologies, Montigny-le-Bretonneux, France) with airflow set at 300 L/min for 10 min. The aerosol-containing liquid from the sampler was filtered on-site through a 20-mL syringe (Terumo Corporation, Tokyo, Japan) and 0.2-µm filter cartridge (Sterivex, Millipore, Burlington, MA, USA). We swabbed the surfaces of the south and west sides of the exterior walls, the earth floor space roof, the earth floor, the dining room wall, the Japanese-style room wall and column, the second-floor storage wall, and the bathroom wall (Figure 2) using a cotton swab (Fine Check, ASONE, Osaka, Japan). The size of the sampling area was 10 cm × 10 cm for each location. The thatch was pulled from six locations on the roof, as shown in Figure 2 (see also Supplementary Figure S1).

2.4. Numerical Analysis of Surface Temperature/Humidity

The temperature/humidity of wall surfaces and floor surfaces are different from the temperature/humidity of air. To evaluate close relationships between the temperature/humidity and microbial communities on surfaces, it is necessary to measure the surface temperature/humidity of the point where microbial samples were collected. Although the air temperature/humidity was measured, the temperature/humidity of surfaces where samples were collected was not measured directly in the subject house. We used the simultaneous heat and moisture transfer equation [31], which is a method commonly used in the field of architecture, to predict the temperature/humidity inside walls. We modelled the ground and mud walls of the earth floor and the Japanese-style room wall, respectively. We calculated the surface temperature/humidity using one-dimensional numerical analysis. The theory and methods of calculating surface temperature/humidity are explained in Appendix A.

2.5. DNA Extraction and Sequencing

All samples were obtained using aseptic techniques and appropriate negative controls. A swab and a filter were directly placed in a bead tube of a DNeasy PowerBiofilm Kit (QIAGEN, Germantown, MD, USA) under a laminar flow cabinet, and DNA was extracted according to the manufacturer’s protocol with some modifications, as follows [32]. Instead of using glass beads in a PowerBiofilm bead tube, 400 μL of sterilized φ0.5 mm zirconia beads (TORAY, Tokyo, Japan) and two grains of φ5 mm zirconia beads (TORAY) were used for homogenization. The samples were beaten with a Multi-bead shocker® (Yasui Kikai Corporation, Osaka, Japan) at 2700 rpm for 10 min. The DNA was eluted in 100 μL of elution buffer and then purified and concentrated with a Dr. GenTLE precipitation carrier (Takara BIO, Tokyo, Japan). The concentration and purity of the DNA were measured with a DS-11FX + Spectro/Fluorometer (DeNovix, Wilmington, NC, USA).
The extracted DNA was amplified according to the Earth Microbe project [33]. The V4 region of the 16S rRNA gene and V9 region of the 18S rRNA gene were used as target regions for sequencing on the Illumina MiniSeq platform. The detailed library preparation procedures are described in [34]. PCR amplification reactions contained 2.5 µL each of 1 µM primers, 12.5 μL of 2× MightyAmp PCR Buffer v. 3 (TaKaRa Clontech, Mountain View, CA, USA), 0.5 μL of MightyAmp DNA Polymerase v.3 (1.25 U/μL), 5 μL of PCR grade water, and 2.5 μL of DNA templates. Amplification was performed under the following conditions: for the 16S rRNA gene, 98 °C for 2 min, followed by 35 cycles of 95 °C for 30 s, 50 °C for 1 min, and 68 °C for 1 min, for the 18S rRNA gene, 98 °C for 2 min, followed by 35 cycles of 95 °C for 30 s, 65 °C for 30 s, and 68 °C for 30 s. A reaction containing no template served as the negative control and confirmed the absence of nonspecific amplification. After amplification, PCR products were examined in a 2% w/v agarose-TAE gel, stained with Safelook Load-Green (Wako, Osaka, Japan), visualized on Printgraph CMOS I (ATTO, Tokyo, Japan), and cleaned using a Pronex® Size-Selective Purification system (Promega, WI, USA). Primers with different barcodes (short artificial DNA sequences) were used for different samples to identify each sample. For index PCR amplification reactions, 12.5 µL of 2× KAPA HiFi HotStart ReadyMix (Kapa Biosystems, Woburn, MA, USA), 2.5 µL of each forward and reverse index primer (1 µM), and 7.5 µL of purified PCR product DNA were used. Amplification was performed under the following conditions: 95 °C for 3 min, followed by 8 cycles of 95 °C for 30 s, 55 °C for 30 s and 72 °C for 30 s, and a final elongation of 72 °C for 5 min. The libraries were verified by the fragment analyser TapeStation 4000 series (Agilent Technologies, Palo Alto, CA, USA), cleaned using a Pronex® Size-Selective Purification system (Promega), and quantified with a DS-11FX + Spectro/Fluorometer (DeNovix). Based on these DNA concentrations, samples were pooled at equimolar concentrations into one tube and diluted to 1 nM. The pooled amplicons were denatured and diluted to 30 pM, and 30% PhiX DNA was added according to the manufacturer’s recommendations. The mixed library at 0.8 pM was sequenced with Illumina MiniSeq using the 150-cycle Mini Reagent Kit (Illumina).

2.6. Data Analysis and Availability

A total of 6872,122 for 18S rRNA gene and 3,150,556 for 16S rRNA gene of raw sequences were obtained from MiniSeq Illumina sequencing. The raw sequenced reads were filtered for low-quality reads and adapter regions using Trimmomatic v. 0.39 [35] with the following settings: TrimmomaticSE -threads 2; LEADING 20; TRAILING 25; SLIDINGWINDOW 4:15; ILLUMINACLIP 2:30:10; MINILEN 120. After filtering and the removal of the primer sequences, the 18S and 16S rRNA gene sequences were trimmed and quality filtered using the DADA2 package [36] in the program R [37] with a procedure adopted from the DADA2 pipeline version 1.14.1 with the following settings: maxLen 150; miniLen 100; maxEE 2; truncQ 2; rm.phix TRUE; compress TRUE; verbose TRUE; multithread TRUE. The taxonomy was assigned using the silva_nr_v132_train_set.fa.gz database. For 16S rRNA gene analysis, chloroplast and mitochondrial OTUs were manually removed. Samples with more than 1000 reads were used for further analysis, and microbial data analysis was conducted in R using the packages phyloseq v1.36.0 [38] and vegan v2.5.7; ggplot2 v3.3.4 was used for visualization [39].

3. Results and Discussion

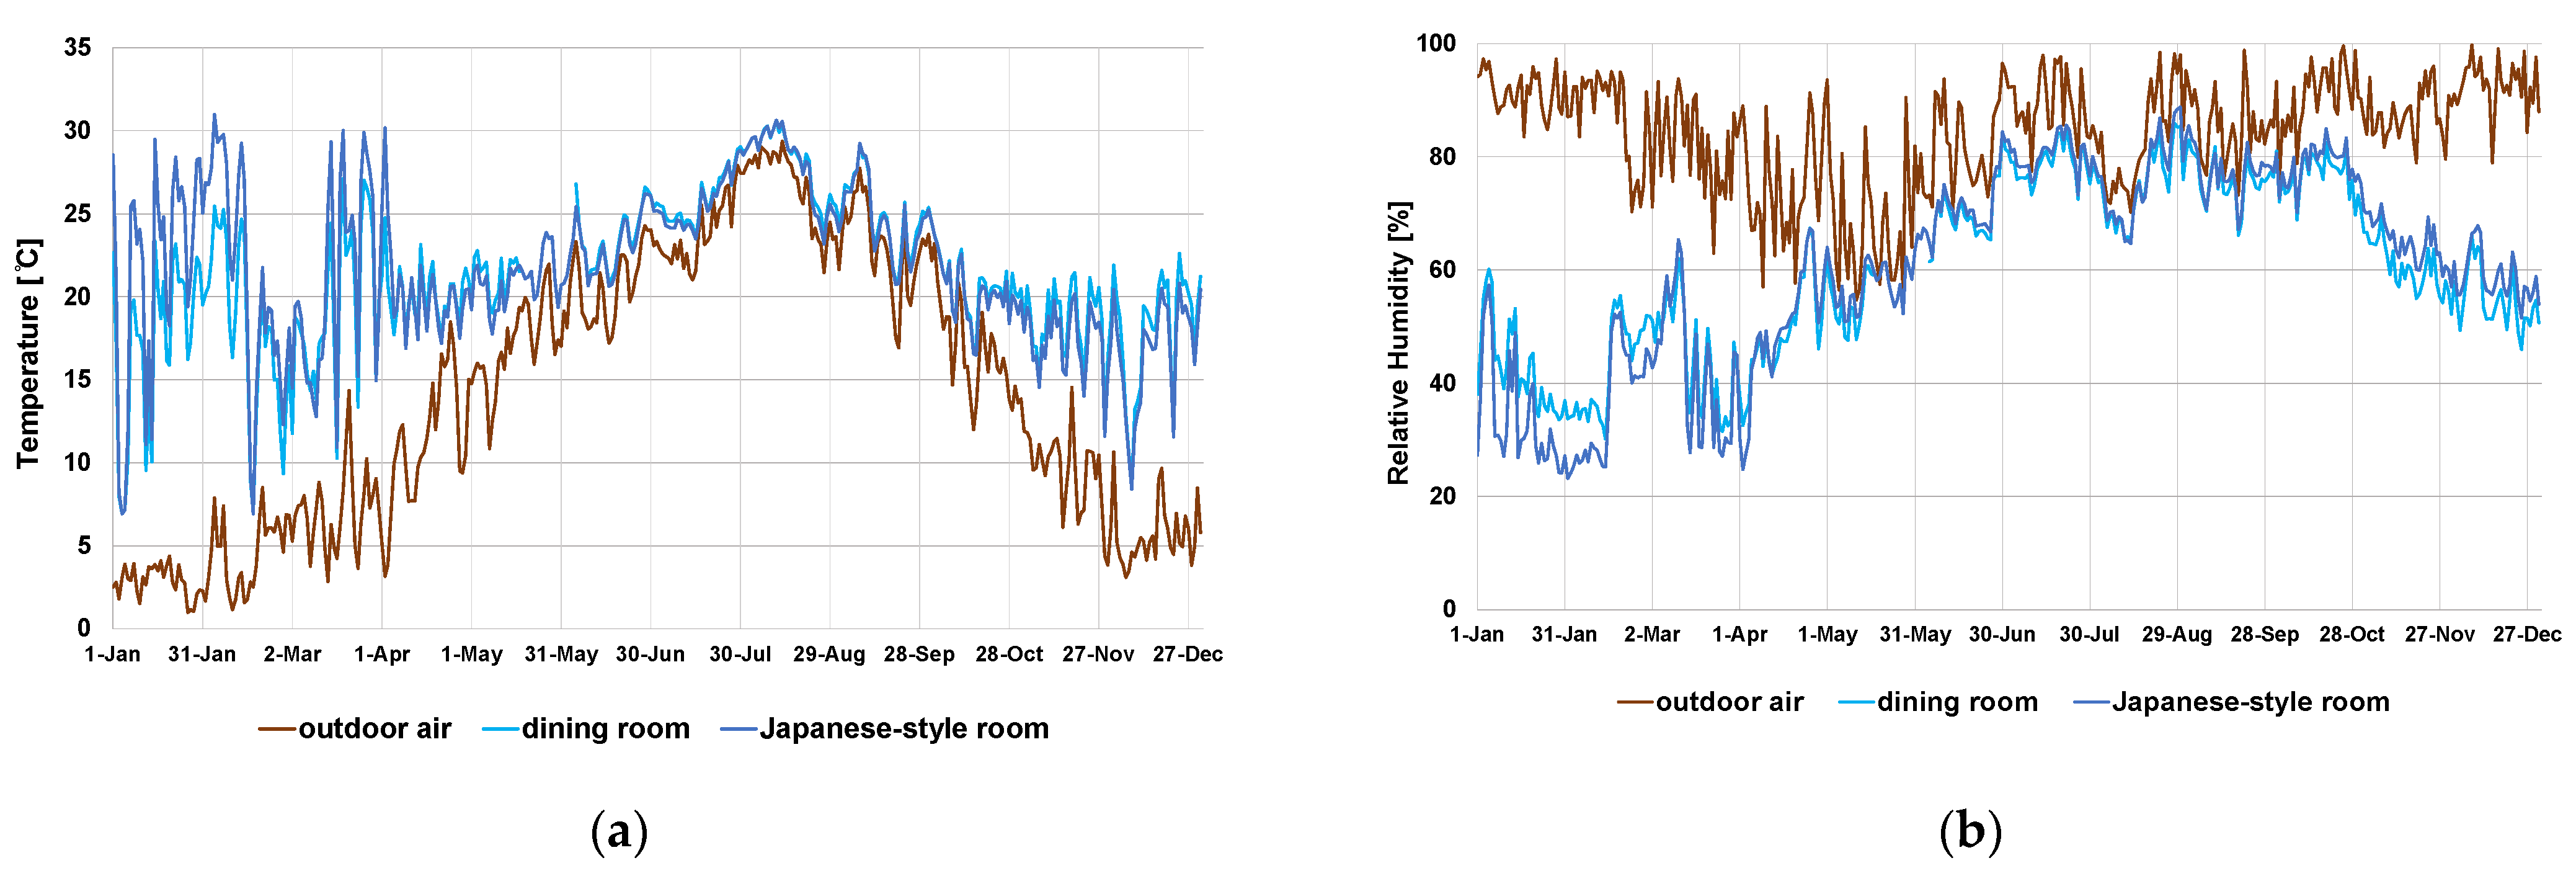
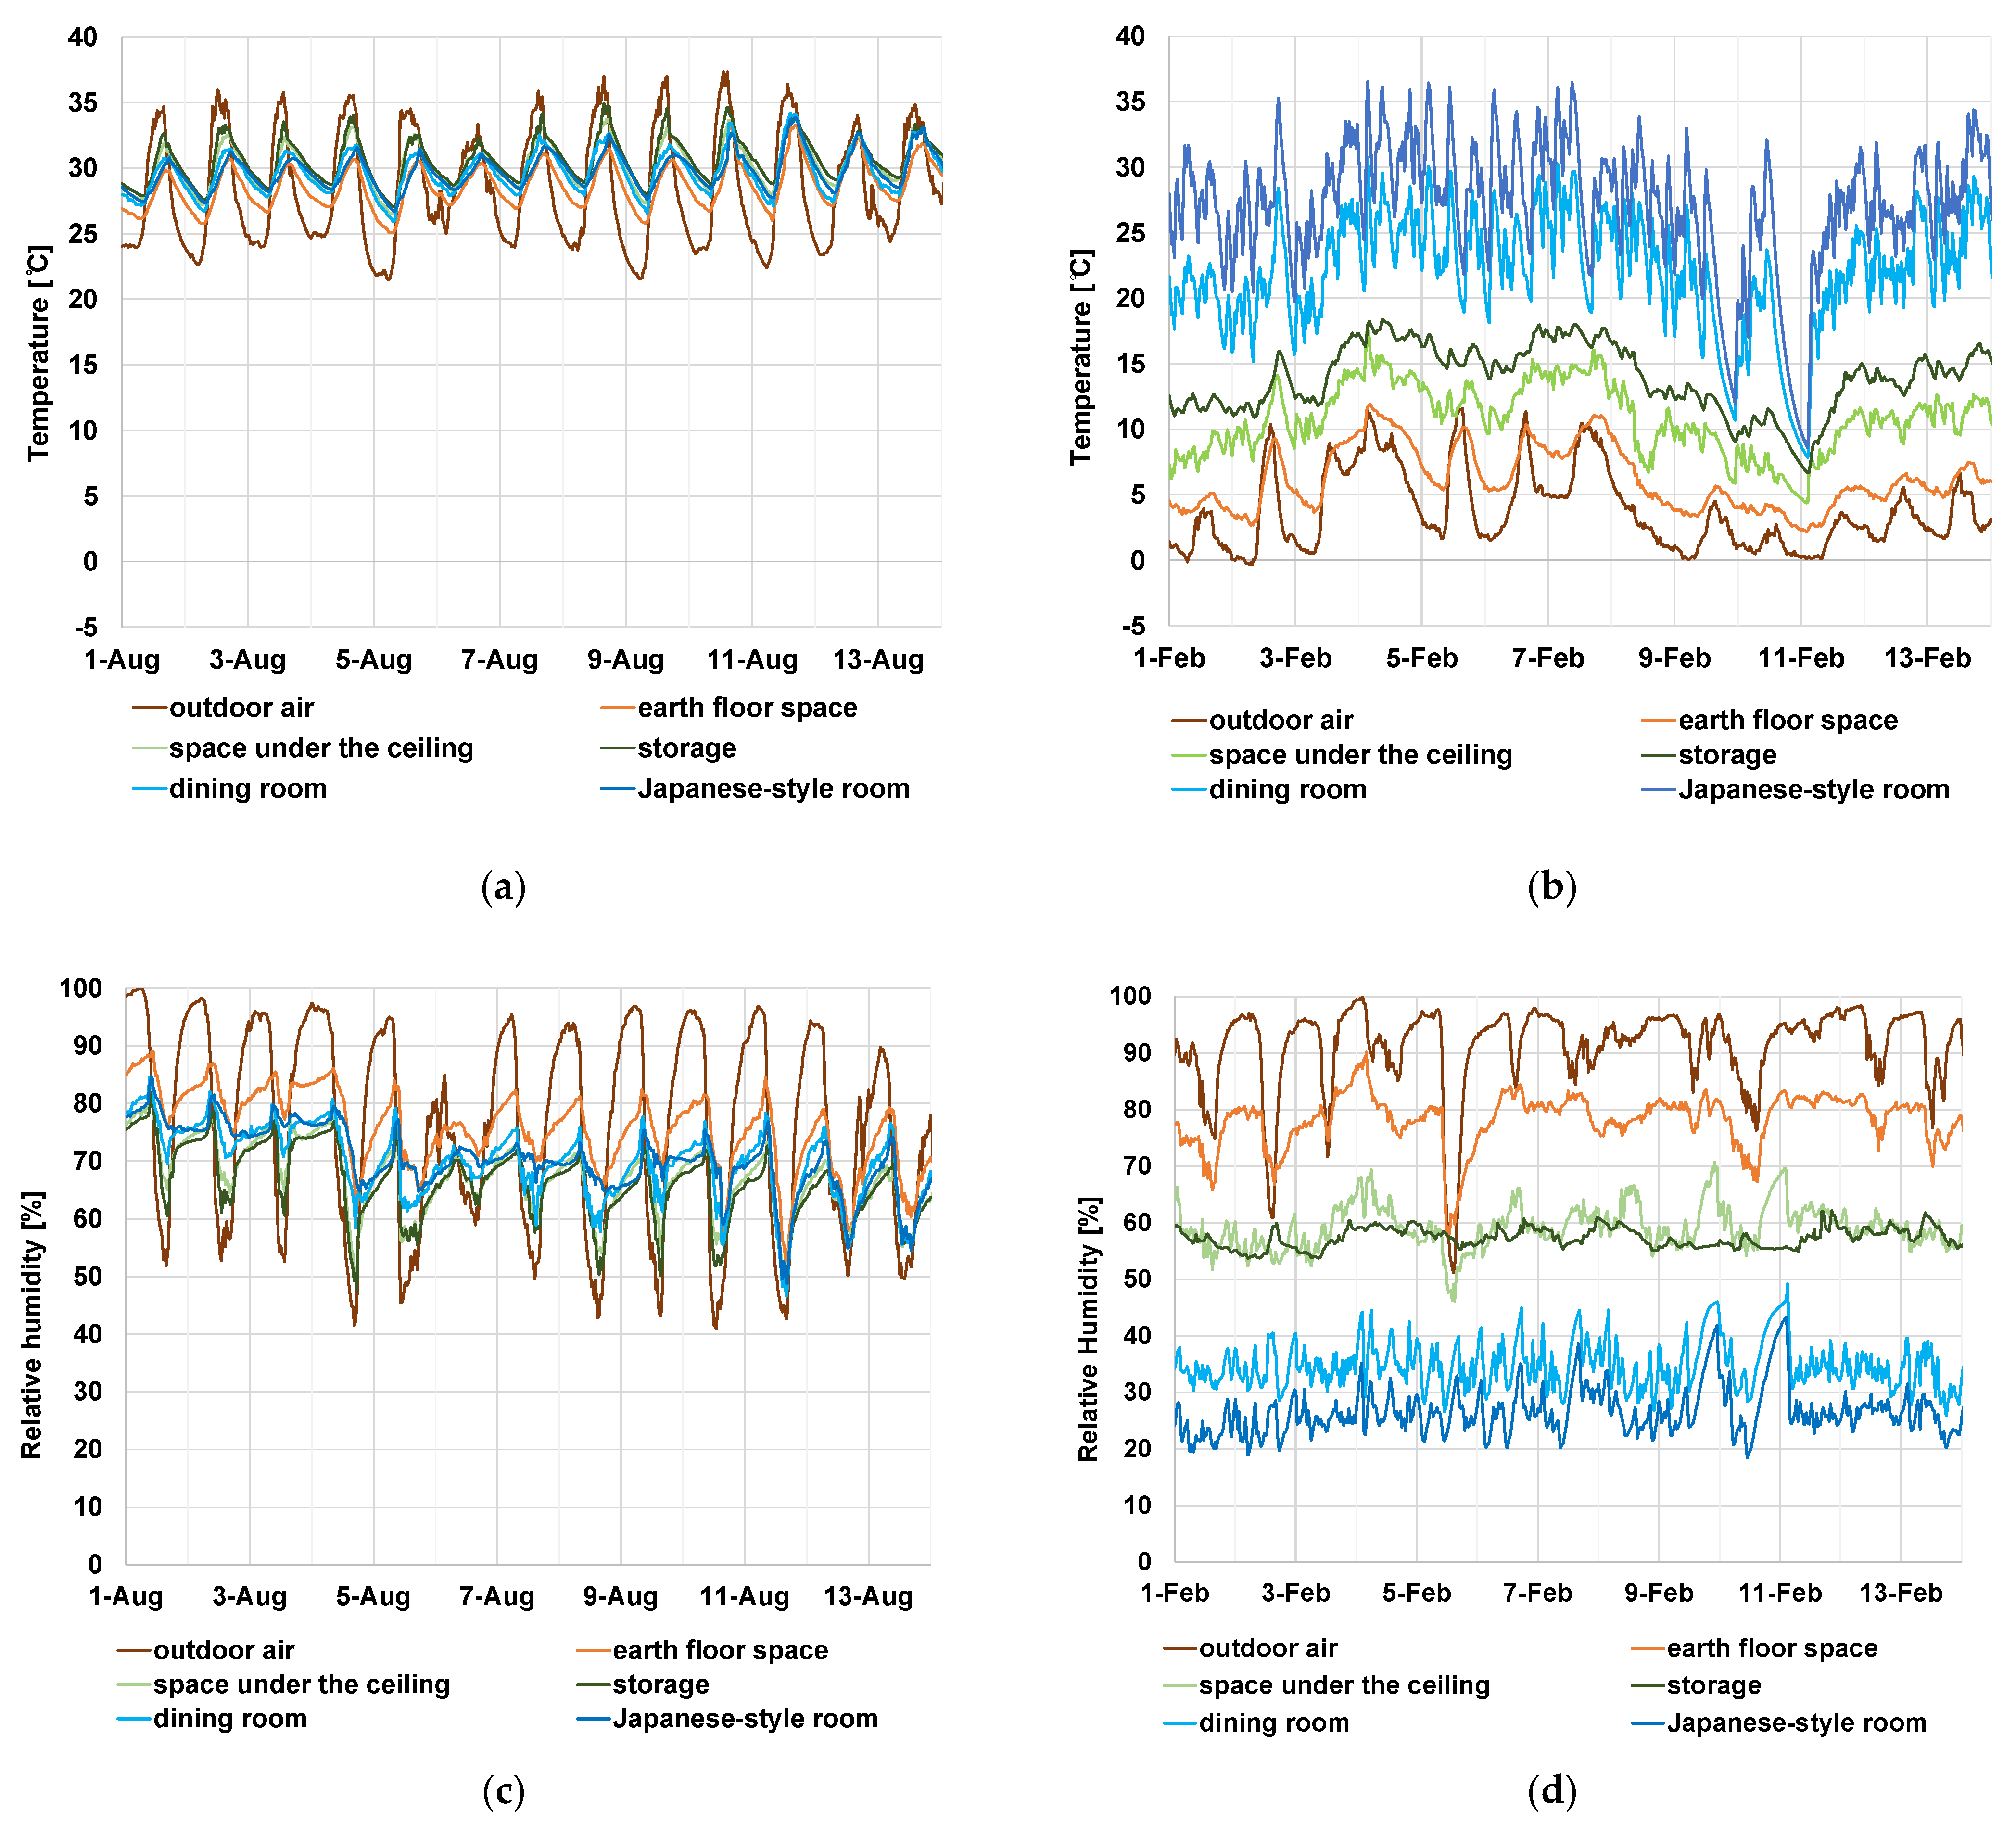
3.1. Outdoor Air and Indoor Air Temperature/Humidity

Temperature/humidity measurements have been conducted since 25 April 2018. In this study we used temperature/humidity data form 2019, when the data was available throughout the year, since there was no significant difference by year and the data represents the temperature/humidity conditions of the subject house (Supplementary Table S1). The daily mean of the outdoor temperature around the subject house rose from below 5 °C in winter to nearly 30 °C in summer (Figure 3a). The temperature gradually rose in spring and decreased in autumn (Figure 3a). The relative humidity was high throughout the year, with few days when the daily mean value was below 60% (Figure 3b). In the summer, the indoor air temperature fluctuated with the outdoor air temperature, and the daily range was narrower than that of the outdoor air. The air temperature of the space under the ceiling did not rise as high as the outdoor air (Figure 4a). This was due to the high thermal insulation performance and high thermal capacity of the thatched roof. In a modern house with a steel roof, the attic space air temperature can rise higher than the outdoor temperature [40]. The relative humidity in the same season was higher at night outdoors and in the earth floor space, but the difference among indoor locations was small (Figure 4c).
In the winter, the difference in temperature and relative humidity among locations was larger than in summer. In addition, there was a wider range of fluctuations and a shorter cycle in the indoor air temperature in winter than in summer (Figure 4b,d). In spring and autumn, the difference in indoor and outdoor air temperature/humidity was intermediate between that in summer and winter.
These seasonal variations are supposed to reflect room temperature control methods. In this house, occupants opened the windows and partitions without air conditioning in summer, so indoor air temperature and humidity were similar to those of the outdoor air. In winter, they used a wood-burning stove and closed windows. Thus, the temperature and humidity of the indoor air were different between the room with the stove and the room without the stove, and these differed greatly from the outdoor air.
The mean annual temperature was low outdoors and in the earth floor space and high indoors. The annual highest temperature was above 30 °C in all locations, and the annual range was more than 25 °C (Table 1a). This indicates that there was a wide annual range in temperature everywhere in the house. For the relative humidity, the mean value was high in the outdoor and the earth floor space, and the highest value exceeded 85% in all locations during the summer. The annual range outdoors was wide. In the storage room, the annual range of relative humidity was narrowest, although it was nearly 60% (Table 1b). This means that the annual range of relative humidity was also wide everywhere. The temperature and humidity measurement results show that the earth floor space is a buffer space between the outdoor and indoor environments.
Furthermore, the eaves provide shading and suppress a rise of indoor air temperature [41]. Japanese modern houses have large openings in each direction and have few eaves for design purposes, while in traditional Japanese houses the deep eaves of the thatched roof provide shading [40]. In addition to the high thermal insulation and high thermal capacity of the thatched roof, the shading effect of the roof moderates the indoor air temperature rise in summer in the subject house.

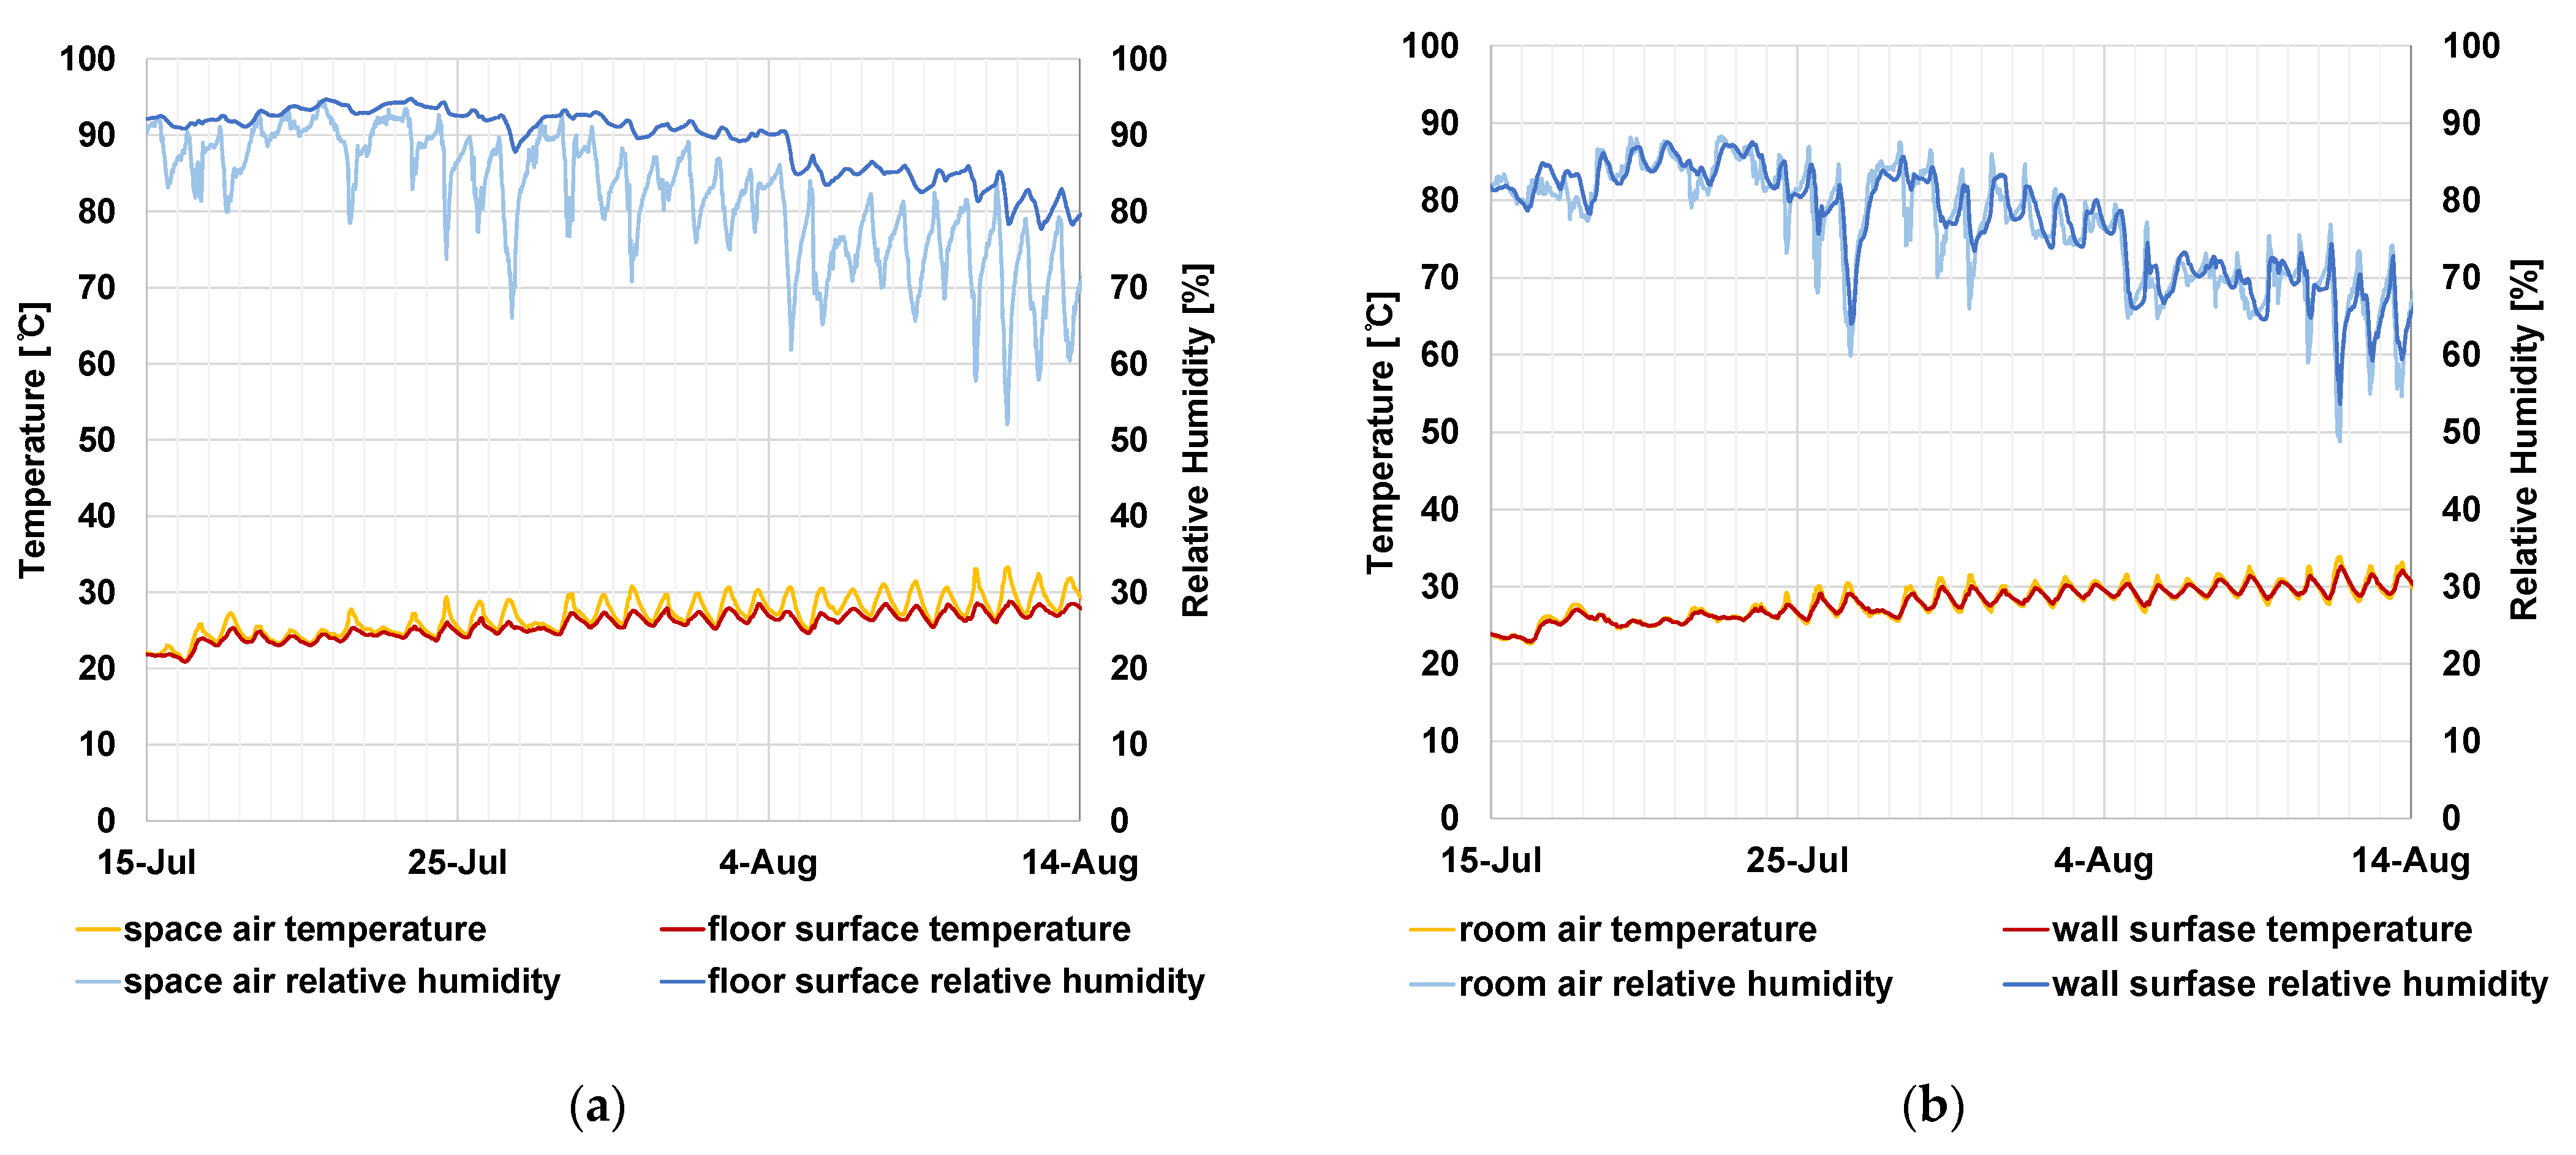
3.2. Result of Numerical Analysis of Surface Temperature/Humidity

The swabbed surface temperature/humidity was not measured. Therefore, to understand how the surface temperature/humidity fluctuations are influenced by air, we calculated the corresponding values using the simultaneous heat and moisture transfer equation. The temperature of the earth floor surface changed following the temperature of the earth floor space air, but the surface temperature did not rise as high as that of the air. The relative humidity of the earth floor surface fluctuated little and was approximately the highest daily value of the relative humidity of the air (Figure 5a).
For the Japanese-style room wall, the daily range of surface temperatures was approximately 2 °C narrower than that of the air, and the surface relative humidity fluctuated a few hours behind that of the air. (Figure 5b).

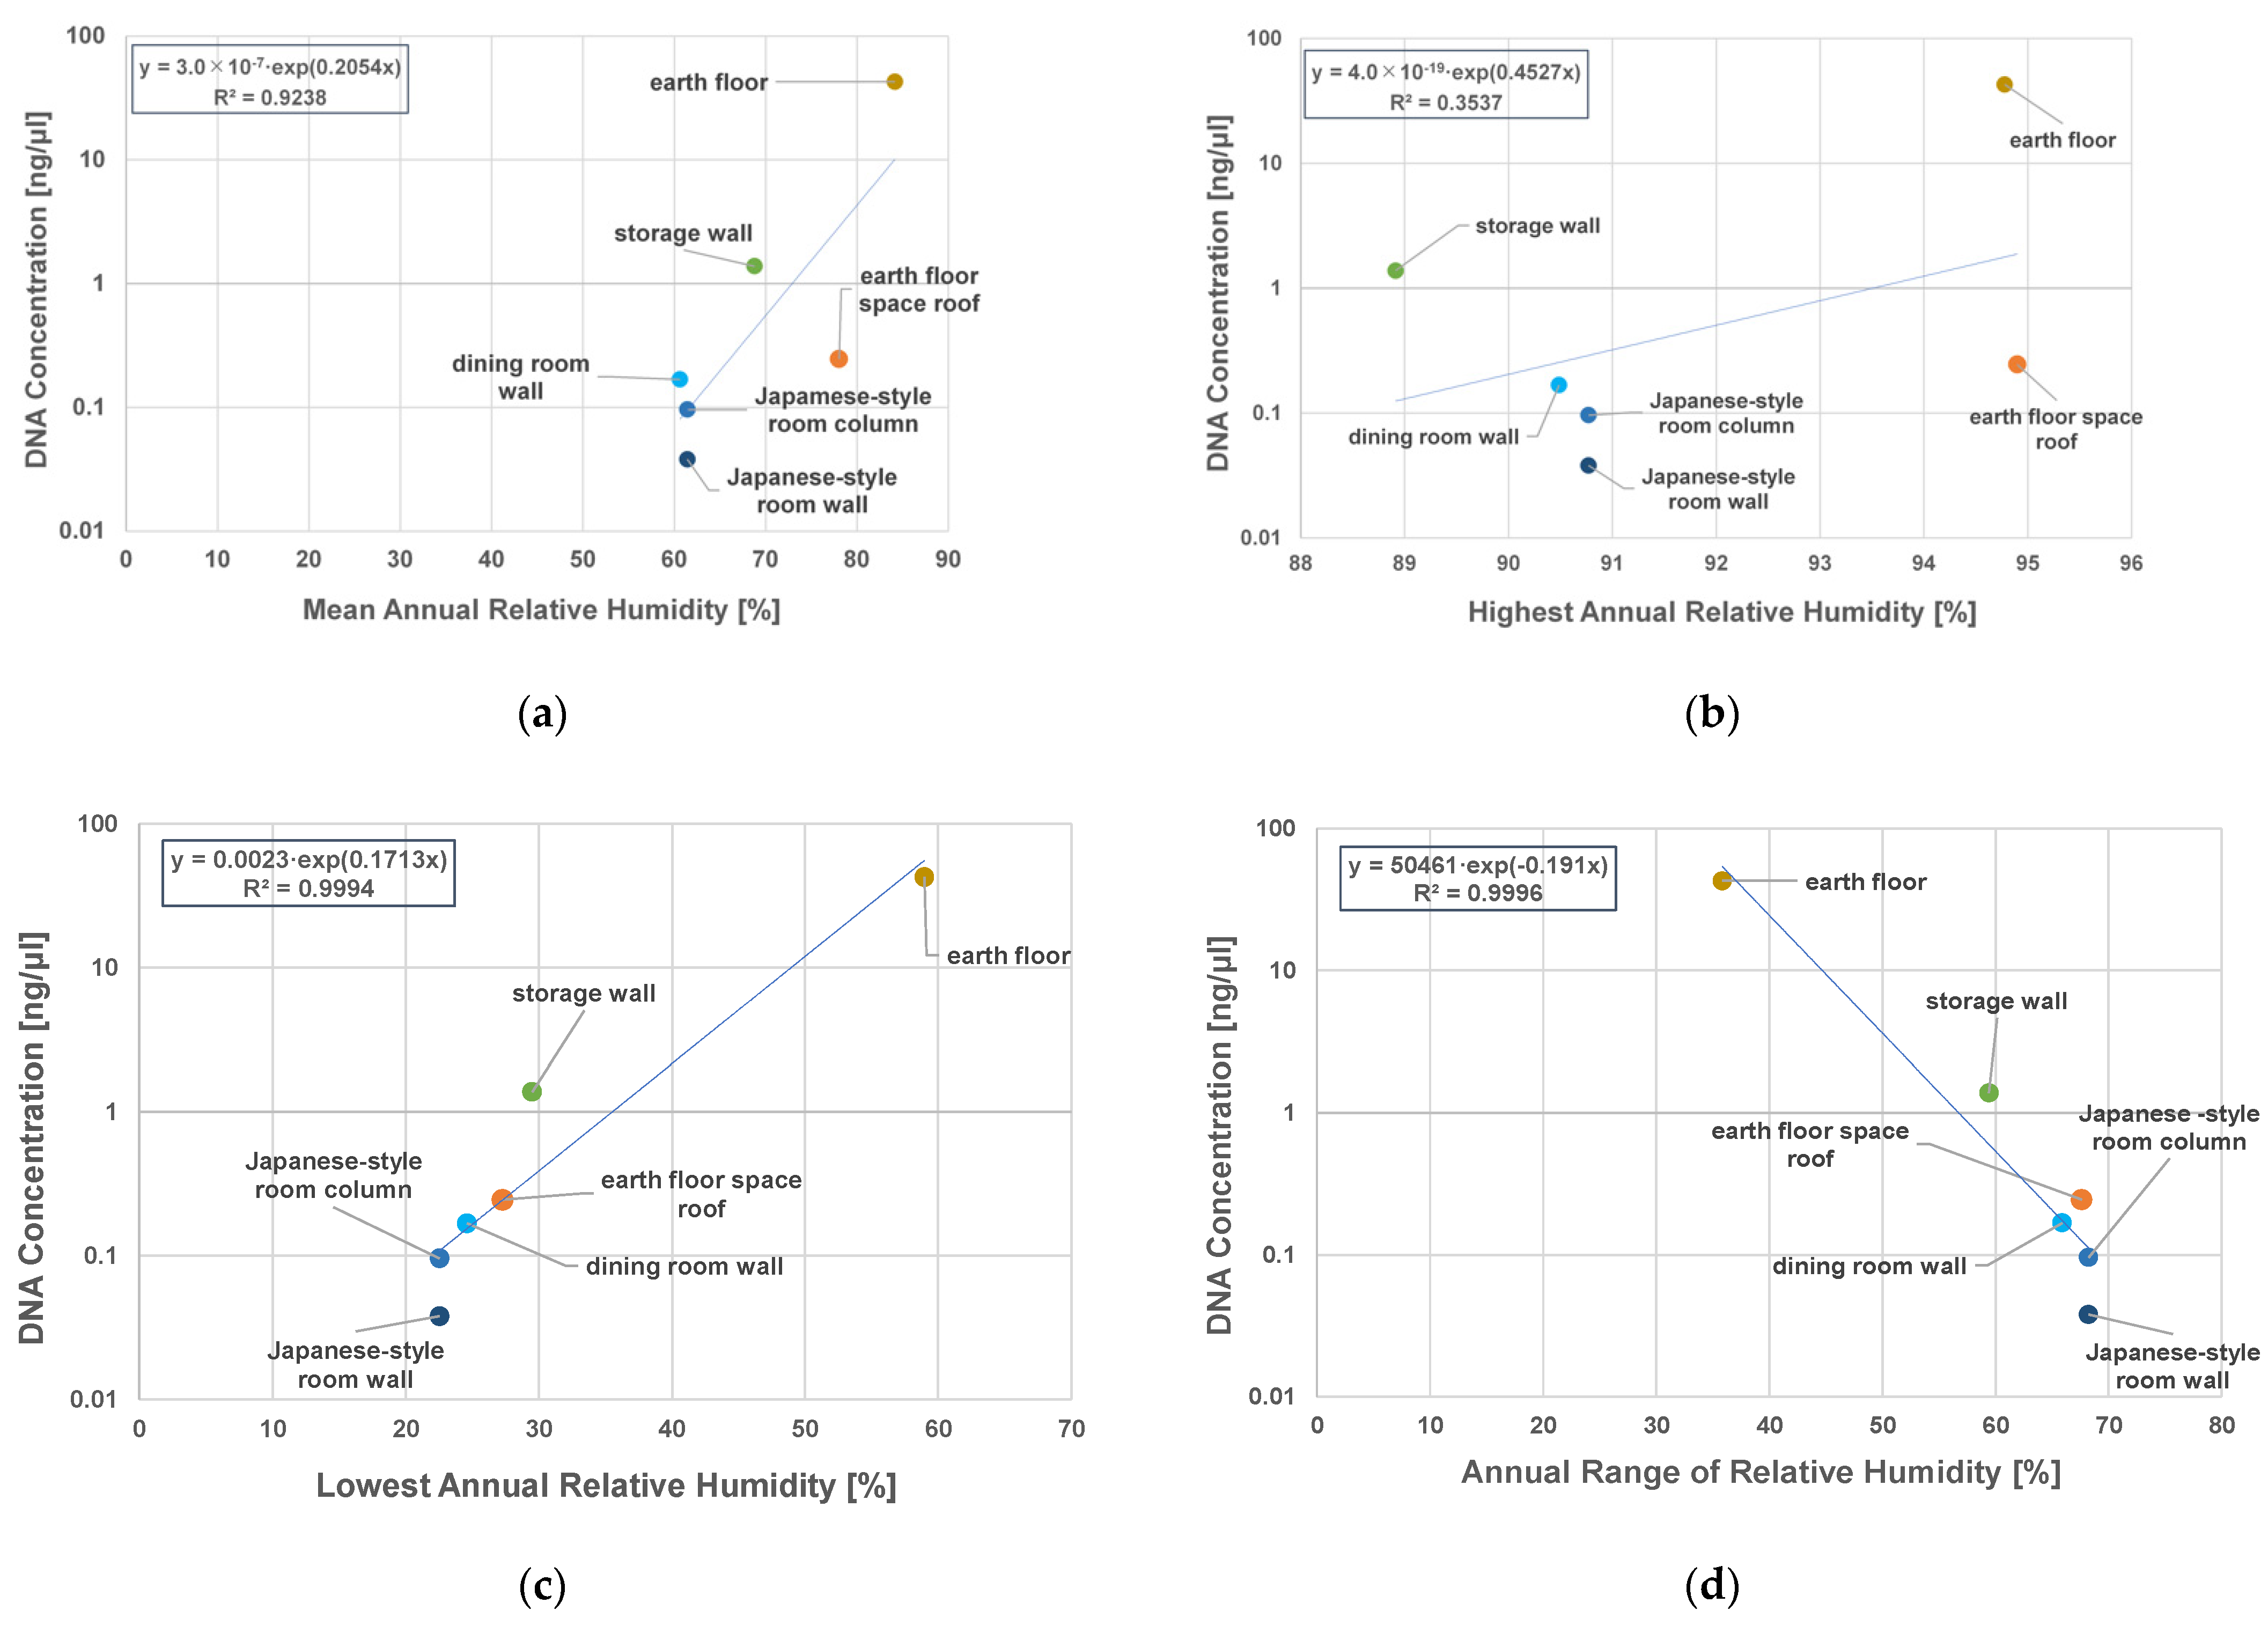
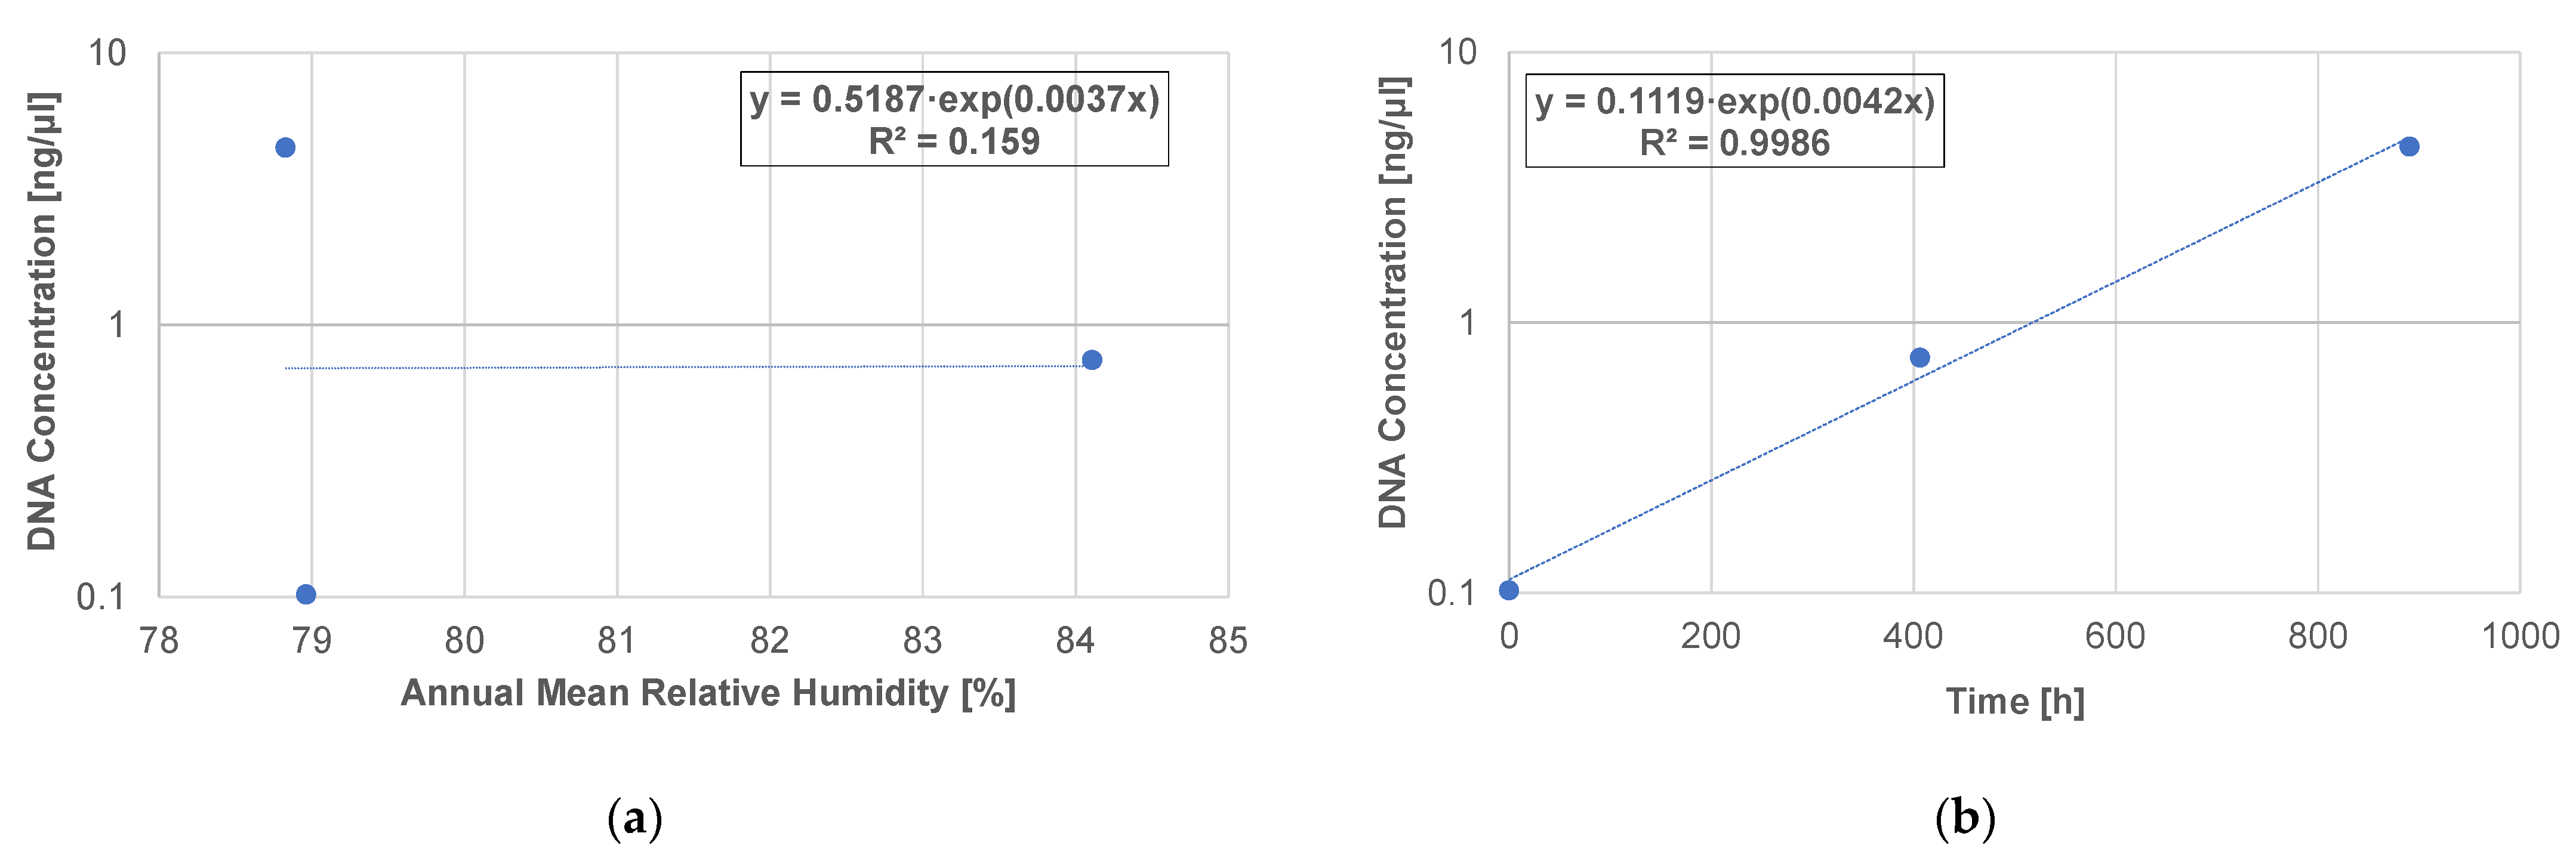
3.3. DNA Concentrations and Relative Humidity of Indoor Surfaces

The relationship between the DNA concentration and the relative humidity of the swabbed surface was investigated.
For the surface of the Japanese-style room wall, the analytical values of the mud walls were used. The swabbed surface of the column in the Japanese-style room was adjacent to the surface of the wall, and the difference in relative humidity was considered to be small. Thus, the analytical values of mud walls were used for the surface of the column. For other indoor wall surfaces, the relative humidity should be that of the air of each room. This is because, from the results of the analysis using the simultaneous heat and moisture transfer equation, the relative humidity of the surface of indoor walls can be approximated by the relative humidity of the air with which the surface is in contact. For the earth floor surface, the analytical values of the ground were used.
No correlation between DNA concentration and the highest annual relative humidity was observed (Figure 6b, R2 = 0.3537). While positive correlations with the DNA concentrations were observed for the annual mean value of relative humidity and the annual lowest value of relative humidity, with correlation coefficients of 0.6574 and 0.9994, respectively (Figure 6a,c). The annual range in relative humidity was negatively correlated with the DNA concentration (Figure 6d, R2 = 0.9996). The temperature and humidity of the surface may affect the numbers of microorganisms on indoor wall and floor surfaces. For the relationship between relative humidity and microorganisms, Danmiller et al. reported that the growth of microorganisms in house dust is accelerated in a high-humidity environment [30].
These results showed that there was a correlation between the DNA concentration on indoor wall and floor surfaces and the annual relative humidity, and the lowest relative humidity had a particularly large effect.
The surface material is soil for the earth floor, mud wall for the dining room wall and the Japanese-style room wall, wood for the Japanese-style room column and the storage wall, and thatch for the earth floor roof surface. In the subject house, the DNA concentrations of microorganisms on surfaces varied more by sampling location than by surface material. Comparing the wood column and mud wall in the Japanese-style room, the DNA concentration was higher on the column surface. It has been reported that microbial biomass can reflect seasonal variations in soil moisture and temperature [42], and in damp or water-damaged building materials, wood is a material which is likely to support fungal growth, following plaster and concrete [29]. This indicates that the surface materials and those moisture conditions can affect the DNA concentration of microorganisms.

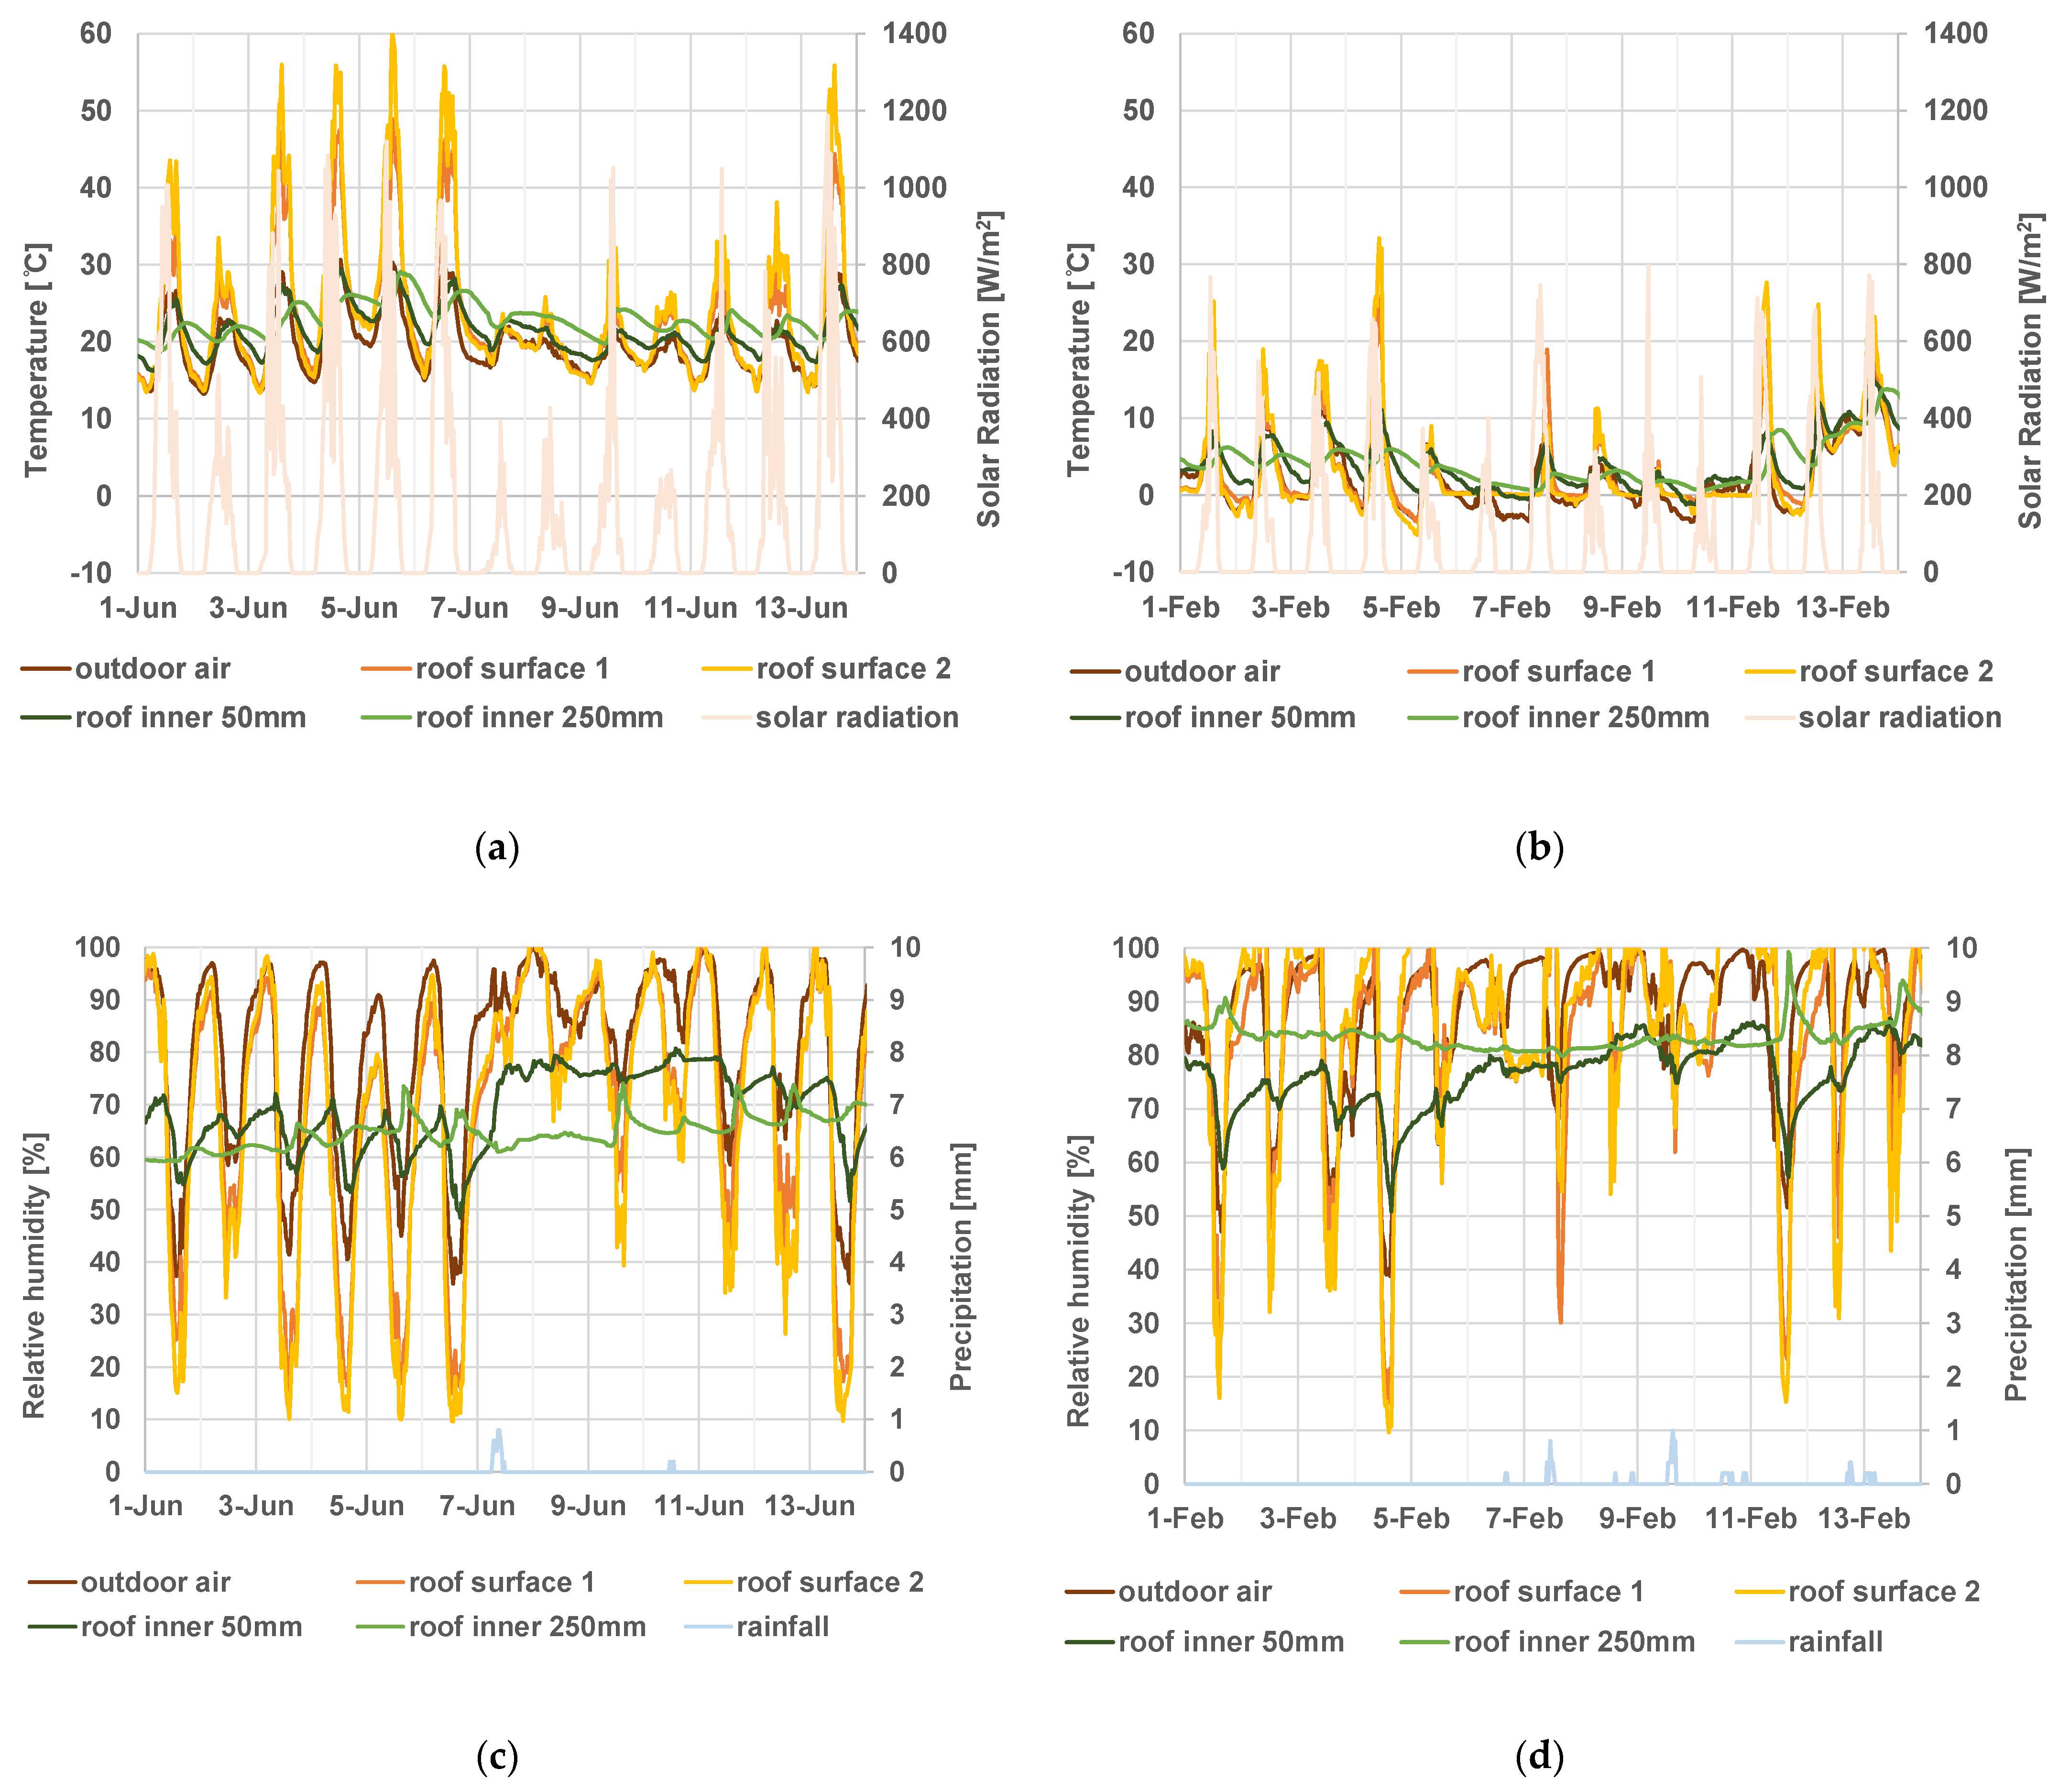
3.4. Thatched Roof Temperature/Humidity

Variations in temperature/humidity inside and on the surface of the thatched roof were significantly different. The temperature at the surface of the thatched roof can rise to much higher than that of the outdoor air, reaching up to 60 °C in summer (Figure 7a). At night, the surface temperature can drop below the outdoor air temperature (Figure 7b). This was due to the effect of nocturnal radiation. The temperature dropped significantly, especially in winter. However, on some days in winter, the roof surface temperature did not drop below approximately 0 °C, although the outdoor air temperature dropped below 0 °C (Figure 7b). When this occurred, the roof surface may have frozen due to snow covering the roof. The temperature inside the roof had a narrower daily range than the outside roof surface and the outdoor air and showed a narrower range at deeper locations inside the roof (Figure 7a,b).
The relative humidity at the surface of the thatched roof had a wider daily range than that of the outdoor air (Figure 7c,d). At night, when the relative humidity of the outdoor air was high, that of the thatched roof surface was also high, reaching 100% on many days throughout the year, and more frequently in winter (Figure 7c,d). The reason for this is that the temperature of the thatched roof surface was lower than the outdoor temperature due to nocturnal radiation, where condensation occurs. The relative humidity inside the roof fluctuated less than that outside the roof surface and the outdoor air. At a depth of 250 mm inside the roof, the variation was different from that of the outdoor air or at a depth of 50 mm. This was due to the effects of solar radiation and rainfall on the outside roof surface on the heat and moisture transfer inside the roof (Figure 7c,d).
The relative humidity of the thatched roof surface reached 100% on more than half the days of the year, which was more than double that of the outdoor air. On the other hand, there were no days when the relative humidity inside the thatched roof reached 100% during this period (Table 2).

3.5. DNA Concentration and Relative Humidity of the Thatched Roof

For microbial samples extracted from thatched roofs, the relationship between DNA concentration and relative humidity was different from the relationship found in indoor surface samples. There was no correlation between mean annual relative humidity and DNA concentration (Figure 8a, R2 = 0.159). However, the higher the number of days or longer the total time that the relative humidity reached 100%, the higher the DNA concentration (Figure 8b, R2 = 0.9986). Thus, the length of time that the relative humidity reaches 100% is supposed to have an effect on microorganisms on thatched roofs. As we will discuss later, the thatch of the roof surface, where condensation frequently occurred, deteriorated.

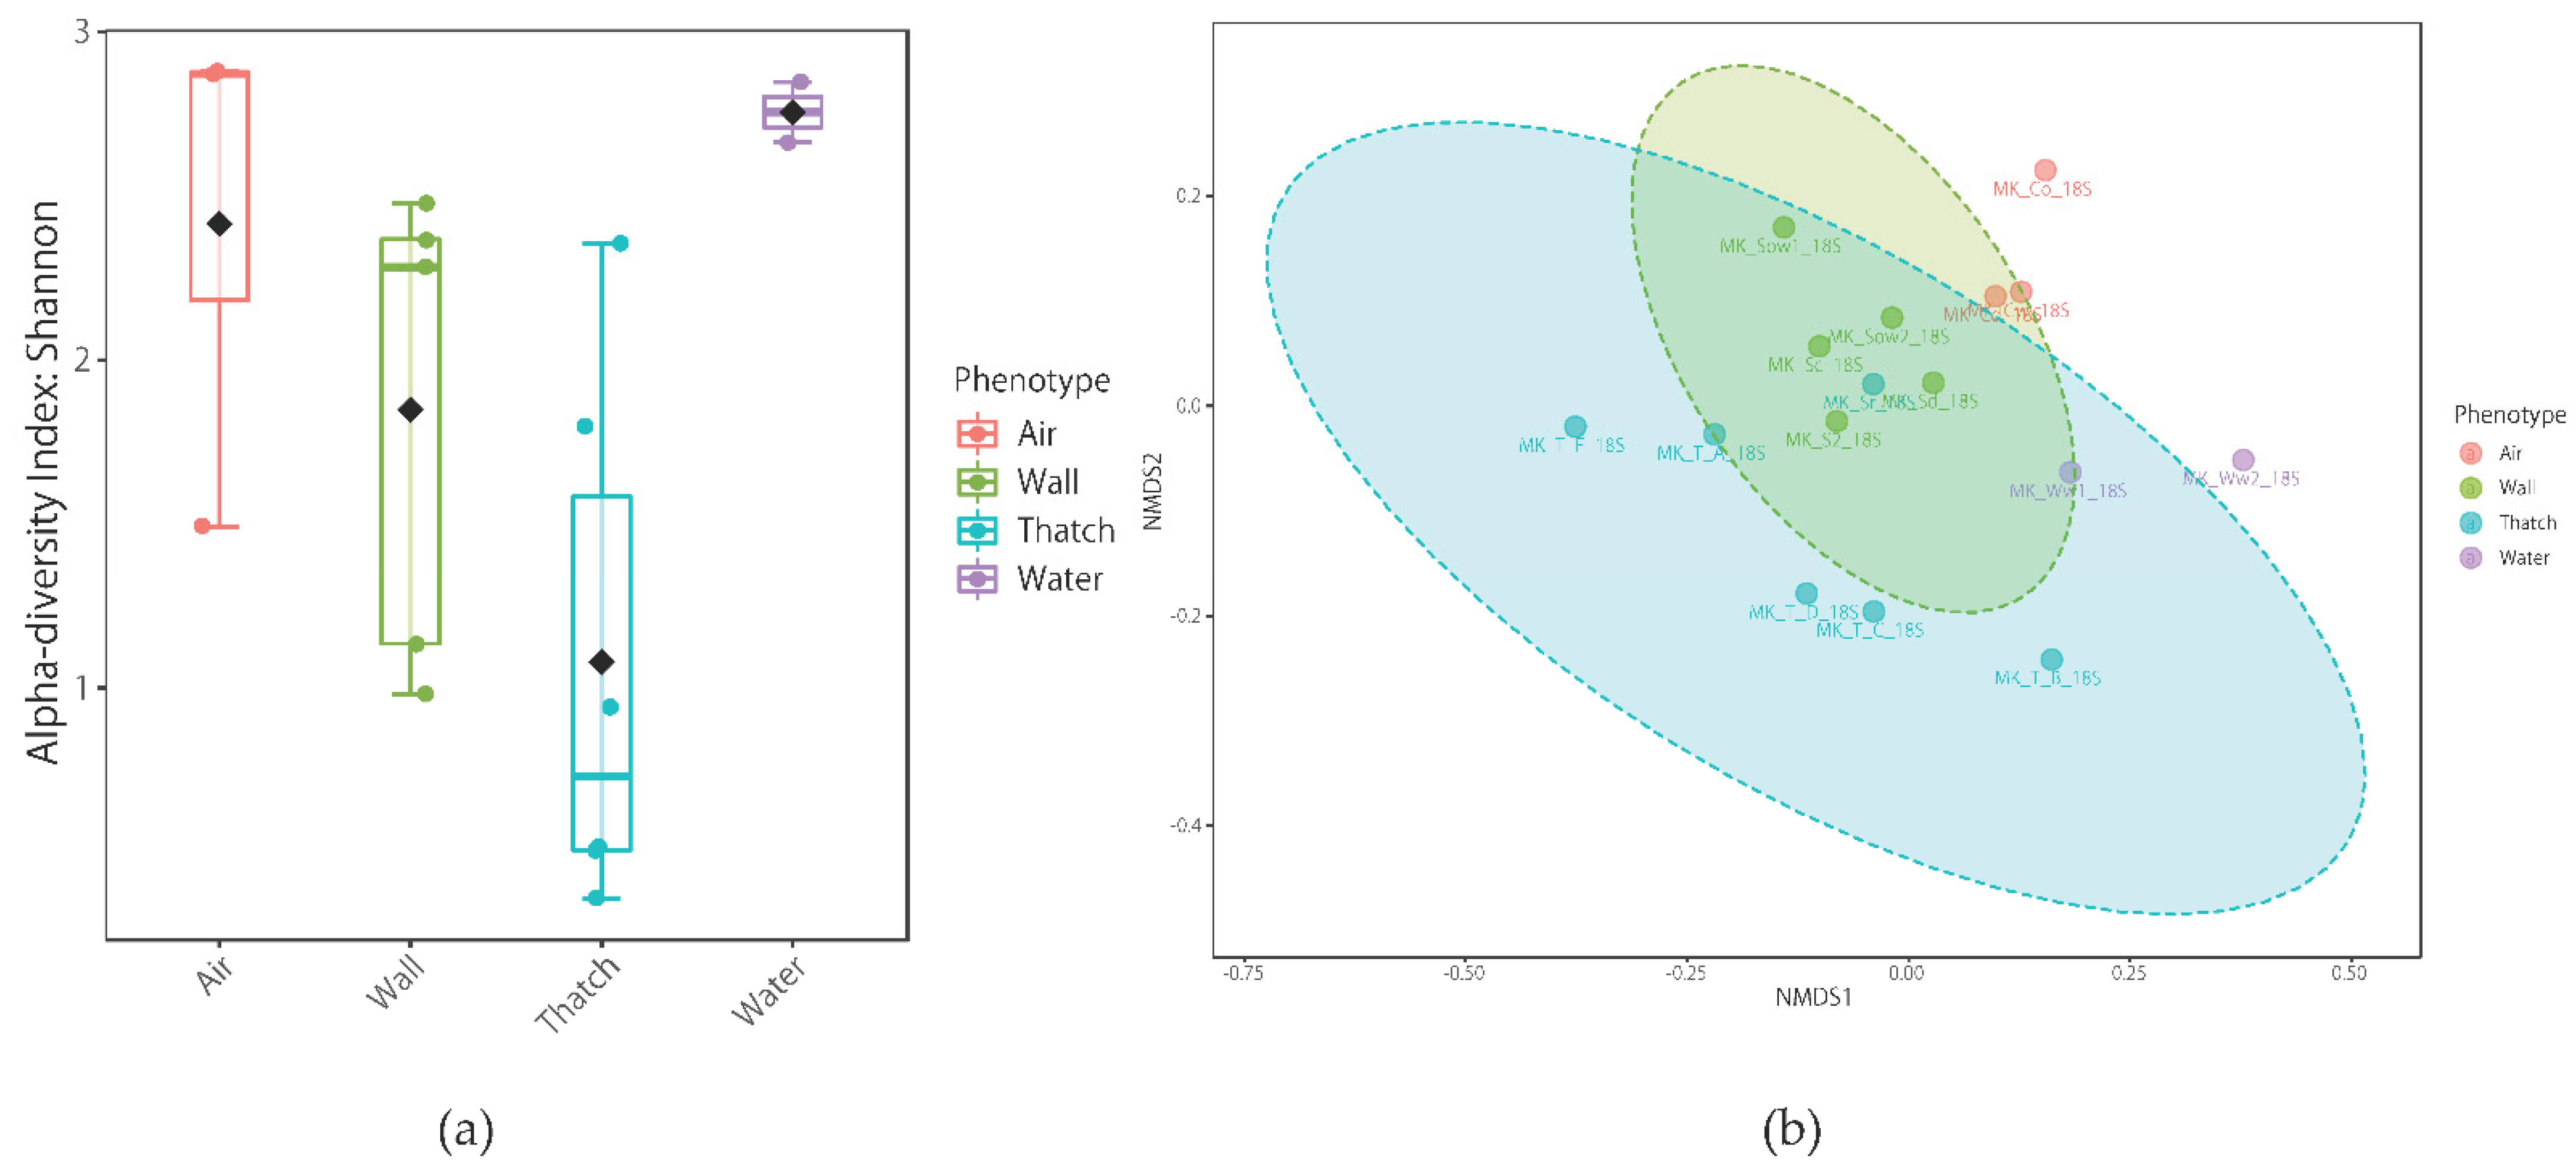
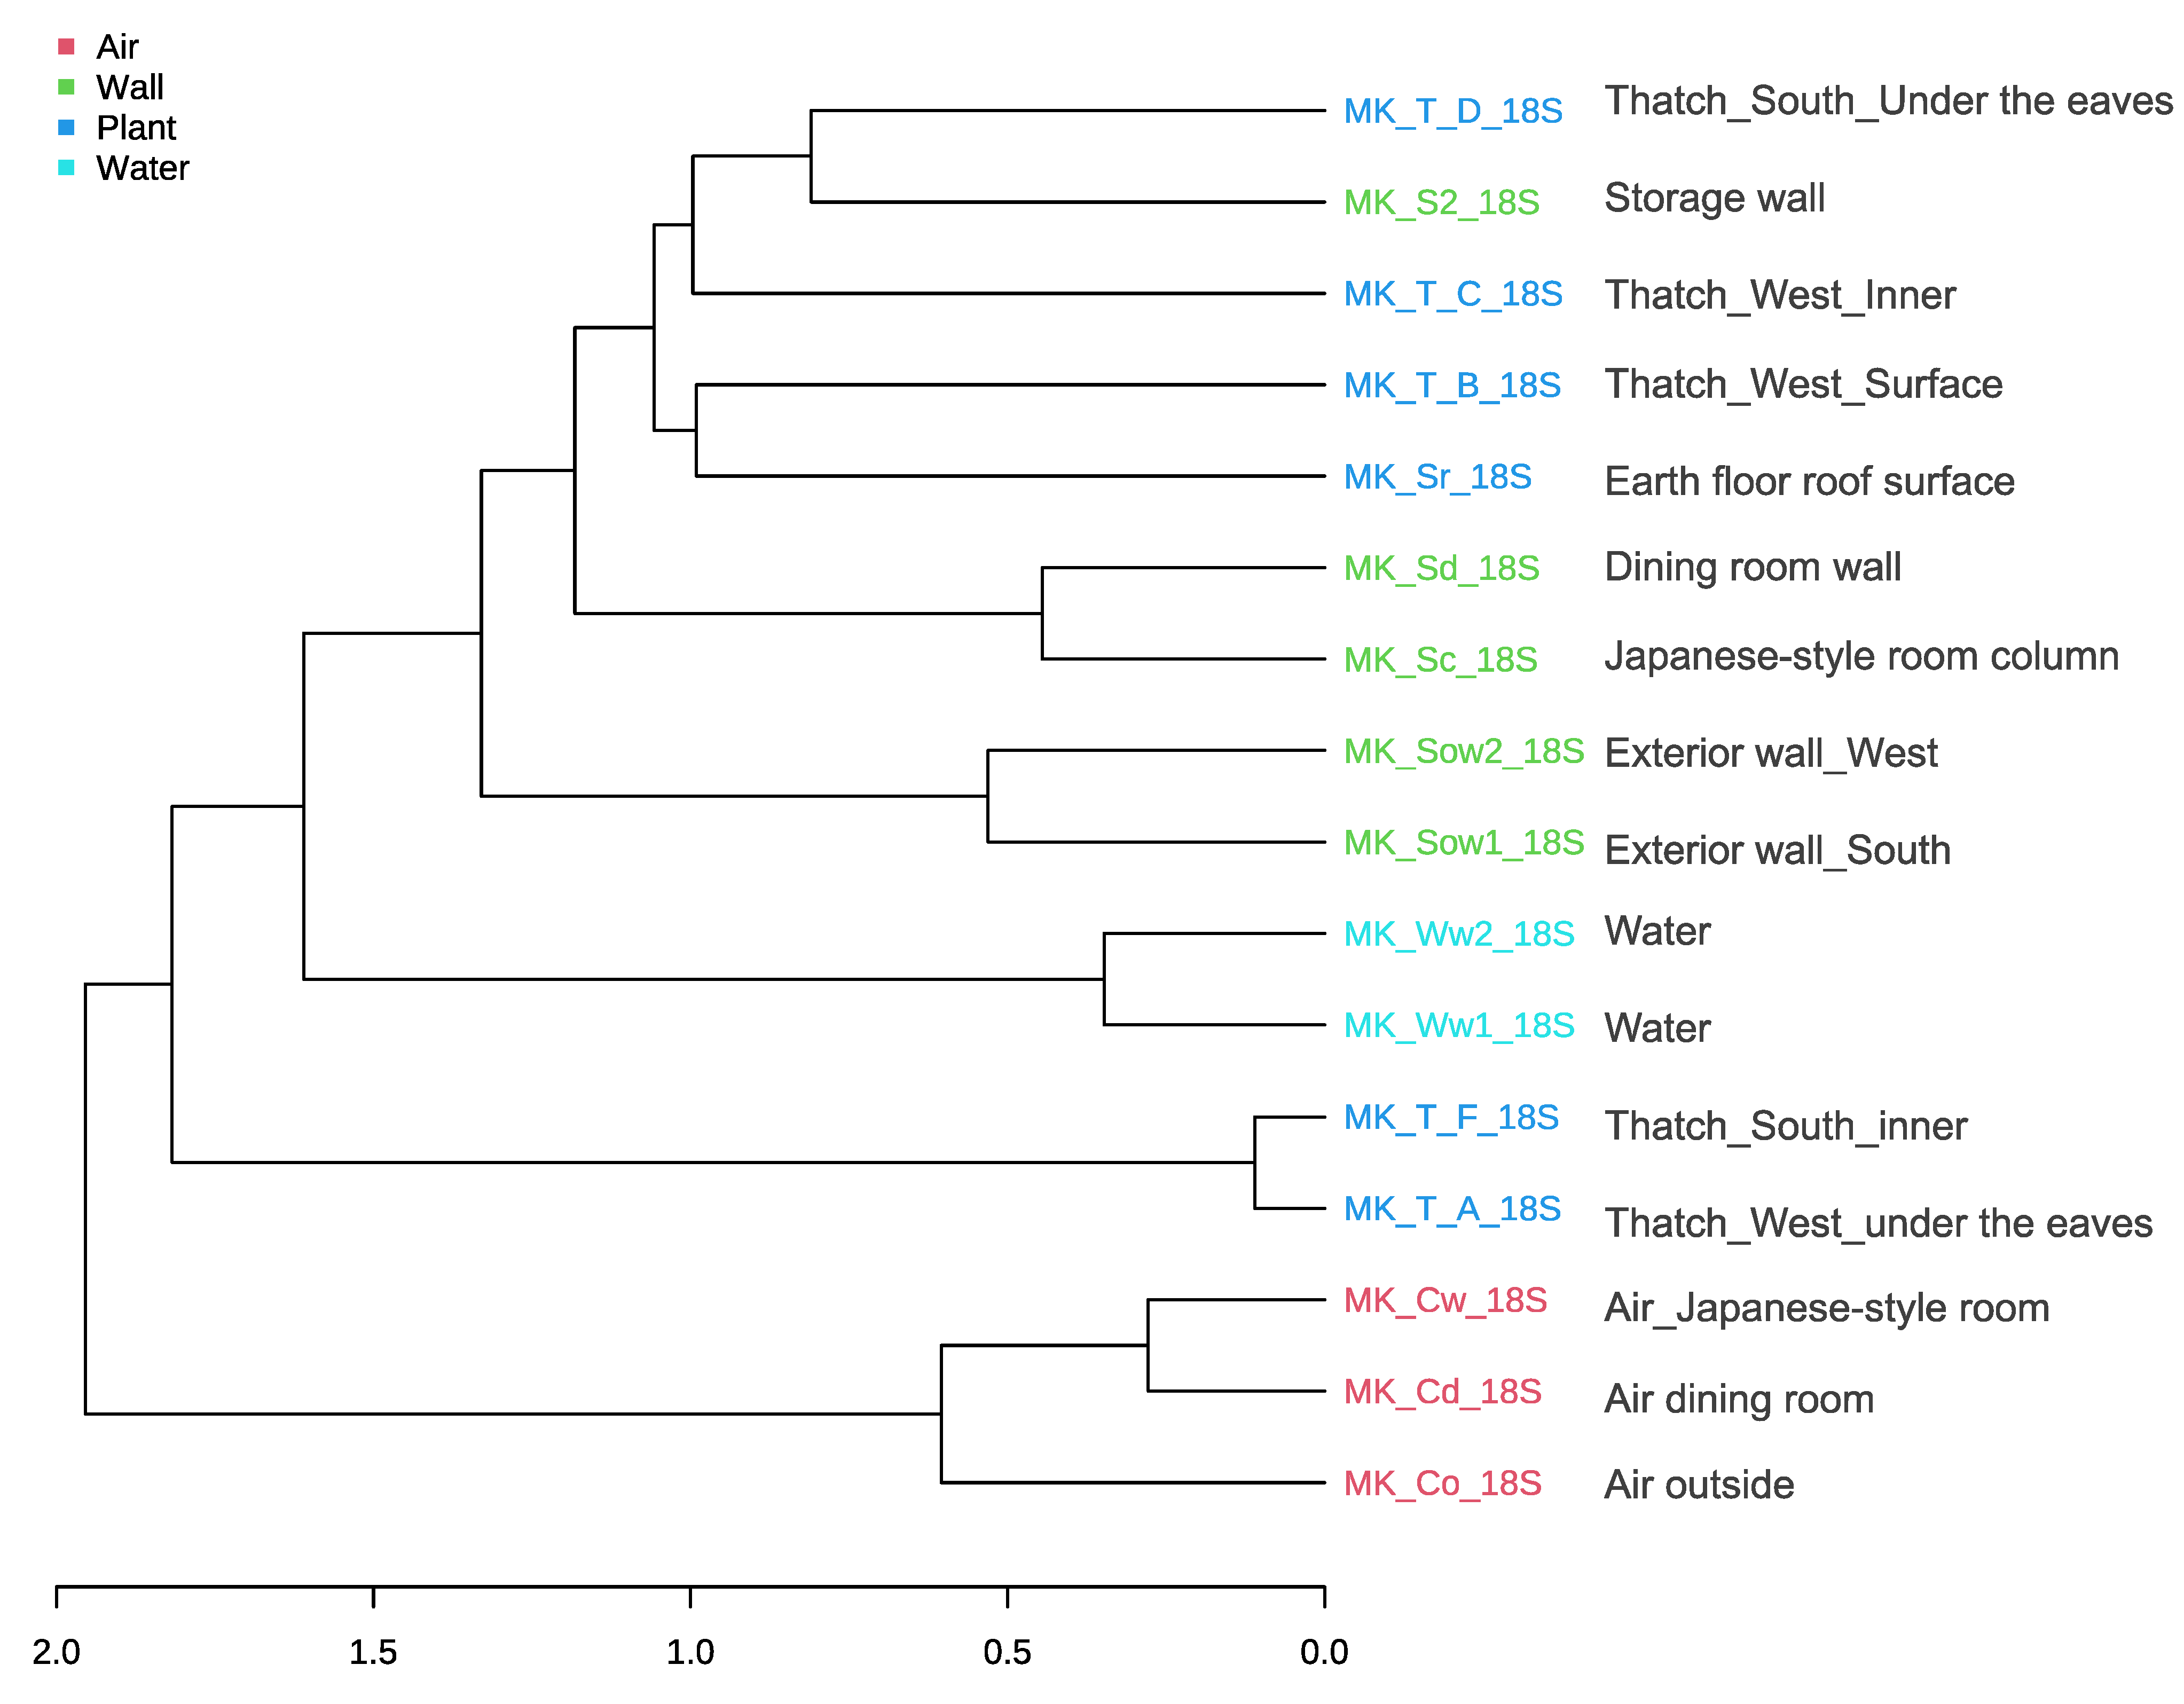
3.6. Sequence Results and Comparison of Microbial Communities

Sixteen and 13 samples were used for analysis of the 18S rRNA gene and 16S rRNA gene, respectively. Good’s coverage values were greater than 99.5% for all the samples (Supplementary Tables S2 and S3). In terms of the richness and evenness within the samples, water displayed the highest values but did not differ significantly among the samples (p > 0.05) (Figure 9a). Because of the characteristics of traditional Japanese houses with thatched roofs and earth floorspace, we collected samples from various indoor and outdoor locations (mud walls, wooden walls, earth floor, thatched roof, water, and air) to understand the microbial community structure (Figure 2). Regarding community similarity (i.e., beta diversity and hierarchical clustering), samples were grouped by phenotype, but there was a high degree of diversity among samples. Interestingly, indoor and outdoor aerosol samples overlapped (MK-Cw_18S, MK_Cd_18S and MK_Co_18S). This is different from the results of previous studies conducted in modern houses [5,26]. In general, the microbial community structure inside and outside the house is very different, and most microbes inside the house are of human origin. Even doorknobs outside the house have a very different microbial community origin from those inside the house [43]. It is likely that there is sufficient microbial exchange between the outside and inside (Figure 9b and Figure 10). Buildings affect the biogeography and the pattern of microbial spread indoors [44,45] via the building materials, surfaces, and products used [42,46,47], indoor environmental conditions (temperature, humidity, light, airflow, etc.) [30,48,49], indoor-outdoor connections, and associated microbes [19,50], etc. All of these factors affect the location of microorganisms in the built environment and their survival there. Although the built environment may seem inconvenient for microorganisms [51], they can survive indoors for months [52,53,54,55], and indoor environmental conditions can promote intermittent growth of bacteria and fungi [30]. In traditional Japanese houses with thatched roofs and earth floors, a characteristic temperature and humidity environment is formed (Figure 4). In addition, microbial diversity is presumably increased by the intervention of bringing in soil and mud walls wherein microorganisms may be fermenting plant matter, making this study distinct from many studies on microorganisms in modern buildings.

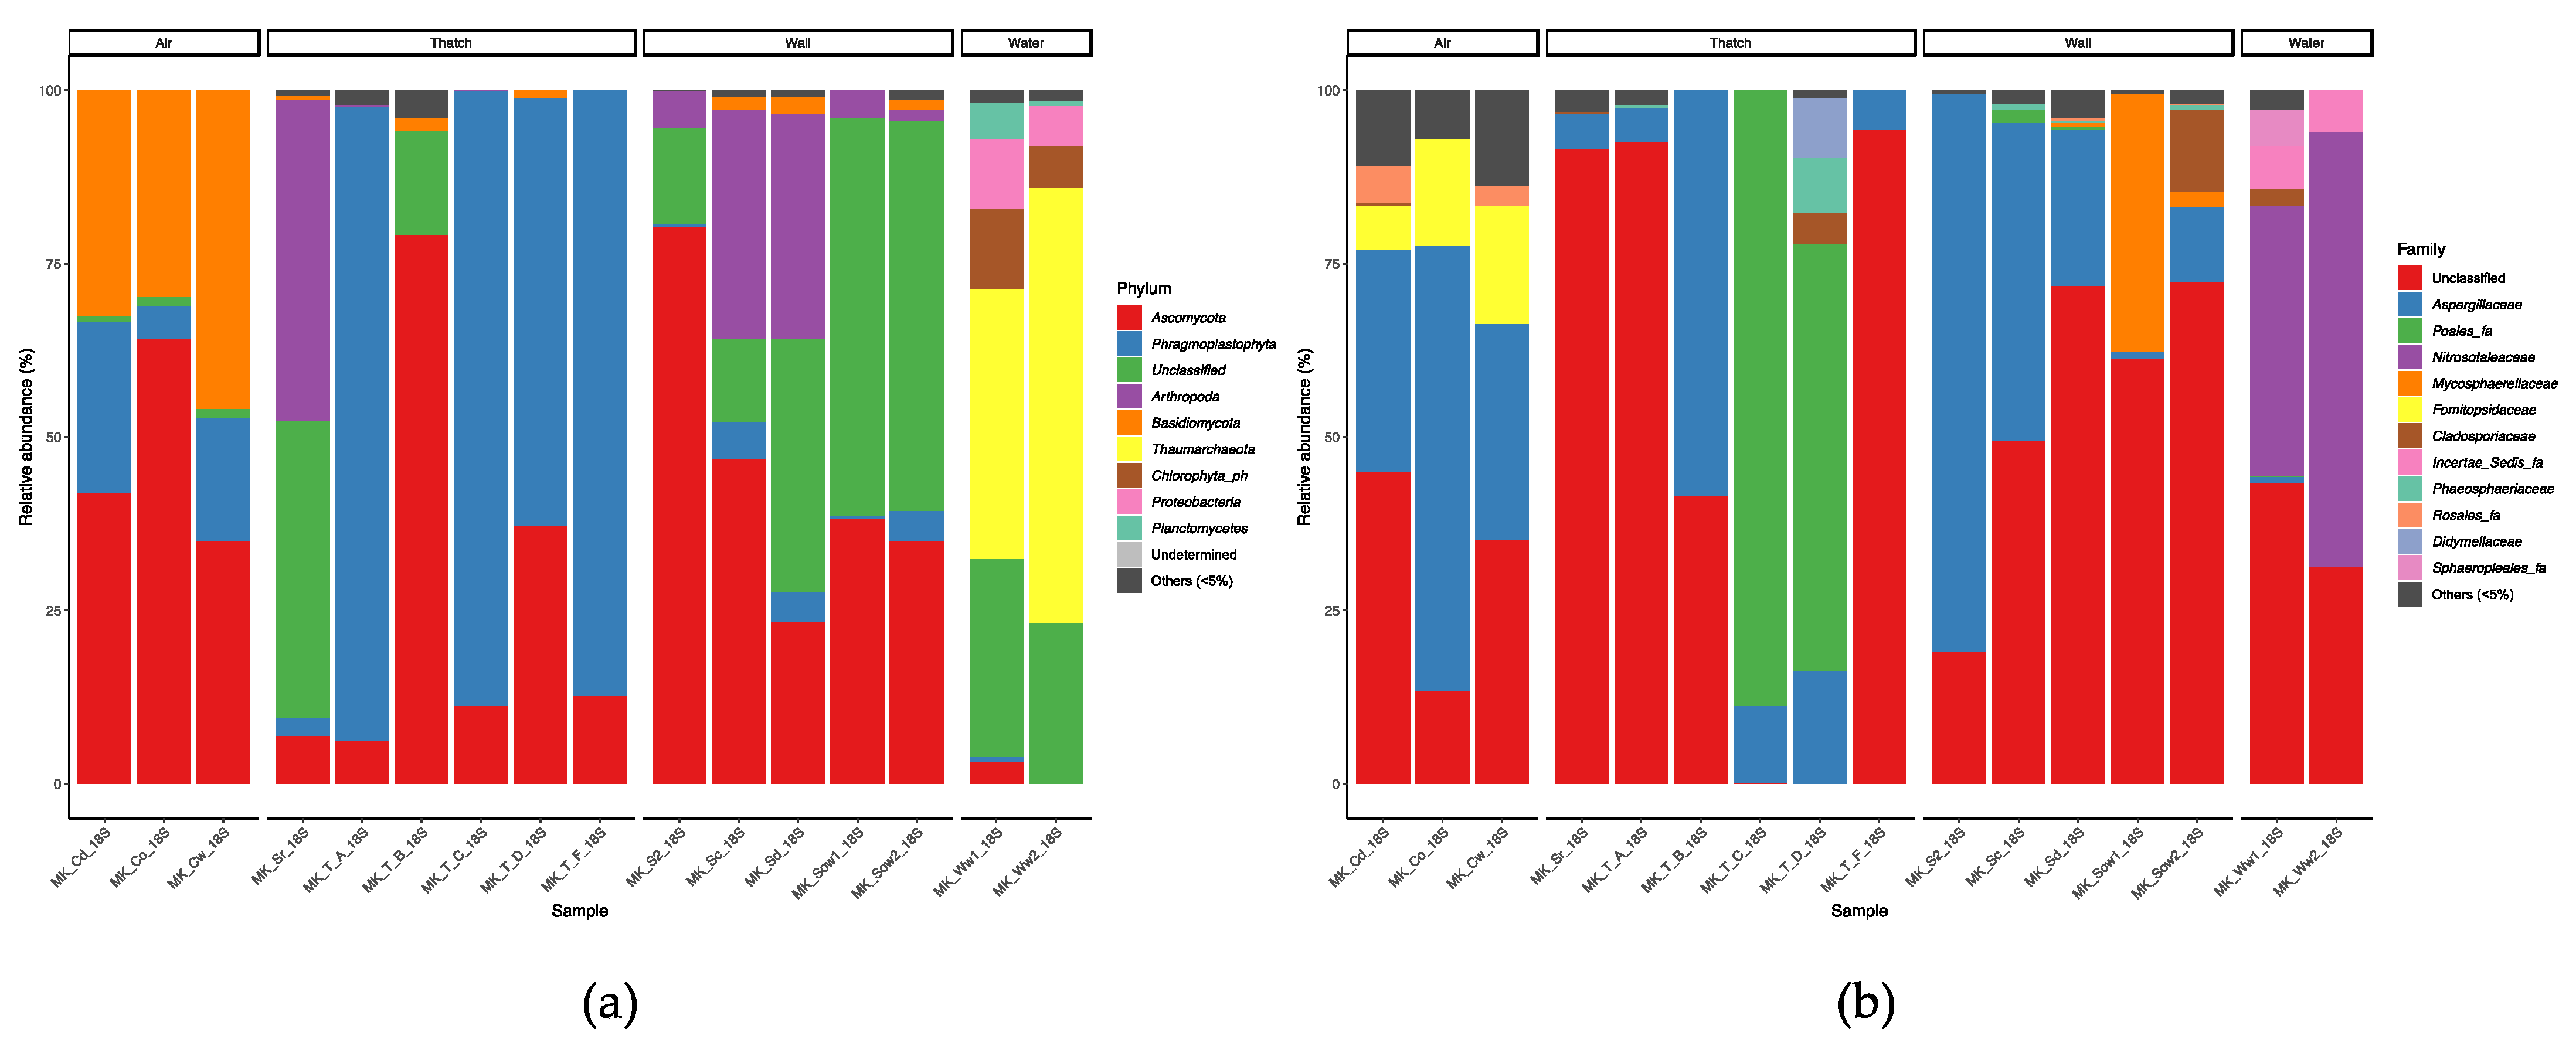
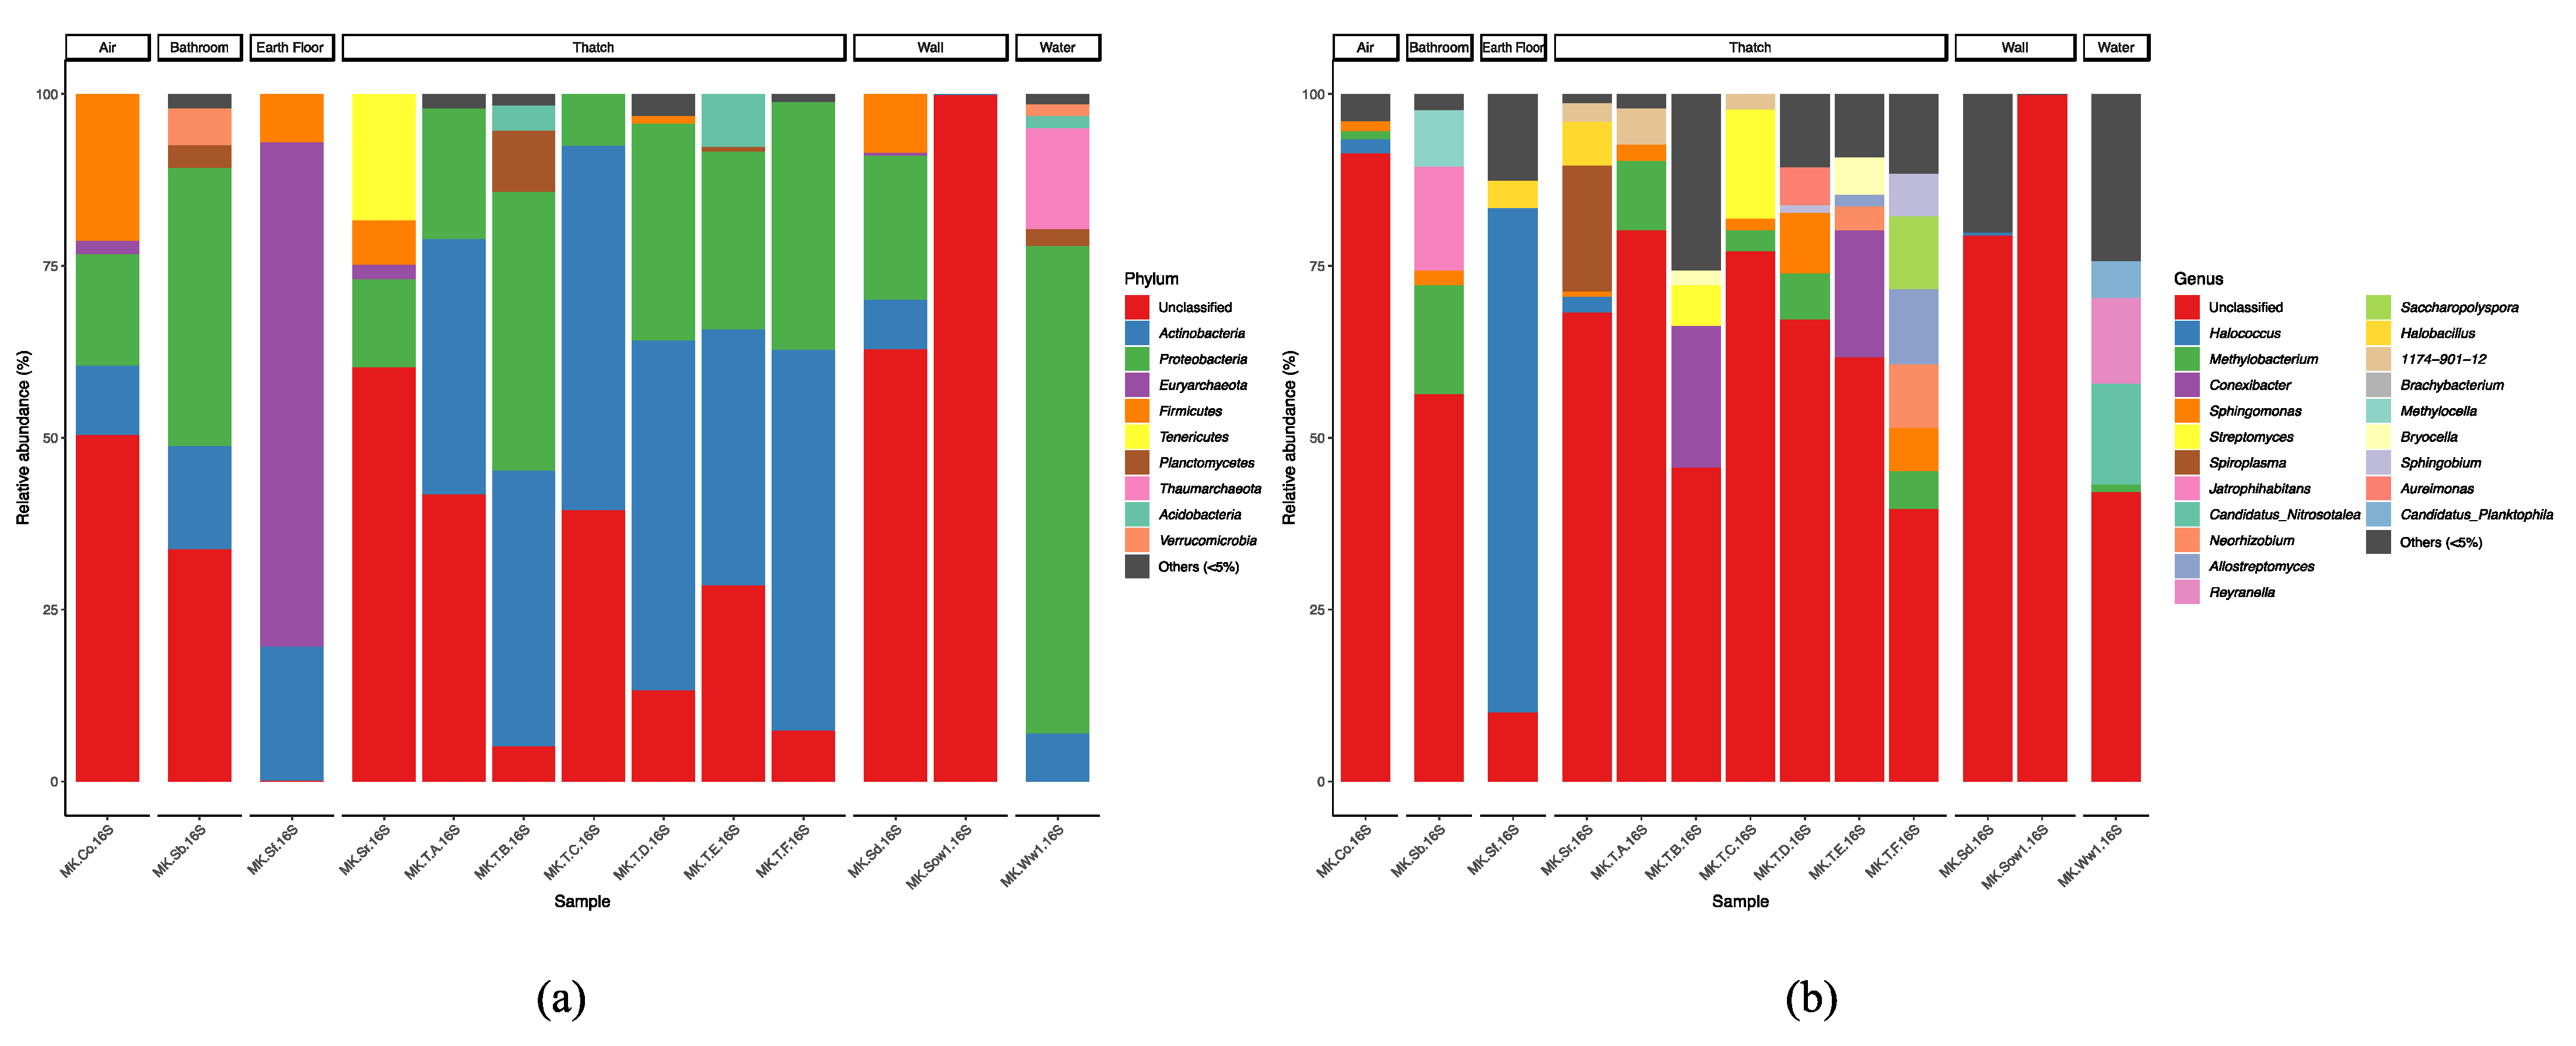
3.7. Taxonomic Composition and Biotic Interactions

For eukaryotes, Ascomycota, Phragmoplastophyta, and Basidiomycota dominated the samples. Arthropoda such as spiders, collembola, and flies were the dominant taxa in air samples. The high concentration of Arthropoda in the aerosol samples was probably due to the aspirated faeces and shell fragments. In the thatch group, most of the plants were grasses, especially MK_T_C and MK_T_D, indicating that the thatch genes from eukaryotes were not destroyed by UV. MK_T_C and MK_T_D were collected from the interior of the thatch and under the eaves, respectively. The appearance of the thatch differed depending on its location (Supplementary Figure S1), the temperature and humidity environment, and microbial features (Figure 4, Figure 7 and Figure 11). The surface thatch sample (MK_T_B) was brittle like soil. This was presumably the result of microbiological degradation, as Aspergillaceae was dominant in this sample.
What is unique microbiologically in this study is the high percentage of archaea detected. Note that archaea appear in the eukaryotic data as well as in the prokaryotic data, as the universal primer used in this study amplifies archaea [35]. In water samples, Nitrosotateaceae, an ammonia-oxidizing archaea, was dominant. In prokaryotic data, Candidatus_Nitrosotalea, an ammonia-oxidizing archaea, was also present (Figure 12). Interestingly, Halococcus, an extremely halophilic archaea, was present on the earth floor. The water in the houses is well water and has not been treated. In addition, the earth floor was also dominated by archaea, with an unusually large percentage of archaea present for a house. It has been reported that the risk of asthma in children is reduced in farm home-like indoor environments, and the microbiota of farm dust is characterized by high levels of archaea [33]. This indicates that the microbiome in the traditional Japanese house could have a positive effect on human health.

4. Conclusions

We measured the temperature and humidity outdoors, indoors, and inside the roof of a thatched-roof house with an earth floor surrounded by mountains and forests. The house was ventilated by opening the windows in summer and heated by a wood burning stove in winter, so the indoor air temperature and relative humidity were closer to the outdoor air in summer than in winter. The high thermal insulation, the high thermal capacity and the shading effect of the thatched roof, which is a characteristic of Japanese traditional houses, moderated the indoor air temperature rise in summer. For relative humidity, the annual mean value was lower and the annual range was narrower indoors than outdoors. The DNA concentration of microorganisms was greater on the earth floor surface than on indoor surfaces. The DNA concentrations on the swabbed indoor surfaces were correlated with the mean annual relative humidity and the lowest annual relative humidity. In particular, the correlation of the DNA concentrations with the lowest annual relative humidity was high. This result shows that relative humidity has a significant effect on the DNA concentration of microorganisms, including bacteria, similar to what has been reported for fungi. This suggests that lowering the minimum relative humidity is effective in suppressing the growth of microorganisms. Microbial surveys were also conducted on the surface and inside of the thatched roof. The DNA concentration of microorganisms on the outside surface of the roof was the highest, while the concentrations on the inside were lower. On the surface of the thatched roof with a high DNA concentration, condensation occurred frequently and the thatch deteriorated. It is necessary to consider the effect of the occurrence of condensation on the durability of thatched roofs. The microbial community in the subject house differed from that in a typical modern house in that there was less difference between indoor and outdoor settings or between indoor settings at each location. In addition, a high percentage of archaea were detected in the house. The earth floor was dominated by archaea, and there was an unusually large percentage of archaea present for a house. This indicates that the microbiome in the traditional Japanese house could have a positive effect on human health.
In this study, the relationship between temperature/humidity and DNA concentration was considered. How temperature and humidity, and the surface material affect the microbiome in the building environment should be considered in future work. This survey was conducted in the summer of 2020, but given that temperature and humidity environments vary greatly from season to season, it is necessary to conduct multiple surveys to examine seasonal variations. Furthermore, it also needs to be investigated in various other houses, including traditional and modern houses in Japan.

Supplementary Materials

The following are available online at https://0-www-mdpi-com.brum.beds.ac.uk/article/10.3390/d13100475/s1. Figure S1: Pulling out the thatch (a) and thatch (b); Table S1: Monthly average (a) temperature (°C) and (b) relative humidity (%) of the subject house from April, 2018 to September, 2020; Table S2: Number of 18S rRNA sequence reads; Table S3: Number of 16S rRNA sequence reads.

Author Contributions

Conceptualization, D.O. and F.M.; Methodology, M.K., S.F., D.O., M.N. and F.M.; Software, M.K. and S.F.; Validation, M.K., S.F., D.O., M.N., A.F., J.N. and F.M.; Formal analysis, M.K. and S.F.; Investigation, M.K., S.F., D.O. and J.N.; Resources, S.F., D.O. and F.M.; Data curation, S.F.; Writing—original draft preparation, M.K. and S.F.; Writing—review and editing, all authors; Visualization, M.K. and S.F.; Supervision, D.O. and F.M.; Project administration, F.M.; Funding acquisition, F.M. All authors have read and agreed to the published version of the manuscript.

Funding

This work was supported by the Japanese Society for the Promotion of Science under Grants-in-Aid for Scientific Research (KAKENHI) (grant number 20K18903 to S.F.) and KAKENHI (grant numbers 18K19674/18KK0436/20H00562) and KAKENHI (grant number 20H04326 to J.N.) and the Japanese Agency for Medical Research and Development (grant number 20wm0225012h0001/21fk0108129h0502) awarded grants to F.M. and 2021 Japan Prize Foundation Heisei Memorial Research Grant Program. This manuscript was edited for English language by American Journal Experts (AJE).

Institutional Review Board Statement

Not applicable.

Informed Consent Statement

Not applicable.

Data Availability Statement

The authors declare that all the data supporting the findings of this study are available within the paper (and its Supplementary files) and that raw data were presented where possible. The raw MiniSeq data reported in the paper (Figure 9, Figure 10, Figure 11 and Figure 12, Supplementary Tables S2 and S3) have been uploaded to the DDBJ database under the accession number DRR313886-DRR313922.

Acknowledgments

We would like to express our sincere gratitude to Makoto Nakano, President of Miyama Kayabuki Co., for his full cooperation in the research of the thatched roof house.

Conflicts of Interest

The authors declare no conflict of interest.

Appendix A. Numerical Analysis of Surface Temperature/Humidity

The ground and mud walls are porous materials. The heat and moisture transfer in porous materials are simultaneous phenomena that affect each other. Temperature and moisture chemical potential are used as the driving forces for heat and moisture transfer. The moisture chemical potential μ (J/kg) is defined by the following equation:
μ = R v T I n ( h ) = R v T I n ( p / p s a t )
  • R v : gas constant of water vapour ( R v = R / M v ) [Pa·m3/kgK]
  • R : universal gas constant [Pa·m3/kmol·K]
  • M v : molecular mass of water vapour [kg/kmol]
  • T : absolute temperature [K]
  • h : relative humidity [–]
  • p : water vapour pressure [Pa]
  • p s a t : saturated water vapour pressure [Pa]
The following assumptions are made about the porous materials treated here. (1) Moisture in porous materials is maintained under two conditions: gas-phase and liquid-phase. The solid-phase (ice) was not considered.; (2) The moisture inside porous materials is always in equilibrium between the gas phase and the liquid phase; (3) The material is homogeneous and isotropic; and (4) There is no hysteresis of moisture absorption/desorption. Based on these assumptions, the simultaneous heat and moisture transfer equations [31] are as follows (heat balance Equation (A2) and moisture balance Equation (A3)).
( c ρ ) a p p T t = · q s r · J 1 w
ρ w ( ψ μ ) μ t = · J w
The heat and moisture fluxes in the equation are defined as follows.
q s = λ T
J 1 w = λ μ g ( μ n g ) λ T g T
J 2 w = λ μ l ( μ n g ) λ T l T
J w = J 1 w + J 2 w
  • J 1 w : gas-phase moisture flux [kg/m2·s]
  • J 2 w : liquid-phase moisture flux [kg/m2·s]
  • J w : total water flux [kg/m2·s]
  • ρ w :density of liquid water [kg/m3]
  • ψ : volumetric moisture content [m3/m3]
  • μ : water chemical potential [J/kg]
  • λ μ : moisture conductivity with respect to water chemical potential gradient (= λ μ g + λ μ l ) [kg/ms(J/kg)]
  • λ μ g : moisture conductivity in the gas phase with respect to the water chemical potential gradient [kg/m s(J/kg)]
  • λ μ l : moisture conductivity in liquid-phase with respect to the moisture chemical potential gradient [kg/m·s·(J/kg)]
  • λ T : moisture conductivity with respect to temperature gradient (= λ T g + λ T l ) [kg/m·s·K]
  • λ T g : moisture conductivity in the gas phase with respect to the temperature gradient [kg/m·s·K]
  • λ T l : moisture conductivity in the liquid phase with respect to the temperature gradient [kg/m·s·K]
  • ( c ρ ) a p p : apparent volumetric specific heat of material which includes moisture [J/m3·K]
  • λ : thermal conductivity [J/m·s·K]
  • r : heat of phase change from water vapour to liquid water [J/kg]
  • n : unit vector with downward vertical direction as positive
  • g : gravitational acceleration [m/s2]
In the boundary conditions used in the numerical analysis, solar radiation and rainfall were not considered because the earth floor and the Japanese-style room wall are not directly exposed to solar radiation and rainfall. The temperature/humidity of the space is represented by measured values, while the physical properties are based on reference data [56,57]. Table A1 shows the initial and boundary conditions and the calculation domains for the earth floor and the Japanese-style room wall.
Table A1. Initial and boundary conditions and calculation domains for numerical analysis.
Earth FloorJapanese-Style Room Wall
Initial conditionsSpatial side:
measured air temperature/humidity in earth floor
Bottom of the ground:
temperature 17 [°C] (annual mean outdoor air temperature)
hydrochemical potential −1.0 [J/kg]
Indoor side:
measured air temperature/
humidity in Japanese-style room
Outdoor side:
measured air temperature/humidity outdoors
Boundary conditionsSpatial side:
Robin boundary condition
Bottom of the ground:
Dirichlet boundary condition
Both sides:
Robin boundary condition
radiative heat transfer coefficient 4.4 [W/m2·K]
convective heat transfer coefficient: earth floor space air 9.0 [w/m2·K], indoor air 4.9 [W/m2·K],
outdoor air 18.6 [W/m2·K]
measured air temperature/humidity
The moisture transfer coefficient was determined from the convective heat transfer coefficient using the Lewis relationship. The Lewis number of 0.86 [58] was used.
Calculation areadepth of the ground 20 [m]wall thickness 0.5 [m]
When solar radiation and rainfall are not taken into account, the Robin boundary condition is determined using the following equations (heat flow Equation (A8) and moisture flow Equation (A9)).
α ( T i T s ) + r α m ( p i p s ) = ( λ + r λ T g ) T x | s r λ μ g ( μ x | s n g )
α m ( p i p s ) = λ μ μ x | s λ T T x | s
  • α : combined heat transfer coefficient [W/m2·K] ( = α r + α c )
  • α r : radiative heat transfer coefficient [W/m2·K]
  • α c : convective heat transfer coefficient [W/m2·K]
  • α m : moisture transfer coefficient with respect to water vapour pressure gradient [kg/Pa·m2·s]
  • T i ,   T s : absolute temperature of air and wall surface [K]
  • p i ,   p s : water vapour pressure of air and wall surface [Pa]
  • Subscripts:
  • s: surface of the material
  • i: i represents the room (r) or the outside air (o)
The calculations were carried out by developing a program using the explicit finite difference method. The programming language used was Julia.

References

  1. Klepeis, N.E.; Nelson, W.C.; Ott, W.R.; Robinson, J.P.; Tsang, A.M.; Switzer, P.; Behar, J.V.; Hern, S.C.; Engelmann, W.H. The National Human Activity Pattern Survey (NHAPS): A resource for assessing exposure to environmental pollutants. J. Expo. Sci. Environ. Epidemiol. 2001, 11, 231–252. [Google Scholar] [CrossRef] [PubMed] [Green Version]
  2. Abe, K. Comparison of a measured fungal index determined using fungal growth and a computed fungal index based on temperature and relative humidity. J. Soc. Indoor Environ. 2006, 9, 17–24. [Google Scholar]
  3. Sedlbauer, K. Prediction of mould growth by hygrothermal calculation. J. Therm. Envel. Build. Sci. 2002, 25, 321–336. [Google Scholar] [CrossRef]
  4. Hukka, A.; Viitanen, H.A. A mathematical model of mould growth on wooden material. Wood Sci. Technol. 1999, 33, 475–485. [Google Scholar] [CrossRef]
  5. Horve, P.F.; Lloyd, S.; Mhuireach, G.A.; Dietz, L.; Fretz, M.; MacCrone, G.; Van Den Wymelenberg, K.; Ishaq, S.L. Building upon current knowledge and techniques of indoor microbiology to construct the next era of theory into microorganisms, health, and the built environment. J. Expo. Sci. Environ. Epidemiol. 2020, 30, 219–235. [Google Scholar] [CrossRef] [PubMed] [Green Version]
  6. Wickman, M.; Gravesen, S.; Nordvall, S.L.; Pershagen, G.; Sundell, J. Indoor viable dust-bound microfungi in relation to resi-dential characteristics, living habits, and symptoms in atopic and control children. J. Allergy Clin. Immunol. 1992, 89, 752–759. [Google Scholar] [CrossRef]
  7. Van Strien, R.T.; Gehring, U.; Belanger, K.; Triche, E.; Gent, J.; Bracken, M.B.; Leaderer, B.P. The influence of air conditioning, humidity, temperature and other household characteristics on mite allergen concentrations in the northeastern United States. Allergy 2004, 59, 645–652. [Google Scholar] [CrossRef] [PubMed]
  8. Harper, G.J. Airborne micro-organisms: Survival tests with four viruses. Epidemiol. Infect. 1961, 59, 479–486. [Google Scholar] [CrossRef] [Green Version]
  9. Schaffer, F.L.; Soergel, M.E.; Straube, D.C. Survival of airborne influenza virus: Effects of propagating host, relative humidity, and composition of spray fluids. Arch. Virol. 1976, 51, 263–273. [Google Scholar] [CrossRef]
  10. Lowen, A.C.; Mubareka, S.; Steel, J.; Palese, P. Influenza virus transmission is dependent on relative humidity and tem-perature. PLoS Pathog. 2007, 3, e151. [Google Scholar] [CrossRef]
  11. Stephens, B. What have we learned about the microbiomes of indoor environments? MSystems 2016, 1, e00083-16. [Google Scholar] [CrossRef] [PubMed] [Green Version]
  12. Adams, R.I.; Bhangar, S.; Dannemiller, K.C.; Eisen, J.A.; Fierer, N.; Gilbert, J.A.; Green, J.L.; Marr, L.C.; Miller, S.L.; Siegel, J.A.; et al. Ten questions concerning the microbiomes of buildings. Build. Environ. 2016, 109, 224–234. [Google Scholar] [CrossRef] [Green Version]
  13. National Academies of Sciences, Engineering, and Medicine. Microbiomes of the Built Environment: A Research Agenda for Indoor Microbiology, Human Health, and Buildings; The National Academies Press: Washington, DC, USA, 2017. [Google Scholar]
  14. Weber, D.J.; Raasch, R.; Rutala, W.A. Nosocomial infections in the ICU: The growing importance of antibiotic-resistant patho-gens. Chest 1999, 115, 34S–41S. [Google Scholar] [CrossRef] [Green Version]
  15. Namkoong, H.; Kurashima, A.; Morimoto, K.; Hoshino, Y.; Hasegawa, N.; Ato, M.; Mitarai, S. Epidemiology of pulmonary nontuberculous mycobacterial disease. Emerg. Infect. Dis. 2016, 22, 1116–1117. [Google Scholar] [CrossRef] [Green Version]
  16. Fujimura, K.E.; Demoor, T.; Rauch, M.; Faruqi, A.A.; Jang, S.; Johnson, C.C.; Boushey, H.A.; Zoratti, E.; Ownby, D.; Lukacs, N.W.; et al. House dust exposure mediates gut microbiome Lactobacillus enrichment and airway immune defense against allergens and virus infection. Proc. Natl. Acad. Sci. USA 2014, 111, 805–810. [Google Scholar] [CrossRef] [Green Version]
  17. Kirjavainen, P.V.; Karvonen, A.M.; Adams, R.I.; Täubel, M.; Roponen, M.; Tuoresmäki, P.; Loss, G.; Jayaprakash, B.; Depner, M.; Ege, M.J.; et al. Farm-like indoor microbiota in non-farm homes protects children from asthma development. Nat. Med. 2019, 25, 1089–1095. [Google Scholar] [CrossRef] [PubMed]
  18. Lax, S.; Sangwan, N.; Smith, D.; Larsen, P.; Handley, K.M.; Richardson, M.; Guyton, K.; Krezalek, M.; Shogan, B.D.; Defazio, J.; et al. Bacterial colonization and succession in a newly opened hospital. Sci. Transl. Med. 2017, 9, eaah6500. [Google Scholar] [CrossRef] [PubMed] [Green Version]
  19. Kembel, S.W.; Jones, E.; Kline, J.; Northcutt, D.; Stenson, J.; Womack, A.M.; Bohannan, B.J.; Brown, G.Z.; Green, J.L. Architectural design influences the diversity and structure of the built environment microbiome. ISME J. 2012, 6, 1469–1479. [Google Scholar] [CrossRef] [Green Version]
  20. King, P.; Pham, L.K.; Waltz, S.; Sphar, D.; Yamamoto, R.T.; Conrad, D.; Taplitz, R.; Torriani, F.; Forsyth, R.A. Longitudinal metagenomic analysis of hospital air identifies clinically relevant microbes. PLoS ONE 2016, 11, e0160124. [Google Scholar]
  21. Park, D.-U.; Yeom, J.-K.; Lee, W.-J.; Lee, K.-M. Assessment of the levels of airborne bacteria, gram-negative bacteria, and fungi in hospital lobbies. Int. J. Environ. Res. Public Health 2013, 10, 541–555. [Google Scholar] [CrossRef]
  22. Hospodsky, D.; Yamamoto, N.; Nazaroff, W.W.; Miller, D.; Gorthala, S.; Peccia, J. Characterizing airborne fungal and bacterial concentrations and emission rates in six occupied children’s classrooms. Indoor Air 2015, 25, 641–652. [Google Scholar] [CrossRef]
  23. Qian, J.; Hospodsky, D.; Yamamoto, N.; Nazaroff, W.W.; Peccia, J. Size-resolved emission rates of airborne bacteria and fungi in an occupied classroom. Indoor Air 2012, 22, 339–351. [Google Scholar] [CrossRef] [Green Version]
  24. Nakajima, M.; Masueda, D.; Hokoi, S.; Matsushita, T. Airborne Algal growth on roofs of membrane-structured residences in cold area of Japan. J. Build. Phys. 2020, 45, 113–147. [Google Scholar] [CrossRef]
  25. Glass, E.M.; Dribinsky, Y.; Yilmaz, P.; Levin, H.; Van Pelt, R.; Wendel, D.; Wilke, A.; Eisen, J.A.; Huse, S.; Shipanova, A.; et al. MIxS-BE: A MIxS extension defining a minimum information standard for sequence data from the built environment. ISME J. 2014, 8, 1–3. [Google Scholar] [CrossRef] [Green Version]
  26. Fujiyoshi, S.; Tanaka, D.; Maruyama, F. Transmission of airborne bacteria across built environments and its measurement standards: A review. Front. Microbiol. 2017, 8, 2336. [Google Scholar]
  27. Dannemiller, K.C.; Gent, J.F.; Leaderer, B.P.; Peccia, J. Influence of housing characteristics on bacterial and fungal communities in homes of asthmatic children. Indoor Air 2016, 26, 179–192. [Google Scholar] [CrossRef] [Green Version]
  28. Lax, S.; Smith, D.P.; Hampton-Marcell, J.; Owens, S.M.; Handley, K.M.; Scott, N.M.; Gibbons, S.M.; Larsen, P.; Shogan, B.D.; Weiss, S.; et al. Longitudinal analysis of microbial interaction between humans and the indoor environment. Science 2014, 345, 1048–1052. [Google Scholar] [CrossRef] [Green Version]
  29. Andersen, B.; Frisvad, J.C.; Søndergaard, I.; Rasmussen, I.S.; Larsen, L.S. Associations between fungal species and water-damaged building materials. Appl. Environ. Microbiol. 2011, 77, 4180–4188. [Google Scholar]
  30. Dannemiller, K.C.; Weschler, C.J.; Peccia, J. Fungal and bacterial growth in floor dust at elevated relative humidity levels. Indoor Air 2017, 27, 354–363. [Google Scholar] [CrossRef]
  31. Mastumoto, M. Simultaneous heat and moisture transfer in porous wall and analysis of internal condensation. In Energy of Conservation in Heating, Cooling, and Ventilating Buildings: Heat and Mass Transfer Techniques and Alternatives; Hoogendoorn, C.J., Afgan, N.H., Eds.; Hemisphere Publishing Corporation: Washington, DC, USA, 1978; pp. 45–58. [Google Scholar]
  32. Arai, S.; Kim, H.; Watanabe, T.; Tohya, M.; Suzuki, E.; Ishida-Kuroki, K.; Maruyama, F.; Murase, K.; Nakagawa, I.; Sekizaki, T. Assessment of pig saliva as a Streptococcus suis reservoir and potential source of infection on farms by use of a novel quantitative polymerase chain reaction assay. Am. J. Vet. Res. 2018, 79, 941–948. [Google Scholar] [CrossRef]
  33. Gilbert, J.A.; Jansson, J.K.; Knight, R. The Earth Microbiome project: Successes and aspirations. BMC Biol. 2014, 12, 1–4. [Google Scholar] [CrossRef] [PubMed] [Green Version]
  34. Yarimizu, K.; Fujiyoshi, S.; Kawai, M.; Norambuena-Subiabre, L.; Cascales, E.-K.; Rilling, J.-I.; Vilugrón, J.; Cameron, H.; Vergara, K.; Morón-López, J.; et al. Protocols for Monitoring harmful algal blooms for sustainable aquaculture and coastal fisheries in Chile. Int. J. Environ. Res. Public Health 2020, 17, 7642. [Google Scholar] [CrossRef]
  35. Bolger, A.M.; Lohse, M.; Usadel, B. Trimmomatic: A flexible trimmer for Illumina sequence data. Bioinformatics 2014, 30, 2114–2120. [Google Scholar] [CrossRef] [Green Version]
  36. Callahan, B.J.; McMurdie, P.J.; Rosen, M.J.; Han, A.W.; Johnson, A.J.A.; Holmes, S.P. DADA2: High-resolution sample inference from Illumina amplicon data. Nat. Methods 2016, 13, 581–583. [Google Scholar] [CrossRef] [PubMed] [Green Version]
  37. R Team DCore. R: A Language and Environment for Statistical Computing; R Foundation for Statistical Computing: Vienna, Austria, 2007; Available online: http://www.R-project.org (accessed on 18 May 2021).
  38. McMurdie, P.J.; Holmes, S. phyloseq: An R package for reproducible interactive analysis and graphics of microbiome census data. PLoS ONE 2013, 8, e61217. [Google Scholar] [CrossRef] [Green Version]
  39. Wickham, H. Ggplot2: Elegant Graphics for Data Analysis; Springer: New York, NY, USA, 2016. [Google Scholar]
  40. Yoshino, H.; Hasegawa, K.; Matsumoto, S.I. Passive cooling effect of traditional Japanese building’s features. Manag. Environ. Qual. 2007, 18, 578–590. [Google Scholar] [CrossRef]
  41. Szokolay, S. Introduction to Architectural Science, 3rd ed.; Routledge: Abingdon, UK; New York, NY, USA, 2012; pp. 35–37. [Google Scholar]
  42. Stres, B.; Danevčič, T.; Pal, L.; Fuka, M.M.; Resman, L.; Leskovec, S.; Hacin, J.; Stopar, D.; Mahne, I.; Mandic-Mulec, I. Influence of temperature and soil water content on bacterial, archaeal and denitrifying microbial communities in drained fen grassland soil microcosms. FEMS Microbiol. Ecol. 2008, 66, 110–122. [Google Scholar] [CrossRef] [Green Version]
  43. Dunn, R.R.; Fierer, N.; Henley, J.B.; Leff, J.W.; Menninger, H.L. Home life: Factors structuring the bacterial diversity found within and between homes. PLoS ONE 2013, 8, e64133. [Google Scholar]
  44. Kembel, S.W.; Meadow, J.F.; O’Connor, T.K.; Mhuireach, G.; Northcutt, D.; Kline, J.; Moriyama, M.; Brown, G.Z.; Bohannan, B.J.; Green, J.L. Architectural design drives the biogeography of indoor bacterial communities. PLoS ONE 2014, 9, e87093. [Google Scholar] [CrossRef]
  45. Hsu, T.; Joice, R.; Vallarino, J.; Abu-Ali, G.; Hartmann, E.M.; Shafquat, A.; DuLong, C.; Baranowski, C.; Gevers, D.; Green, J.L.; et al. Urban transit system microbial communities differ by surface type and interaction with humans and the environment. Msystems 2016, 1, e00018-16. [Google Scholar] [CrossRef] [Green Version]
  46. Rutala, W.A.; Weber, D.J. Surface disinfection: Should we do it? J. Hosp. Infect. 2001, 48, S64–S68. [Google Scholar] [CrossRef]
  47. Vincent, M.; Hartemann, P.; Engels-Deutsch, M. Antimicrobial applications of copper. Int. J. Hyg. Environ. Health 2016, 219, 585–591. [Google Scholar] [CrossRef]
  48. Meadow, J.F.; Altrichter, A.E.; Kembel, S.W.; Kline, J.; Mhuireach, G.; Moriyama, M.; Northcutt, D.; O’Connor, T.K.; Womack, A.M.; Brown, G.Z.; et al. Indoor airborne bacterial communities are influenced by ventilation, occupancy, and outdoor air source. Indoor Air 2014, 24, 41–48. [Google Scholar] [CrossRef]
  49. Fahimipour, A.K.; Hartmann, E.M.; Siemens, A.; Kline, J.; Levin, D.A.; Wilson, H.; Betancourt-Román, C.M.; Brown, G.Z.; Fretz, M.; Northcutt, D.; et al. Daylight exposure modulates bacterial communities associated with household dust. Microbiome 2018, 6, 1–13. [Google Scholar] [CrossRef]
  50. Vandegrift, R.; Ishaq, S.L.; Kline, J.; Fahimipour, A.; Stenson, J.; Crowley, R.; Wilson, H.; Northcutt, D.; Hartmann, E.; Johnson-Shelton, D.; et al. Shut the front door: Seasonal patterns in window operation drive fungal and bacterial community dissimilarity between indoor and outdoor air. In Proceedings of the 15th Conference of the International Society of Indoor Air Quality and Climate, INDOOR AIR 2018, Philadelphia, PA, USA, 22–27 July 2018. [Google Scholar]
  51. Gibbons, S.M. The built environment is a microbial wasteland. MSystems 2016, 1, e00033-16. [Google Scholar] [CrossRef] [Green Version]
  52. Otter, J.A.; French, G.L. Survival of nosocomial bacteria and spores on surfaces and inactivation by hydrogen peroxide vapor. J. Clin. Microbiol. 2009, 47, 205–207. [Google Scholar] [CrossRef] [PubMed] [Green Version]
  53. Kramer, A.; Schwebke, I.; Kampf, G. How long do nosocomial pathogens persist on inanimate surfaces? A systematic review. BMC Infect. Dis. 2006, 6, 1–8. [Google Scholar] [CrossRef] [Green Version]
  54. Smith, S.M.; Eng, R.H.; Padberg, F.T., Jr. Survival of nosocomial pathogenic bacteria at ambient temperature. J. Med. 1996, 27, 293–302. [Google Scholar] [PubMed]
  55. Gil, F.; Lagos-Moraga, S.; Calderón-Romero, P.; Pizarro-Guajardo, M.; Paredes-Sabja, D. Updates on Clostridium difficile spore biology. Anaerobe 2017, 45, 3–9. [Google Scholar] [CrossRef]
  56. Ogura, D.; Matsushita, T.; Matsumoto, M. Analysis of heat and moisture behavior in underground space by quasilinearized method—Accuracy range for outdoor climate variation from the reference. In Proceedings of the Building Simulation ’99: Sixth International IBPSA Conference, Kyoto, Japan, 13–15 September 1999; pp. 755–762. [Google Scholar]
  57. Takada, S.; Uno, Y.; Ota, M. Study on hygrothermal behavior of mud wall—Measurement of sorption isotherm and analysis onindoor temperature and humidity. Summ. AIJ Kinki Chapter Res. Meet. Environ. Eng. 2013, 53, 177–180. (In Japanese) [Google Scholar]
  58. Eckert, E.R.; Drake, R.M., Jr. Analysis of Heat and Mass Transfer; McGraw Hill: New York, NY, USA, 1972; p. 733. [Google Scholar]
Figure 1. Photographs of (a) the subject house, (b) the earth floor space, (c) the Japanese-style room and dining room, and (d) underside of the thatched roof.
Diversity 13 00475 g001
Figure 2. (a) Floorplan of the subject house. (b,c) The temperature/humidity measurement points (red and orange dots) and the microbial sampling locations (blue, yellow, and green dots) were plotted on the plan. Coriolis (yellow plots) means sampling locations using a biological air sampler (Coriolis Micro, Bertin Technologies, France). ▲ indicates the main entrance, and △ indicates the back entrances.
Diversity 13 00475 g002aDiversity 13 00475 g002b
Figure 3. Daily mean (a) temperature (°C) and (b) relative humidity (%) in 2019. Outdoor air and indoor air (dining room and Japanese-style room) data are shown in this graph.
Diversity 13 00475 g003
Figure 4. Measured value of temperature (°C)/relative humidity (%) in 2019. (a) Temperature in summer (1–14 August 2019), (b) temperature in winter (1–14 February 2019), (c) relative humidity in summer (1–14 August 2019), and (d) relative humidity in winter (1–14 February 2019).
Diversity 13 00475 g004
Figure 5. The calculation results of surface temperature (°C)/relative humidity (%) and the measured values of air temperature/humidity of the (a) earth floor and (b) Japanese-style room wall.
Diversity 13 00475 g005
Figure 6. Correlation between DNA concentrations of microorganisms and relative humidity on indoor surfaces. The horizontal axis represents the (a) mean annual relative humidity, (b) highest annual relative humidity, (c) lowest annual relative humidity, and (d) annual range of relative humidity.
Diversity 13 00475 g006
Figure 7. Measured values of temperature (°C)/relative humidity (%) of thatched roofs from 2019 to 2020. (a) Tempera in summer (1–14 June 2019), (b) temperature in winter (1–14 February 2020), (c) relative humidity in summer (1–14June 2019), and (d) relative humidity in winter (1–14 February 2020), amount of solar radiation is also plotted in figures of temperature ((a,b) pale orange lines), and the amount of precipitation was also plotted in figures of relative humidity ((c,d) pale blue lines).
Diversity 13 00475 g007
Figure 8. Correlation between the DNA concentrations of microorganisms and relative humidity on the west side of the thatched roof. The horizontal axis represents the (a) annual mean relative humidity and (b) total hours when the relative humidity reached 100%. The samples were collected from three locations (under side of the eaves, roof surface side, and inner side of roof), and the relative humidity of outdoor air, roof surface 1, and 250 mm inside the roof were adapted.
Diversity 13 00475 g008
Figure 9. (a) Eukaryotic alpha-diversity measured using the Shannon index at the OTU level. There was no significant difference among the phenotypes (p > 0.05). (b) Nonmetric multidimensional scaling (nMDS) analysis based on Bray-Curtis dissimilarity metrics of samples labelled according to phenotype based on eukaryotic community composition. Unclear separation among the phenotypes was observed (PERMANOVA, F-value = 2.81, R-squared = 0.41, p value ≤ 0.01). Ellipses represent the 95% confidence interval. See details for Supplementary Table S2 for detailed explanation of each sample label.
Diversity 13 00475 g009
Figure 10. Hierarchical clustering of the eukaryotic community based on distance measurements using the Bray-Curtis dissimilarity index and a clustering algorithm using the Ward distance. The samples from the wall and thatch could not be readily distinguished.
Diversity 13 00475 g010
Figure 11. Taxonomic composition of eukaryotes at the phylum (a) and family (b) levels.
Diversity 13 00475 g011
Figure 12. Taxonomic composition of prokaryotes at the phylum (a) and genus (b) levels.
Diversity 13 00475 g012
Table 1. Annual average value, annual highest value, annual lowest value, and annual range of (a) temperature (°C) and (b) relative humidity (%) in 2019 at each location. All the values in these tables are rounded off to one decimal place.
(a)
Annual MeanAnnual HighestAnnual LowestAnnual Range
outdoor air14.137.3−1.538.8
earth floor space15.433.32.031.3
space under the ceiling17.334.02.431.6
storage18.934.95.129.8
dining room21.334.26.427.8
Japanese-style room21.739.66.433.2
(b)
Annual MeanAnnual HighestAnnual LowestAnnual Range
outdoor air84.410017.382.7
earth floor space78.094.927.367.6
space under the ceiling69.389.827.762.2
storage68.888.929.559.4
dining room60.690.524.665.9
Japanese-style room60.791.818.573.4
Table 2. The number of days and total time that the relative humidity reached 100% per year are shown for the outdoor air, thatched roof surface, and 250 mm inside the thatched roof. For the thatched roof surfaces and inside the roof, there were times when relative humidity data were not available. The number of days was calculated by counting the days when the relative humidity reached 100%, even temporarily. Since the measurement interval was 30 min, the total time (hours) was calculated as the number of data points at which the relative humidity reached 100% multiplied by 30 min.
Outdoor AirRoof Surface 1Roof Inner 250 mm
Days731850
Total time406.5890.50
Number of data available17,56816,81917,567
Publisher’s Note: MDPI stays neutral with regard to jurisdictional claims in published maps and institutional affiliations.

