Article

Investigating Genetic Diversity and Genomic Signatures of Hatchery-Induced Evolution in Gilthead Seabream (Sparus aurata) Populations

by
Konstantinos Gkagkavouzis
1,*,†,
Spiros Papakostas
1,†,
Francesco Maroso
2,
Nikoleta Karaiskou
1,
Adrian Carr
3,
Einar Eg Nielsen
4,
Luca Bargelloni
2 and
Alexandros Triantafyllidis
1
1
Department of Genetics, Development and Molecular Biology, School of Biology, Aristotle University of Thessaloniki, 54124 Thessaloniki, Greece
2
Department of Comparative Biomedicine and Food Science, University of Padua, 35122 Legnaro, Italy
3
Fios Genomics Ltd., Edinburgh EH16 4UX, UK
4
Section for Population Ecology and Genetics, National Institute of Aquatic Resources, Technical University of Denmark, DK-2800 Silkeborg, Denmark
*
Author to whom correspondence should be addressed.
These authors contributed equally to this work.
Submission received: 7 September 2021 / Revised: 29 October 2021 / Accepted: 29 October 2021 / Published: 5 November 2021

Abstract

:
The identification of the genetic basis of domestication in fish species is of timely importance for the aquaculture industry in order to increase productivity, quality, and the welfare of farmed fish. The goal of this study is to investigate the largely unknown aquaculture-induced evolution in gilthead seabream, which is one of the most important farmed fish in the Mediterranean region. We used a panel of 1159 genome-wide SNPs, and genotyped 956 fish from 23 wild populations of Mediterranean-wide distribution and 362 farmed fish from five Greek hatcheries. We assessed the genetic diversity of the sampled populations and contrasted the results of four different approaches of outlier detection methods. We recognized one very strong candidate and two good candidate SNPs with evidence for aquaculture-induced evolution in gilthead seabream. The annotation of these SNPs revealed neighboring genes with biological roles from stress tolerance and disease resistance to sexual maturation that may explain our observations. In conclusion, we demonstrate that the genome of gilthead seabream, despite the fact that the species is often suggested to be in the early stages of the domestication process, shows evidence of aquaculture-induced evolution. We report on a list of genes that may explain our observations and that may be investigated further. We anticipate that our findings will stimulate additional research with the use of SNP panels of higher density that can elucidate the genomic architecture of domestication in this species of high aquacultural interest.

1. Introduction

Understanding the genetic basis of domestication is a fascinating and multifaceted topic of relevance to both basic and applied research and is of timely significance to the aquaculture industry. Studies of ancient DNA in animals and plants domesticated thousands of years ago have helped to answer longstanding questions on when, where, and how many times each of these species has been domesticated [1,2,3,4]. Domesticated species also provide excellent evolutionary experiments for studying genotype-phenotype maps [4,5] and for understanding the genetic basis of successful growth in captivity under stressful environmental conditions, which most often involve high growth rates, high population densities, and resistance to pathogens [6,7]. In aquaculture, such knowledge may help with the application of genomic selection practices over traditional breeding programs [8]. Furthermore, assuming a degree of parallel and convergent evolution, for example, as has been observed in plant domestications [9], the study of fish genomic adaptations in captive environments holds the promise of assisting efforts towards the domestication of new fish populations and species. Notably, the vast majority of newly farmed organisms over the last few decades have been aquatic animals, encompassing several different fish species and a variety of crustaceans and mollusks [10,11].
Aquaculture is a relatively young industry with comparably large gaps of knowledge on the genetic basis of domestication for most farmed fish [12]. Unlike most terrestrial animals and plants, fish farming and the breeding of aquatic organisms started relatively recently; thus, most species used in aquaculture are considered to be in the early stages of their domestication process [10,13], although evidence of domestication in fish has been demonstrated as early as within a few generations [7,14,15]. Recently, significant effort has been devoted to whole-genome sequencing of farmed aquatic species and to the production of genetic tools that will allow researchers to recognize genetic variations that are associated with key traits of interest to aquaculture, such as growth, stress, and pathogen resistance [16,17,18]. Nevertheless, given the polygenic nature of most traits, the typical small effective population size of cultured populations, and the early stage of domestication for aquaculture species, the identification of single loci with large effects is most often observed [19,20]. Growing attention is thus being paid to methods of detecting polygenic selection and of identifying intermediate and smaller effect variants or rare alleles in order to prioritize genomic regions for the next phase of breeding programs and to identify the genetic architecture that shapes the desired phenotypes in important aquaculture species [21,22,23,24,25].
The gilthead seabream (Sparus aurata) is amongst the most important farmed fish in the Mediterranean region, with little knowledge on its genetic basis of domestication. The production of farmed gilthead seabream has increased more than seven-fold over the past two decades [26,27]. Its domestication started relatively recently, in the 1980s, and most production is currently derived from intensive farming with Turkey and Greece as the largest producers [28,29]. The first commercial breeding programs for gilthead seabream have been reported almost 20 years ago [30,31]. As of 2015, eight companies had active selective breeding programs of gilthead seabream, four of which were from Greece [32]. Detailed information on these programs is difficult to obtain due to restrictive company policies. Janssen et al. reported that most of these companies had family-based selection programs for one to five generations, and that selected traits involved growth performance, morphology, disease resistance, and feed efficiency [32]. A 5–10% increase in the growth rate per generation has been reported in gilthead seabream that were selected for three generations [33]. Thus, the average selection response in bodyweight at harvest for gilthead seabream is expected to be similar to that of other fish species [34].
The gilthead seabream represents an intriguing case of farmed fish in which domestication may be significant but masked by high levels of inbreeding. Inbreeding depression may be particularly high in farmed gilthead seabream due to its protandric hermaphroditism, which lowers the effective population size of cultured populations, and its mass spawning behavior, which may quickly erode genetic variations due to highly unequal parental contributions [28,35,36,37]. To date, little evidence exists on the genetic signatures of domestication, if any, in gilthead seabream. Some early comparisons between six wild and five farmed populations across the Mediterranean using 16 allozyme and six microsatellite markers, as well as DNA sequences of a part of the mitochondrial control region, provided evidence of genetic structure in the wild populations and of genetic divergence due to genetic drift in the farmed populations [38]. Šegvić-Bubić et al. combined data from nine microsatellite markers and 19 morphological characteristics to suggest some degree of genetic and morphological differentiation between wild and farmed gilthead seabream populations in the Adriatic Sea region [39]. More recently, the analysis of 1159 single-nucleotide polymorphism (SNP) markers dispersed genome-wide from 23 wild gilthead seabream populations of Mediterranean-wide distribution, has helped to clarify the biogeographic structure of the species [40]. Three distinct genetic clusters of distinct geographic origin were found, namely the Atlantic (ATL), West Mediterranean (WMED) and East Mediterranean clusters, with the latter clusters further subdivided into an Ionian/Adriatic (ION) and an Aegean (AEG) genetic cluster [40]. Effectively using the same set of SNP markers on cultured gilthead seabream from five Greek hatcheries, researchers in [41] identified three genetic clusters with a high degree of differentiation between the cultured and wild populations. The intriguing question thus arises as to whether the hatchery divergence is primarily driven by domestication selection or genetic drift. A scenario of selection should reveal the parallel divergence of the same SNPs between wild and hatchery populations, as seen in Atlantic salmon [42], whereas the divergence should be randomly distributed among SNP loci in the genetic drift scenario. In this study, we aimed to investigate this question by performing a series of genetic outlier tests between the four wild and three cultured previously identified genetic clusters using the same samples as in Maroso et al. and Gkagkavouzis [40,41]. Throughout this work, the terms “cultured” and “farmed” populations or individuals are used interchangeably and have the same meaning.

2. Materials and Methods

2.1. Sampling and SNP Dataset

A total of 956 wild individuals from 23 different locations and 362 farmed individuals from 5 Greek hatcheries were analyzed (Table 1). The species is not protected in any of the sampling areas and all samples came from commercially fished animals or were provided by the hatcheries; therefore, no specific permission or approval was required for this study. Tissues (fin clip or muscle) were preserved in 95% ethanol right after sampling.
Total DNA was extracted using a column-based kit (Invisorb Spin Tissue Mini Kit, Invitek, STRATEC Biomedical, Birkenfeld, Germany) and a salt precipitation method, using SSTNE buffer, for the samples that failed with the kit.
Multiple ddRAD libraries were prepared, including up to 144 samples each, splitting samples from the same population into different libraries to avoid confounding biases. More details on library preparation and bioinformatic analysis up to SNP calling are described in [40]. Briefly, reads with one or more uncalled bases were filtered out, as well as reads with 11 or more consecutive bases with an average quality score less than 20 (1% error rate). For samples sequenced on multiple lanes, reads were combined into a single file before processing. The Stacks 1.3 [43,44] de novo pipeline was used to cluster reads into consensus tags and call high-quality SNPs. SNPs were filtered out if scored in less than 80% of the analyzed samples and when the minor allele frequency (MAF) was lower than 0.5%. Accordingly, samples were filtered to retain only those genotyped at more than 80% of the markers.

2.2. Genetic Diversity and Population Structure

GenAlEx 6.502 [45] was used to calculate expected (He) and observed (Ho) heterozygosity as well as the fixation index (FIS). FST matrices were calculated with Arlequin 3.5.2.1 [46] using 50,000 permutations to test for significance. To summarize and visualize the genetic relationships among groups: the model-based clustering method, implemented in Structure 2.3.4 [47], was run using different k values and replicates of each k value and using the sampling location as a priori information. The analysis was run with k ranging from one to ten for the wild populations and from one to five for the farmed populations, each repeated five times to allow the evaluation of the likelihood of different simulated numbers of ancestral clusters. Burn in (BI) was set to 50,000 and the number of iterations (IT) to 100,000. Results from different runs were collated and the most likely k values were detected using the Evanno’s method, implemented in Structure Harvester [48]. A further Structure run was carried out with the most likely k value, using 100,000 burn-in cycles and 300,000 iterations. A joint analysis of both the wild and the farmed populations was run using the program fastSTRUCTURE v.1.0 [49] for reasons of computational efficiency. Similar to the Structure analysis, fastSTRUCTURE was run with the default parameters for k values ranging from one to ten, with five repetitions for cross-validation (CV). Results were processed with StructureSelector [50] with the optimal k value selected as the one that minimized the CV error. The structure plot was then visualized using Distruct [51] from CLUMPAK [52].

2.3. Outlier Analyses

Genome-wide genotyping offers increased power for finding genetic regions potentially under natural selection. These loci can be then used to correlate genetic and phenotypic traits selected in a particular environment. Given that there is no single method that can confidently detect genomic outliers in all experimental designs, e.g., [53], we employed various methods to detect outliers detected under different assumptions and models: two Bayesian approaches implemented in BayeScan 2.1 [54,55,56] and BayeScEnv [57], which, additionally to BayeScan, incorporates environmental information in the form of ‘environmental differentiation’ and two methods based on the f-statistic, implemented in Arlequin [46] and Lositan [58]. A combination of different methods is strongly advised to obtain reliable information from the data [59]. Outlier detection analyses were carried out with samples grouped into distinct genetic clusters, as suggested by our clustering analysis. Specifically, pairwise comparisons of every wild cluster with every farmed cluster were performed using Arlequin, using a hierarchical island model, and Lositan. To address concerns associated with multiple test comparisons in Arlequin and Lositan, we obtained an FDR estimate for the list of significant SNPs, detected across all pairwise comparisons using the R package “qvalue” [60]. Q-value is a widely used multiple testing criterion that describes the proportion of false positives expected within a set of significant features [61]. To further minimize the possibility of false positives in Arlequin and Lositan, we considered only SNPs that were found to be significant in at least two of the pairwise comparisons performed for each genetic cluster of farmed fish. This strategy also allowed us to minimize the possibility of population effects in the wild samples. For BayeScan analysis, all the clusters were analyzed in common, whereas in BayeScEnv the wild/farmed origin was set as an environmental parameter in each cluster before their common analysis. All four programs were run with default parameters and outlier panels were defined using a threshold of p-value/FDR < 0.05.

2.4. SNP Annotation

In order to investigate the functional effects of the studied SNPs, we relied on sequence similarity local blastn searches using sequenced regions flanking to the SNPs. As a search database for the blastn searches we used the latest genome assembly of the species (GenBank Assembly: GCA_900880675.1 fSpaAur1.1; date of download: 28 April 2021). The maximum permitted e-value was set to 1E-10. Finding a unique and confident blast hit for the vast majority of the SNPs proved trivial, given that in most cases the length of the adjacent sequence information was sufficient (501 bp for 968 of the SNPs and then between 495 bp and 90 bp for the remaining 189 SNPs—mean = 149 bp). In the end, a genomic location was confidently assigned to most of the SNPs (Supplementary File S1).
In addition to their genomic location, for significant SNP outliers we also retrieved information on neighboring genes, which, due to hitchhiking, background selection or both, e.g., [62], may also have a role in the observed patterns of divergent selection for the particular SNP. Some reports suggest that causative genes can be up to 2 Mbps away from trait-associated SNPs [63]; however, we do not consider this to be the case in our study given that such observations were made largely on large-effect SNPs identified from genome-wide association studies with high-density SNP panels [63]. Here, we inspected genes within a window of 20 Kbps in either direction, which is much closer to what is considered common practice, e.g., [63,64,65].
To investigate common functional themes of associated genes, that is, of the genes found within 20 Kbps from the significant SNP outliers, we relied on semantic similarity measures of Gene Ontology (GO) annotations. Semantic similarity measures assess the degree of relatedness between Gene Ontologies by means of similarity in the meaning of their annotations [66], thus allowing additional-to-enrichment ways to assist in their interpretation from noise reduction and multidimensional scaling to graph-based visualizations [67,68]. GO terms for our list of studied genes were retrieved using the official GO annotations for zebrafish (Danio rerio) orthologs, given that zebrafish is a genetic model for teleosts [69]. The GO annotations for zebrafish were downloaded from the Gene Ontology consortium (www.geneontology.org; release: 1 September 2021) and zebrafish ortholog IDs were identified using the gene names at the UniProt database (www.uniprot.org, accessed on 2 September 2021). GO semantic similarity was calculated by means of the SimRel measure with default allowed similarity = 0.7 using the REVIGO program [70]. Multidimensional scaling was then applied to the similarity matrix of GO terms as implemented by REVIGO followed by K-means clustering to decide on clusters of semantically similar GO terms. K-means clustering was performed using the K-means method from the Scikit-learn module in Python [71] for K numbers from 1 to 10 with the final number of K decided using the Elbow method using distortion, calculated as the average of squared distances from the cluster centers of the respective clusters for each K value. The analysis was focused on the Biological Process category of GO terms as we wanted to focus on the “larger processes or biological programs accomplished by multiple molecular activities” (http://geneontology.org/docs/ontology-documentation/, accessed on 1 September 2021) instead of specific molecular functions and cellular components. A Jupyter notebook with the dataset and the accompanying Python script for the K-means analysis is provided in the Supplementary Materials (Supplementary File S2).

3. Results

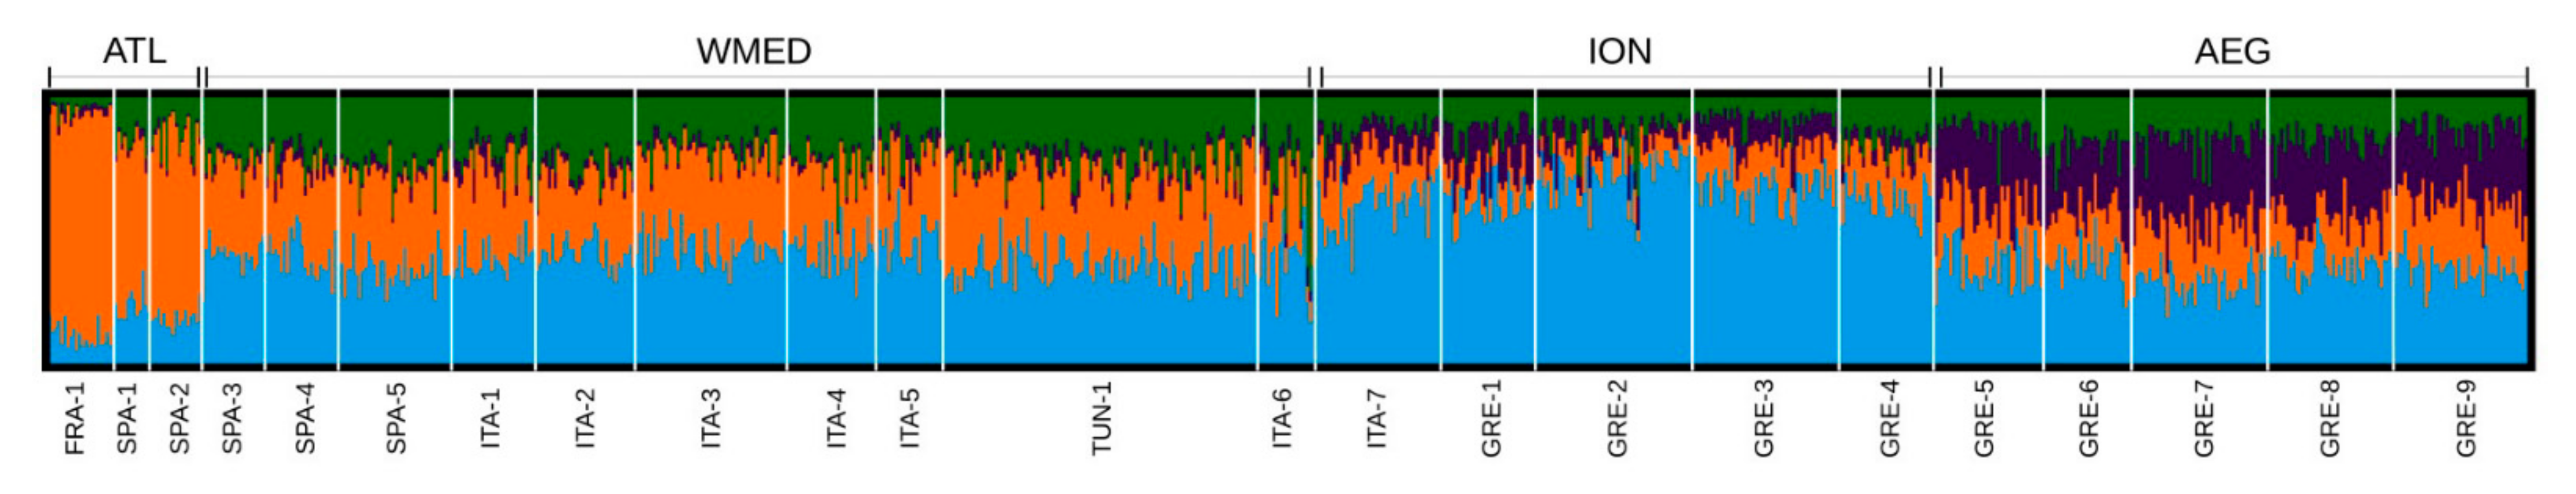
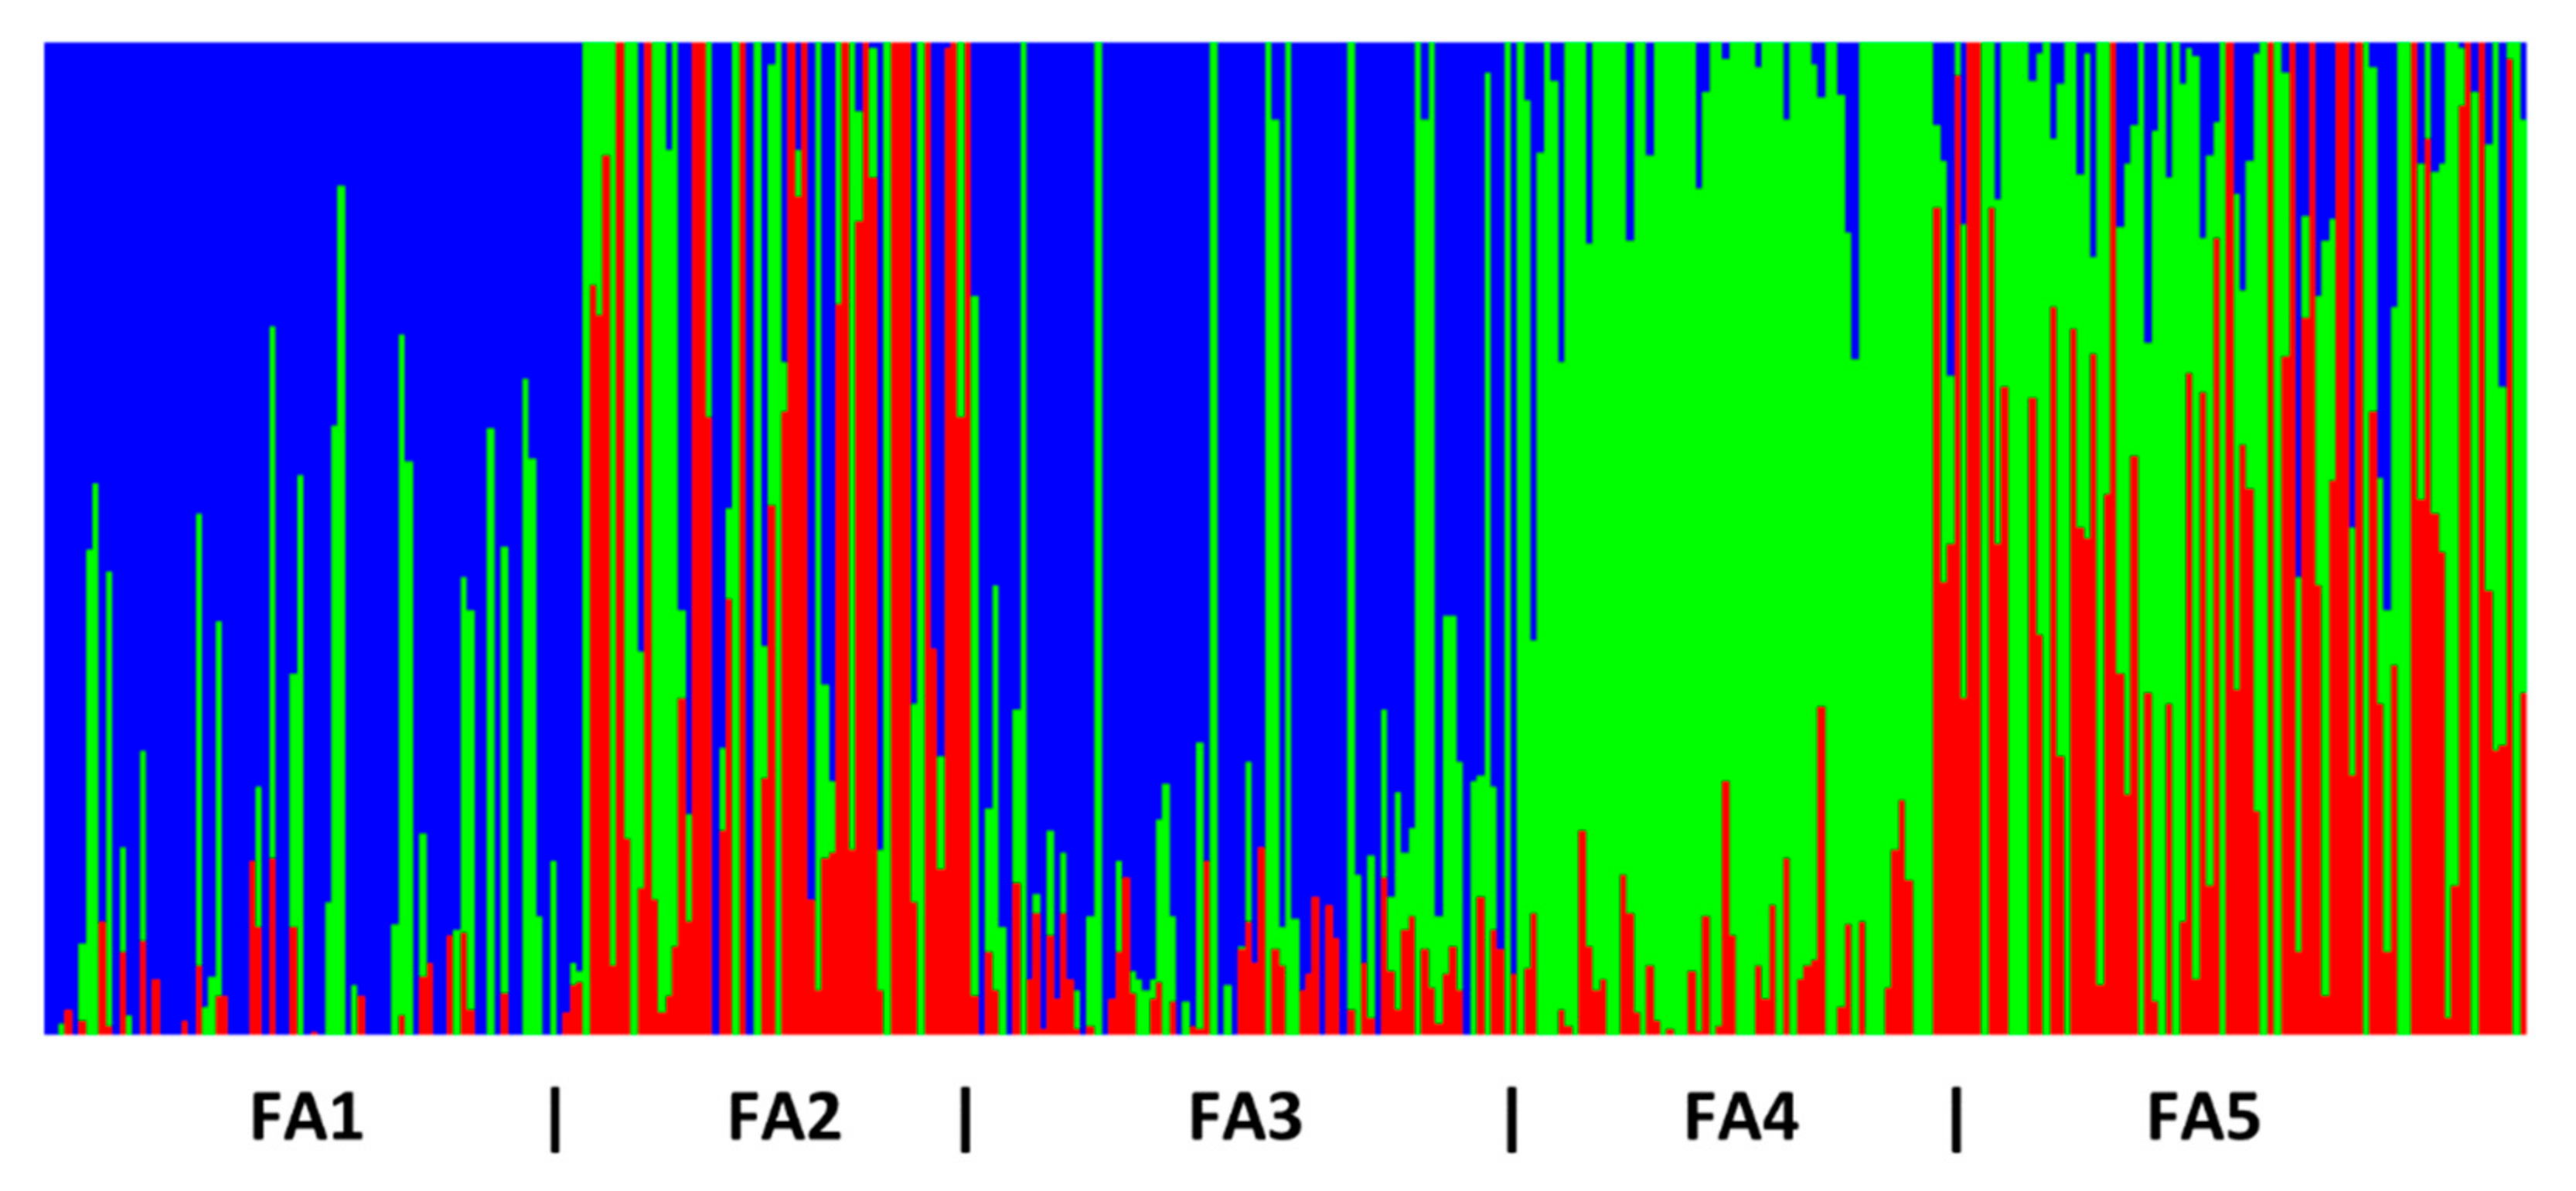
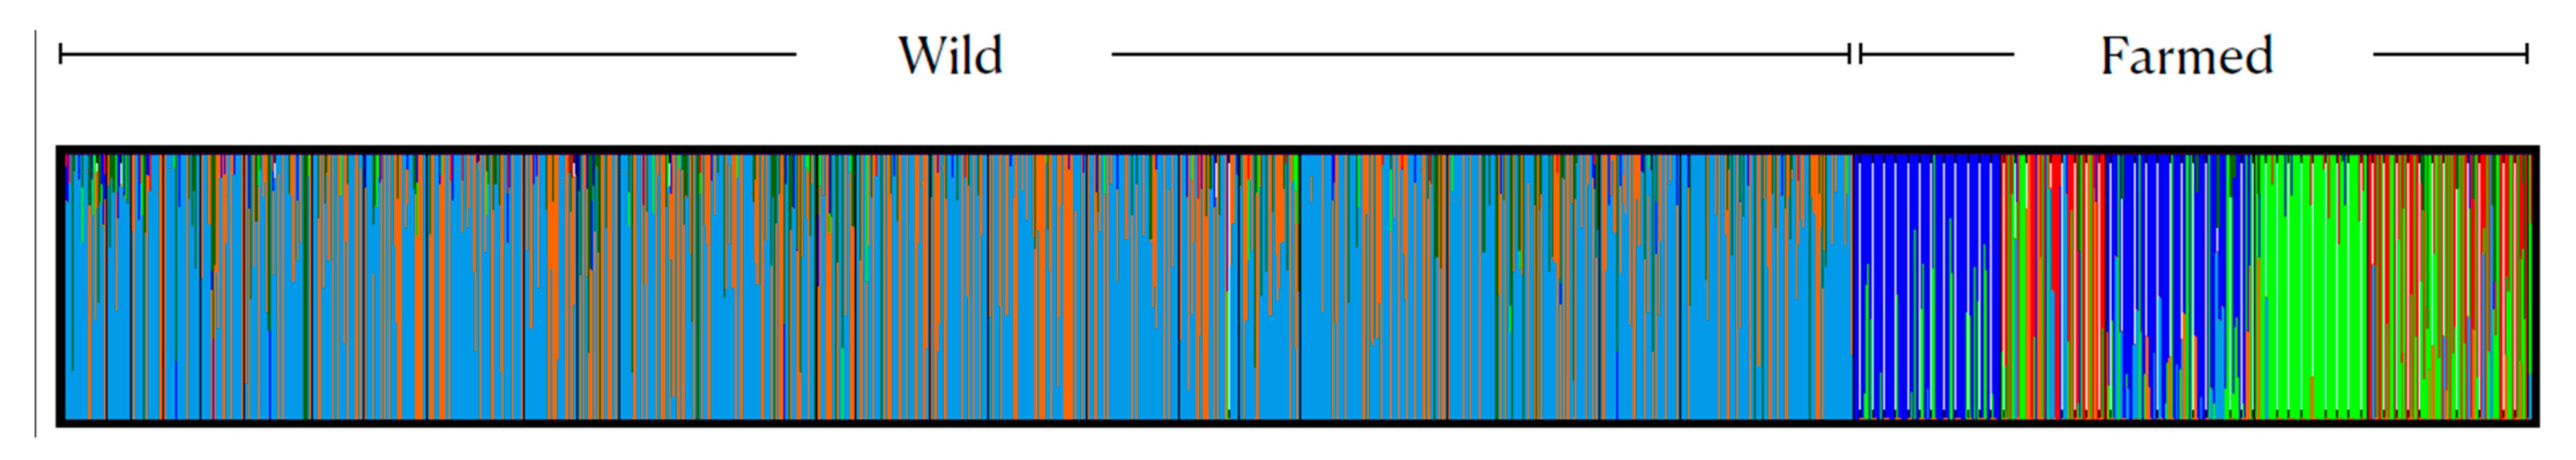
3.1. Genetic Diversity and Population Genetic Structure

After filtering the raw reads and the initial number of called SNPs, as described in detail by Maroso et al. [40], 956 wild gilthead seabreams were consistently genotyped at 1159 high-quality SNPs. In this sample dataset, 362 farmed individuals were added with their genotypes, acquired in the context of the Aquatrace project. Of the overall data set, two non-common genotyped loci were removed (8727_39, 13938_26) and the final dataset consisted of 1318 gilthead seabreams genotyped at 1157 SNPs, which were used for the subsequent analyses.
For the wild populations, the mean observed and expected heterozygosity values were 0.14 (range 0.12–0.15) and 0.15 (range 0.14–0.16), respectively (Table 1). These parameters tended to be lower in the Atlantic populations. The inbreeding index varied from 0.03 to 0.10 and averaged 0.07 (Table 1). No general trend was found for this parameter when comparing Atlantic and Mediterranean samples. For the farmed populations, mean observed and expected heterozygosity were also 0.14 (range 0.13–0.15) and 0.15, respectively, which were not significantly different from the wild populations. The inbreeding index varied from 0.05 to 0.09 and averaged at 0.07, the same value as in the wild populations. This is possibly due to the implementation of breeding programs and circulation of favorable breeders among fisheries, as the first key step of such programs is to address the problem of inbreeding amongst breeders by restocking (S.P. Pers. Comm; [32]). The FST values among hatcheries and the clusters of wild populations ranged between 2.4% and 4.9% and all the pairwise calculations were statistically significant (p ≤ 0.005) (Supplementary File S3).
The genetic structure results, obtained with the SNP datasets for the wild populations, are described extensively in [40]. Overall, the results suggested a subdivision of wild gilthead seabream into four major genetic clusters: Atlantic (ATL), West Mediterranean (WMED), Ionian/Adriatic seas (ION), and the Aegean Sea (AEG), with the strongest differentiation being between Atlantic and Mediterranean samples (Figure 1).
Similarly, for genetic structure analysis of the farmed populations, Evanno’s method suggested a subdivision into three genetic clusters as being the most likely result, and all runs at this number of ancestral groupings showed the same clustering pattern. Farmed samples showed a high degree of admixture with the structure’s Bayesian analysis, with the FA1 and FA3 hatcheries’ samples assigned into the same cluster, the FA2 and FA5 hatcheries’ samples clustered together, and the FA4 hatchery’s samples assigned to their own individual cluster (Figure 2). The joint analysis supported a clear distinction between wild and cultured populations (Figure 3) for the optimal k = 7 (Supplementary File S4).

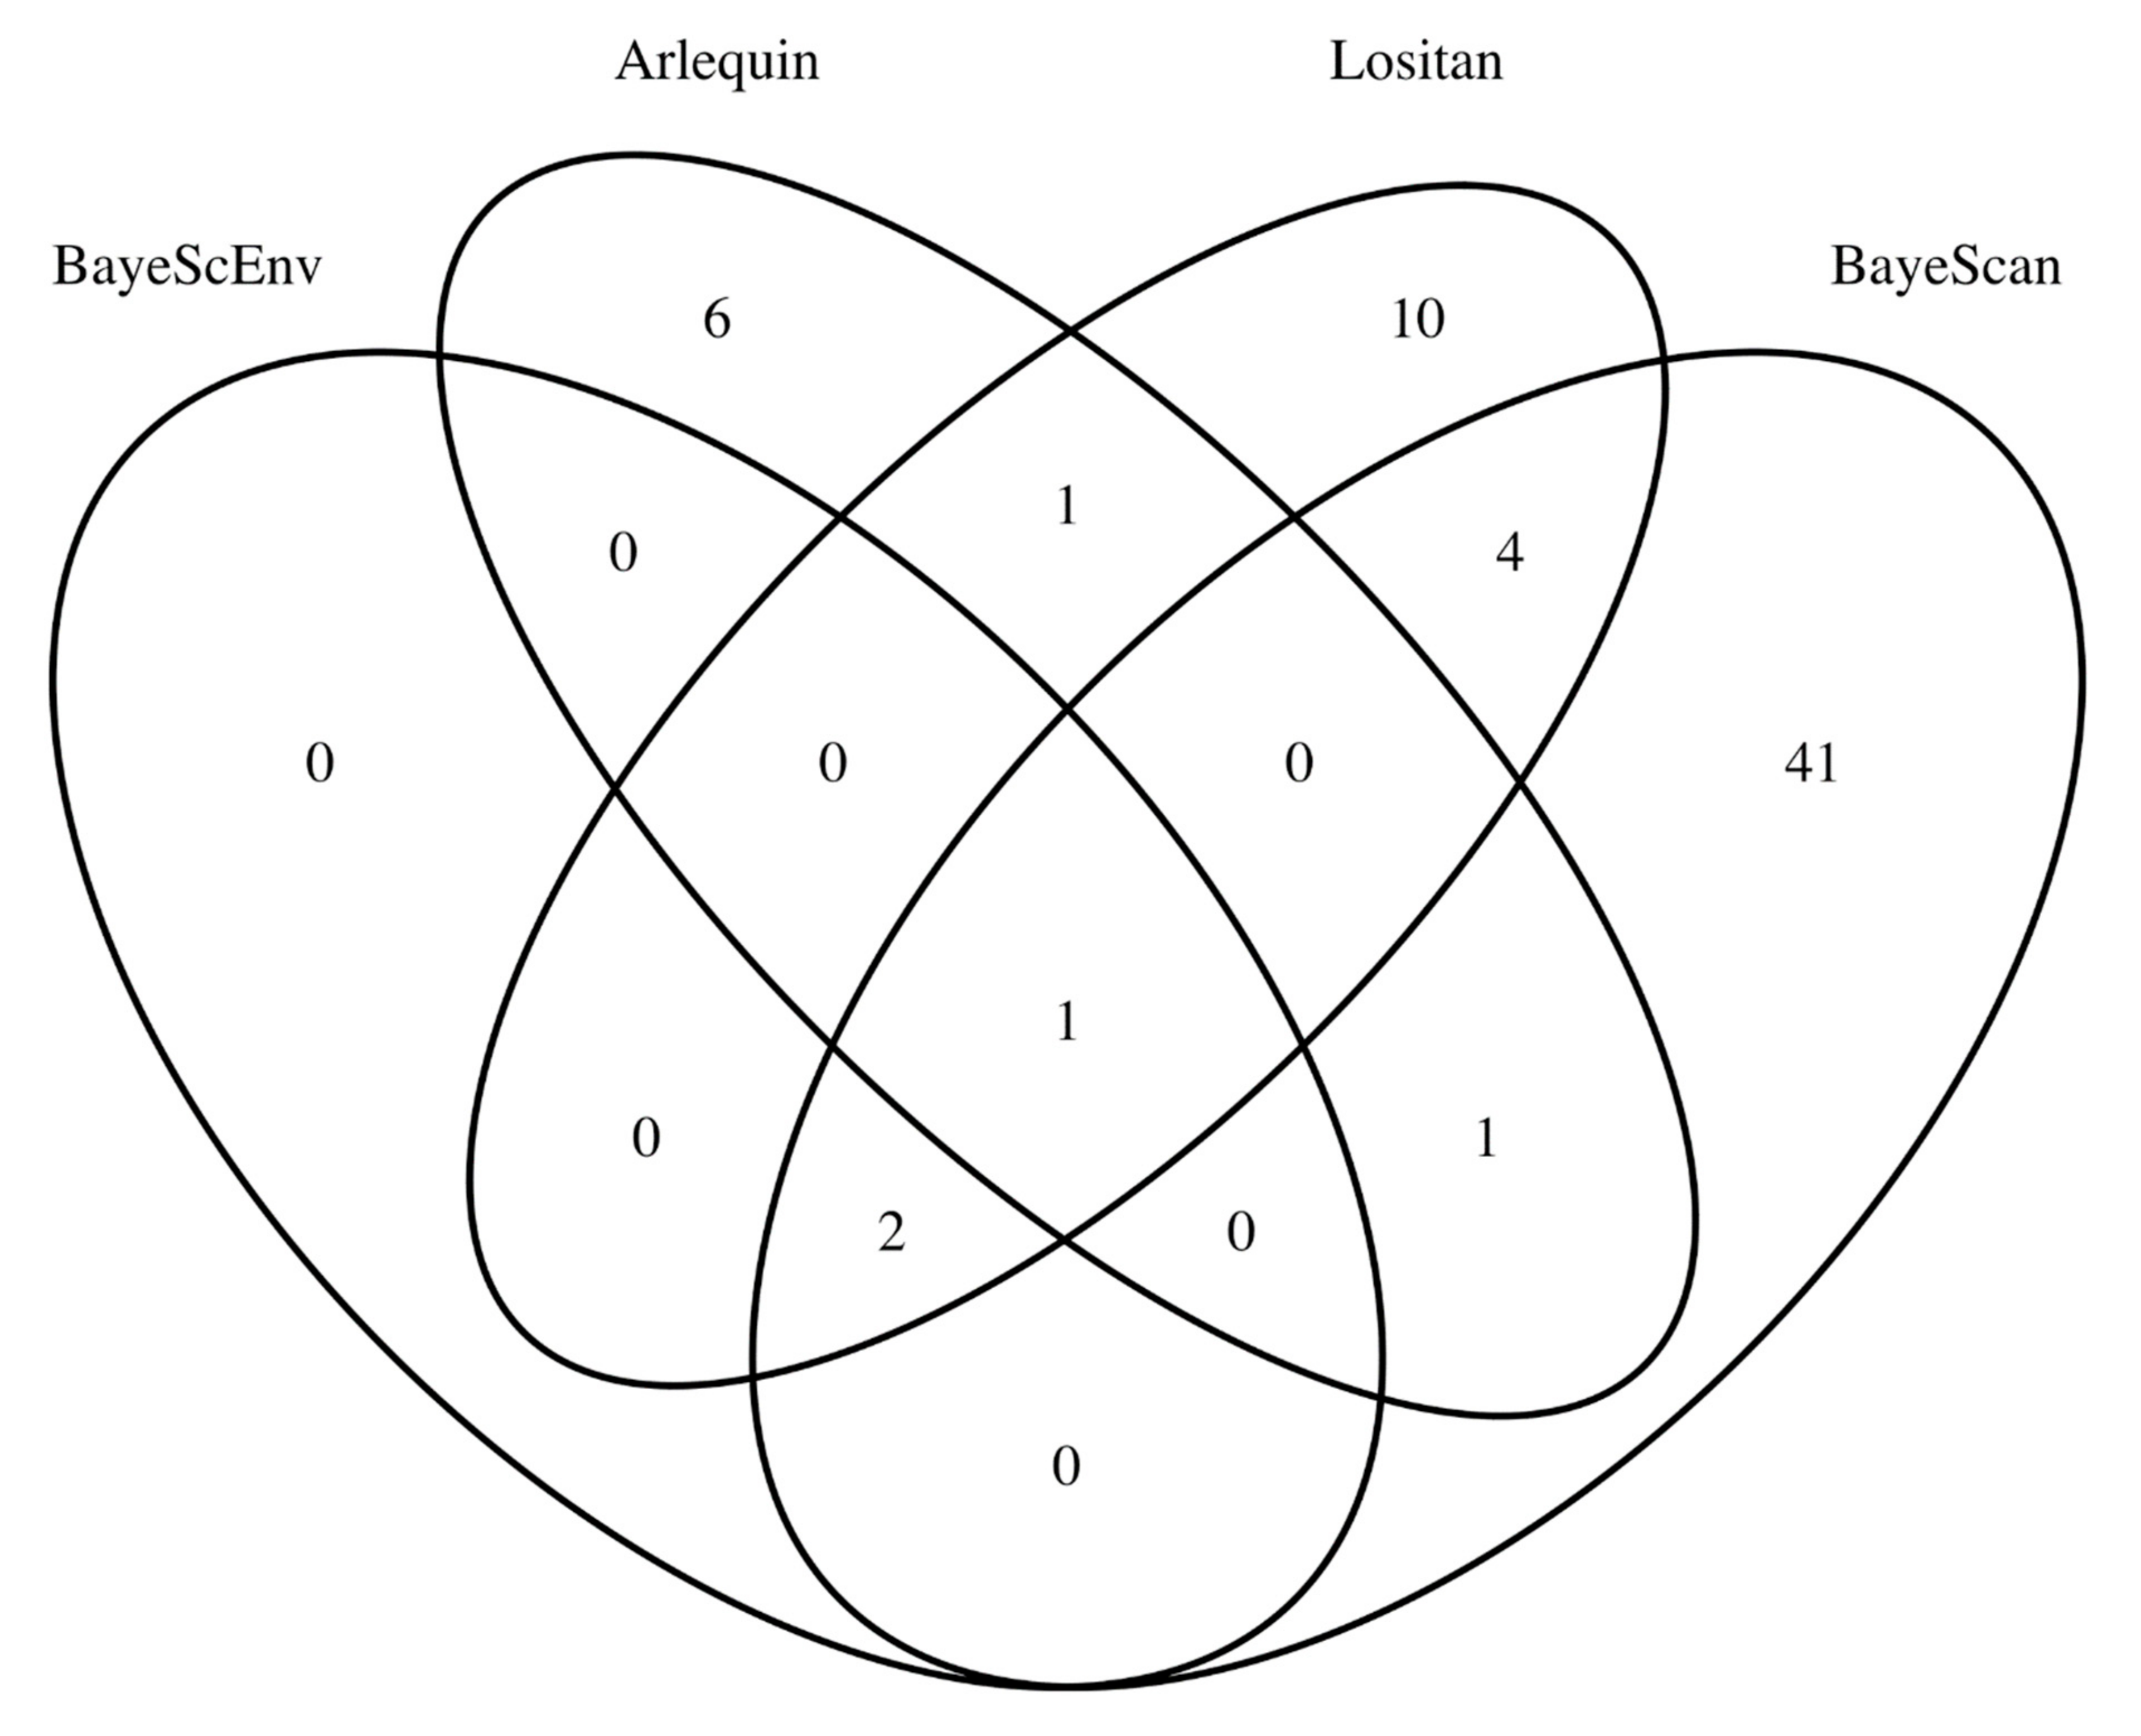
3.2. SNP Outliers of Hatchery-Induced Evolution in Gilthead Seabream

The different outlier detection methods yielded slightly different results in terms of significant SNPs detected as outliers (Supplementary Files S5–S8). Both Arlequin and Lositan were implemented in 12 pairwise comparisons between the three recognized clusters of farmed fish and the four identified clusters of wild fish (Supplementary Files S5 and S6). The number of outlier SNPs recognized as significant in individual pairwise comparisons ranged from 48 to 69 in Arlequin (Supplementary File S5) and from 70 to 215 in Lositan (Supplementary File S6) with q-values estimated at 0.46 and 0.45, respectively, at the 5% significance level. However, after considering only the SNPs that were found to be significant in at least two out of the total of four pairwise comparisons performed for each genetic cluster of farmed fish, Arlequin recognized nine outlier SNPs and Lositan 18 outlier SNPs (Figure 4). Furthermore, BayeScan detected 49 outlier loci (Supplementary File S6), and BayeScEnv detected three outlier loci (Supplementary File S8). The overlap of outliers across method implementations revealed one SNP detected with all methods, namely, the SNP 901_49, whereas two additional SNPs, the SNP 8901_12 and SNP 12232_7, were detected by means of BayeScEnv, BayeScan, and Lositan (Figure 4).
Figure 5 shows the semantic similarity space by means of multidimensional scaling for the GO Biological Process of the associated genes to the three SNPs. K-means clustering and the described elbow method suggested three clusters of GO terms with the label of the cluster decided for one of the GO terms closest to each cluster center.

4. Discussion

4.1. Assessing the Significance of Candidate SNPs for Domestication in Gilthead Seabream

This study represents the first genome-wide investigation of the genetic basis of domestication in gilthead seabream. By screening 1159 SNPs of genome-wide distribution from five Greek farmed and 23 wild populations of Mediterranean-wide distribution, we report on a distinct genetic makeup of the farmed populations compared to the wild ones (Figure 3), and we provide evidence for three candidate SNPs with signatures of parallel divergent selection in multiple farmed gilthead seabream populations. To minimize the possibility of false positives, we used conservative criteria for the detection of candidate SNPs. On one hand, candidate SNPs were significant across three different genomic outlier detection methods, namely, first, a Bayesian approach as implemented in the programs BayeScan and BayScEnv, second, an FST approach that uses a hierarchical island model as implemented in the program Arlequin, and third, an FST approach that uses a stepwise mutation model as implemented in the program Lositan. Comparative studies have shown different strengths and weaknesses for individual genomic outlier detection methods, often depending on the confounding effects of the demographic history, structure, and drift of the populations, e.g., [53,72,73]. Hence, genomic outliers proposed by multiple methods that assume different demographic models are more likely to be true positives than any individual method given that we have no knowledge about the demographic history of the studied populations [53,74]. On the other hand, candidate SNPs were significant in different pairwise comparisons between farmed and wild genetic clusters recognized by the programs Structure (Figure 1 and Figure 2) and fastSTRUCTURE (Figure 3). In this way, we controlled for the confounding factors of population structure in our studied samples and of unknown management practices such as broodstock supplementation with wild fish and the exchange of farmed fish [28]. Importantly, with this approach we also managed to report on parallel patterns of divergence across multiple farmed and wild population comparisons. We investigated SNPs that were significant outliers in multiple farmed populations when contrasted with our best-known wild gilthead seabream genetic variation in the Mediterranean region for the 1159 studied SNPs (Figure 1) [40]. The fact that our farmed samples were only of Greek origin might be seen as a limitation of this study. Nevertheless, it is not uncommon for gilthead seabream to be exchanged between European farms (A.T. Pers. Comm.); in fact, it is known that gilthead seabream broodstock fish are exchanged between the hatcheries grouped under the same clusters according to structure analysis (FA1–FA3 and FA2–FA5) (A.T. Pers. Comm.). It is thus possible that our findings are valid across a wider range of gilthead seabream farms in the Mediterranean region; however, this remains to be tested. The fact that we detected three candidate SNPs for domestication in gilthead seabream by screening a relatively low number of 1159 random genomic SNPs suggests potentially strong divergent selection for domestication that, for example, medium-to-high-density SNP screening approaches may be able to elucidate further. To this end, Peñaloza et al. recently reported on the development of a 15K SNP chip for gilthead seabream that may be ideally suited for this purpose [75]. Our analysis of the semantic similarity of the genes within 20 Kbps from the three candidate SNPs also managed to recognize some common functional patterns (Figure 5). Below, we discuss in detail the potential biological significance of each of the recognized candidate SNPs in the domestication process of gilthead seabream.

4.2. Evidence on the Genetic Basis of Domestication in Gilthead Seabream

4.2.1. Genes Associated with the SNP 901_49

Of the three reported candidate SNPs, the one labeled as 901_49 was found to be significant in all four method implementations and thus represents perhaps the strongest candidate SNP for divergent selection in the farmed gilthead seabream populations (Figure 4). Furthermore, its allele frequencies showed a marked decrease from an average of 39.79% (±4.39%) in the wild populations to 10.70% (±5.65%) in the farmed ones for one of the alleles (Figure 6).
The SNP was mapped on the chromosome 21 (position: 7694060) of the published gilthead seabream genome, and it is found within the coding region of the UROD gene. The SNP, however, was found to represent a synonymous mutation and is not expected to have any obvious effect on the sequence and function of the uroporphyrinogen decarboxylase protein. In addition to the UROD gene, the following genes were found within 20 Kbps in either direction of the SNP: ZSWIM5, LYN, and PKIA, which encode respectively for the proteins zinc finger SWIM-type containing 5, tyrosine-protein kinase Lyn, and cAMP-dependent protein kinase inhibitor alpha-like.
Regarding the function of these four genes, the uroporphyrinogen decarboxylase protein is involved in heme biosynthesis [76], which is an important pathway in fish adaptation to novel environmental conditions and stress, for example, in salinity adaptation in European flounder (Platichthys flesus) [77] and in Atlantic salmon (Salmo salar) infected with sea lice [78]. Decreased hematocrit levels in cultured gilthead seabream are not uncommon due to bacterial infections [79] or under stressful environmental conditions such as low temperatures [80,81]. Regarding the ZSWIM5 gene, its protein contains an evolutionary conserved domain that may interact with DNA, RNA, and proteins, which suggests a potentially major regulatory role [82,83]. Chang et al. provided evidence of an important role for the protein in mice during early development [84], whereas Micheletti et al. identified in Chinook salmon (Oncorhynchus tshawytscha) a related gene, ZSWIM7, associated with sex differences [85]. Whether this evidence indicates a potential unknown confounding factor in relation to sex or perhaps the rate of sexual maturation in the protandrous gilthead seabream remains to be investigated. Concerning the LYN gene, its protein is a member of subfamily B of Src kinases [86], and has been assigned roles in hematopoiesis and immune function [87], in spermatogenesis [88], and as a key regulator of the stress-activated protein kinase pathway in response to diverse environmental stimuli [89,90]. These roles have been somewhat validated in several fish species, for example, the tyrosine-protein kinase Lyn transcript has been found expressed in the spleen tissue of the grass carp (Ctenopharyngodon idella) [91] and was found to be markedly unregulated during hyperosmotic stress in the fish Gillichthys mirabilis [92]. Arguably, immune function and stress resistance are paramount for the health of any farmed fish species, including gilthead seabream [93,94], and these biological roles may explain the divergent selection observed at the adjacent SNP 901_49 in the farmed gilthead seabream. Notably, “innate immune response” was a GO term that described one of the three clusters of GO terms in our analysis of semantic similarities (Figure 5). Regarding the PKIA gene, its protein belongs to the family of cAMP-dependent protein kinase (PKA) inhibitors, which in several fish species have been found to regulate the growth hormone (GH) and the gonadotropin-releasing hormones (GnRH) [95]. In many fish raised in captivity, including gilthead seabream, GnRH has been found to be responsible for the regulation of ovulation and spawning [96,97,98]. GH is furthermore a key hormone in fish during exposure to stress, helping the fish adapt to a wide range of environmental stressors such as water temperature and salinity changes [99]. Altogether, we provided several lines of functional evidence as to why the genomic region surrounding SNP 901_49 at chromosome 21 of the gilthead seabream may be an intriguing topic of further research to understand the genetic basis of domestication in the species.

4.2.2. Genes Associated with SNP 8901_12 and SNP 12232_7

The other two reported candidate SNPs, labeled 8901_12 and 12232_7, showed similar behavior at the four methods used to detect divergent selection in the farmed gilthead seabream populations. Both SNPs were found to be significant in the BayeScEnv, BayeScan, and Lositan analyses, but not in Arlequin (Figure 4). In Arlequin, both SNPs were within the top 50 most significant SNPs (p-value < 5%) in all three genetic clusters of farmed fish, but only when compared with the ATL cluster of wild populations (Supplementary File S5). This observation suggests population-specific effects, although methodological limitations cannot be excluded given that we did not get similar observations with the other three methods (Supplementary Files S6–S8). Furthermore, in Lositan for SNP 12232_7, two of the four comparisons with the ATL cluster were not found to be significant (Supplementary File S7), which indicates that the population effect detected with Arlequin may not be very strong. However, a shortcoming of the method itself that we did not investigate further, such as under the conditions described in [73], cannot be excluded. Furthermore, the allele frequency for the less frequent allele showed for SNP_8901_12 an increase from zero in the farmed populations to 6.13% (±1.14%) in the wild ones, and for SNP 12232_7 an increase from zero in the farmed populations to 5.59% (±3.21%) in the wild ones. These changes in frequencies were thus much smaller than those observed with SNP 901_49. Nevertheless, we report on SNP 901_12 and SNP 12232_7 as loci with correlative evidence in the domestication of gilthead seabream that future research will investigate further. The SNP 8901_12 was mapped at chromosome 21 (position: 15127025), the same chromosome at which the aforementioned SNP 901_49 was found. The SNP 8901_12 is located within the gene ZZZ3, which encodes for the ZZ-type zinc finger-containing protein 3, at about the middle of its ca. 16 Kbps gene region. However, it is located at an intronic region, between exon 7 and exon 8 of the ZZZ3 gene, and thus it is not expected to have an effect on the sequence and function of the produced protein. Within 20 Kbps in either direction of the SNP, two more genes were found, namely, the genes USP33 and AK5, which encode for the proteins ubiquitin carboxyl-terminal hydrolase 33 and adenylate kinase isoenzyme 5, respectively. The SNP 12232_7 was mapped at chromosome 12 (position: 25666771) of the gilthead seabream genome. It is found within the gene PPIL1, which encodes for the protein peptidyl-prolyl cis-trans isomerase-like 1, but SNP 12232_7 is also located at an intronic region between exons 4 and 5.
The PPIL1 gene produces an evolutionary conserved peptide sequence from humans to zebrafish and fission yeast [100]. It has peptidyl prolyl isomerase activity (PPIase) [100,101] and also participates in the spliceosome that removes introns from pre-mRNA [102]. As a function, PPIase activity has been implicated in the environmental stress response of a wide range of organisms from water draught in plants, e.g., [103], to heat stress in Escherichia coli [104]. Alternative splicing, although not fully yet understood, has been suggested to play an important role in the evolutionary adaptation of eukaryotes such as temperature adaptation in Drosophila [105]. In fish, a comparative analysis of orthologous transcripts of four species of the Percidae family has recognized the PPIL1 transcript amongst those fast-evolving and positively selected genes, by means of the dN/dS ratio, with a potential role in temperature adaptation [106]. A similar stress coping role may be assigned to the ZZZ3 gene. It belongs to the zinc finger superfamily of proteins, which are considered master regulators of coping with environmental stress, especially in plants [107,108], but also in animals [109,110]. The USP33 gene functions primarily as an ubiquitin-specific protease (USP) and thus regulates cellular protein traffic [111] and modulates interactions that regulate autophagy and immune responses to various stressors [112]. In fish, for example, the transcription of USP33 was found to be significantly altered in zebrafish after exposure to toxic nanomaterials [113], whereas in the large yellow croaker (Larimichthys crocea) a GWAS analysis listed USP33 amongst those candidate genes associated with acute heat tolerance in this fish species [114]. It should also be noted that “ubiquitin-dependent catabolic process” was a GO term that described one of the three clusters of GO terms in our analysis of semantic similarities (Figure 5). The AK5 gene encodes an enzyme with an evolutionarily conserved role in energy metabolism that in fish has been involved in various aspects of temperature acclimation from sperm motility in brown trout (Salmo trutta), burbot (Lota lota), and the European grayling (Thymallus thymallus) [115] to the muscles of rainbow trout (Oncorhynchus mykiss) and bastard halibut (Paralichthys olivaceus) [116,117]. Overall, we provide several lines of evidence on the biological role of neighboring genes that may explain the observed parallel divergence of the reported SNPs in the farmed gilthead seabream. These genes and genomic regions may be targets of future studies that will investigate further the domestication process in this fish species.

5. Conclusions

In conclusion, we here present the first genome-wide evidence of the genetic basis of domestication in the commercially important fish gilthead seabream, using 1159 randomly identified SNPs of genome-wide distribution. The three reported robust outlier SNPs were found to be significant outliers in multiple genetic clusters of farmed fish populations when contrasted with different genetic clusters of wild populations. This finding supports a scenario of parallel signatures of adaptation of gilthead seabream to the farmed conditions, which remains to be investigated further, for instance, with the use of higher-density SNPs that have been recently developed for gilthead seabream [75]. We also reported on the biological role and function of multiple genes closely linked to the outlier SNPs that may explain the observed divergence, and provide targets for future research in the domestication of gilthead seabream. Notably, two of the outlier SNPs, namely, SNP 901_49 and SNP 8901_12, were mapped onto the same chromosome 21, which drew some attention as to the genetic variation of this chromosome with regard to the domestication process. Amongst the associated genes, a common biological pattern has to do with coping in stressful conditions, for example, the associated UROD, LYN, PKIA, ZZZ3, USP33, and AK5 genes have been assigned such a role, which growing in hatchery environments may explain successful growth in high population densities and resistance to pathogens. This was also evident in the analysis of the semantic similarity of the GO biological process of the associated genes, where clusters of GO terms associated with the “innate immune response” and with the “ubiquitin-dependent protein catabolic process” were identified (Figure 5). It is well known that ubiquitin-dependent pathways play major roles in modulating the effects of environmental stress at the molecular level [118]. We acknowledge that these pathways are also involved in several processes other than stress, such as in the cell cycle and proliferation, and thus more research is needed in this direction. Some possible links were also found with genes that are important for growth and maturation, such as the gene PKIA, which may also explain the selection for high growth rates in the hatchery environment.

Supplementary Materials

The following are available at https://0-www-mdpi-com.brum.beds.ac.uk/article/10.3390/d13110563/s1. Supplementary_File_S1_SNP_annotations.xlsx: Information on the annotation of the studied SNPs found based on sequence similarity (blastn) between a query sequence that contained the SNP and the published genome of gilthead seabream as a BLAST database (GenBank Assembly: GCA_900880675.1 fSpaAur1.1; date of download: 28 April 2021). In a few cases, an SNP could not be unambiguously assigned to a single genomic location and thus information on all hits was included. #N/A marks missing information. Supplementary_File_S2_semantic_similarity_notebook.ipynb: A Jupyter notebook with the dataset and the accompanying Python script for the K-means analysis. Supplementary_File_S3_FST_results.xlsx: This file contains the results of the FST analysis among hatcheries and clusters of wild populations, conducted with the program ARLEQUIN. The statistically significant values (p ≤ 0.005) are shown in bold text. Supplementary_File_S4_fastStructure_CVerror.png: Lineplot of the CV error of fastSTRUCTURE runs of k values ranging from one to ten for the joint dataset that included both the wild and the farmed populations. The red dotted lines highlight the optimal k value (k = 7) that minimized the CV error. Supplementary_File_S5_Arlequin_results.xlsx: This file contains the results of the outlier detection method conducted with the program Arlequin. The “IDs map” sheet contains the mapping of SNP_id with the numeric code for each SNP used in the analysis. The following 12 sheets contain the results of the analysis for each pairwise comparison between the three genetic clusters of farmed populations, coded as “4”, “13”, and “25”, and the four genetic clusters of wild populations, coded as “AEG”, “ATL”, “ION”, and “WMED”. These sheets are named accordingly so that the name of the sheet distinguishes the pairwise comparison analyzed, for example, the sheet “4ION” contains the results of the pairwise comparison between clusters “4” and “ION”. The sheet “Rank_TOP50” contains the ranking of each SNP in each pairwise comparison and their occurrence within the top 50 most significant outliers. Supplementary_File_S6_Lositan_results.xlsx: This file contains the results of the outlier detection method conducted with the program Lositan. The “IDs map” sheet contains the mapping of the SNP_id with the numeric code for each SNP used in the analysis. The following 12 sheets contain the results of the analysis for each pairwise comparison between the three genetic clusters of farmed populations, coded as “4”, “13”, and “25”, and the four genetic clusters of wild populations, coded as “AEG”, “ATL”, “ION”, and “WMED”. These sheets are named accordingly so that the name of the sheet distinguishes the pairwise comparison analyzed, for example, the sheet “4ION” contains the results of the pairwise comparison between clusters “4” and “ION”. The sheet “Outliers_5%” contains a summary of each SNP recognized as an outlier at the 5% significance level in each pairwise comparison. Supplementary_File_S7_BayeScan_results.xlsx: This file contains the results of the outlier detection method conducted with the program BayeScan. The “IDs map” sheet contains the mapping of SNP_id with the numeric code for each SNP used in the analysis, and the sheet “Result” contains the results of the analysis. Supplementary_File_S8_BayeScEnv_results.xlsx: This file contains the results of the outlier detection method conducted with the program BayeScEnv. The “IDs map” sheet contains the mapping of the SNP_id with the numeric code for each SNP used in the analysis, and the sheet “Result” contains the results of the analysis.

Author Contributions

Conceptualization: K.G., S.P. and A.T.; data curation: K.G., S.P., F.M. and A.C.; formal analysis: K.G., S.P. and F.M.; funding acquisition: E.E.N. and K.G.; investigation: K.G., S.P. and F.M.; methodology: K.G., S.P. and A.T.; project administration: E.E.N., L.B. and A.T.; software: K.G., S.P. and A.C.; supervision: N.K., L.B. and A.T.; validation: K.G., S.P. and A.C.; visualization: K.G., S.P. and F.M.; writing—original draft: K.G., S.P. and A.T.; writing—review and editing: K.G., S.P., F.M., N.K., A.C., E.E.N., L.B. and A.T. All authors have read and agreed to the published version of the manuscript.

Funding

The project was funded by the 7th Framework Programme for research (FP7) under “Knowledge-Based Bio-Economy—KBBE”, Theme 2: “Food, Agriculture and Fisheries, and Biotechnologies” Project identifier: FP7-KBBE-2012-6-single-stage Grant agreement no.: 311920. Furthermore, Dr Gkagkavouzis was funded by a PhD scholarship of Alexander S. Onassis Public Benefit Foundation (GR). Fios Genomics Ltd. Provided support in the form of salary for author AC but did not have any additional role in the study design, data collection or analysis; the decision to publish; or the preparation of the manuscript. The specific role of this author is articulated in the ‘Author Contributions’ section.

Institutional Review Board Statement

Not applicable.

Data Availability Statement

Demultiplexed raw reads files of the wild and farmed samples are available from the NCBI’s SRA database (BioProject accession numbers PRJNA643702 and PRJNA771202, respectively).

Acknowledgments

The authors would like to thank all the members of the Aquatrace consortium and additionally all the funders, i.e., the 7th Framework Programme for research (FP7) under “Knowledge-Based Bio-Economy—KBBE”, Theme 2: “Food, Agriculture and Fisheries, and Biotechnologies” Project identifier: FP7-KBBE-2012-6-single-stage Grant agreement no. 311920, the Alexander S. Onassis Public Benefit Foundation (GR), and Fios Genomics Ltd. Many results presented in this work were obtained using the Aristotle University of Thessaloniki (AUTh) High Performance Computing Infrastructure and Resources. The authors would like to acknowledge the support provided by the IT Center of the Aristotle University of Thessaloniki (AUTh) throughout the progress of this research work.

Conflicts of Interest

The authors and the commercial company involved declare that they have no competing financial interests or personal relationships that could have influenced the work reported in this paper. The commercial affiliation with Fios Genomics Ltd. does not alter our adherence to Fisheries Research policies on sharing data and materials.

References

  1. Gerbault, P.; Allaby, R.G.; Boivin, N.; Rudzinski, A.; Grimaldi, I.M.; Pires, J.C.; Climer Vigueira, C.; Dobney, K.; Gremillion, K.J.; Barton, L.; et al. Storytelling and story testing in domestication. Proc. Natl. Acad. Sci. USA 2014, 111, 6159–6164. [Google Scholar] [CrossRef] [Green Version]
  2. Larson, G.; Piperno, D.R.; Allaby, R.G.; Purugganan, M.D.; Andersson, L.; Arroyo-Kalin, M.; Barton, L.; Climer Vigueira, C.; Denham, T.; Dobney, K.; et al. Current perspectives and the future of domestication studies. Proc. Natl. Acad. Sci. USA 2014, 111, 6139–6146. [Google Scholar] [CrossRef] [Green Version]
  3. Larson, G.; Fuller, D.Q. The Evolution of Animal Domestication. Annu. Rev. Ecol. Evol. Syst. 2014, 45, 115–136. [Google Scholar] [CrossRef] [Green Version]
  4. Frantz, L.A.F.; Bradley, D.G.; Larson, G.; Orlando, L. Animal domestication in the era of ancient genomics. Nat. Rev. Genet. 2020, 21, 449–460. [Google Scholar] [CrossRef]
  5. Andersson, L.; Archibald, A.L.; Bottema, C.D.; Brauning, R.; Burgess, S.C.; Burt, D.W.; Casas, E.; Cheng, H.H.; Clarke, L.; Couldrey, C.; et al. Coordinated international action to accelerate genome-to-phenome with FAANG, the Functional Annotation of Animal Genomes project. Genome Biol. 2015, 16, 57. [Google Scholar] [CrossRef] [Green Version]
  6. Castanheira, M.F.; Conceição, L.E.C.; Millot, S.; Rey, S.; Bégout, M.-L.; Damsgard, B.; Kristiansen, T.; Höglund, E.; Øverli, Ø.; Martins, C.I.M. Coping styles in farmed fish: Consequences for aquaculture. Rev. Aquac. 2017, 9, 23–41. [Google Scholar] [CrossRef] [Green Version]
  7. Milla, S.; Pasquet, A.; El Mohajer, L.; Fontaine, P. How domestication alters fish phenotypes. Rev. Aquac. 2021, 13, 388–405. [Google Scholar] [CrossRef]
  8. Zenger, K.R.; Khatkar, M.S.; Jones, D.B.; Khalilisamani, N.; Jerry, D.R.; Raadsma, H.W. Genomic Selection in Aquaculture: Application, Limitations and Opportunities with Special Reference to Marine Shrimp and Pearl Oysters. Front. Genet. 2019, 9, 693. [Google Scholar] [CrossRef]
  9. Purugganan, M.D. Evolutionary Insights into the Nature of Plant Domestication. Curr. Biol. 2019, 29, R705–R714. [Google Scholar] [CrossRef] [Green Version]
  10. Houston, R.D.; Bean, T.P.; Macqueen, D.J.; Gundappa, M.K.; Jin, Y.H.; Jenkins, T.L.; Selly, S.L.C.; Martin, S.A.M.; Stevens, J.R.; Santos, E.M.; et al. Harnessing genomics to fast-track genetic improvement in aquaculture. Nat. Rev. Genet. 2020, 21, 389–409. [Google Scholar] [CrossRef] [PubMed]
  11. Lucas, J.S.; Southgate, P.C. Aquaculture; Lucas, J.S., Southgate, P.C., Eds.; Blackwell Publishing Ltd.: West Sussex, UK, 2012; ISBN 9781118687932. [Google Scholar]
  12. Teletchea, F. Fish domestication in aquaculture: 10 unanswered questions. Anim. Front. 2021, 11, 87–91. [Google Scholar] [CrossRef]
  13. Teletchea, F.; Fontaine, P. Levels of domestication in fish: Implications for the sustainable future of aquaculture. Fish Fish. 2014, 15, 181–195. [Google Scholar] [CrossRef]
  14. Araki, H.; Cooper, B.; Blouin, M.S. Genetic Effects of Captive Breeding Cause a Rapid, Cumulative Fitness Decline in the Wild. Science 2007, 318, 100–103. [Google Scholar] [CrossRef] [PubMed] [Green Version]
  15. Christie, M.R.; Marine, M.L.; French, R.A.; Blouin, M.S. Genetic adaptation to captivity can occur in a single generation. Proc. Natl. Acad. Sci. USA 2012, 109, 238–242. [Google Scholar] [CrossRef] [PubMed] [Green Version]
  16. Kumar, G.; Kocour, M. Applications of next-generation sequencing in fisheries research: A review. Fish. Res. 2017, 186, 11–22. [Google Scholar] [CrossRef]
  17. Li, Y.-H.; Wang, H.-P. Advances of genotyping-by-sequencing in fisheries and aquaculture. Rev. Fish Biol. Fish. 2017, 27, 535–559. [Google Scholar] [CrossRef]
  18. Lu, G.; Luo, M. Genomes of major fishes in world fisheries and aquaculture: Status, application and perspective. Aquac. Fish. 2020, 5, 163–173. [Google Scholar] [CrossRef]
  19. Dittmar, E.L.; Oakley, C.G.; Conner, J.K.; Gould, B.A.; Schemske, D.W. Factors influencing the effect size distribution of adaptive substitutions. Proc. R. Soc. B Biol. Sci. 2016, 283, 20153065. [Google Scholar] [CrossRef] [Green Version]
  20. Visscher, P.M.; Wray, N.R.; Zhang, Q.; Sklar, P.; McCarthy, M.I.; Brown, M.A.; Yang, J. 10 Years of GWAS Discovery: Biology, Function, and Translation. Am. J. Hum. Genet. 2017, 101, 5–22. [Google Scholar] [CrossRef] [Green Version]
  21. Yeaman, S. Local Adaptation by Alleles of Small Effect. Am. Nat. 2015, 186, S74–S89. [Google Scholar] [CrossRef] [PubMed]
  22. Gagnaire, P.-A.; Gaggiotti, O.E. Detecting polygenic selection in marine populations by combining population genomics and quantitative genetics approaches. Curr. Zool. 2016, 62, 603–616. [Google Scholar] [CrossRef] [PubMed] [Green Version]
  23. Wellenreuther, M.; Hansson, B. Detecting Polygenic Evolution: Problems, Pitfalls, and Promises. Trends Genet. 2016, 32, 155–164. [Google Scholar] [CrossRef] [PubMed]
  24. Bomba, L.; Walter, K.; Soranzo, N. The impact of rare and low-frequency genetic variants in common disease. Genome Biol. 2017, 18, 77. [Google Scholar] [CrossRef] [PubMed]
  25. Rey, C.; Darnaude, A.; Ferraton, F.; Guinand, B.; Bonhomme, F.; Bierne, N.; Gagnaire, P.-A. Within-Generation Polygenic Selection Shapes Fitness-Related Traits across Environments in Juvenile Sea Bream. Genes 2020, 11, 398. [Google Scholar] [CrossRef] [PubMed] [Green Version]
  26. Sola, L.; Moretti, A.; Crosetti, D.; Karaiskou, N.; Magoulas, A.; Rossi, A.R.; Rye, M.; Triantafyllidis, A.; Tsigenipoulos, C.S. Genetic effects of domestification, culture and breeding of fish and shellfish, and their impact on wild populations. Gilthead seabream-Sparus aurata. In Genetic Impact of Aquaculture Activities on Native Populations. Genetic Final Scientific Report (EU Contract no. RICA-CT-2005-022802); Svasand, T., Crosetti, D., Garcia-Vázquez, E., Verspoor, E., Eds.; 2007; pp. 47–54. Available online: https://www.researchgate.net/profile/Philip-Mcginnity/publication/268359165_Research_Priorities_for_Modelling/links/547459fb0cf2778985abd9ef/Research-Priorities-for-Modelling.pdf#page=47 (accessed on 26 March 2021).
  27. FAO Fishery and Aquaculture Statistics. Global Aquaculture Production 1950–2019 (FishstatJ). FAO Fisheries Division, FAO Fisheries and Aquaculture Department, FIPS—Statistics and Information: Rome, Italy, 2021. Updated 2021. 2.0.0. Available online: www.fao.org/fishery/statistics/software/fishstatj/en (accessed on 25 August 2021).
  28. Arabaci, M.; Yilmaz, Y.; Ceyhun, S.B.; Erdogan, O.; Dorlay, H.G.; Diler, I.; Akhan, S.; Kocabas, M.; Ozdemir, K.; Koyun, H.; et al. A Review on Population Characteristics of Gilthead Seabream (Sparus aurata). J. Anim. Vet. Adv. 2010, 9, 976–981. [Google Scholar] [CrossRef] [Green Version]
  29. Gkagkavouzis, K.; Karaiskou, N.; Katopodi, T.; Leonardos, I.; Abatzopoulos, T.J.; Triantafyllidis, A. The genetic population structure and temporal genetic stability of gilthead sea bream Sparus aurata populations in the Aegean and Ionian Seas, using microsatellite DNA markers. J. Fish Biol. 2019, 94, 606–613. [Google Scholar] [CrossRef] [PubMed]
  30. Thorland, I.; Papaioannou, N.; Kottaras, L.; Refstie, T.; Papasolomontos, S.; Rye, M. The Kego breeding programs for sea bream (Sparus aurata) and sea bass (Dicentrarchus labrax) in Greece. In Proceedings of the 8th Hellenic Symposium on Oceanography and Fisheries, Thessaloniki, Greece, 4–8 June 2006. [Google Scholar]
  31. Brown, R.C. Genetic Management and Selective Breeding in Farmed Populations of Gilthead Seabream (Sparus aurata). Ph.D. Thesis, University of Stirling, Stirling, Scotland, 2003. [Google Scholar]
  32. Janssen, K.; Chavanne, H.; Berentsen, P.; Komen, H. Gilthead Seabream (Sparus aurata)—Current status of selective breeding in Europe. In Proceedings of the the International Symposium on Genetics in Aquaculture XII, Santiago de Compostela, Spain, 21–27 June 2015. [Google Scholar]
  33. Knibb, W. Genetic improvement of marine fish—Which method for industry? Aquac. Res. 2000, 31, 11–23. [Google Scholar] [CrossRef]
  34. Gjedrem, T.; Baranski, M. Selective Breeding in Aquaculture: An Introduction; Springer Science & Business Media: Berlin/Heidelberg, Germany, 2010; Volume 10, ISBN 9048127734. [Google Scholar]
  35. Chavanne, H.; Parati, K.; Cambuli, C.; Capoferri, R.; Jiménez, C.A.; Galli, A. Microsatellites markers to depict the reproductive and genetic patterns of farmed gilthead seabream (Sparus aurata): Illustration by a case study on mass spawning. Aquac. Res. 2014, 45, 577–590. [Google Scholar] [CrossRef]
  36. Loughnan, S.R.; Domingos, J.A.; Smith-Keune, C.; Forrester, J.P.; Jerry, D.R.; Beheregaray, L.B.; Robinson, N.A. Broodstock contribution after mass spawning and size grading in barramundi (Lates calcarifer, Bloch). Aquaculture 2013, 404–405, 139–149. [Google Scholar] [CrossRef]
  37. Fessehaye, Y.; Bovenhuis, H.; Rezk, M.A.; Crooijmans, R.; van Arendonk, J.A.M.; Komen, H. Effects of relatedness and inbreeding on reproductive success of Nile tilapia (Oreochromis niloticus). Aquaculture 2009, 294, 180–186. [Google Scholar] [CrossRef]
  38. Alarcón, J.A.; Magoulas, A.; Georgakopoulos, T.; Zouros, E.; Alvarez, M.C. Genetic comparison of wild and cultivated European populations of the gilthead sea bream (Sparus aurata). Aquaculture 2004, 230, 65–80. [Google Scholar] [CrossRef]
  39. Šegvić-Bubić, T.; Talijančić, I.; Grubišić, L.; Izquierdo-Gomez, D.; Katavić, I. Morphological and molecular differentiation of wild and farmed gilthead sea bream Sparus aurata: Implications for management. Aquac. Environ. Interact. 2014, 6, 43–54. [Google Scholar] [CrossRef] [Green Version]
  40. Maroso, F.; Gkagkavouzis, K.; De Innocentiis, S.; Hillen, J.; do Prado, F.; Karaiskou, N.; Taggart, J.B.; Carr, A.; Nielsen, E.; Triantafyllidis, A.; et al. Genome-wide analysis clarifies the population genetic structure of wild gilthead sea bream (Sparus aurata). PLoS ONE 2021, 16, e0236230. [Google Scholar] [CrossRef] [PubMed]
  41. Gkagkavouzis, K. Development and Evaluation of Methodologies for Genomic Analysis in Wild and Farmed Sea Bream (Sparus aurata) Populations; Aristotle University of Thessaloniki: Thessaloniki, Greece, 2019. [Google Scholar]
  42. Karlsson, S.; Moen, T.; Lien, S.; Glover, K.A.; Hindar, K. Generic genetic differences between farmed and wild Atlantic salmon identified from a 7K SNP-chip. Mol. Ecol. Resour. 2011, 11, 247–253. [Google Scholar] [CrossRef] [Green Version]
  43. Catchen, J.; Hohenlohe, P.A.; Bassham, S.; Amores, A.; Cresko, W.A. Stacks: An analysis tool set for population genomics. Mol. Ecol. 2013, 22, 3124–3140. [Google Scholar] [CrossRef] [Green Version]
  44. Catchen, J.M.; Amores, A.; Hohenlohe, P.; Cresko, W.; Postlethwait, J.H. Stacks: Building and genotyping Loci de novo from short-read sequences. G3 2011, 1, 171–182. [Google Scholar] [CrossRef] [PubMed] [Green Version]
  45. Peakall, R.; Smouse, P.E. GENALEX 6: Genetic analysis in Excel. Population genetic software for teaching and research. Mol. Ecol. Notes 2006, 6, 288–295. [Google Scholar] [CrossRef]
  46. Excoffier, L.; Lischer, H.E.L. Arlequin suite ver 3.5: A new series of programs to perform population genetics analyses under Linux and Windows. Mol. Ecol. Resour. 2010, 10, 564–567. [Google Scholar] [CrossRef]
  47. Pritchard, J.K.; Stephens, M.; Donnelly, P. Inference of Population Structure Using Multilocus Genotype Data. Genetics 2000, 155, 945–959. [Google Scholar] [CrossRef]
  48. Earl, D.A.; VonHoldt, B.M. STRUCTURE HARVESTER: A website and program for visualizing STRUCTURE output and implementing the Evanno method. Conserv. Genet. Resour. 2012, 4, 359–361. [Google Scholar] [CrossRef]
  49. Raj, A.; Stephens, M.; Pritchard, J.K. fastSTRUCTURE: Variational Inference of Population Structure in Large SNP Data Sets. Genetics 2014, 197, 573–589. [Google Scholar] [CrossRef] [Green Version]
  50. Li, Y.-L.; Liu, J.-X. StructureSelector: A web-based software to select and visualize the optimal number of clusters using multiple methods. Mol. Ecol. Resour. 2018, 18, 176–177. [Google Scholar] [CrossRef] [PubMed]
  51. Rosenberg, N.A. distruct: A program for the graphical display of population structure. Mol. Ecol. Notes 2003, 4, 137–138. [Google Scholar] [CrossRef]
  52. Kopelman, N.M.; Mayzel, J.; Jakobsson, M.; Rosenberg, N.A.; Mayrose, I. Clumpak: A program for identifying clustering modes and packaging population structure inferences across K. Mol. Ecol. Resour. 2015, 15, 1179–1191. [Google Scholar] [CrossRef] [PubMed] [Green Version]
  53. Hoban, S.; Kelley, J.L.; Lotterhos, K.E.; Antolin, M.F.; Bradburd, G.; Lowry, D.B.; Poss, M.L.; Reed, L.K.; Storfer, A.; Whitlock, M.C. Finding the Genomic Basis of Local Adaptation: Pitfalls, Practical Solutions, and Future Directions. Am. Nat. 2016, 188, 379–397. [Google Scholar] [CrossRef] [Green Version]
  54. Foll, M.; Gaggiotti, O. A Genome-Scan Method to Identify Selected Loci Appropriate for Both Dominant and Codominant Markers: A Bayesian Perspective. Genetics 2008, 180, 977–993. [Google Scholar] [CrossRef] [Green Version]
  55. Foll, M.; Fischer, M.C.; Heckel, G.; Excoffier, L. Estimating population structure from AFLP amplification intensity. Mol. Ecol. 2010, 19, 4638–4647. [Google Scholar] [CrossRef] [PubMed]
  56. Fischer, M.C.; Foll, M.; Excoffier, L.; Heckel, G. Enhanced AFLP genome scans detect local adaptation in high-altitude populations of a small rodent (Microtus arvalis). Mol. Ecol. 2011, 20, 1450–1462. [Google Scholar] [CrossRef]
  57. Villemereuil, P.; Gaggiotti, O.E. A new FST—Based method to uncover local adaptation using environmental variables. Methods Ecol. Evol. 2015, 6, 1248–1258. [Google Scholar] [CrossRef] [Green Version]
  58. Antao, T.; Lopes, A.; Lopes, R.J.; Beja-Pereira, A.; Luikart, G. LOSITAN: A workbench to detect molecular adaptation based on a F st -outlier method. BMC Bioinform. 2008, 9, 323. [Google Scholar] [CrossRef] [Green Version]
  59. Rellstab, C.; Gugerli, F.; Eckert, A.J.; Hancock, A.M.; Holderegger, R. A practical guide to environmental association analysis in landscape genomics. Mol. Ecol. 2015, 24, 4348–4370. [Google Scholar] [CrossRef] [PubMed] [Green Version]
  60. Storey, J.D.; Bass, A.J.; Dabney, A.; Robinson, D. Qvalue: Q-Value Estimation for False Discovery Rate Control. R Package Version 2.24.0. 2021. Available online: https://www.bioconductor.org/packages/release/bioc/html/qvalue.html (accessed on 26 August 2021).
  61. Storey, J.D.; Tibshirani, R. Statistical significance for genomewide studies. Proc. Natl. Acad. Sci. USA 2003, 100, 9440–9445. [Google Scholar] [CrossRef] [Green Version]
  62. Kim, Y.; Stephan, W. Joint Effects of Genetic Hitchhiking and Background Selection on Neutral Variation. Genetics 2000, 155, 1415–1427. [Google Scholar] [CrossRef] [PubMed]
  63. Brodie, A.; Azaria, J.R.; Ofran, Y. How far from the SNP may the causative genes be? Nucleic Acids Res. 2016, 44, 6046–6054. [Google Scholar] [CrossRef]
  64. Sherry, S.T. dbSNP: The NCBI database of genetic variation. Nucleic Acids Res. 2001, 29, 308–311. [Google Scholar] [CrossRef] [PubMed] [Green Version]
  65. Schoof, N.; Iles, M.M.; Bishop, D.T.; Newton-Bishop, J.A.; Barrett, J.H.; Consortium, G. Pathway-Based Analysis of a Melanoma Genome-Wide Association Study: Analysis of Genes Related to Tumour-Immunosuppression. PLoS ONE 2011, 6, e29451. [Google Scholar] [CrossRef] [Green Version]
  66. Pesquita, C.; Faria, D.; Falcão, A.O.; Lord, P.; Couto, F.M. Semantic Similarity in Biomedical Ontologies. PLoS Comput. Biol. 2009, 5, e1000443. [Google Scholar] [CrossRef]
  67. Papakostas, S.; Vøllestad, L.A.; Bruneaux, M.; Aykanat, T.; Vanoverbeke, J.; Ning, M.; Primmer, C.R.; Leder, E.H. Gene pleiotropy constrains gene expression changes in fish adapted to different thermal conditions. Nat. Commun. 2014, 5, 9. [Google Scholar] [CrossRef] [Green Version]
  68. Papakostas, S.; Vasemägi, A.; Himberg, M.; Primmer, C.R. Proteome variance differences within populations of European whitefish (Coregonus lavaretus) originating from contrasting salinity environments. J. Proteom. 2014, 105, 144–150. [Google Scholar] [CrossRef]
  69. Primmer, C.R.; Papakostas, S.; Leder, E.H.; Davis, M.J.; Ragan, M.A. Annotated genes and nonannotated genomes: Cross-species use of Gene Ontology in ecology and evolution research. Mol. Ecol. 2013, 22, 3216–3241. [Google Scholar] [CrossRef]
  70. Supek, F.; Bošnjak, M.; Škunca, N.; Šmuc, T. REVIGO Summarizes and Visualizes Long Lists of Gene Ontology Terms. PLoS ONE 2011, 6, e21800. [Google Scholar] [CrossRef] [Green Version]
  71. Pedregosa, F.; Varoquaux, G.; Gramfort, A.; Michel, V.; Thirion, B.; Grisel, O.; Blondel, M.; Prettenhofer, P.; Weiss, R.; Dubourg, V. Scikit-learn: Machine Learning in Python. J. Mach. Learn. Res. 2011, 12, 2825–2830. [Google Scholar]
  72. Excoffier, L.; Hofer, T.; Foll, M. Detecting loci under selection in a hierarchically structured population. Heredity 2009, 103, 285–298. [Google Scholar] [CrossRef] [PubMed] [Green Version]
  73. Narum, S.R.; Hess, J.E. Comparison of FST outlier tests for SNP loci under selection. Mol. Ecol. Resour. 2011, 11, 184–194. [Google Scholar] [CrossRef] [PubMed]
  74. Ahrens, C.W.; Rymer, P.D.; Stow, A.; Bragg, J.; Dillon, S.; Umbers, K.D.L.; Dudaniec, R.Y. The search for loci under selection: Trends, biases and progress. Mol. Ecol. 2018, 27, 1342–1356. [Google Scholar] [CrossRef] [Green Version]
  75. Peñaloza, C.; Manousaki, T.; Franch, R.; Tsakogiannis, A.; Sonesson, A.K.; Aslam, M.L.; Allal, F.; Bargelloni, L.; Houston, R.D.; Tsigenopoulos, C.S. Development and testing of a combined species SNP array for the European seabass (Dicentrarchus labrax) and gilthead seabream (Sparus aurata). Genomics 2021, 113, 2096–2107. [Google Scholar] [CrossRef] [PubMed]
  76. Layer, G.; Reichelt, J.; Jahn, D.; Heinz, D.W. Structure and function of enzymes in heme biosynthesis. Protein Sci. 2010, 19, 1137–1161. [Google Scholar] [CrossRef] [PubMed] [Green Version]
  77. Larsen, P.F.; Nielsen, E.E.; Williams, T.D.; Loeschcke, V. Intraspecific variation in expression of candidate genes for osmoregulation, heme biosynthesis and stress resistance suggests local adaptation in European flounder (Platichthys flesus). Heredity 2008, 101, 247–259. [Google Scholar] [CrossRef]
  78. Valenzuela-Muñoz, V.; Gallardo-Escárate, C. Iron metabolism modulation in Atlantic salmon infested with the sea lice Lepeophtheirus salmonis and Caligus rogercresseyi: A matter of nutritional immunity? Fish Shellfish Immunol. 2017, 60, 97–102. [Google Scholar] [CrossRef] [PubMed]
  79. Kapetanović, D.; Kurtović, B.; Vardić, I.; Teskeredžić, E.; Teskeredžić, Z. Gill disease in a gilthead sea bream (Sparus aurata L.). Med. Weter. 2006, 62, 1239–1241. [Google Scholar]
  80. Ibarz, A.; Padrós, F.; Gallardo, M.Á.; Fernández-Borràs, J.; Blasco, J.; Tort, L. Low-temperature challenges to gilthead sea bream culture: Review of cold-induced alterations and ‘Winter Syndrome’. Rev. Fish Biol. Fish. 2010, 20, 539–556. [Google Scholar] [CrossRef]
  81. Fazio, F.; Ferrantelli, V.; Piccione, G.; Saoca, C.; Levanti, M.; Mucciardi, M. Biochemical and hematological parameters in European sea bass (Dicentrarchus labrax Linnaeus, 1758) and Gilthead sea bream (Sparus aurata Linnaeus, 1758) in relation to temperature. Vet. Arh. 2018, 88, 397–411. [Google Scholar] [CrossRef]
  82. Xu, K.; Liu, B.; Ma, Y.; Xu, B.; Xing, X. A novel SWIM domain protein ZSWIM5 inhibits the malignant progression of non-small-cell lung cancer. Cancer Manag. Res. 2018, 10, 3245–3254. [Google Scholar] [CrossRef] [Green Version]
  83. Makarova, K.S.; Aravind, L.; Koonin, E.V. SWIM, a novel Zn-chelating domain present in bacteria, archaea and eukaryotes. Trends Biochem. Sci. 2002, 27, 384–386. [Google Scholar] [CrossRef]
  84. Chang, C.; Kuo, H.; Chen, S.; Lin, W.; Lu, K.; Saito, T.; Liu, F. Developmental characterization of Zswim5 expression in the progenitor domains and tangential migration pathways of cortical interneurons in the mouse forebrain. J. Comp. Neurol. 2020, 528, 2404–2419. [Google Scholar] [CrossRef]
  85. Micheletti, S.J.; Narum, S.R. Utility of pooled sequencing for association mapping in nonmodel organisms. Mol. Ecol. Resour. 2018, 18, 825–837. [Google Scholar] [CrossRef]
  86. Lowell, C.A. Src-family kinases: Rheostats of immune cell signaling. Mol. Immunol. 2004, 41, 631–643. [Google Scholar] [CrossRef]
  87. Corey, S.J.; Anderson, S.M. Src-Related Protein Tyrosine Kinases in Hematopoiesis. Blood 1999, 93, 1–14. [Google Scholar] [CrossRef] [PubMed]
  88. Ijiri, T.W.; Mahbub Hasan, A.K.M.; Sato, K. Protein-Tyrosine Kinase Signaling in the Biological Functions Associated with Sperm. J. Signal Transduct. 2012, 2012, 1–18. [Google Scholar] [CrossRef] [Green Version]
  89. Yoshida, K.; Weichselbaum, R.; Kharbanda, S.; Kufe, D. Role for Lyn Tyrosine Kinase as a Regulator of Stress-Activated Protein Kinase Activity in Response to DNA Damage. Mol. Cell. Biol. 2000, 20, 5370–5380. [Google Scholar] [CrossRef] [Green Version]
  90. Dunand-Sauthier, I.; Walker, C.A.; Narasimhan, J.; Pearce, A.K.; Wek, R.C.; Humphrey, T.C. Stress-Activated Protein Kinase Pathway Functions To Support Protein Synthesis and Translational Adaptation in Response to Environmental Stress in Fission Yeast. Eukaryot. Cell 2005, 4, 1785–1793. [Google Scholar] [CrossRef] [PubMed] [Green Version]
  91. Li, G.; Zhao, Y.; Wang, J.; Liu, B.; Sun, X.; Guo, S.; Feng, J. Transcriptome profiling of developing spleen tissue and discovery of immune-related genes in grass carp (Ctenopharyngodon idella). Fish Shellfish Immunol. 2017, 60, 400–410. [Google Scholar] [CrossRef] [PubMed]
  92. Evans, T.G.; Somero, G.N. A microarray-based transcriptomic time-course of hyper- and hypo-osmotic stress signaling events in the euryhaline fish Gillichthys mirabilis:osmosensors to effectors. J. Exp. Biol. 2008, 211, 3636–3649. [Google Scholar] [CrossRef] [PubMed] [Green Version]
  93. Ortuño, J.; Esteban, M.A.; Meseguer, J. Effects of short-term crowding stress on the gilthead seabream (Sparus aurata L.) innate immune response. Fish Shellfish Immunol. 2001, 11, 187–197. [Google Scholar] [CrossRef]
  94. Segner, H.; Sundh, H.; Buchmann, K.; Douxfils, J.; Sundell, K.S.; Mathieu, C.; Ruane, N.; Jutfelt, F.; Toften, H.; Vaughan, L. Health of farmed fish: Its relation to fish welfare and its utility as welfare indicator. Fish Physiol. Biochem. 2012, 38, 85–105. [Google Scholar] [CrossRef] [Green Version]
  95. Melamed, P.; Rosenfeld, H.; Elizur, A.; Yaron, Z. Endocrine regulation of gonadotropin and growth hormone gene transcription in fish. Comp. Biochem. Physiol. Part C Pharmacol. Toxicol. Endocrinol. 1998, 119, 325–338. [Google Scholar] [CrossRef]
  96. Barbaro, A.; Francescon, A.; Bozzato, G.; Merlin, A.; Belvedere, P.; Colombo, L. Induction of spawning in gilthead seabream, Sparus aurata L., by a long-acting GnRH agonist and its effects on egg quality and daily timing of spawning. Aquaculture 1997, 154, 349–359. [Google Scholar] [CrossRef]
  97. Zohar, Y.; Mylonas, C.C. Endocrine manipulations of spawning in cultured fish: From hormones to genes. Aquaculture 2001, 197, 99–136. [Google Scholar] [CrossRef]
  98. Muñoz-Cueto, J.A.; Zmora, N.; Paullada-Salmerón, J.A.; Marvel, M.; Mañanos, E.; Zohar, Y. The gonadotropin-releasing hormones: Lessons from fish. Gen. Comp. Endocrinol. 2020, 291, 113422. [Google Scholar] [CrossRef]
  99. Deane, E.E.; Woo, N.Y.S. Modulation of fish growth hormone levels by salinity, temperature, pollutants and aquaculture related stress: A review. Rev. Fish Biol. Fish. 2009, 19, 97–120. [Google Scholar] [CrossRef]
  100. Webb, A.E. Characterisation of Human Peptidyl Prolyl ISOMERASE-Like Protein 1 (PPIL1) Mutations. 2019. Available online: https://etheses.whiterose.ac.uk/25250/ (accessed on 26 March 2021).
  101. Thapar, R. Roles of Prolyl Isomerases in RNA-Mediated Gene Expression. Biomolecules 2015, 5, 974–999. [Google Scholar] [CrossRef]
  102. Mesa, A.; Somarelli, J.A.; Herrera, R.J. Spliceosomal immunophilins. FEBS Lett. 2008, 582, 2345–2351. [Google Scholar] [CrossRef] [PubMed] [Green Version]
  103. Sharma, A.D.; Singh, P. Comparative studies on drought-induced changes in peptidyl prolyl cis–trans isomerase activity in drought-tolerant and susceptible cultivars of Sorghum bicolor. Curr. Sci. 2003, 84, 911–918. [Google Scholar]
  104. Kaur, G.; Singh, S.; Dutta, T.; Kaur, H.; Singh, B.; Pareek, A.; Singh, P. The peptidyl-prolyl cis-trans isomerase activity of the wheat cyclophilin, TaCypA-1, is essential for inducing thermotolerance in Escherichia coli. Biochim. Open 2016, 2, 9–15. [Google Scholar] [CrossRef] [PubMed] [Green Version]
  105. Martin Anduaga, A.; Evantal, N.; Patop, I.L.; Bartok, O.; Weiss, R.; Kadener, S. Thermosensitive alternative splicing senses and mediates temperature adaptation in Drosophila. eLife 2019, 8, 1–31. [Google Scholar] [CrossRef] [PubMed]
  106. Xie, P.; Yi, S.-K.; Yao, H.; Chi, W.; Guo, Y.; Ma, X.-F.; Wang, H.-P. Comparative transcriptome analysis reveals potential evolutionary differences in adaptation of temperature and body shape among four Percidae species. PLoS ONE 2019, 14, e0215933. [Google Scholar] [CrossRef] [Green Version]
  107. Gupta, S.K.; Rai, A.K.; Kanwar, S.S.; Sharma, T.R. Comparative Analysis of Zinc Finger Proteins Involved in Plant Disease Resistance. PLoS ONE 2012, 7, e42578. [Google Scholar] [CrossRef] [PubMed] [Green Version]
  108. Han, G.; Lu, C.; Guo, J.; Qiao, Z.; Sui, N.; Qiu, N.; Wang, B. C2H2 Zinc Finger Proteins: Master Regulators of Abiotic Stress Responses in Plants. Front. Plant Sci. 2020, 11, 1–13. [Google Scholar] [CrossRef] [PubMed] [Green Version]
  109. Vij, S.; Tyagi, A.K. A20/AN1 zinc-finger domain-containing proteins in plants and animals represent common elements in stress response. Funct. Integr. Genom. 2008, 8, 301–307. [Google Scholar] [CrossRef]
  110. Aceituno-Valenzuela, U.; Micol-Ponce, R.; Ponce, M.R. Genome-wide analysis of CCHC-type zinc finger (ZCCHC) proteins in yeast, Arabidopsis, and humans. Cell. Mol. Life Sci. 2020, 77, 3991–4014. [Google Scholar] [CrossRef]
  111. Berthouze, M.; Venkataramanan, V.; Li, Y.; Shenoy, S.K. The deubiquitinases USP33 and USP20 coordinate β2 adrenergic receptor recycling and resensitization. EMBO J. 2009, 28, 1684–1696. [Google Scholar] [CrossRef] [PubMed] [Green Version]
  112. Simicek, M.; Lievens, S.; Laga, M.; Guzenko, D.; Aushev, V.N.; Kalev, P.; Baietti, M.F.; Strelkov, S.V.; Gevaert, K.; Tavernier, J.; et al. The deubiquitylase USP33 discriminates between RALB functions in autophagy and innate immune response. Nat. Cell Biol. 2013, 15, 1220–1230. [Google Scholar] [CrossRef] [PubMed]
  113. Park, H.-G.; Yeo, M.-K. Comparison of gene expression changes induced by exposure to Ag, Cu-TiO2, and TiO2 nanoparticles in zebrafish embryos. Mol. Cell. Toxicol. 2013, 9, 129–139. [Google Scholar] [CrossRef]
  114. Wu, Y.; Zhou, Z.; Pan, Y.; Zhao, J.; Bai, H.; Chen, B.; Zhang, X.; Pu, F.; Chen, J.; Xu, P. GWAS identified candidate variants and genes associated with acute heat tolerance of large yellow croaker. Aquaculture 2021, 540, 736696. [Google Scholar] [CrossRef]
  115. Lahnsteiner, F.; Mansour, N. The effect of temperature on sperm motility and enzymatic activity in brown trout Salmo trutta, burbot Lota lota and grayling Thymallus thymallus. J. Fish Biol. 2012, 81, 197–209. [Google Scholar] [CrossRef] [PubMed]
  116. Blier, P.U.; Guderley, H.E. Mitochondrial Activity in Rainbow Trout Red Muscle: The Effect of Temperature on the Adp-Dependence of Atp Synthesis. J. Exp. Biol. 1993, 176, 145–158. [Google Scholar] [CrossRef]
  117. Arai, K.; Inoue, A.; Ojima, T. Isolation and characterization of an adenylate kinase from the lateral muscle of bastard halibut Paralichthys olivaceus. Fish. Sci. 2020, 86, 385–394. [Google Scholar] [CrossRef]
  118. Pickart, C.M. Ubiquitin and the Stress Response; Springer: Berlin/Heidelberg, Germany, 1999; pp. 133–152. [Google Scholar]
Figure 1. Structure clustering analysis of the wild populations. Results for the most likely number of clusters (k = 4). Labels under the graph indicate the sample groups. Labels above the graph indicate the genetic clusters suggested by the analysis (reproduced with permission from [40]).
Diversity 13 00563 g001
Figure 2. Structure plot depicting/justifying the genetic groups in the farmed populations.
Diversity 13 00563 g002
Figure 3. fastSTRUCTURE results for the optimal k = 7 for the jointed dataset that included both the wild and the farmed populations. Populations are ordered as in Figure 1 and Figure 2.
Diversity 13 00563 g003
Figure 4. Venn diagram of the number of outlier SNPs detected using each method.
Diversity 13 00563 g004
Figure 5. Scatter plot of the GO terms for biological process (n = 33) for the associated genes, summarized by multidimensional scaling on the semantic similarity matrix. Each point represents a GO term for a biological process, and its position in the scaled space of semantic similarities depicts its similarity of meaning relative to the other GO terms. Colors correspond to K-means clusters for an optimal K-value = 3. Labels correspond to GO terms that are nearest to each cluster center. A full list of the description of the GO terms and the Python code used to create this figure is provided in the form of a Jupyter notebook (Supplementary File S2).
Diversity 13 00563 g005
Figure 6. Plot of the allele frequencies of the SNP_901_49 at the studied clusters in which a marked change in frequencies has been observed between farmed (in green) and wild (in red) clusters of gilthead seabream populations. Error bars denote standard deviations, whereas circles and diamonds represent the two different alleles. The information of which populations are grouped in each cluster id can be found in Table 1.
Diversity 13 00563 g006
Table 1. Sampling site information and basic statistics.
Loc_IDCluster Analysis_IDLocationLatitudeLongitudeYearNHoHeFIS
FRA-1ATLNoirmoutier−2.17046.9892003220.130.150.08
SPA-1ATLVigo−8.95341.8312009130.140.150.04
SPA-2ATLCadiz−6.40036.5002001170.140.150.04
SPA-3WMEDAlicante−0.31738.2862009200.120.140.08
SPA-4WMEDValencia−0.10039.5002014240.140.150.07
SPA-5WMEDBalearic2.68139.4032013360.140.160.07
ITA-1WMEDW Sardinia8.40239.8262002280.140.160.07
ITA-2WMEDGenova8.90144.3602005330.130.150.09
ITA-3WMEDSabaudia12.62441.4062013520.140.160.07
ITA-4WMEDTortoli9.75639.9242002290.140.160.07
ITA-5WMEDTrapani12.44938.0062007220.140.160.06
TUN-1WMEDTunis10.60236.93220141060.130.150.10
ITA-6WMEDOtranto18.53240.3602001200.150.150.03
ITA-7IONVenice12.40945.3222014400.120.140.10
GRE-1IONIonio20.36038.9832013310.150.150.04
GRE-2IONIgoumenitsa20.16339.4862006, 2014530.140.150.08
GRE-3IONMesologgi21.31538.3032004, 2013490.140.150.09
GRE-4IONKorinthiakos22.94537.2702014320.140.160.08
GRE-5AEGNayplio22.75838.0462005330.140.160.08
GRE-6AEGBasova Kavalas24.49540.8462006, 2013790.140.150.07
GRE-7AEGThermaikos gulf22.84640.2632014810.140.160.09
GRE-8AEGAgiasma24.41940.6442006430.140.160.07
GRE-9AEGAlexandroupolis25.91640.7782013930.140.150.09
FA113Hatchery 1--2014780.140.150.07
FA225Hatchery 2--2014560.150.150.05
FA313Hatchery 3--2014800.140.150.08
FA44Hatchery 4--2014600.140.150.06
FA525Hatchery 5--2014880.130.150.09
Total1318
Publisher’s Note: MDPI stays neutral with regard to jurisdictional claims in published maps and institutional affiliations.

