
Salinity Affects Freshwater Invertebrate Traits and Litter Decomposition


1
Polytechnic of Coimbra, Coimbra Agriculture School, Bencanta, 3045-601 Coimbra, Portugal
2
CFE-Centre for Functional Ecology—Science for People and the Planet, Department of Life Sciences, University of Coimbra, Calçada Martim de Freitas, 3000-456 Coimbra, Portugal
*
Author to whom correspondence should be addressed.
Diversity 2021, 13(11), 599; https://0-doi-org.brum.beds.ac.uk/10.3390/d13110599
Submission received: 25 October 2021
/
Revised: 16 November 2021
/
Accepted: 18 November 2021
/
Published: 21 November 2021
(This article belongs to the Special Issue 2021 Feature Papers by Diversity’s Editorial Board Members)
Abstract
:We evaluated the effect of seawater intrusion in coastal ecosystems on the freshwater invertebrate community and on leaf litter decomposition under realistic scenarios in six outdoor freshwater mesocosms containing fauna and flora, to which increasing volumes of seawater were added. The resulting salinity values were 0.28 (control, freshwater only), 2.0, 3.3, 5.5, 9.3, and 15.3 mS cm−1. The effect of salinity was assessed for 65 days after seawater intrusion, by computing the deviation of values in each treatment in relation to the control. Our results show that seawater intrusion into freshwaters will affect the invertebrate communities and organic matter decomposition, with salinities of up to 3.3–5.5 mS cm−1 having opposite effects to salinities of more than 9.3 mS cm−1. There was a net negative effect of the two highest salinities on mass loss and richness of the invertebrates associated with the decomposing leaves. Regarding the invertebrate communities of the mesocosms, there was a net negative effect of the intermediate salinity levels on abundance and richness. Invertebrate life cycle traits conferring resilience and resistance tended to increase with low and decrease with high salinity values, while avoidance traits showed an opposite trend, and these responses were more pronounced on the later stage community. These wave-like responses of the invertebrate species traits to increasing salinity suggest that the life-history and physiological adaptations most suitable to cope with osmotic stress will differ between low and high salinity levels.
1. Introduction
As a result of global warming, mean sea level increased 0.15–0.25 m between 1901 and 2018, with rates steadily increasing over time. The global mean sea level will most certainly continue to rise throughout the 21st century [1]. Even under a scenario of very low greenhouse gas (GHG) emissions, the likely global mean sea level rise by 2100 is predicted to be 0.28–0.55 m, and the increase may reach as much as 0.63–1.01 m [1]. Moreover, due to relative sea level rise, one in a century extreme sea level events are projected to occur at least annually at more than half of all tide gauge locations by 2100, increasing the frequency and severity of flooding and salinization of coastal areas (including freshwaters) along all low-lying coasts [1]. Additionally, groundwater salinization due to prolonged droughts that promote the inland retreat of the seawater/freshwater interface is also predicted to increase due to climate change [1,2]. Freshwater ecosystems provide essential services and carry out key processes, which depend on the integrity of populations and communities. How freshwater organisms and ecosystem processes will respond to the increasing salinization of coastal freshwaters, predicted by the Intergovernmental Panel on Climate Change [1], is a fundamental quest for an integrated biodiversity and conservation management of coastal ecosystems at risk.
Studies on a wide variety of lakes, rivers, and wetlands have shown salinity effects on freshwater organisms and on ecosystem structure and function [3,4,5,6]. Regarding freshwater animals, salinity may have lethal effects once a threshold is exceeded, or sub-lethal effects, reducing both organism and population fitness, and resulting in the decline of richness with increasing salinity [3,6]. Salinity also affects organisms’ spatial distribution, trophic and other interactions, biochemical cycles, and leaf litter decomposition (e.g., [3,7,8,9]), thus altering ecosystem structure and function. Organic matter decomposition is one of the most important ecosystem processes and, because it results from the activity of an array of species in different trophic levels and taxonomic groups, provides a consolidated measure of ecosystem integrity [10]. Field and laboratory studies show a consistent trend of reduced organic matter processing in freshwaters with increasing salinity due to decreased enzymatic activity and lower fungal biomass on decaying leaves (e.g., [11,12,13]). The decrease of microbial colonization may also indirectly affect the detritivore freshwater invertebrates, which rely on decomposing (i.e., microbially colonized) plant litter as a food resource and contribute, while feeding, to litter processing [14]. Thus, salinity may decrease organic matter processing in a feedback process involving microorganisms and invertebrate detritivores, which can be further enhanced when it has direct effects on invertebrates, as discussed above.
Most studies have assessed the effect of dryland and secondary salinization [3,12], although seawater intrusion (primary salinization) already contributes significantly to coastal salinization [5]. Natural seawater varies in ionic composition and differs from salinized freshwater sources and dryland salinity [5], and ionic composition has been shown to significantly affect the results obtained in other salinization studies (e.g., [15,16]). Thus, the effects of primary salinization on organisms and on ecosystem processes requires special consideration.
Species traits are linked to a myriad of environmental conditions presenting different solutions to abiotic stress, such as the case of salinization [17]. Moreover, contrarily to taxa identity, which varies geographically, traits allow the comparison of species assemblages between waterbodies separated by large geographical distances [17], thus constituting a useful tool to assess the effect of freshwater salinization worldwide.
In the present study, we aimed to contribute to the knowledge on the effects of primary salinization on key drivers of organic matter decomposition in low-lying coastal ecosystems. We assessed the effects of seawater intrusion events of five different magnitudes (2.0, 3.3, 5.5, 9.3, and 15.3 mS cm−1) on leaf litter decomposition and invertebrate communities, using dilutions of ocean water in 1500 L outdoor mesocosms under realistic conditions. We hypothesized that increasing salinity will decrease (H1) leaf litter decomposition and (H2) invertebrate abundance and richness. Regarding invertebrate traits, we also hypothesized that increasing salinity will (H3) increase the proportion of traits conferring resilience (short lifespan, ovoviviparous reproduction, and aerial respiration) and resistance (multivoltinism), due to the selection of taxa showing traits most suitable to cope with a given salinity, and (H4) decrease the proportion of traits conferring avoidance (amphibiotic life cycles and terrestrial reproduction), as taxa not able to cope with the osmotic stress disperse to other aquatic bodies. Finally, if the studied salinity levels do not cause acute toxic effects, we hypothesized that (H5) the proportion of resilience and resistance will increase while avoidance traits will decrease over time.
2. Materials and Methods
2.1. Outdoor Mesocosms
The present study was carried out in six lentic mesocosms during November 2013–January 2014 using the setup described in [18]. The mesocosms consisted of black rigid polyvinyl chloride containers with a capacity of 1500 L (1.5 m diameter, 1 m depth), buried into the ground to surface level at Escola Superior Agrária de Coimbra (Coimbra, 40°12′ N, 8°27′ W). The mesocosms were prepared in September 2013, using sediment (300 L; Lagoa dos Teixoeiros 40°18′ N, 8°46′ W) and 1000 L of freshwater, 600 L from a spring-fed stream (Olhos d’Água do Rio Anços 39°58′ N, 8°24′ W) and 400 L from a local well. Mesocosms were evenly inoculated with the macrophytes Potamogeton sp. and Myriophyllum sp. (8 individuals each per mesocosm; Olhos d’Água do Rio Anços), macroinvertebrates and zooplankton (collected at Olhos d’Água do Rio Anços, Lagoa dos Teixoeiros, Lagoa das Braças 40°14′ N, 8°48′ W, and Lagoa da Vela 40°16′ N, 8°47′ W), in addition to the phytoplankton, zooplankton, macroinvertebrates, and microbial organisms indirectly introduced via the sediment, water, and macrophytes. The mesocosms were left stabilizing for 7 weeks before seawater intrusion.
Seawater intrusion was simulated using Atlantic Ocean water (West coast of Central Portugal; 52.7 mS cm−1). On 20 November 2013 (day 0), a water volume was removed from each mesocosm (between 32 and 280 L, filtered to return back organisms bigger than 50 μm), and the same seawater volume was added to the respective mesocosm (using a 1.65-fold dilution factor), resulting in the following five electrical conductivity values, hereafter used to designate the various treatments: 2.0, 3.3, 5.5, 9.3, and 15.3 mS cm−1; a sixth mesocosm (freshwater only) was left intact to be used as the control treatment (0.28 mS cm−1). Preliminary laboratory toxicity tests with a range of seawater dilutions revealed lethal effects on invertebrates close to 15 mS cm−1 (at higher than 12 mS cm−1 for the cladoceran Daphnia magna and the cnidarian Hydra attenuata, and at higher than 18 mS cm−1 for the insect Chironomus riparius), whereas [15] found seawater sublethal effects on the rotifer Brachionus calyciflorus and Daphnia longispina between 2 and 5 mS cm−1.
Electrical conductivity, pH, and dissolved oxygen were measured in situ two times before (days -14 and -6) and four to six times after seawater intrusion (days 2, 7, 14, 21, 28, and 65) with field probes (Wissenschaftlich Technische Werkstätten, Weilheim, Germany: WTW conductivity440i, WTW pH330i, and WTW OXI 330i, respectively). Water temperature was recorded every 15 min with a Hobo Pendant Temp/Light logger UA-002-64 (Onset company, Cape Cod, MA, USA), except in treatment 3.3 mS cm−1, where the equipment malfunctioned. Water samples (one per mesocosm) were collected on the same occasions (except for day -14), and a Hach DR/2000 photometer (Hach company, Loveland, CO, USA) was used to quantify the following nutrient concentrations (mgL−1; three replicate measurements per water sample), according to Hach manual: ammonia (N-NH3; method 8038), nitrate (N-NO3−; method 8192), orthophosphate (PO4 3−; method 8048), and sulphate (SO4 2−; method 8051). Monthly air temperature and precipitation values during the study period were obtained from a nearby meteorologic station (Escola Superior Agrária, Bencanta: 40°12′ N, 8°41′ W, altitude 17 m).
2.2. Leaf Litter Decomposition and Associated Invertebrates
The effect of seawater intrusion on organic matter decomposition was assessed using alder (Alnus glutinosa (L.) Gaertn.) leaves, a common riparian species in the study area. Alder is considered a key riparian plant species and a model litter widely used in decomposition experiments across Europe and elsewhere [19]. Five days before seawater intrusion (15 November 2013), groups of 5 air-dried leaves (1.15 g ± 0.09 standard deviation [SD]) were sprinkled with distilled water to avoid damage, tied by the petiole to form leaf packs, and nine leaf packs were introduced and let sunk naturally in each mesocosm. On the day of seawater intrusion (day 0: 20 November 2013), three replicates were removed to determine mass loss due to leaching and establish initial leaf mass values. Sampling was carried out after 16 (6 December 2013) and 63 days (22 January 2014) of immersion.
On each sampling occasion, three leaf packs were retrieved from each mesocosm, introduced individually in plastic bags, and transported in an ice-chest for immediate processing. In the laboratory, the leaves were gently washed with tap water over a 0.2 mm mesh to detach adhering debris and invertebrates, oven-dried (60 °C, 3 days), and weighed to the nearest 0.1 mg to determine oven-dry mass.
The oven-dry mass of the leaves used in the experiment was estimated by multiplying their air-dry mass by the humidity factor. Three extra leaf packs were weighed, oven-dried (60 °C, 3 days), and weighed again (±0.1 mg) to determine the humidity factor (oven-dry/air-dry mass; mean ± 1 SD: 0.857 ± 0.015). To account only for the effect of biological activity on mass loss, the oven-dry mass remaining on day 0 was used to determine the leaching factor (final/initial oven-dry mass; overall mean ± 1 SD: 0.915 ± 0.012). Oven-dry mass remaining at each sampling day was divided by the leaching factor to correct for mass loss due to leaching during the 5 days immersion period before seawater intrusion. Final values were expressed as the percentage loss of initial oven-dry mass after leaching of soluble compounds.
The invertebrates associated with the leaves were collected, sorted, stored in the cold, identified to order or family level [18], and counted under a binocular stereoscope within the next 24 h. Values were expressed as number of individuals (abundance) or number of taxa (richness) per leaf pack.
2.3. Invertebrate Communities of the Mesocosms
The data and methods are from [18]. Briefly, the invertebrates were sampled at 14 and 6 days before seawater intrusion to assess the similarity of the mesocosms, and six times after (2, 7, 14, 21, 28, and 65 days) to assess the effect of seawater intrusion. Sampling was carried out with a hand net (0.5 mm mesh) and consisted of three equidistant passages of the net across the diameter of the mesocosms at the macrophyte level. The invertebrates were carefully collected and stored in 50 mL plastic containers with 70% ethanol, identified to family level and counted. Values were expressed as number of individuals (abundance) or number of taxa (richness) per mesocosm.
2.4. Invertebrate Life Cycle Traits
Using the rationale of [17], five life cycle and one physiological trait categories from [20] were aggregated as combinations of traits providing resilience, resistance, and avoidance to osmotic stress. Life cycles shorter than one-year reduce time and energy to reach adult stage with earlier reproduction, ovoviviparity provides egg protection from environmental conditions, and aerial respiration allows coping with low dissolved oxygen concentrations, which may occur at high salinities [21] and were aggregated as combinations providing resilience to osmotic stress. Life cycles with more than one generation per year provide resistance as they increase the capacity to reach high population numbers and recover after disturbance. Finally, amphibiotic life cycles (taxa with non-aquatic life stages) and terrestrial reproduction provide independence from the aquatic environmental conditions and allow dispersion to other aquatic environments thus providing avoidance capacities.
The proportion of a trait category per treatment was calculated according to [20]. Each taxon was attributed an affinity score of 0 (no affinity) to 3 (strong affinity) for the trait category, and the frequency of that category in a taxon (Table S1 in Supplementary Materials) was calculated by dividing the score of the category by the sum of scores of all possible categories. Finally, the frequency of the taxon presenting the trait category (or the average frequency of the various categories in the cases of resilience and avoidance) was multiplied by the proportion of individuals in that taxon, and the resulting values summed for each sample.
2.5. Data Analysis
The experimental design includes only one mesocosm per treatment, i.e., no replicates, with measurements along time. Thus, initial abiotic and biotic conditions before seawater intrusion as well as the physicochemical parameters during the study period were compared with a repeated-measures procedure using the collection dates as the repeated-measures factor. To avoid violation of the sphericity assumption, the procedure was applied to groups of variables as a multivariate analysis of variance (MANOVA, [22]), as follows. Before seawater intrusion: one dependent variable was composed of dissolved oxygen, pH, temperature, and electrical conductivity and the other of invertebrate abundance and richness. During the experimental period, one dependent variable was composed of ammonia and sulphate, which increased with increasing salinity, and the other was composed of dissolved oxygen, pH, nitrate, and phosphate. Prior to analysis, normality was checked with the Shapiro–Wilk’s test and homoscedasticity was checked with the Bartlett’s test (normal distribution data) or the Levene’s test (nonnormal distribution data). Nonnormal and/or heteroscedastic data was transformed using the square root transformation, in the case of invertebrate abundance and richness or the logarithmic transformation, , in the case of the physicochemical data [22]. Given that the MANOVA is robust, operating well even with considerable heterogeneity of variances and deviations from normality [22], the procedure was still carried out even when normality or homoscedasticity were not achieved after transformation. Whenever a significant difference among treatments was found, post-hoc multiple comparisons were carried out with the Tukey test. All these procedures were performed with STATISTICA Version 10.0 (StatSoft, Inc., Tulsa, OK, USA) with the level of significance set at 0.05.
Regarding the biotic variables, rather than comparing the treatments, our aim was to assess the departure of the values in each treatment in relation to the control. Thus, the effect of salinity on litter decomposition and on the invertebrates was assessed by computing the average deviation and the 95% confidence limits (CL) of values in each treatment in relation to the values in the control, using all samples collected over the time period. For each response variable, the deviation of the value in each sample of a treatment in relation to the value in each sample of the control (2 sampling dates × 3 leaf packs for the decomposition experiment, and 6 sampling dates for the mesocosms’ invertebrates) was computed as: (value in treatment-value in control)/value in control. We considered that there was a net effect of salinity in a treatment in relation to the control whenever the 95% CL were lower than the mean deviation, indicating that the treatment and the control samples came from different statistical populations.
3. Results
3.1. Abiotic Variables
Average air temperature in the study area ranged from 9.8 to 11.5 °C during the study period. Total precipitation increased along the time period, with 17.2 mm in November, 163.8 mm in December, and 204.6 mm in January. There were no significant differences among the mesocosms in the abiotic variables (electrical conductivity, dissolved oxygen, pH, and temperature) before seawater intrusion (MANOVA: F0.05(1)10,10 = 1.90, p = 0.17; Table S2 in Supplementary Materials); it was not possible to compare the mesocosms regarding nutrients because there was only one measurement before seawater intrusion (Table 1).
During the 65 days following the seawater intrusion, dissolved oxygen, pH, nitrate and phosphate remained similar among the treatments (MANOVA: F0.05(1)5,18 = 0.53, p = 0.75; Table S2 in Supplementary Materials), but there was a significant effect of treatment on ammonia and sulphate (MANOVA: F0.05(1)5,22 = 113.56, p < 0.0001; Table S2 in Supplementary Materials), which increased with increasing salinity (Figure S1 in Supplementary Materials) and were only similar between treatments 2.0 and 3.3 mS cm−1 and between treatments 3.3 and 5.5 mS cm−1. Electrical conductivity decreased in all treatments as precipitation increased, attaining minimum values by day 65, but the values in the treatments never overlapped (Table 1). Ammonia concentrations also decreased along time, while sulphate values increased (Figure S1 in Supplementary Materials), resulting in a signification interaction between treatment and time (Table S2 in Supplementary Materials).
3.2. Leaf Litter Decomposition and Associated Invertebrates
On average, leaf packs in treatments 3.3 and 5.5 mS cm−1 lost more mass than the control, with mass loss decreasing with increasing salinity afterwards (Figure 1a). However, salinity had a significant effect only in treatment 15.3 mS cm−1, where mass loss showed a net decrease in relation to the control (Table 2).
The abundance of invertebrates colonizing the leaves reached, at the most, 11–24 individuals per leaf pack (Figure 1b). Four taxa constituted 89% of all individuals: juveniles of Anisoptera (Corduliidae; 32%) and Zygoptera (Coenagrionidae; 19%), Chironomidae (24%), and Ostracoda (14%). The other taxa (Table S3 in Supplementary Materials) were rare and represented, at the most, 3% of all individuals. There were no leaf-shredding invertebrates; predators were the most abundant functional feeding group (56%), followed by gathering-collectors (23%), filtering-collectors (19%) and scrapers (3%). There was no significant effect of salinity on abundance (Table 2), although average invertebrate abundance was higher in salinities ranging from 2.0 to 5.5 mS cm−1 than in the control (Figure 1b). Average richness decreased with increasing salinity (Figure 1c) and was significantly lower in treatments 9.3 and 15.3 mS cm−1 than in the control (Table 2).
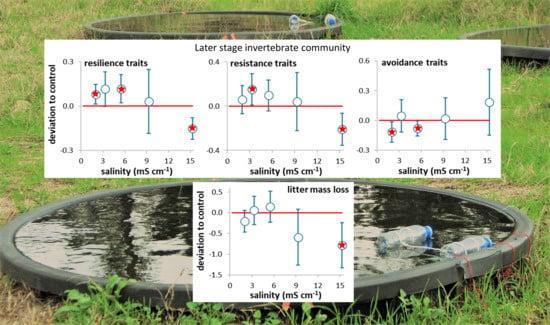
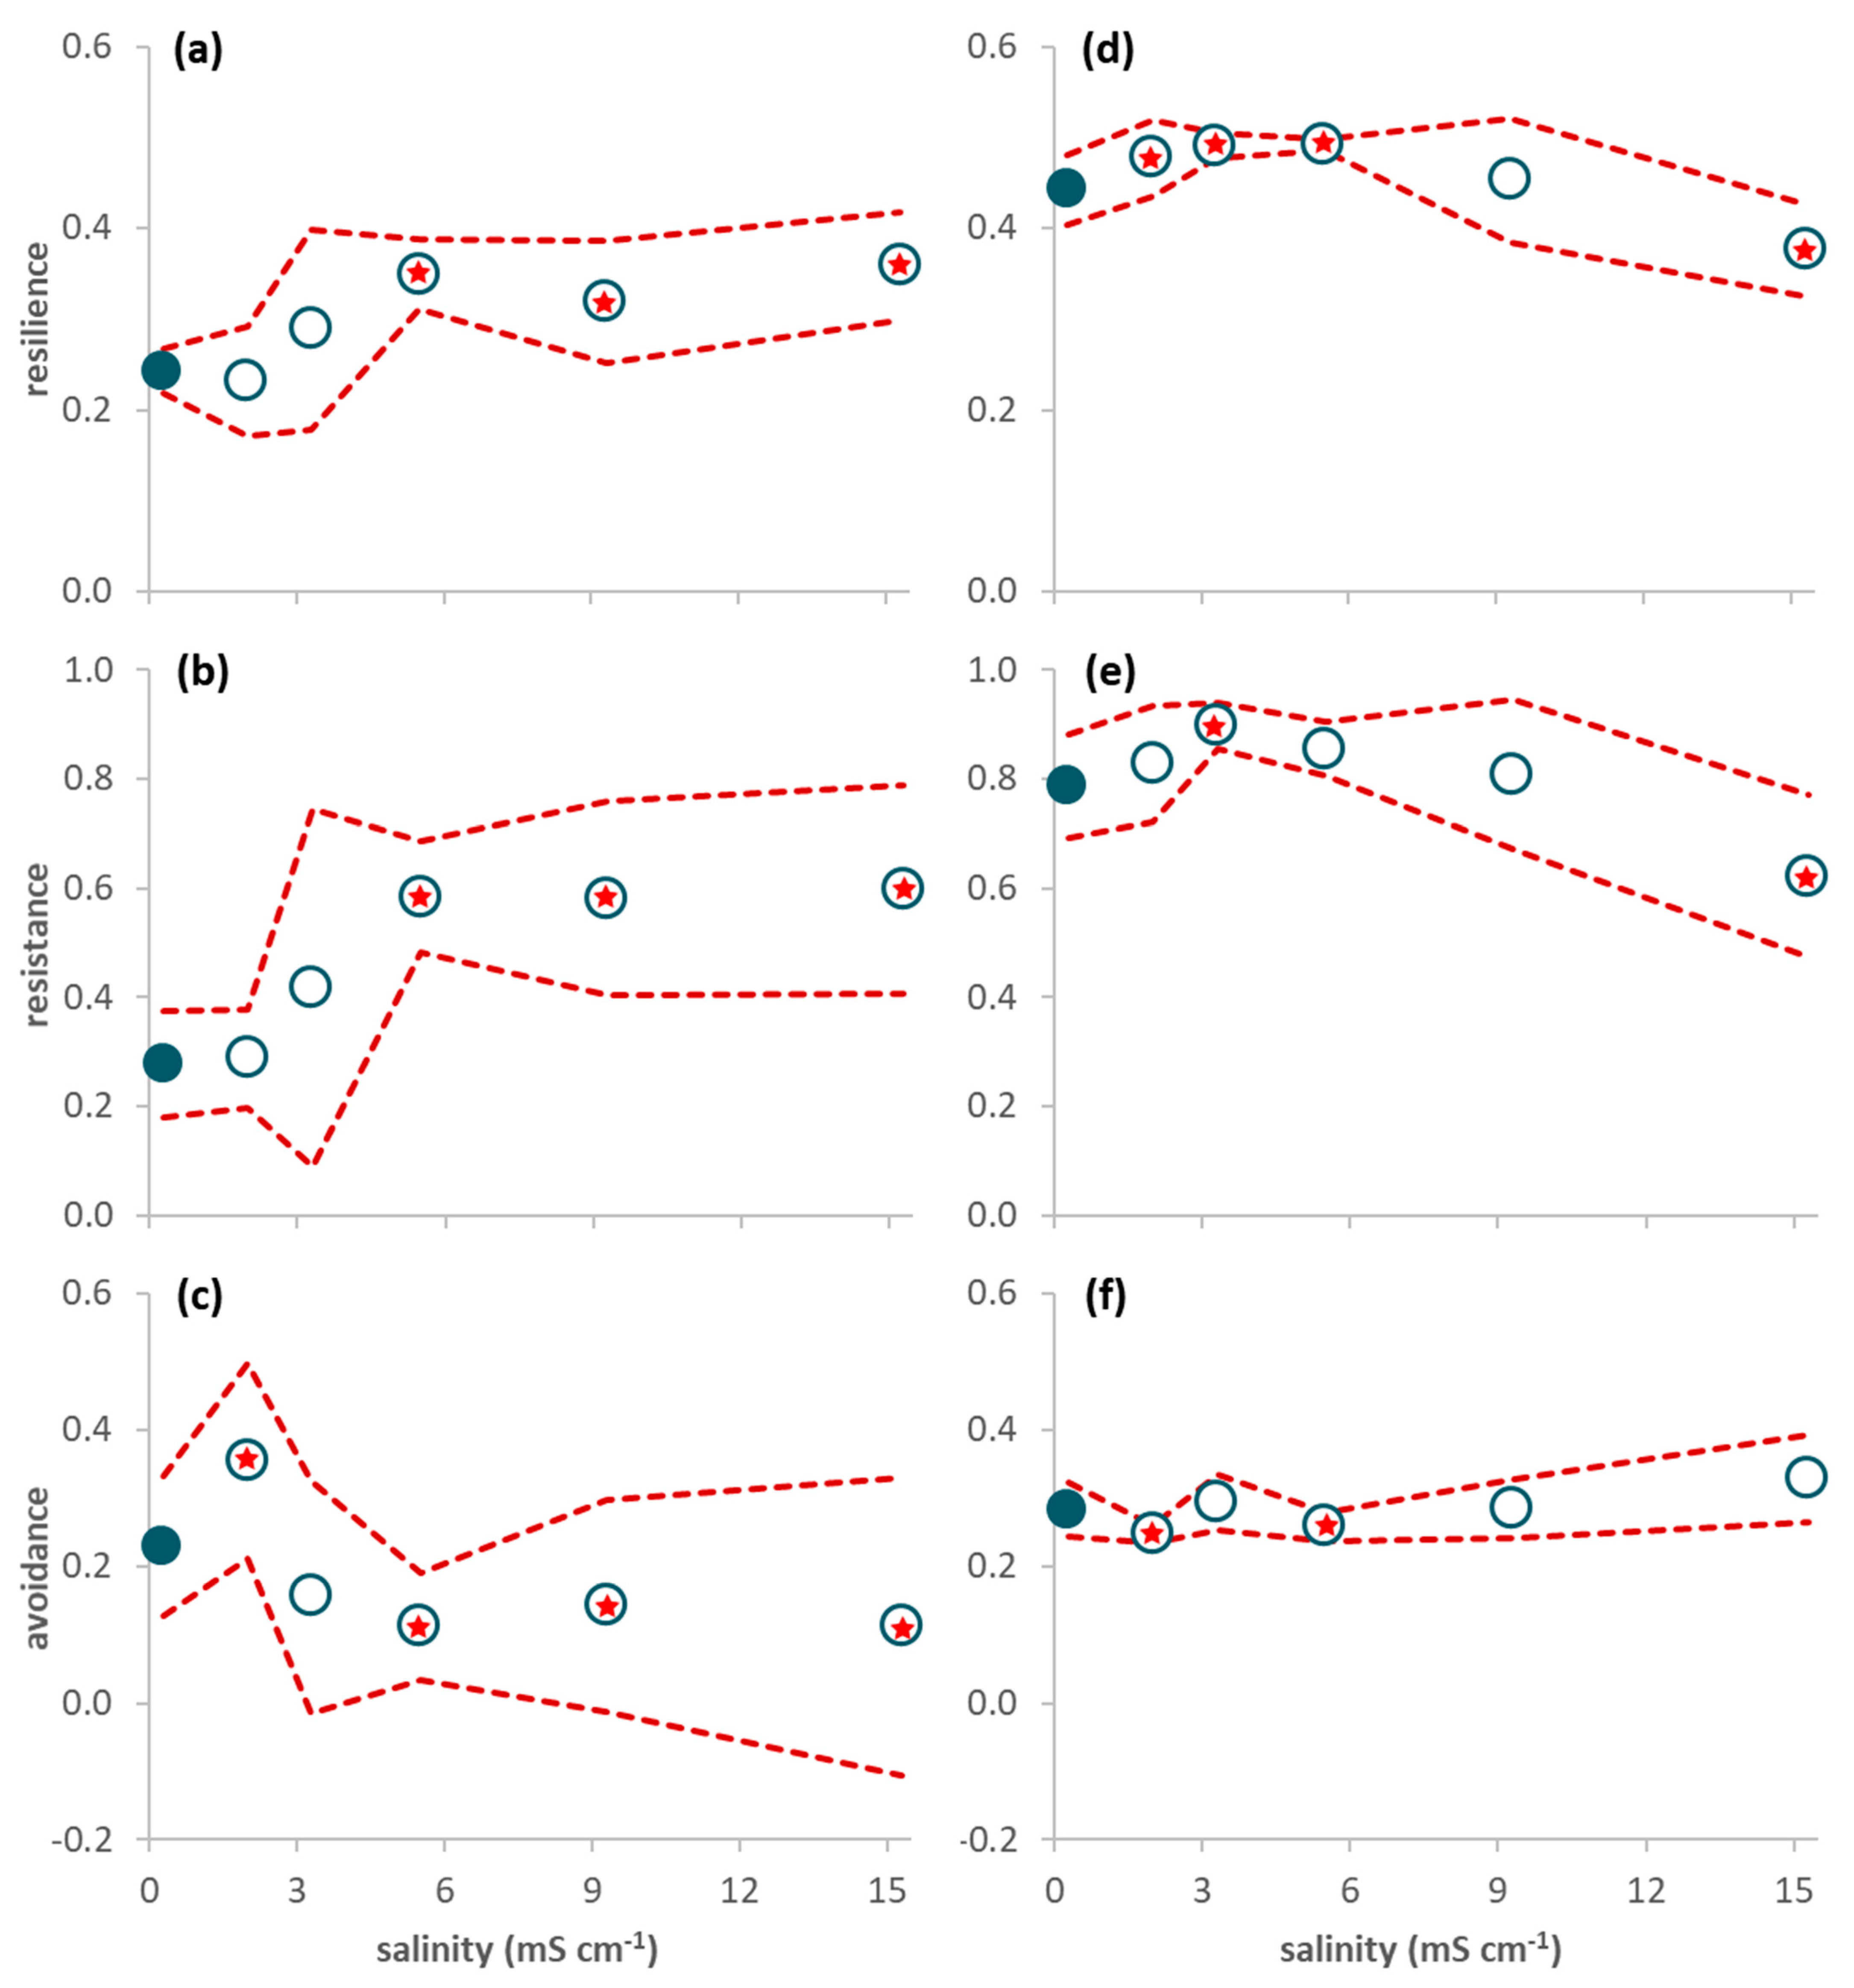
The proportion of traits conferring resilience and resistance was significantly higher in treatment 5.5 mS cm−1 than in the control (Figure 1d,e; Table 2) while the proportion of traits conferring avoidance was significantly higher in treatment 2.0 mS cm−1 than in the control (Figure 1f; Table 2). When only data from day 63 were considered, resilience and resistance traits significantly increased from salinity level 5.5 mS cm−1 upwards (Figure 2a,b; Table 2) while avoidance traits (Figure 2c) significantly decreased for salinities higher than 5.5 mS cm−1 and increased in the lowest salinity treatment (2.0 mS cm−1) in relation to the control (Table 2).
3.3. Invertebrate Coomunities in the Mesocosms
There were no significant differences among the mesocosms in invertebrate abundance and richness before seawater intrusion (MANOVA: F0.05(1)5,6 = 0.92, p = 0.53; Table S2 in Supplementary Materials); average abundance per mesocosm ranged from 15.0 ± 0.0 SD to 23.5 ± 3.5 SD, while average richness per mesocosm ranged from 3.0 ± 0.0 SD to 5.5 ± 0.7 SD (Table S4 in Supplementary Materials). Baetidae constituted 60% of all individuals, followed by Chironomidae (17%), Corduliidae and Corixidae (both with 7%).
After seawater intrusion, average abundance per sampling day ranged from 39 individuals in treatment 3.3 to 49 individuals in the control (Figure 3a). Baetidae constituted 61% of all individuals, followed by Chironomidae (14%), Corduliidae (13%) and Coenagrionidae (4%). The other taxa were rare and represented, at the most, 2% of all individuals (Table S4 in Supplementary Materials). Invertebrate abundance decreased with seawater intrusion (Figure 3a), with a net negative effect of salinity in treatments 3.3 and 5.5 mS cm−1 (Table 2). Average richness decreased with low salinity levels, and increased afterwards, with no significant deviations in relation to the control (Figure 3b; Table 2).
There was a net increase in the proportion of resilience (treatments 2.0 and 3.3 mS cm−1) and resistance (treatment 3.3 mS cm−1) traits in relation to the control (Figure 3c,d; Table 2), while avoidance traits showed no significant deviations in relation to the control (Figure 3e; Table 2). When only data from days 21–65 were considered (Figure 2d–f; Table 2), resilience traits showed a net increase in treatments 2.0 to 5.5 mS cm−1 and a net decrease in treatment 15.3 mS cm−1 (Figure 2d), resistance traits showed a net increase in treatment 3.3 mS cm−1 and a net decrease in treatment 15.3 mS cm−1 (Figure 2e), and avoidance traits showed a net decrease in treatments 2.0 and 5.5 mS cm−1 in relation to the control (Figure 2f; Table 2).
4. Discussion
4.1. Leaf Litter Decomposition and Associated Invertebrates
Mass loss estimation excluded the leaching period, which has been shown to be affected by salinity associated parameters [5,23] and there were no invertebrate shredders colonizing the leaves. We may thus assume that mass loss was mainly due to microbial degradation, and that the 61% lower mass loss in treatment 15.3 mS cm−1 was a result of decreased microbial activity on leaf litter. Increasing salinity has been systematically found to decrease autochthonous and allochthonous organic matter decomposition, microbial activity and/or fungal biomass associated with decomposing litter [11,12,23]. A significant decrease of mass loss of the North American species (family Sapindaceae) Acer rubrum leaf litter in mesocosms has been found with increasing salinity (0 to 13 psu) and mass loss correlated with bacterial diversity, with distinct bacterial communities associated to each of the four tested salinities [24]. Interestingly, bacterial diversity in the latter study increased with salinity during the first 18 days, suggesting that some small compensation by bacteria mitigated the effect of salinity, but the effect may be temporary since the pattern was reversed the longer the term. In the present study, mass loss was higher (although not significantly) at intermediate salinity (3.3 mS cm−1) in relation to the control, suggesting that at low salinity levels, microbial activity may be enhanced by the presence of ions, such as Ca2+ and Mg2+ [11]. Overall, the results found here support our first hypothesis (H1) indicating a decrease in mass loss if salinity rises to 15.3 mS cm−1 with consequences for the aquatic detritivore food webs.
Richness of the invertebrates associated with decomposing leaves decreased with salinities equal to or higher than 9.3 mS cm−1. However, most taxa were rare, and the response of richness to salinity may just be an artifact related to the choice of this habitat for reasons other than salinity. For instance, the invertebrates were dominated by juvenile Zygoptera and Anisoptera, predators that probably encountered in the leaf packs appropriate shelter during the earlier life stages. Since the invertebrates colonizing the leaves are only a subset of the source community, we thus considered mainly the invertebrate communities of the mesocosms for assessing the effects of salinity.
4.2. Invertebrates in the Mesocosms
It has been suggested that salinities as low as 1 g L−1 (<2 mS cm−1) may already have toxic effects to invertebrates with sublethal effects occurring at even lower salinities, resulting in the reduction of diversity and abundance with increasing salinity [25]. In the present study, abundance and richness were decreased in all salinity treatments in relation to the control, although only significantly at intermediate salinity levels (3.3 and 5.5 mS cm−1). This could be due to the low taxonomic resolution of our data set, not adequate to detect significant differences. A sharp decrease in taxonomic diversity may occur above conductivities of 5 to 20 mS cm−1 [21], but most studies showing a reduction in richness with increasing salinity were carried out along salinity gradients where the invertebrate communities were already adapted to the environmental conditions (e.g., [26]), and may not adequately represent the short-term effect of increasing salinity on the invertebrate assemblages. Additionally, [27] suggested that changes in invertebrate diversity will occur only at salinities ≥ 10 g L−1 (approximately 15.5 mS cm−1). Thus, the salinities tested in the present study may have been too low to show a significant decrease in richness of the invertebrate community or, given the observations regarding the taxonomic groups (below), most probably the timelapse of 65 days was too short to show the disappearance of some taxa. Given the above results, our second hypothesis (H2) was supported only for low salinity levels.
Most of the taxa were rare, precluding conclusions on the effect of salinity on richness even when they were absent from the salinity treatments, as in the case of the dipterans Culicidae (absent in treatment 15.3 mS cm−1) and the riffle bugs Veliidae (absent in treatments 9.3 and 15.3 mS cm−1). The gastropod Physidae represented only 2.7% of all individuals associated with the leaves and 0.5% of the individuals in the mesocosms, but it was absent in both cases from salinities ≥ 9.3 mS cm−1, conforming to the maximum salinity tolerance of 6.8 g L−1 determined by [28]. The performance of these gastropods has been found to be increased by salinity levels of up to 1 mS cm−1 and decrease at 3 (reproduction) to 5 mS cm−1 (growth), which would explain the disappearance of these gastropods at salinities ≥ 9.3 mS cm−1 [29]. Moreover, these scrapers could have been affected directly by salinity and indirectly by salinity-induced changes in their food source [25].
On the other hand, the ephemeropterans Baetidae were abundant. Total Baetidae (cf. genus Cloeon and/or Centroptilum) abundance was lower in all salinity treatments (88–151 individuals) than in the control (177 individuals), with the lowest abundance in treatment 15.3 mS cm−1. Moreover, average Baetidae abundance in treatment 15.3 mS cm−1 decreased 86% from the first seven days (35 individuals per sample) to day 14 after seawater intrusion (average of five individuals per sample) and maintained these low values until day 65, with a significant deviation in relation to the control during that period (−0.84 ± 0.06 95% CL, n = 4). This pattern conforms to the salinity tolerance of 9.8 g L−1 and to LC50 values of 13–14 mS cm−1 determined in other studies [28,30,31] and suggests the disappearance of this taxon if salinity rises to 15.3 mS cm−1.
Chironomids were also abundant; abundance was higher in the control than in the salinity treatments and followed a V-shaped curve with lowest values in treatment 5.5 mS cm−1. In other studies, Chironomus sp. showed an inverted U-shape curve of abundance with highest survival at as much as 5 mS cm−1 and a steep decline at 10–15 mS cm−1 [32]. As chironomids are the largest family of aquatic insects [33] and their salinity tolerance varies widely among species (3.9 to 53.8 g L−1 [28]), it is not possible, from our results, to predict the outcomes of rising salinity levels on this taxonomic group.
Finally, the other abundant taxonomic groups were the odonatans Corduliidae and Coenagrionidae. Corduliidae showed a V-shaped response to salinity, with minimum at 3.3 mS cm−1, whereas Coenagrionidae showed a U-shaped response with minimums at 2.0–9.3 mS cm−1. Values in literature indicate salinity tolerances for Anisoptera varying from 5.9 to 14.8 mg L−1 [34], while Coenagrionidae have a salinity tolerance of 9.1 to 18 g L−1 [28]. However, given the obtained response, it is not possible to determine a maximum value above which changes in salinity will have effects on these taxonomic groups.
4.3. Invertebrate Traits
Contrarily to [21], who found a tendency for a decrease in the proportion of organisms with short lifespan and an increase in the proportion of multivoltine life cycles in rivers with increasing natural salinity, the present study found that the proportion of resilience and resistance traits were increased only at low salinity levels of up to 3.3 mS cm−1, decreasing with increasing salinity afterwards. Several species’ traits may concur for adapting to a particular environment and often they may respond in opposite directions to the same environmental stress through trade-offs [17]. For instance, while short lifespan may confer resilience by decreasing the amount of energy necessary to cope with osmotic stress [21], long development time may also confer resilience to high salinity [17]. At high salinity levels, the trade-offs with (other) traits conferring resilience and resistance may have surpassed the effects on the traits assessed in the present study, suggesting that the strategies for coping with osmotic stress differed in low and high salinity levels. Thus, our third hypothesis (H3) of increased resilience and resistance with salinity was only partially accepted, since the proportion of these traits decreased in the highest salinity treatment. We found no effects of salinity on avoidance, thus rejecting our fourth hypothesis (H4). Finally, our fifth hypothesis (H5) that resilience and resistance traits would increase while avoidance traits would decrease with time was only partially accepted. For the low salinity levels of up to 5.5 mS cm−1, resilience and resistance increased while avoidance decreased with time after seawater intrusion. However, the opposite occurred at the highest tested salinity (15.3 mS cm−1), once again suggesting different strategies to cope with low and high salinity levels.
5. Conclusions
In conclusion, our results show that seawater intrusion into freshwaters will affect both ecosystem structure and function, at least in respect to the invertebrate communities and to organic matter decomposition. This occurred even though the salinity levels in the treatments decreased along time due to precipitation events (Table 1, Figure S1 in Supplementary Materials), suggesting that the effects found in the present study may occur even at lower salinities than the ones tested in the experiment. During the 2 months after seawater intrusion, we obtained a wave-like response to increasing salinity for all variables. However, contrary to the hypothesis of [25], the hump at low salinity levels occurred only for mass loss, while for both abundance and richness of the invertebrate community, there was a depression at low salinity levels. In any case, the direction of the effect of salinity will depend on the magnitude of the intrusion events, with salinities of up to 3.3–5.5 mS cm−1 having opposite effects to salinities of more than 9.3 mS cm−1. Moreover, there was also a wave-like response of the species traits to increasing salinity, suggesting that the life-history and physiological adaptations most suitable to cope with osmotic stress will differ between low and high salinity levels.
Supplementary Materials
The following are available online at https://0-www-mdpi-com.brum.beds.ac.uk/article/10.3390/d13110599/s1, Figure S1: Temporal variation of the physicochemical values in each treatment during the 65 days after seawater intrusion, Table S1: Invertebrate trait categories used to characterize resilience, resistance, and avoidance to osmotic stress, Table S2: Statistical results for the variables characterizing initial abiotic and biotic conditions of the mesocosms and of the physicochemical parameters during the 65 days after seawater intrusion, Table S3: Abundance of the invertebrates colonizing the leaf litter, Table S4: Abundance of the invertebrates sampled in the mesocosms.
Author Contributions
Conceptualization, R.R., M.M.-S. and M.A.; methodology, M.A., R.R. and M.M-S.; formal analysis, M.A.; investigation, M.A., R.R. and M.M-S.; data curation, M.A. and M.M.-S.; writing—original draft preparation, M.A.; writing—review and editing, M.A., R.R. and M.M-S.; project administration, M.M.-S.; funding acquisition, M.M.-S. All authors have read and agreed to the published version of the manuscript.
Funding
This research was funded by the projects Saltfree (PTDC/AAC-CLI/111706/2009-FCOMP-01-0124-FEDER-014016) and Saltfree II (POCI-01-0145-FEDER-031022), both co-funded by the Portuguese Foundation for Science and Technology (FCT) and the European Regional Development Fund (FEDER). It was also funded by the Centre for Functional Ecology Strategic Project (UID/BIA/04004/2020), within the PT2020 Partnership Agreement and Compete 2020. MM-S is a contracted researcher (IT057-18-7285, nr. 71) supported by FCT (nr. 1370).
Institutional Review Board Statement
Ethical review and approval were waived for this study because invertebrates do not require authorization.
Data Availability Statement
Most of the data presented in this study are available in the Supplementary Materials. Other data are available on request from the corresponding author.
Acknowledgments
We thank Cândida Shinn, Isabel Lopes and Cátia Venâncio for their help with the setup of the mesocosms and with the measurement of the physicochemical parameters, and Manuel Nunes for providing the meteorological data.
Conflicts of Interest
The authors declare no conflict of interest.
References
- IPCC. Summary for Policymakers. In Climate Change 2021: The Physical Science Basis; Masson-Delmotte, V., Zhai, P., Pirani, A., Connors, S.L., Péan, C., Berger, S., Caud, N., Chen, Y., Goldfarb, L., Gomis, M.I., Eds.; Contribution of Working Group I to the Sixth Assessment Report of the Intergovernmental Panel on Climate Change; Cambridge University Press: Cambridge, UK, 2021; in press. [Google Scholar]
- Werner, A.D.; Bakker, M.; Post, V.E.A.; Vandenbohede, B.; Lu, C.; Ataie-Ashtiani, A.; Simmons, C.T.; Barry, D.A. Seawater intrusion processes, investigation and management: Recent advances and future challenges. Adv. Water Resour. 2012, 51, 3–26. [Google Scholar] [CrossRef]
- Cañedo-Argüelles, M.; Kefford, B.; Schäfer, R. Salt in freshwaters: Causes, effects and prospects-introduction to the theme issue. Phil. Trans. R. Soc. B. 2018, 374, 20180002. [Google Scholar] [CrossRef]
- Iglesias, M.C.-A. A review of recent advances and future challenges in freshwater salinization. Limnetica 2020, 39, 185–211. [Google Scholar] [CrossRef]
- Kaushal, S.S.; Likens, G.E.; Pace, M.L.; Reimer, J.E.; Maas, C.M.; Galella, J.G.; Utz, R.M.; Duan, S.; Kryger, J.R.; Yaculak, A.M.; et al. Freshwater salinization syndrome: From emerging global problem to managing risks. Biogeochemistry 2021, 154, 255–292. [Google Scholar] [CrossRef]
- Venâncio, C.; Ribeiro, R.; Lopes, I. Seawater intrusion: An appraisal of taxa at most risk and safe salinity levels. Biol. Rev. 2021. [Google Scholar] [CrossRef] [PubMed]
- Chandramohan, G.; Arivoli, S.; Venkatesan, P. Effect of salinity on the predatory performance of Diplonychus rusticus (Fabricius). J. Environ. Biol. 2008, 29, 287–290. [Google Scholar] [PubMed]
- Venâncio, C.; Anselmo, E.; Soares, A.; Lopes, I. Does increased salinity influence the competitive outcome of two producer species? Environ. Sci. Pollut. Res. 2017, 24, 5888–5897. [Google Scholar] [CrossRef]
- Venâncio, C.; Ribeiro, R.; Lopes, I. Active emigration from climate change-caused seawater intrusion into freshwater habitats. Environ. Pollut. 2020, 258, 113805. [Google Scholar] [CrossRef]
- Gessner, M.O.; Chauvet, E. A case for using litter breakdown to assess functional stream integrity. Ecol. Appl. 2002, 12, 498–510. [Google Scholar] [CrossRef]
- Roache, M.C.; Bailey, P.C.; Boon, P.I. Effects of salinity on the decay of the freshwater macrophyte, Triglochin procerum. Aquat. Bot. 2006, 84, 45–52. [Google Scholar] [CrossRef]
- Berger, E.; Frör, O.; Schäfer, R.B. Salinity impacts on river ecosystem processes: A critical mini-review. Phil. Trans. R. Soc. B 2018, 374, 20180010. [Google Scholar] [CrossRef] [Green Version]
- Júnior, E.S.A.; Martínez, A.; Gonçalves, A.L.; Canhoto, C. Combined effects of freshwater salinization and leaf traits on litter decomposition. Hydrobiologia 2020, 847, 3427–3435. [Google Scholar] [CrossRef]
- Graça, M.A.S. The Role of Invertebrates on Leaf Litter Decomposition in Streams—A Review. Int. Rev. Hydrobiol. 2001, 86, 383–393. [Google Scholar] [CrossRef]
- Kefford, B.J.; Dalton, A.; Palmer, C.G.; Nugegoda, D. The salinity tolerance of eggs and hatchlings of selected aquatic macroinvertebrates in south-east Australia and South Africa. Hydrobiologia 2004, 517, 179–192. [Google Scholar] [CrossRef]
- Venâncio, C.; Castro, B.B.; Ribeiro, R.; Antunes, S.C.; Abrantes, N.; Soares, A.M.V.M.; Lopes, I. Sensitivity of freshwater species under single and multigenerational exposure to seawater intrusion. Phil. Trans. R. Soc. B 2018, 374, 20180252. [Google Scholar] [CrossRef] [Green Version]
- Verberk, W.C.E.P.; Siepel, H.; Esselink, H. Life-history strategies in freshwater macroinvertebrates. Freshw. Biol. 2008, 53, 1722–1738. [Google Scholar] [CrossRef]
- Venâncio, C.A.R. Salinization Effects on Coastal Terrestrial and Freshwater Ecosystems. Ph.D. Thesis, Universidade de Aveiro, Aveiro, Portugal, 2017; pp. 139–166. [Google Scholar]
- Pérez, J.; Basaguren, A.; López-Rojo, N.; Tonin, A.M.; Correa-Araneda, F.; Boyero, L. The Role of Key Plant Species on Litter Decomposition in Streams: Alder as Experimental Model. In The Ecology of Plant Litter Decomposition in Stream Ecosystems; Swan, C.M., Boyero, L., Canhoto, C., Eds.; Springer: Berlin, Germany, 2021; pp. 143–161. [Google Scholar] [CrossRef]
- Tachet, H.; Richoux, P.; Bournaud, M.; Usseglio-Polatera, P. Invertébrés D’eau Douce–Systématique, Biologie, Ecologie; CNRS Éditions: Paris, France, 2000. [Google Scholar]
- Gutiérrez-Cánovas, C.; Sánchez-Fernández, D.; Cañedo-Argüelles, M.; Millán, A.; Velasco, J.; Acosta, R.; Fortuño, P.; Otero, N.; Soler, A.; Bonada, N. Do all roads lead to Rome? Exploring community trajectories in response to anthropogenic salinization and dilution of rivers. Phil. Trans. R. Soc. B 2019, 374, 20180009. [Google Scholar] [CrossRef] [Green Version]
- Zar, J.H. Biostatistical Analysis; Prentice Hall, Inc.: Upper Saddle River, NJ, USA, 1996; ISBN 0-13-086398-X. [Google Scholar]
- Sauer, F.G.; Bundschuh, M.; Zubrod, J.P.; Schäfer, R.B.; Thompson, K.; Kefford, B.J. Effects of salinity on leaf breakdown: Dryland salinity versus salinity from a coalmine. Aquat. Toxicol. 2016, 177, 425–432. [Google Scholar] [CrossRef] [Green Version]
- Werba, J.A.; Stucy, A.L.; Peralta, A.L.; McCoy, M.W. Effects of diversity and coalescence of species assemblages on ecosystem function at the margins of an environmental shift. Peer J. 2020, 8, e8608. [Google Scholar] [CrossRef] [Green Version]
- Hart, B.T.; Bailey, P.; Edwards, R.; Hortle, K.; James, K.; McMahon, A.; Meredith, C.; Swadling, K. Effects of salinity on river, stream and wetland ecosystems in Victoria, Australia. Water Res. 1990, 24, 1103–1117. [Google Scholar] [CrossRef]
- Piscart, C.; Moreteau, J.-C.; Beisel, J.-N. Biodiversity and structure of macroinvertebrate communities along a small permanent salinity gradient (Meurthe River, France). Hydrobiologia 2005, 551, 227–236. [Google Scholar] [CrossRef]
- Herbert, E.R.; Boon, P.; Burgin, A.J.; Neubauer, S.C.; Franklin, R.B.; Ardón, M.; Hopfensperger, K.N.; Lamers, L.P.M.; Gell, P. A global perspective on wetland salinization: Ecological consequences of a growing threat to freshwater wetlands. Ecosphere 2015, 6, 206. [Google Scholar] [CrossRef]
- Rutherford, J.C.; Kefford, B.J. Effects of Salinity on Stream Ecosystems: Improving Models for Macroinvertebrates. In CSIRO Land and Water Technical Report 22/05; CSIRO Land and Water: Canberra, Australia, 2005. [Google Scholar]
- Kefford, B.J.; Nugegoda, D. No evidence for a critical salinity threshold for growth and reproduction in the freshwater snail Physa acuta. Environ. Pollut. 2005, 134, 377–383. [Google Scholar] [CrossRef]
- Kefford, B.J.; Papas, P.J.; Nugegoda, D. Relative salinity tolerance of macroinvertebrates from the Barwon River, Victoria, Australia. Mar. Freshw. Res. 2003, 54, 755–765. [Google Scholar] [CrossRef] [Green Version]
- Dunlop, J.E.; Horrigan, N.; McGregor, G.; Kefford, B.J.; Choy, S.; Prasad, R. Effect of spatial variation on salinity tolerance of macroinvertebrates in Eastern Australia and implications for ecosystem protection trigger values. Environ. Pollut. 2008, 151, 621–630. [Google Scholar] [CrossRef] [Green Version]
- Hassell, K.L.; Kefford, B.J.; Nugegoda, D. Sub-lethal and chronic salinity tolerances of three freshwater insects: Cloeon sp. and Centroptilum sp. (Ephemeroptera: Baetidae) and Chironomus sp. (Diptera: Chironomidae). J. Exp. Biol. 2006, 209, 4024–4032. [Google Scholar] [CrossRef] [Green Version]
- Hilsenhoff, W.L. Diversity and Classification of Insects and Collembola. In Ecology and Classification of North American Freshwater Invertebrates, 2nd ed.; Thorp, J.H., Covich, A.P., Eds.; Academic Press: Cambridge, MA, USA, 2001; pp. 661–731. [Google Scholar] [CrossRef]
- Kefford, B.J.; Fields, E.J.; Clay, C.; Nugegoda, D. Salinity tolerance of riverine microinvertebrates from the southern Murray-Darling Basin. Mar. Freshw. Res. 2007, 58, 1019–1031. [Google Scholar] [CrossRef] [Green Version]
Figure 1.
Response variables of the decomposition experiment during the 63-day study period (average per leaf pack ± 95% confidence limits (red dashed line); n = 6). (a) Leaf mass loss; (b) Invertebrate abundance; (c) Invertebrate richness (plus symbols refer to total (instead of average) richness: dark color for the control and light color for the treatments); (d) Proportion of resilience traits (short lifespan, ovoviviparous reproduction, and aerial respiration); (e) Proportion of resistance traits (multivoltinism); (f) Proportion of avoidance traits (non-aquatic life stages and terrestrial reproduction). A red star indicates a net average deviation of the values in a treatment (open circles) in relation to the values in the control (close circles) according to Table 2.

Figure 2.
Proportion of traits (average per leaf pack (a–c) or average per sample (d–f) ± 95% confidence limits (red dashed line); n = 3) of invertebrates associated with decomposing leaf litter on day 63 (a–c) and sampled in the mesocosms during the period 21–65 days after seawater intrusion (d–f). (a,d) Resilience traits (short lifespan, ovoviviparous reproduction, and aerial respiration); (b,e) Resistance traits (multivoltinism); (c,f) Avoidance traits (non-aquatic life stages and terrestrial reproduction). A red star indicates a net average deviation of the values in a treatment (open circles) in relation to the values in the control (close circles) according to Table 2.

Figure 3.
Response variables of the invertebrates sampled in the mesocosms during the 65-day period (average per sample ± 95% confidence limits (red dashed line); n = 6). (a) Invertebrate abundance; (b) Invertebrate richness (plus symbols refer to total (instead of average) richness: dark color for the control and light color for the treatments); (c) Proportion of resilience traits (short lifespan, ovoviviparous reproduction, and aerial respiration); (d) Proportion of resistance traits (multivoltinism); (e) Proportion of avoidance traits (non-aquatic life stages and terrestrial reproduction). A red star indicates a net average deviation of the values in a treatment (open circles) in relation to the values in the control (close circles) according to Table 2.


Table 1.
Average values ± 1 SD (and range) of water physicochemical characteristics before (one to two measurements per mesocosm) and during the 65 days study period after seawater intrusion (four to six measurements per mesocosm).
Table 1.
Average values ± 1 SD (and range) of water physicochemical characteristics before (one to two measurements per mesocosm) and during the 65 days study period after seawater intrusion (four to six measurements per mesocosm).
| Treatment | Electrical Conductivity (mS cm−1) | Dissolved Oxygen (mg L−1) | Temperature (°C) | pH | Nitrate (mg N-NO3 L−1) | Ammonia (mg N-NH3 L−1) | Orthophosphate (mg PO4 3− L−1) | Sulfate (mg SO4 2− L−1) |
|---|---|---|---|---|---|---|---|---|
| Before | n = 2 | n = 2 | n = 2 | n = 2 | n = 1 | n = 1 | n = 1 | n = 1 |
| All mesocosms | 0.27 ± 0.01 (0.26–0.27) | 10.9 ± 0.6 (9.6–11.9) | 14.9 ± 2.4 (12.3–17.3) | 8.0 ± 0.1 (7.8–8.2) | 2.9 ± 0.9 (1.8–4.2) | 0.19 ± 0.10 (0.07–0.34) | 0.05 ± 0.03 (0.01–0.08) | 10 ± 3 (7–16) |
| During | n = 6 | n = 4 | n = 5 | n = 6 | n = 6 | n = 6 | n = 6 | n = 5 |
| Control (0.28 mS cm−1) | 0.26 ± 0.05 (0.18–0.29) | 12.0 ± 1.7 (10.1–14.2) | 8.0 ± 1.6 (6.0–10.0) | 8.2 ± 0.6 (7.8–9.4) | 4.3 ± 0.7 (2.0–6.9) | 0.14 ± 0.12 (0.02–0.33) | 0.07 ± 0.06 (0.01–0.17) | 15 ± 12 (7–36) |
| 2.0 mS cm−1 | 1.86 ± 0.31 (1.26–2.05) | 17.5 ± 2.5 (13.9–19.2) | 8.1 ± 1.6 (6.1–10.0) | 8.3 ± 0.5 (7.8–9.2) | 3.8 ± 0.8 (3.3–4.8) | 0.36 ± 0.36 (0.00–0.48) | 0.09 ± 0.06 (0.05–0.16) | 104 ± 54 (56–184) |
| 3.3 mS cm−1 | 3.05 ± 0.53 (2.10–3.34) | 14.4 ± 0.5 (13.9–15.0) | no data | 8.3 ± 0.4 (7.9–9.0) | 3.6 ± 0.4 (3.0–4.0) | 0.25 ± 0.20 (0.01–0.60) | 0.08 ± 0.06 (0.04–0.15) | 132 ± 57 (74–220) |
| 5.5 mS cm−1 | 5.10 ± 0.66 (3.85–5.52) | 14.5 ± 1.1 (12.8–15.3) | 8.5 ± 1.6 (6.6–10.3) | 8.3 ± 0.4 (7.9–9.2) | 3.7 ± 1.1 (2.2–5.2) | 0.36 ± 0.33 (0.01–0.95) | 0.09 ± 0.04 (0.05–0.17) | 233 ± 170 (112–504) |
| 9.3 mS cm−1 | 8.58 ± 1.02 (6.61–9.22) | 14.2 ± 1.8 (12.7–16.3) | 8.3 ± 1.7 (6.3–10.1) | 8.4 ± 0.4 (7.9–9.0) | 4.1 ± 1.6 (2.9–6.9) | 0.70 ± 0.70 (0.02–1.86) | 0.08 ± 0.05 (0.03–0.15) | 341 ± 136 (188–520) |
| 15.3 mS cm−1 | 14.01 ± 1.62 (11.00–15.12) | 14.8 ± 0.9 (13.6–15.7) | 8.2 ± 1.7 (6.1–10.0) | 8.5 ± 0.4 (8.0–9.0) | 4.3 ± 1.7 (2.0–6.9) | 2.12 ± 0.93 (0.29–2.75) | 0.11 ± 0.06 (0.08–0.21) | 466 ± 241 (282–828) |
Table 2.
Average deviation ± 95% confidence limits of values in a treatment in relation to the control for the response variables of the leaf litter decomposition experiment and for the invertebrate communities in the mesocosms. Values in red represent a net (negative or positive) effect of a given salinity value on the response variable. Proportion of invertebrates with (a) short lifespan, ovoviviparous reproduction, and aerial respiration, (b) more than one generation per year, and (c) non-aquatic life stages and terrestrial reproduction.
| Leaf Litter Decomposition | |||||
| All data (n = 6) | 2.0 mS cm−1 | 3.3 mS cm−1 | 5.5 mS cm−1 | 9.3 mS cm−1 | 15.3 mS cm−1 |
| Mass loss | −0.21 ± 0.26 | 0.06 ± 0.34 | 0.15 ± 0.37 | −0.59 ± 0.67 | −0.78 ± 0.55 |
| Invertebrate abundance | 0.64 ± 0.80 | 0.14 ± 0.41 | 0.85 ± 1.28 | 0.33 ± 0.88 | 0.17 ± 0.38 |
| Invertebrate richness | 0.22 ± 0.55 | −0.13 ± 0.32 | −0.06 ± 0.31 | −0.16 ± 0.13 | −0.33 ± 0.21 |
| (a) Resilience traits | −0.09 ± 0.18 | −0.01 ± 0.29 | 0.33 ± 0.14 | 0.19 ± 0.26 | 0.22 ± 0.38 |
| (b) Resistance traits | −0.34 ± 0.47 | 0.02 ± 0.57 | 0.74 ± 0.54 | 0.50 ± 0.80 | 0.69 ± 0.85 |
| (c) Avoidance traits | 0.39 ± 0.21 | −0.19 ± 0.41 | −0.27 ± 0.33 | −0.23 ± 0.35 | −0.40 ± 0.49 |
| Day 63 (n = 3) | 2.0 mS cm−1 | 3.3 mS cm−1 | 5.5 mS cm−1 | 9.3 mS cm−1 | 15.3 mS cm−1 |
| (a) Resilience traits | 0.05 ± 0.16 | 0.18 ± 0.34 | 0.44 ± 0.02 | 0.40 ± 0.13 | 0.47 ± 0.11 |
| (b) Resistance traits | 0.04 ± 0.17 | 0.40 ± 0.60 | 1.17 ± 0.35 | 1.13 ± 0.49 | 1.17 ± 0.33 |
| (c) Avoidance traits | 0.56 ± 0.10 | −0.40 ± 0.58 | −0.54 ± 0.12 | −0.46 ± 0.36 | −0.67 ± 0.65 |
| Invertebrate Communities in the Mesocosms | |||||
| All sampling days (n = 6) | 2.0 mS cm−1 | 3.3 mS cm−1 | 5.5 mS cm−1 | 9.3 mS cm−1 | 15.3 mS cm−1 |
| Invertebrate abundance | −0.17 ± 0.35 | −0.34 ± 0.24 | −0.25 ± 0.20 | 0.01 ± 0.55 | −0.15 ± 0.87 |
| Invertebrate richness | −0.14 ± 0.26 | −0.28 ± 0.20 | −0.08 ± 0.24 | −0.07 ± 0.26 | 0.07 ± 0.24 |
| (a) Resilience traits | 0.06 ± 0.04 | 0.13 ± 0.07 | 0.08 ± 0.08 | 0.04 ± 0.10 | −0.09 ± 0.14 |
| (b) Resistance traits | 0.06 ± 0.07 | 0.16 ± 0.10 | 0.05 ± 0.14 | 0.05 ± 0.13 | −0.14 ± 0.18 |
| (c) Avoidance traits | 0.01 ± 0.13 | 0.11 ± 0.19 | −0.05 ± 0.12 | 0.02 ± 0.10 | 0.06 ± 0.23 |
| Days 21–65 (n = 3) | 2.0 mS cm−1 | 3.3 mS cm−1 | 5.5 mS cm−1 | 9.3 mS cm−1 | 15.3 mS cm−1 |
| (a) Resilience traits | 0.08 ± 0.08 | 0.11 ± 0.12 | 0.12 ± 0.10 | 0.03 ± 0.22 | −0.15 ± 0.07 |
| (b) Resistance traits | 0.06 ± 0.13 | 0.15 ± 0.14 | 0.10 ± 0.14 | 0.04 ± 0.26 | −0.21 ± 0.14 |
| (c) Avoidance traits | −0.12 ± 0.10 | 0.04 ± 0.16 | −0.08 ± 0.08 | 0.02 ± 0.21 | 0.18 ± 0.33 |
Publisher’s Note: MDPI stays neutral with regard to jurisdictional claims in published maps and institutional affiliations. |
© 2021 by the authors. Licensee MDPI, Basel, Switzerland. This article is an open access article distributed under the terms and conditions of the Creative Commons Attribution (CC BY) license (https://creativecommons.org/licenses/by/4.0/).
Share and Cite
MDPI and ACS Style
Abelho, M.; Ribeiro, R.; Moreira-Santos, M. Salinity Affects Freshwater Invertebrate Traits and Litter Decomposition. Diversity 2021, 13, 599. https://0-doi-org.brum.beds.ac.uk/10.3390/d13110599
AMA Style
Abelho M, Ribeiro R, Moreira-Santos M. Salinity Affects Freshwater Invertebrate Traits and Litter Decomposition. Diversity. 2021; 13(11):599. https://0-doi-org.brum.beds.ac.uk/10.3390/d13110599
Chicago/Turabian StyleAbelho, Manuela, Rui Ribeiro, and Matilde Moreira-Santos. 2021. "Salinity Affects Freshwater Invertebrate Traits and Litter Decomposition" Diversity 13, no. 11: 599. https://0-doi-org.brum.beds.ac.uk/10.3390/d13110599
Note that from the first issue of 2016, this journal uses article numbers instead of page numbers. See further details here.