
The Influence of Roost Type and Diet on Energy Expenditure in Bats
Department of Evolution, Ecology and Organismal Biology, Ohio State University at Mansfield, 1760 University Dr., Mansfield, OH 44906, USA
*
Author to whom correspondence should be addressed.
Diversity 2023, 15(5), 655; https://0-doi-org.brum.beds.ac.uk/10.3390/d15050655
Submission received: 23 October 2022
/
Revised: 1 May 2023
/
Accepted: 5 May 2023
/
Published: 11 May 2023
(This article belongs to the Special Issue Key Aspects in the Ecology and Diversity of Desert-Dwelling Bats)
Abstract
:Bats spend most of their lives resting, socializing, and raising their young in roosts. Roost conditions may affect the lifetime energy expenditure of bats, and this could, in turn, influence fitness of individuals. Different kinds of roosts impose different microclimatic conditions that can affect the thermal balances of bats that use them. Bats thermoregulate by using both physiological mechanisms (such as changes in conductance) and behavioral responses (huddling or active search of certain microclimates). We hypothesized that the contribution of these thermoregulatory strategies would differ depending on the roost type that bats use. To test this idea, we collated data from the literature on metabolic rate (MR), body temperature (Tb), ambient temperature at which MR and Tb were collected, roost type, and diet for 43 species of bats spanning eleven families. From these data, we calculated, for each species, the wet conductance and the area of the thermoregulatory polygon (TRP) as a proxy for the physiological thermoregulatory capabilities of bats. We found that, after controlling for phylogeny, wet conductance and the area of the TRP were higher in bats that use more exposed roosts than in those bats who use roosts that can buffer environmental conditions. Our results suggest that energy expenditure is similar for all species, but in bats that live in more exposed roosts, the contribution of physiological responses was more important than behavior at the entire range of environmental temperatures, whereas bats in more protected roosts seem to rely more on behavioral responses to thermoregulate. Considering that roosts represent valuable resources, the availability of roosts with the proper microclimatic conditions could determine the patterns of distribution of bat populations.
1. Introduction
To maintain relatively high body temperatures, mammals use a variety of strategies to adequately balance heat production with heat loss to the environment. Among the physiological processes that mammals put in motion to thermoregulate at low ambient temperatures are changes in conductance, insulation, shivering and non-shivering thermogenesis, and the use of torpor; at high ambient temperatures, mammals usually use hyperthermia and evaporative cooling [1]. Behavioral strategies that mammals use to thermoregulate include changes in posture and huddling [2]. Many species of mammals use roosts that provide appropriate microclimates that result in energy savings. Understanding the ability of endotherms to adjust or tolerate certain thermal microenvironments is important, since thermal biology can drive the range distribution of most species [3]. Bats represent an ideal group of mammals to explore these ideas, since they are the most diverse mammalian taxon, not only in number of species but also with respect to habitat distribution, feeding ecology, and roosting ecology.
Considering that bats spend an average of 15–20 h per day in roosts, selection of the proper microenvironment will impact the lifetime energy expenditure and fitness of individuals [4,5,6,7]. For example, exposed roost sites, such as bare tree branches, leave bats open to wind, precipitation, and solar radiation. In contrast, sheltered roosts can buffer outside climatic conditions, even at low insulation levels, although their availability is more limited [5,8,9]. Some sheltered roosts, such as caves, also introduce a level of structural complexity associated with a wide gradient of microclimatic conditions of light and temperature that can cause variation in the energetic costs of animals selecting specific sites within the roost [10,11,12,13,14]. In general, bats should occupy roosts with specific microclimatic conditions, alongside with adequate access to foraging sites and protection from predation, choices that will maximize the probability of survival and reproductive output, per unit of energy consumed [4,6,15].
Physiological thermoregulatory strategies. The relationship between metabolic rate (MR) and ambient temperature (Ta) in endotherms has been often represented by a curve divided into three regions [1,16]: the thermoneutral zone and the regions below the lower critical temperature and above the upper critical temperature. Below the lower critical temperature, the MR and Ta show an inverse linear relationship. The absolute value of the slope of this relationship represents wet conductance (C), estimated as MR/(Ta − Tb). In this model, when MR = 0, Ta equals body temperature (Tb). Above the upper critical temperature, the values of MR increase with Ta, although often not linearly. At these temperatures, bats can use hyperthermia to conserve energy and water, and they can ultimately use evaporation to dissipate heat. Across species of bats, body mass is the main factor that explains the variation observed in MR, although other ecological variables could explain the remainder of the residual variation of MR. An example is diet: insectivorous bats have a lower basal MR than frugivorous and nectarivorous bats for the same body mass [17]. In a study on diet and basal MR on 27 species of phyllostomids, this relationship was no longer significant after phylogenetic correction [18]. However, these analyses were restricted to phyllostomids and to values of MR within the thermoneutral zone, and we do not know if this result holds for all Chiropterans.
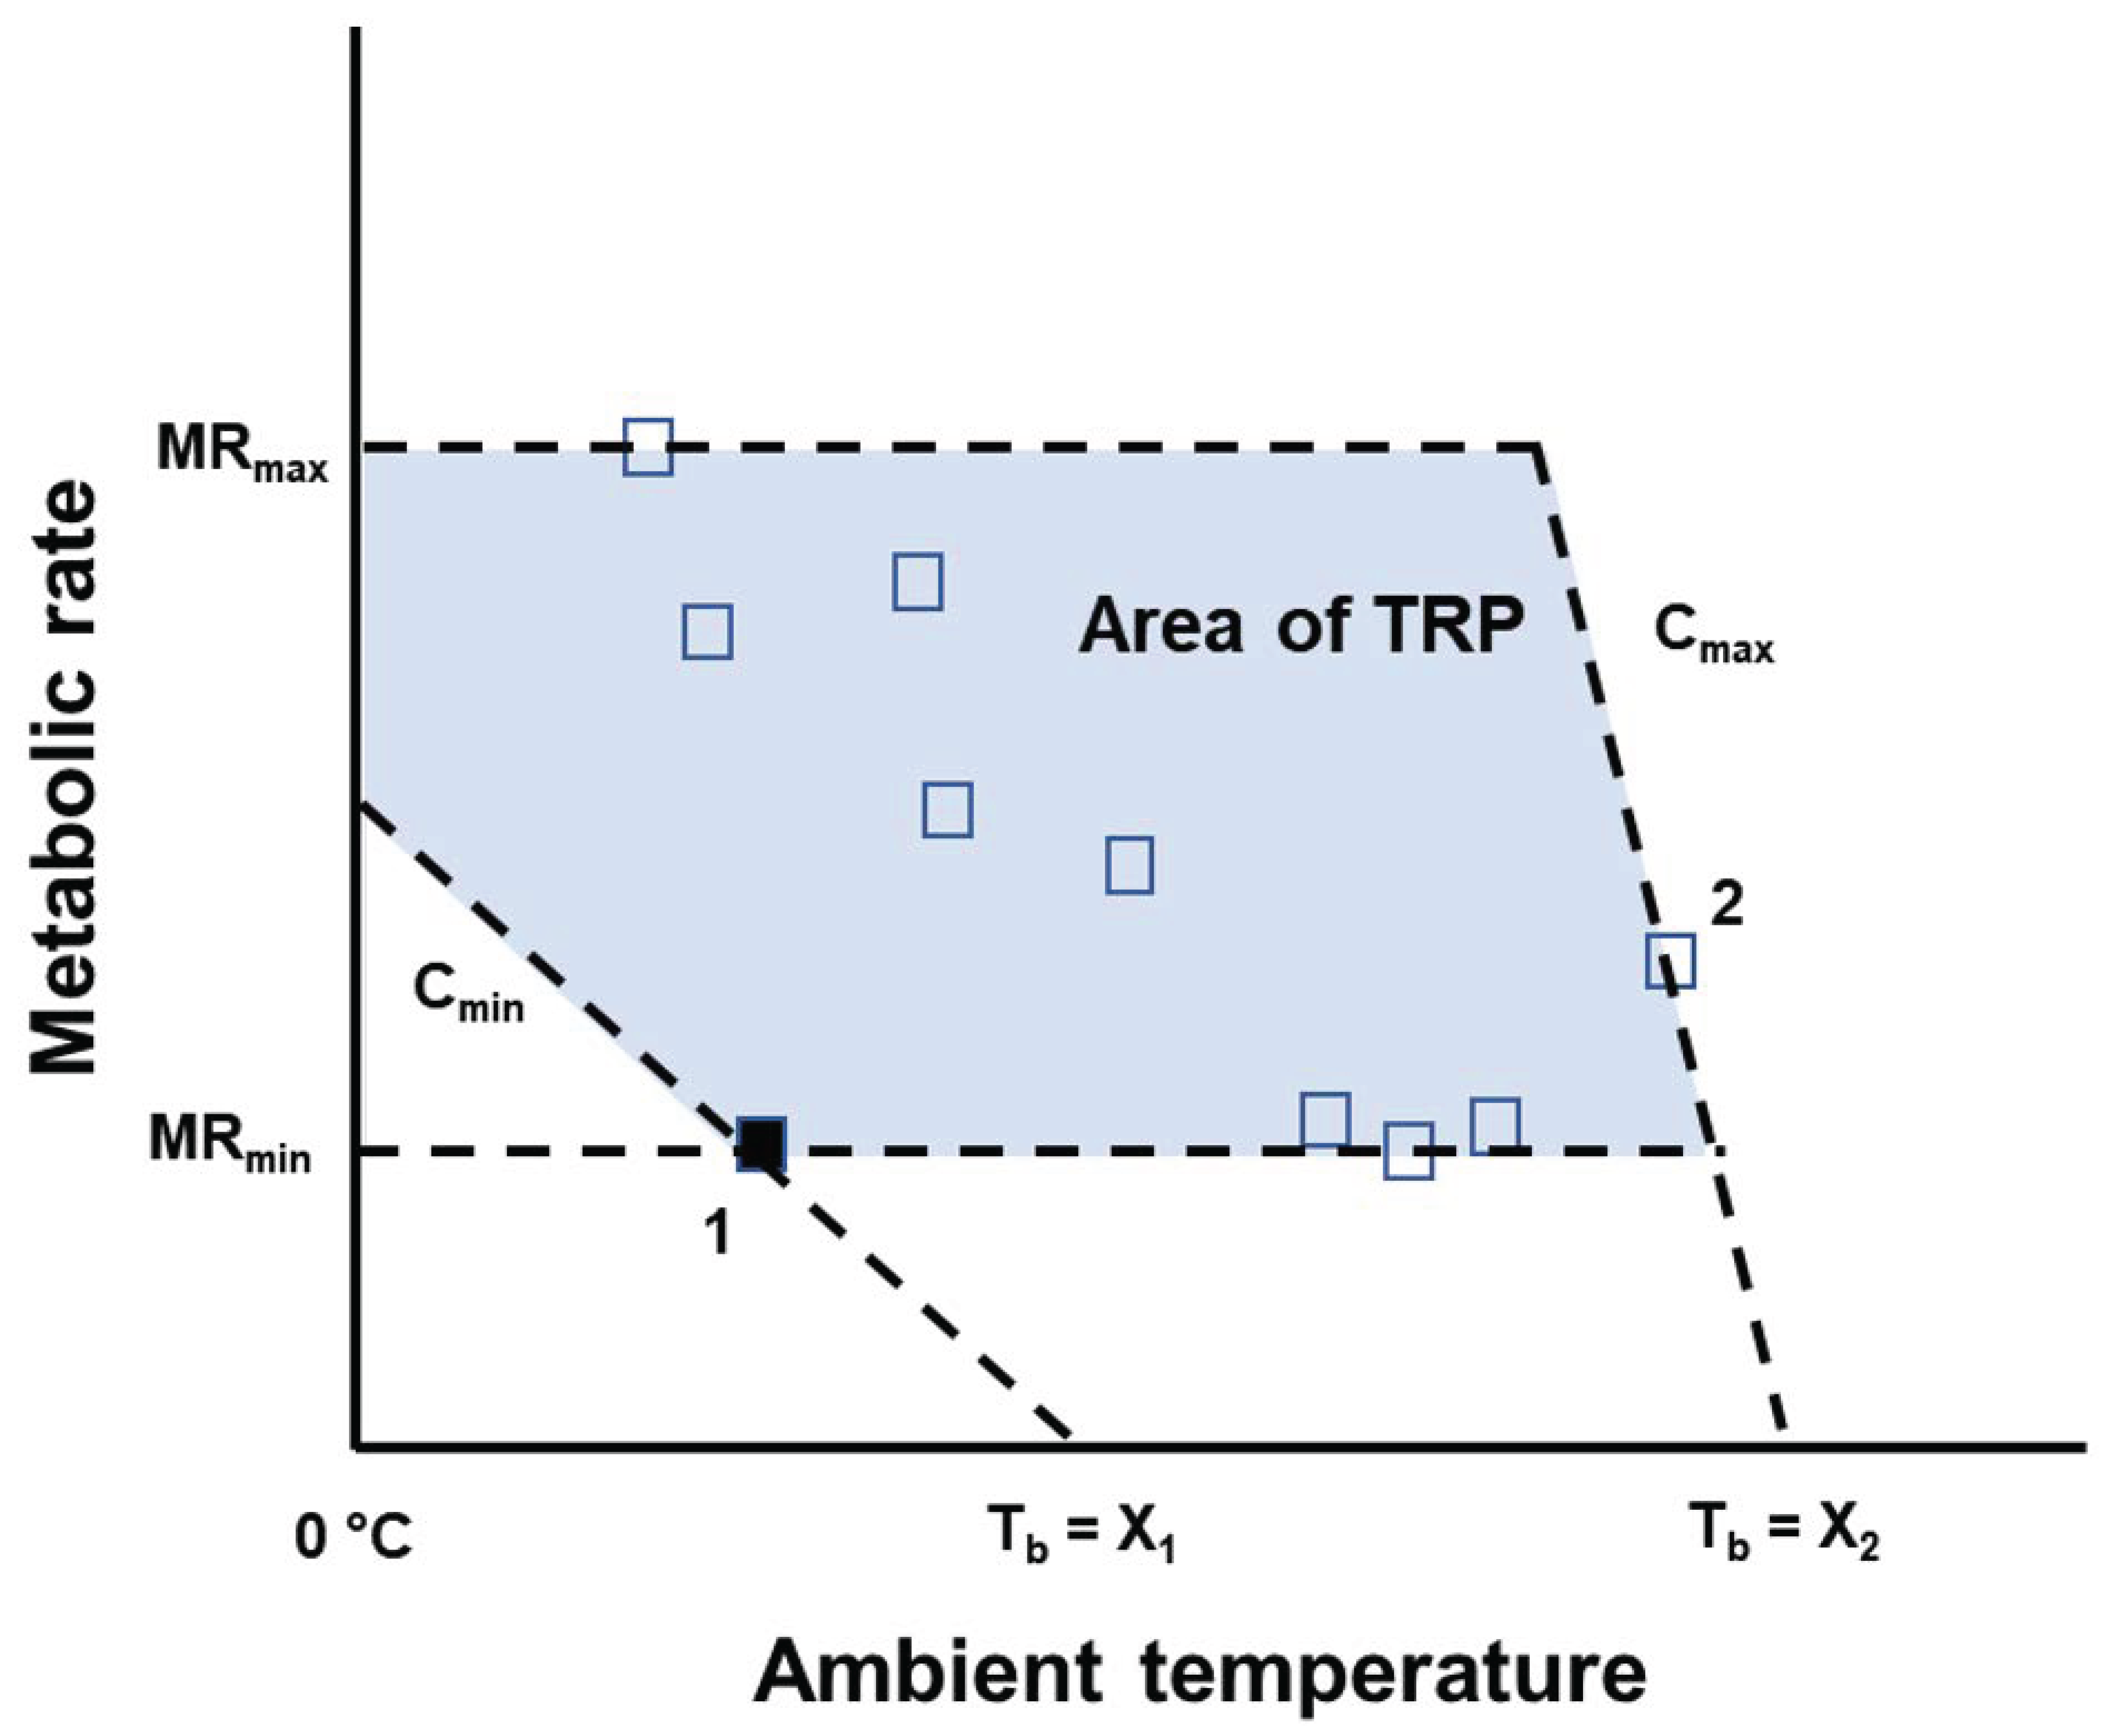
Wet conductance has been used as a proxy variable to study thermal balance of individuals [19]. In many studies, a single value for conductance is estimated as an average value across the range of Tas where the animals were measured. However, this estimate might not be biologically relevant, and, instead, conductance should be calculated for each value of MR taken at a given Ta through the whole range of Ta for which we have measurements of the MR [19]. With these data, we can build a thermoregulatory polygon (TRP) whose area represents the theoretical bivariate range (using Ta and metabolic rates, MRs) where thermal balance is possible [20]. The TRP, thus, constitutes a metric that integrates the thermal niche of the endotherm (Figure 1). Wet conductance can also vary with the thermal state of the individuals. Torpor, defined as a controlled, sustained reduction in Tb and MR, is used by bats during periods of low Ta or low resource availability [5,21,22,23,24]. Changes in conductance under different thermal states are captured in the TRPs (Figure 1). Thus, the generation of TRPs represents a useful tool to study the processes underlying the maintenance of thermal balances in bats, permitting comparisons across species.
The patterns of torpor use seem to differ with the microclimatic properties of the roost sites. For example, cold environments allow for easier transition into torpor [25], since they allow substantial decreases of Tb to almost match the temperature of the roost. Roosting in exposed roosts may impede entering torpor if temperatures are relatively high or force bats to enter torpor if temperatures are low [4]. However, exposed environments can facilitate rewarming from torpor [8,26]. In torpid bats, roosting in exposed sites may increase the frequency of periodic arousals if temperature fluctuations are numerous [8,26,27]. Sheltered roosts offer more thermal stability, which may reduce the number of arousals during long bouts of torpor [28,29], but rewarming costs might increase, resulting in the faster depletion of fat stores [5,30]. The body condition and reproductive state of the individual must also be considered. For example, bats with a high amount of energy reserves choose warmer microclimates during hibernation compared with bats with a lower proportion of fat [6].
Behavioral thermoregulatory strategies. Bats use huddling to avoid dehydration and to reduce energy expenditure during arousals, as well as when they are normothermic [23,31,32]. Huddling behavior might be impacted by the thermal stability of the environment. During hibernation, bat species that use sheltered roosts tend to form groups, whereas solitary bat species use exposed roosts [33]. In some locations, roosts in buildings might reach peak temperatures of more than 40 °C in the summer, and, as the temperature increases, individual bats move to cooler sites and spread out, putting more distance among themselves than when temperatures are lower [34]. Huddling can change the thermal characteristics of the roosts. For example, roost temperature in tents made by phyllostomid bats is around 2 °C higher than Ta when bats huddle [35].
In summary, bats use both physiological and behavioral mechanisms to thermoregulate, but the relative contribution of one strategy over the other seems to be related to the type of roost that bats select. We hypothesized that the type of roost would be associated with the use of different thermoregulatory strategies across bat species. To test our hypothesis, we collected data from the literature on energy expenditure and body temperature at different ambient temperatures for 43 bat species and estimated the conductance and the area of the TRP. We tested significant differences in these physiological variables of bats according to different roost types, while controlling for diet and phylogeny. We predicted that species that use more exposed roosts would rely more on physiological thermoregulation (for example, they will have a lower conductance and a smaller TRP area) than those species that use sheltered roosts.
2. Methods
2.1. Data Collection
We collected physiological and ecological data from the literature on a total of 43 species from eleven families of the Chiroptera. For each species, we collected body mass (g), body temperature (Tb, °C), metabolic rate (MR), and ambient temperature (Ta,°C), for which MR was measured, diet, and roost type. For each value of Ta for which we had data on Tb and MR, we calculated the wet conductance as MR/(Tb – Ta) (data provided in Supplementary Table S1). For this study, we included species for which we had physiological data over Tas ranging from at least 5 °C to 40 °C, with a few exceptions (see Supplementary Materials). For some species, we extracted values of Tb and MR from graphs, using the software PlotDigitizer (https://plotdigitizer.com/app (accessed on 28 September 2022)). We calculated conductance by using each data point provided in the papers; in some cases, each data point represented measurements taken for a single individual, whereas, in other cases, the values were averages of the physiological variable at a given Ta.
Roost type was assigned as the type reported in the source from which we collected MR data, or, when this information was not provided, we used the most widely used type for that species according to other sources of the literature (Supplementary Table S1). We divided types of roost into six categories. Observations in which bats used plant tents, tree bark, tree foliage, and leaf litter were included under “Tree foliage and bark”. The remaining categories were “Rock crevices”, “Tree cavities and hollow trees”, “Manmade structures” (consisting of manmade tunnels and bridges, but not including buildings), “Caves”, and “Buildings” (which are more enclosed shelters than the ones included under “Manmade structures”). These categories were then considered regarding the thermal stability they offer to bats based on the potential level of exposure to the elements. For example, we considered “Tree foliage and bark” to be more thermally unstable than “Buildings”. Studies that include data on MR and roost type did not provide actual microclimatic data of ambient temperature outside the roost.
We included diet in our analyses because McNab [17] reported a relationship between diet and MR in bats. We assigned species of bats into the following dietary categories, according to the source from which we collected MR data, or from the literature if this information was absent in the original source, based on the predominant dietary items reported: (1) carnivores, which include vertebrates in their diet; (2) frugivores, which include fruit, nectar, pollen, plants, or their combinations; (3) insectivores, which include arthropods as the main dietary item; (4) sanguinivores; and (5) omnivores.
2.2. Phylogenetic Affiliations
2.3. Statistical Analysis
To estimate ancestral states for our discrete variables (roost type and diet) at each node in the phylogenetic tree, we used the “Trace character history” module in Mesquite [44], selecting the most parsimonious model. To resolve ambiguities in the assignment of the character states, we chose the ancestral state with the highest maximum likelihood probability, computed using the ape and phytools packages in R [45].
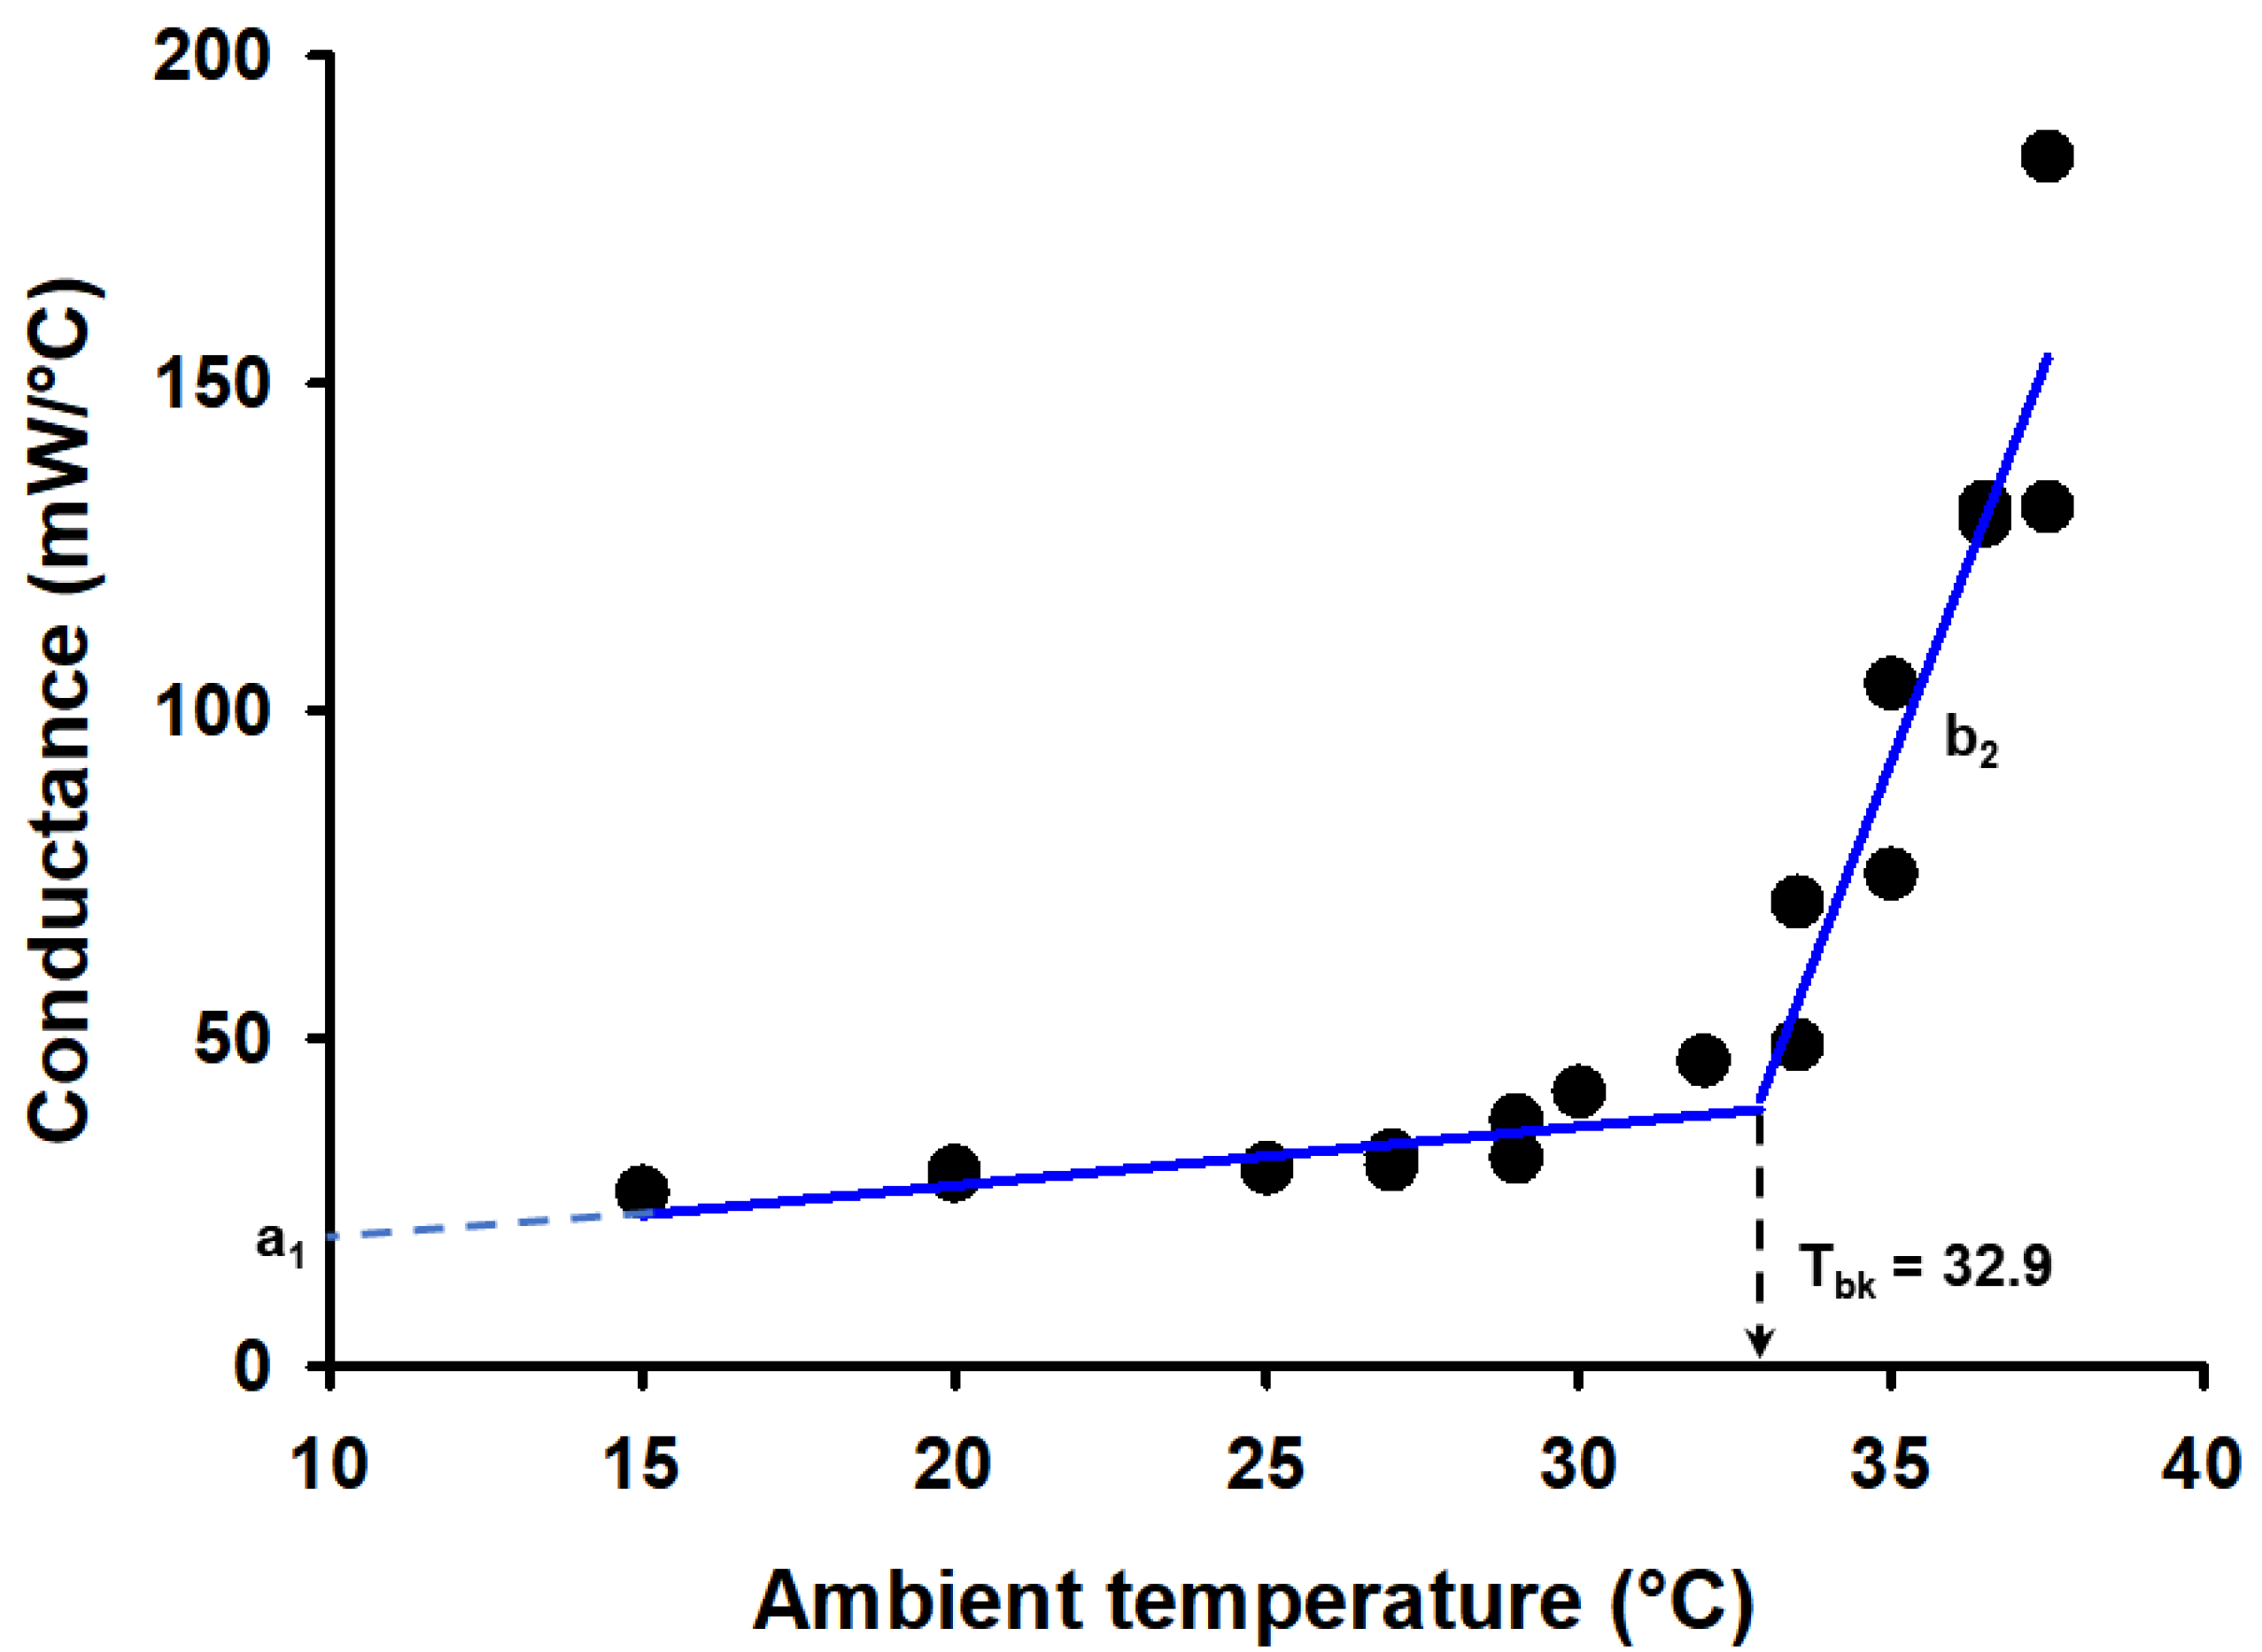
We used a segmented linear regression model (segmented package in R, [46]), with wet conductance (C) as our dependent variable and ambient temperature (Ta) as our independent variable. For each species, we estimated the breakpoint value for Ta, and the coefficients of both regression equations (see example for Otonycteris hemprichii in Figure 3). When the Ta was lower than the breakpoint temperature, the linear relationship between C and Ta was never significant; thus, the intercept of this relationship (a1) corresponds to the average value of C at that temperature range. However, when Ta was higher than the breakpoint temperature, that relationship was significant and linear. For each species of bat, we calculated the values of the breakpoint temperature, of the intercept a2, and the slope of the linear relationship when Ta is higher than the breakpoint temperature (b2). The slope b2 indicates how fast conductance increases at values of Ta higher than the breakpoint temperature (Figure 3).
We also estimated the area of the thermoregulatory polygon (TRP) for each species [20]. The limits of the polygon are the maximum and minimum MR, and the maximum and minimum conductance (Cmax and Cmin, respectively). The value for Ta at which the line for Cmin and the line for maximum MR intersected was often well below 0 °C. However, we do not have data for MR at this temperature range for any of the species of bats in our dataset, so, in those cases, we calculated the area of the TRP when Ta ≥ 0 (Figure 1).
We computed standardized phylogenetic independent contrasts (PICs) of our dependent variables (Cmin, Cmax, area of the TRP, breakpoint temperature, intercept a1, and slope b2) and of body mass, using the PDAP module in Mesquite [48] with the phylogenetic tree generated for all the species of bats (Figure 2). The absolute value of the standardized contrasts was not significantly correlated with the standard deviation of the corrected branch lengths in any variable, except for area of TRP, breakpoint temperature, and body mass. Thus, for these variables, we transformed the branch lengths in our tree (Grafen’s rho, with ρ = 0.5; [49] ).
One difficulty we faced while conducting our analyses was the small sample size of many of the categories for roost type and diet (Table 1). Out of 30 possible combinations, we had 19 represented in our dataset, but n ≤ 3 in 17 categories. We also found that the ancestral states for roost type and diet were often confounded in the phylogenetic tree. For example, out of seven nodes categorized as “Tree foliage and bark”, six were assigned as frugivores, and over 50% of the nodes assigned to “Caves” were categorized as insectivores. Moreover, the sample sizes for some factor levels were low (n < 3 in 11 of the 18 combinations from which we had data). Those problems prevented the analysis of the data by using two-way ANCOVA. Instead, we performed one-way ANCOVAs for the Cmin, Cmax, area of the TRP, breakpoint temperature, intercept a1, and slope b2, with “Roost” or “Diet” as factors, “Mass” as a covariate, and their interactions (degrees of freedom for diet categories: 41, 4; for roost type: 41, 5). To correct for phylogeny, we also performed phylogenetically informed one-way ANCOVAs of the PICs of the Cmin, Cmax, area of the TRP, breakpoint temperature, intercept a1, and slope b2, with either the ancestral states of “Roost” or “Diet” as factors, and PICs of “Mass” as a covariate, with their interactions (degrees of freedom for diet categories: 41, 3; for roost type: 41, 2). If the interaction terms were not significant, we removed them and ran the reduced model.
We used the coefficients of the regressions between body mass and our physiological variables to estimate the MR of three species of bats that do not appear in our dataset, in different scenarios of roost types and thermal states, as described in the original sources. We estimated the MR of Lasiurus borealis by using data for the Ta and the temperature in the roosts from [65]. L. borealis typically roosts below leaf litter when Ta < 10 °C, but in the tree canopies in warmer days. We estimated the energy expenditure of a euthermic (Tb = 36 °C) individual of L. borealis by using our coefficients for Cmin, with “Tree foliage and bark” as the roost type. Since we were using estimated values for Cmin, our result was the minimum MR at the considered temperature differential for that Tb, since we were at the lowest end of the TRP for that Tb. Jacobs et al. [9] studied the thermal balance of two similar sized species of bats, Scotophilus dinganii, which roosts on the exterior of buildings, and S. mhlanganii, which uses tree cavities. The authors continuously measured the Ta, Tb, and temperature in the roosts for a few days. The temperature of the roost for S. dinganii was very similar to the Ta, whereas the tree cavity used by S. mhalganii was approximately 5 °C warmer than the Ta for most of the day (Figure 1e,h in [9]). The values for the Ta ranged from 15.7 to 29.9 °C. Bats of both species entered torpor during the day and arose at different times, presumably to assess insect availability. We estimated the MR of euthermic and torpid bats of both species by using the relationship for Cmin with body mass and assuming “Tree cavities” to be the roost type. Calculations of the estimated total daily energy expenditure were made while considering that animals from both species are active only one hour per day.
All statistical tests were performed in R 4.0.2, Mesquite 3.61, and SigmaPlot 15.0, with significance assessed at α = 0.05.
3. Results
3.1. Phylogeny of Bats
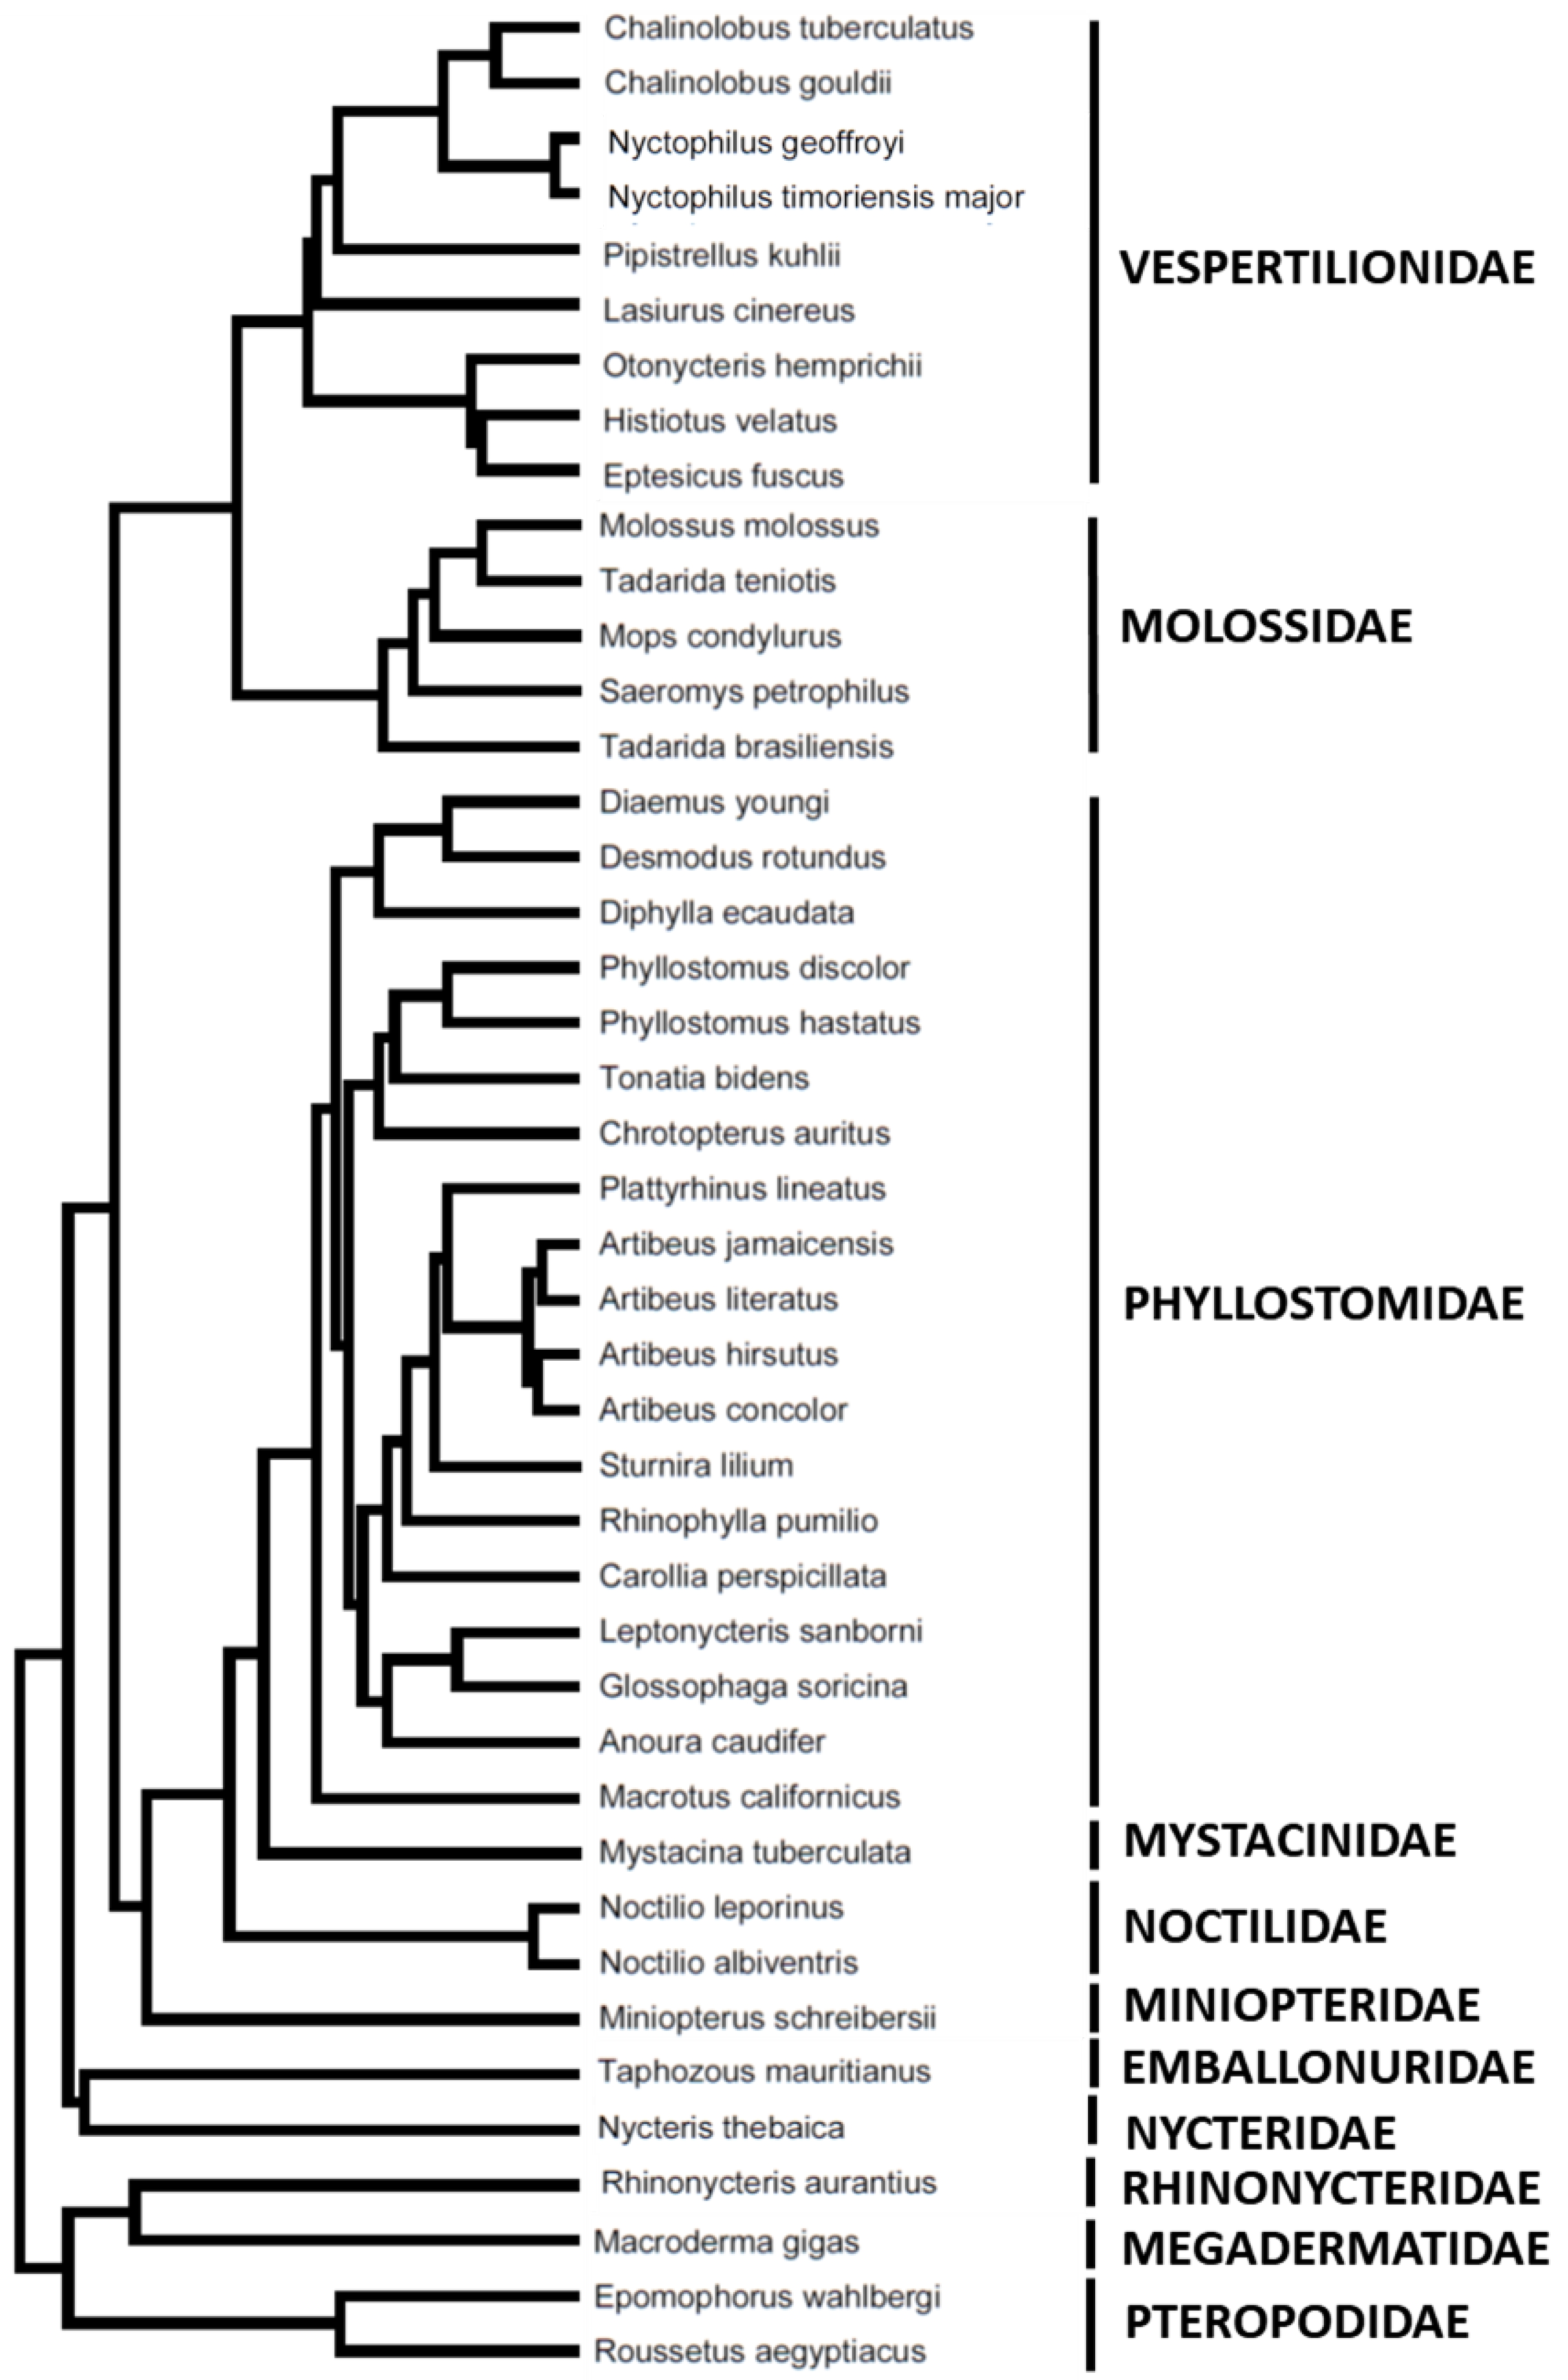
The basic topology of the different families represented in our dataset (except the Nycteridae and the Emballonuridae), as well as the divergence time at the basal node set to 58.9 MYA (million years ago), is based on [36] (see their Figure 3). Their phylogeny with 648 species of bats is based on the cytochrome b mitochondrial gene, which is a reliable phylogenetic marker, at least at the family level [66]. The Nycteridae were not included in Agnarsson et al., (2011). Their position as a sister clade of the Emballonuridae, as well as the estimate of the divergence time, was based on [41] and [67]. We used Table 1 in [42] to estimate the divergence time between the two species of Pteropodidae in our dataset (25 MYA). The topology and divergence times of the species of the Phyllostomidae were estimated using Figure 2 in [38] [38]. Because Phyllostomus discolor is absent in their tree, we estimated the divergence time between the two species of Phyllostomus in our dataset by using TimeTree [43].
For the Molossidae, we used the topology in Figure 3 in [68]. The authors present two phylogenies, and we chose to use the one based on the cytochrome b mitochondrial genes. The divergence time at the root node for this family was estimated as of 20.5 MYA from [36]. All the other divergence times in this family were estimated by calculating the proportion of the divergence times given in Table 2 in [68], with respect to 20.5 MYA. For the Vespertilionidae, we placed species by using the phylogenies of [36] and [39], with divergence times based on the latter. The placement of Otonycteris in our tree is based on [39], whereas the divergence time is based on [69], who report the presence of putative fossils in the late Miocene (hence our estimate of 11 MYA). The position of Eptesicus and Histiotus and that of Chalinolobus and Nyctophilus as sister genera is based on [70], whereas the divergence time between these pairs of taxa was estimated from TimeTree [43].
3.2. Ancestral States for Roost Type and Diet
When the ancestral state for roost type was “Buildings”, we changed it to “Caves” because the shortest divergence branch in our tree is 2 MYA, when no buildings were available for bats. After estimating ancestral states, only three roost types and four dietary categories remained (“Caves”, “Tree cavities and hollow trees”, and “Tree foliage and bark”; and frugivores, insectivores, omnivores, and sanguinivores, respectively; see Table 2).
3.3. The Effect of Roost Type on Physiological Variables
Overall, our results suggest that species which use exposed roosts seem to favor physiological strategies to thermoregulate, whereas those species which use more buffered roosts appear to rely predominantly on behavioral strategies to maintain their thermal balance. We did not find a significant effect of diet on any of the physiological variables we analyzed (Table 3).
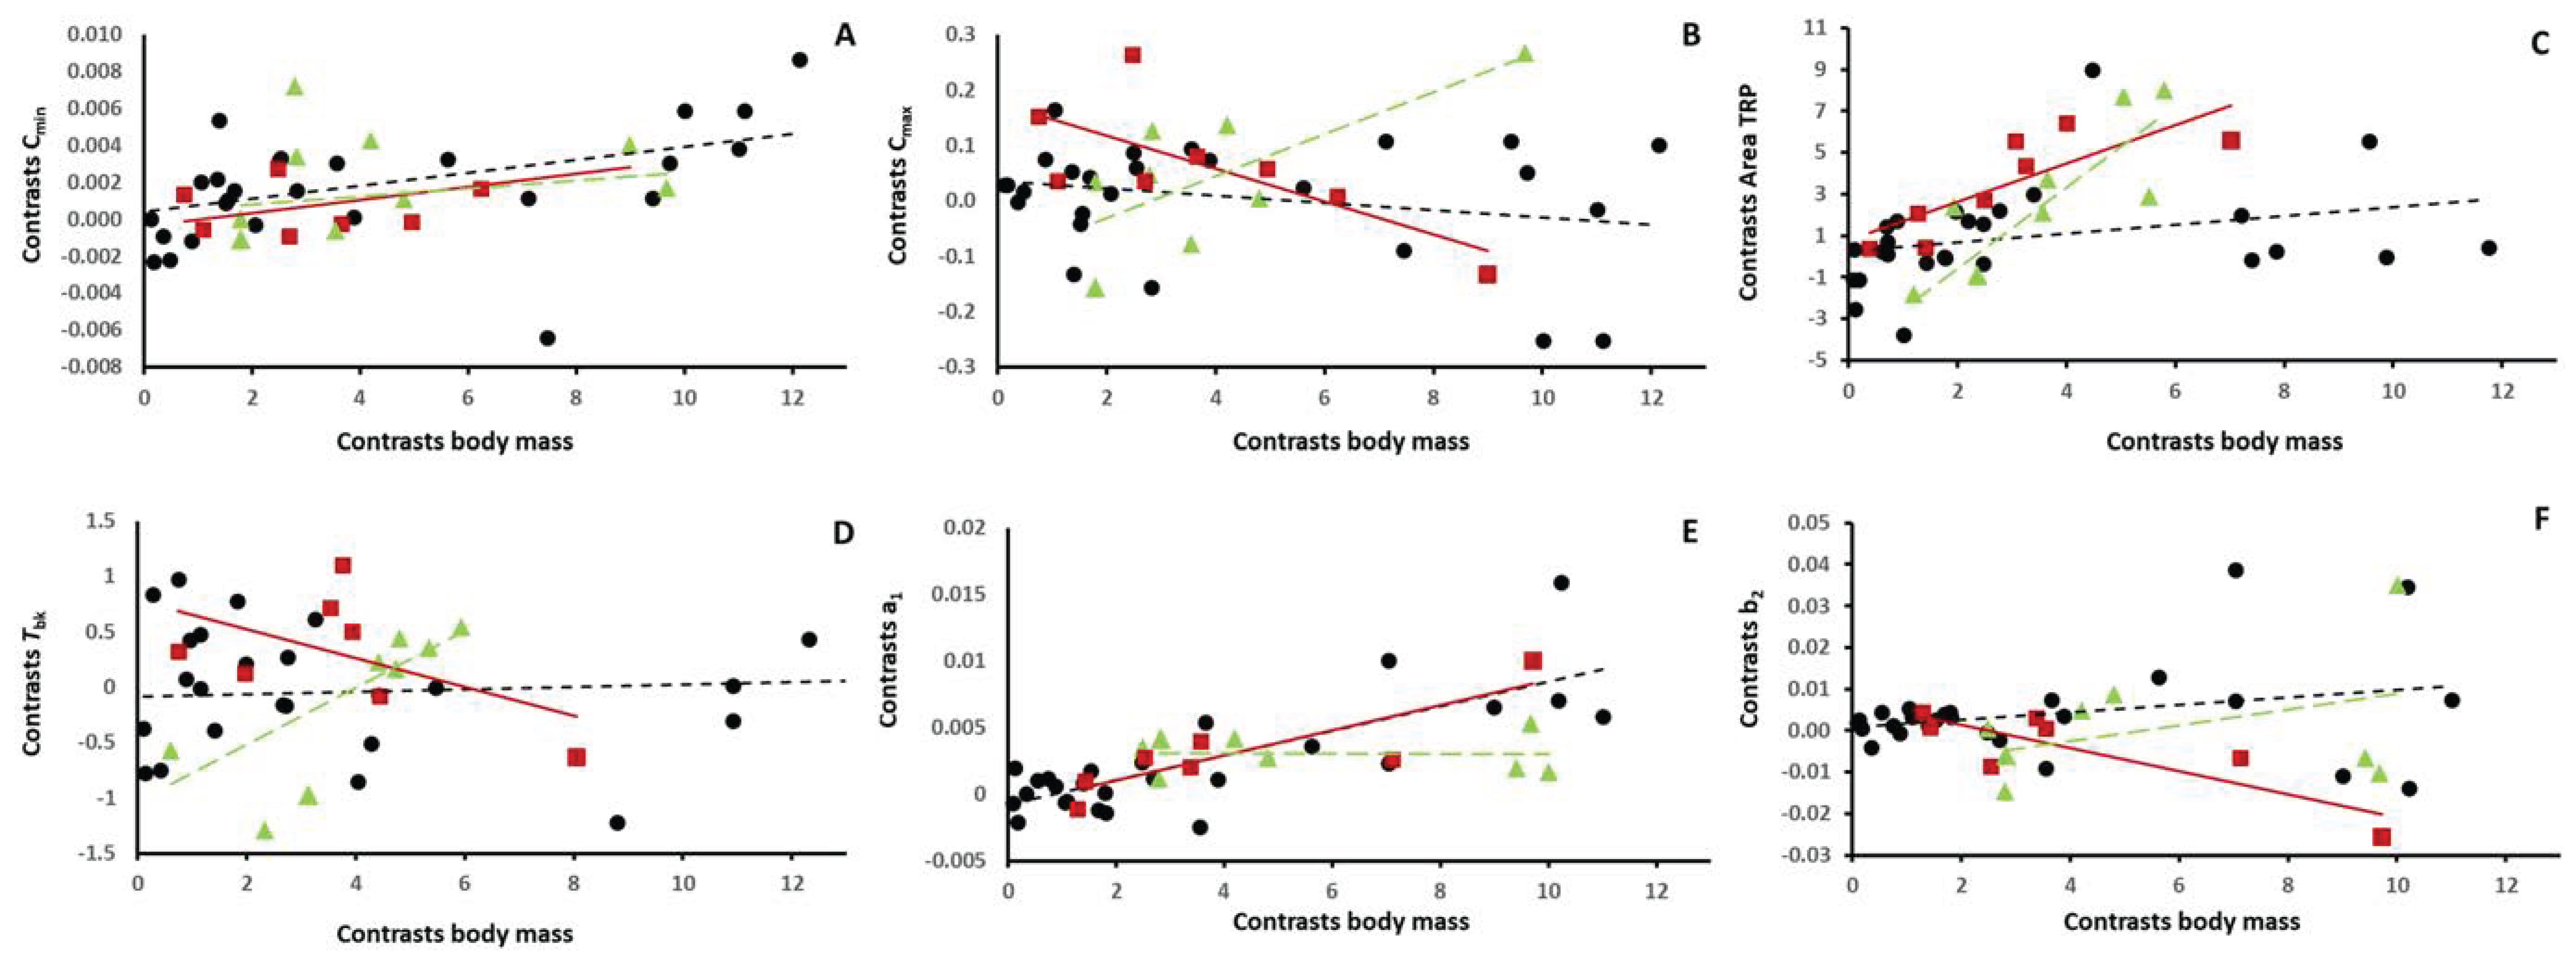
We found that roost type had a significant effect on Cmin and Cmax. The slope for “Caves” was larger than that of “Tree foliage and bark”, with “Tree cavities” showing an intermediate value (Figure 4, Table 3 and Supplementary Tables S1 and S2). These results indicate that Cmin and Cmax are higher in more buffered roosts than in exposed roosts. Thus, bats that use more exposed roosts show adjustments in wet conductance to minimize energy expenditure at low and high ambient temperatures.
The effect of roost type on a1 was not significant (Table 3). However, we found that bats that roost in exposed sites increase their conductance at a higher rate than those bats living in buffered roosts at high ambient temperatures, since there was a significant effect of roost type on b2 (Table 3). The slope for “Tree foliage and bark” was larger than that of “Tree cavities”, with “Caves” showing an intermediate value (Figure 4).
3.4. The Effect of Roost Type on the Area of the TRP
We found that the area of the TRP was larger in species that use more exposed roosts than in those species that use sheltered roosts, as indicated by the significant effect of roost type on the area of the TRP (Table 3). The slope for “Tree foliage and bark” and “Tree cavities” was larger than that of “Caves” and “Buildings” (Figure 4).
3.5. Estimates of Energy Expenditure of Species of Bats Using Different Roost Types
We estimated that normothermic Lasiurus borealis roosting under leaf litter will show an 8.3 % reduction in energy expenditure compared with individuals roosting in tree canopy (Table 4). In L. borealis, assuming a torpor Tb of 10 °C and the same environmental temperatures used above, bats in leaf litter will show a 34% reduction in MR compared with bats roosting in tree canopies, higher than the 8.3% reduction estimated when the bats were euthermic (Table 4).
4. Discussion
We found that the roost type has a significant impact on the maintenance of the thermal balance of bats, even after accounting for body mass, diet, and phylogeny. Bats that use more exposed roosts have a higher tolerance to environmental conditions and rely predominantly on the adjustment of physiological mechanisms to maintain their thermal balance, whereas, in bats that use more sheltered roosts, the incidence of physiological adjustments on thermal balance seems to be less important.
We think that the area of the TRP represents a useful integrative metric for the thermal niche of different species and allows for meaningful interspecific comparisons. Some physiological variables that we used in our analyses have relevance when ambient temperatures are low, for example, Cmin, whereas other variables can illuminate physiological processes that occur at high ambient temperatures, such as Cmax and b2. For example, taking Cmin alone, we would have inferred that bats that roost in exposed sites show a lower energy expenditure than species that roost in more sheltered sites, whereas the analysis of Cmax leads to the opposite conclusion. The area of the TRP is a composite variable and gives us a better, more general picture of the thermoregulatory effort that animals make at a wide range of environmental conditions of ambient temperature.
The reduction in energy expenditure at low ambient temperatures that we observed in bats that do use exposed roosts might be the result of physiological adaptations, such as an increase in insulation, since these bats cannot easily escape environmental conditions. Bats using roosts that provide some buffer to environmental conditions might then show behaviors conducive to choosing appropriate microclimates within the roost. With our approach, we can predict the temperature of the sites that a bat roosting in a cave should select to spend the same amount of energy when it does use an exposed roost at any given ambient temperature (Supplementary Figure S1). If no sites within the buffered roost are warm enough, the bat could alternatively enter torpor. Thus, the combination of strategies might be different for bats depending on the kind of roost.
Using our data, we can also estimate energetic costs resulting from different types of roosts in the same bat species. For example, we calculated the MR of L. borealis in two different roost types: leaf litter and tree canopies (Table 4). If the goal is to minimize energy expenditure, bats should always use leaf litter as a roost. However, it seems that L. borealis faces a trade-off between thermoregulatory costs when using tree canopies and predation risk while roosting on the ground [71]. The estimation of energy expenditure based on roost type that we propose here can, therefore, easily incorporate potential energetic costs derived from trade-offs emerging from different environmental scenarios that integrate physiological, behavioral, and ecological factors. To systematically evaluate these hypotheses, simultaneous data collection on environmental data from roosts and physiological data from the bats is needed, and few studies have been performed in this respect.
At low ambient temperature bats will enter torpor, and differences in energy expenditure in different roost types become even more apparent. In L. borealis, torpid bats that use more sheltered roosts show a much larger reduction in MR compared with those roosting in exposed sites (Table 4). S. dinganii and S. mhlanganii show roughly the same energetic costs when euthermic (Table 4). However, assuming no roost use for both species, the energy expenditure per day would be 14.5% higher in S. mhlanganii than in S. dinganii (Table 4). This supports the idea of the presence of physiological adaptations in bats that commonly use exposed roosts. We do not have data on the energy expenditure of individuals of the same species that use different kinds of roosts, but we predict that, in these species, the area of the TRP will be larger than in those species that use a specific kind of roost.
To cope with high ambient temperatures, bats use hyperthermia, but they eventually rely on total evaporative water loss to thermoregulate [59,60,72,73]. In this study, we measured b2, the slope of the regression between wet conductance and Ta above the breakpoint temperature, as a proxy of how fast wet conductance changes with a high Ta in each species of bat. We found that the slope b2 seems to be larger in bats that use more exposed roosts than in bats that use roosts that buffer environmental conditions better. This indicates that, in bats that use more exposed roosts, the changes in wet conductance are more accentuated at a high Ta than in bats that use more sheltered roosts. This might be a mechanism that permits these species of bats to dissipate more heat while conserving more water. In fact, bats that roost in exposed roosts have lower rates of TEWL (at low and high Ta values) than bats who use more sheltered roosts [73]. Again, these results are consistent with the idea that bats living in exposed roosts rely more on physiological mechanisms to thermoregulate than bats living in more buffered roosts.
Behavioral strategies such as huddling have been shown to have an impact on thermal balance in bats. For example, bats tend to roost in small groups or alone in hibernacula that have high temperature variation, whereas they hibernate in larger groups in roosts with more constant temperatures [32,74,75]. Rewarming from torpor is energetically costly [5,26,32]. Menzies et al. [27] found that thermally unstable roost types may be associated with higher rewarming rates to reduce metabolic costs of arousals. Passive rewarming by huddling together in thermally stable hibernacula has been reported to decrease energy expenditure during rewarming in bats [26,76,77]. These findings are again consistent with our hypothesis: bats that use sheltered roosts would rely mainly on behavior to decrease energy expenditure via social thermoregulation and active microclimate selection.
The selection of the appropriate microclimate in roosts has an impact on the energy expenditure of bats, and thus roost selection could be associated with the fitness of individuals [6,15,78]. Bats that must settle in more energetically expensive roosts due to high predation rates, competition, or low roost availability may incur extra energy costs and thus experience a decrease in fitness. For instance, bats using exposed roosts may face selection pressures to not enter torpor so often and reduce predation risks, or use cold roosts that would slow the development of prenatal and juvenile bats, negatively impacting the survival of young bats during the winter [79,80,81]. Lausen and Barckay [29] found that pregnant and lactating Eptesicus fuscus used warmer rock crevices and spent less time in torpor, whereas post-lactating females used cooler rock crevices as torpor use increased. Roosts with the adequate microenvironments might then be valuable resources for individual bats, which will then compete for them at the intra- and interspecific levels, with effects on population dynamics [82,83,84]. Thus, understanding the physiological, behavioral, and ecological aspects that result in roost selection in bats is relevant to predict responses of different species to landscape changes resulting from urbanization, climate change, deforestation, or desertification and make efficient and impactful policy decisions on wildlife and environmental management [85].
5. Conclusions
To thermoregulate, bats use both physiological mechanisms (changes in conductance, use of torpor, or evaporative cooling) and behavioral strategies (huddling). Selecting the proper microclimatic conditions in roosts, where bats spend most of their lives, might have a tremendous impact on energy expenditure in bats and thus affect the patterns of allocation and, ultimately, the fitness of individuals. We found that species that use more exposed roosts would rely more on physiological thermoregulation (for example, they will have a lower conductance and a smaller TRP area) than those species that use sheltered roosts. Overall, the energy expenditure of animals seems to be similar, but the contribution of the various physiological mechanisms and behavioral strategies that allow the maintenance of the thermal balance seems to be different according to the type of roost used.
Supplementary Materials
The following supporting information can be downloaded at https://0-www-mdpi-com.brum.beds.ac.uk/article/10.3390/d15050655/s1: Figure S1. Hypothetical relationship between metabolic rate and ambient temperature in two individual bats with the same body mass and the same body temperature. Table S1. Slopes of the relationship between physiological variables and body mass for the 43 species of bats used in this study, using conventional least squares regression. Table S2. Slopes of the relationship between physiological variables and body mass for the 43 species of bats used in this study, using phylogenetic independent contrasts.
Author Contributions
C.M. and T.G. collected the data; C.M. and A.M.-G. conceived of the idea and designed the methodology; C.M., T.G., and A.M.-G. analyzed data, wrote the manuscript, and gave final approval for publication. All authors have read and agreed to the published version of the manuscript.
Funding
This research received no external funding.
Institutional Review Board Statement
Not applicable.
Informed Consent Statement
Not applicable.
Data Availability Statement
The data presented in this study are available on request from the corresponding author and in the Supplementary Materials (https://0-www-mdpi-com.brum.beds.ac.uk/article/10.3390/d15050655/s1).
Acknowledgments
We thank Gerald Carter and Ian Hamilton for critically reading the manuscript and Carmi Korine for useful suggestions and support during the publication process. We also thank Eric Goolsby for advice on the use of the comparative method and the graduate students in the EEOB 8896.04 graduate seminar at OSU for feedback on early manuscript drafts.
Conflicts of Interest
The authors declare no conflict of interest.
References
- McNab, B.K. The Physiological Ecology of Vertebrates: A View from Energetics; Cornell University Press: Ithaca, NY, USA, 2002. [Google Scholar]
- Terrien, J.; Perret, M.; Aujard, F. Behavioral thermoregulation in mammals: A review. Front. Biosci. 2011, 16, 1428–1444. [Google Scholar] [CrossRef] [PubMed] [Green Version]
- Bozinovic, F.; Calosi, P.; Spicer, J.I. Physiological Correlates of Geographic Range in Animals. Annu. Rev. Ecol. Evol. Syst. 2011, 42, 155–179. [Google Scholar] [CrossRef] [Green Version]
- Kunz, T.H. Ecology of Bats; Plenum Press: New York, NY, USA; London, UK, 1982. [Google Scholar]
- Kunz, T.H.; Lumsden, L.F.; Fenton, M.B. (Eds.) Bat Ecology; University of Chicago Press: Chicago, IL, USA, 2003. [Google Scholar]
- Boyles, J.G.; Dunbar, M.B.; Storm, J.J.; Brack, V., Jr. Energy availability influences microclimate selection of hibernating bats. J. Exp. Biol. 2007, 210, 4345–4350. [Google Scholar] [CrossRef] [PubMed] [Green Version]
- Park, A.C.; Broders, H.G. Distribution and Roost Selection of Bats on Newfoundland. Northeast. Nat. 2012, 19, 165–176. [Google Scholar] [CrossRef]
- Turbill, C. Roosting and thermoregulatory behaviour of male Gould’s long-eared bats, Nyctophilus gouldi: Energetic benefits of thermally unstable tree roosts. Aust. J. Zool. 2006, 54, 57–60. [Google Scholar] [CrossRef]
- Jacobs, D.; Kelly, E.; Mason, M.; Stoffberg, S. Thermoregulation in two free-ranging subtropical insectivorous bat species: Scotophilus species (Vespertilionidae). Can. J. Zool. 2007, 85, 883–890. [Google Scholar] [CrossRef]
- Raesly, R.L.; Edward, J. Winter Habitat Selection by North Temperate Cave Bats. Am. Midl. Nat. 1987, 118, 15–31. [Google Scholar] [CrossRef]
- Palmer, C.; Woinarski, J.C.Z. Seasonal roosts and foraging movements of the black flying fox (Pteropus alecto) in the Northern Territory: Resource tracking in a landscape mosaic. Wildl. Res. 1999, 26, 823–838. [Google Scholar] [CrossRef]
- Brunet, A.K.; Medellín, R.A. The species-area relationship in bat assemblages of tropical caves. J. Mammal. 2001, 82, 1114–1122. [Google Scholar] [CrossRef]
- Vonhof, M.J.; Barclay, R.M.R. Roost-site selection and roosting ecology of forest-dwelling bats in southern British Columbia. Can. J. Zool. 1996, 74, 1797–1805. [Google Scholar] [CrossRef]
- Perry, R.W. A review of factors affecting cave climates for hibernating bats in temperate North America. Environ. Rev. 2013, 21, 28–39. [Google Scholar] [CrossRef]
- Humphries, M.M.; Thomas, D.W.; Kramer, D.L. The Role of Energy Availability in Mammalian Hibernation: A Cost-Benefit Approach. Physiol. Biochem. Zool. 2003, 76, 165–179. [Google Scholar] [CrossRef] [PubMed] [Green Version]
- Scholander, P.F.; Hock, R.; Walters, V.; Johnson, F.; Irving, L. Heat regulation in some arctic and tropical mammals and birds. Biol. Bull. 1950, 99, 237–258. [Google Scholar] [CrossRef] [PubMed]
- McNab, B.K. A Statistical Analysis of Mammalian Rates of Metabolism. Funct. Ecol. 1992, 6, 672. [Google Scholar] [CrossRef]
- Cruz-Neto, A.P.; Garland, T.; Abe, A.S. Diet, phylogeny, and basal metabolic rate in phyllostomid bats. Zoology 2001, 104, 49–58. [Google Scholar] [CrossRef] [Green Version]
- McNab, B.K. On Estimating Thermal Conductance in Endotherms. Physiol. Zool. 1980, 53, 145–156. [Google Scholar] [CrossRef]
- Rezende, E.L.; Bacigalupe, L.D. Thermoregulation in endotherms: Physiological principles and ecological consequences. J. Comp. Physiol. B 2015, 185, 709–727. [Google Scholar] [CrossRef]
- Geiser, F. The Role of Torpor in the Life of Australian Arid Zone. Aust. Mammal. 2004, 26, 125–134. [Google Scholar] [CrossRef]
- Wojciechowski, M.S.; Jefimow, M. Is Torpor Only an Advantage? Effect of Thermal Environment on Torpor Use in the Siberian Hamsters (Phodopus sungorus). Can. J. Zool. 2006, 57, 83–92. [Google Scholar]
- Pretzlaff, I.; Kerth, G.; Dausmann, K.H. Communally breeding bats use physiological and behavioural adjustments to optimise daily energy expenditure. Sci. Nat. 2010, 97, 353–363. [Google Scholar] [CrossRef] [Green Version]
- Ruf, T.; Geiser, F. Daily torpor and hibernation in birds and mammals. Biol. Rev. 2015, 90, 891–926. [Google Scholar] [CrossRef] [PubMed] [Green Version]
- Geiser, F. Reduction of metabolism during hibernation and daily torpor in mammals and birds: Temperature effect or physiological inhibition? J. Comp. Physiol. B 1988, 158, 25–37. [Google Scholar] [CrossRef] [PubMed]
- Geiser, F. Metabolic Rate and Body Temperature Reduction During Hibernation and Daily Torpor. Annu. Rev. Physiol. 2004, 66, 239–274. [Google Scholar] [CrossRef] [Green Version]
- Menzies, A.K.; Webber, Q.M.; Baloun, D.E.; McGuire, L.P.; Muise, K.A.; Coté, D.; Willis, C.K. Metabolic rate, latitude and thermal stability of roosts, but not phylogeny, affect rewarming rates of bats. Physiol. Behav. 2016, 164, 361–368. [Google Scholar] [CrossRef] [PubMed]
- Tyburec, J.; Chenger, J.; Snow, T.; Geiselman, C.; Member, B.B. BCI Bat Conservation and Management Workshop-Arizona; Bat Conservation International: Austin, TX, USA, 2011. [Google Scholar]
- Lausen, C.L.; Barclay, R.M.R. Thermoregulation and roost selection by reproductive female big brown bats (Eptesicus fuscus) roosting in rock crevices. J. Zool. 2003, 260, 235–244. [Google Scholar] [CrossRef]
- Willis, C.K.R.; Brigham, R.M.; Geiser, F. Deep, prolonged torpor by pregnant, free-ranging bats. Sci. Nat. 2006, 93, 80–83. [Google Scholar] [CrossRef]
- Chappell, M.A.; Roverud, R.C. Temperature effects on metabolism, ventilation, and oxygen extraction in a neotropical bat. Respir. Physiol. 1990, 81, 401–412. [Google Scholar] [CrossRef]
- Boyles, J.G.; Storm, J.J.; Brack, V., Jr. Thermal benefits of clustering during hibernation: A field test of competing hypotheses on Myotis sodalis. Funct. Ecol. 2008, 22, 632–636. [Google Scholar] [CrossRef]
- Willis, C.K.R.; Brigham, R.M. Social thermoregulation exerts more influence than microclimate on forest roost preferences by a cavity-dwelling bat. Behav. Ecol. Sociobiol. 2007, 62, 97–108. [Google Scholar] [CrossRef]
- Licht, P.; Leitner, P. Behavioral Responses to High Temperatures in Three Species of California Bats. J. Mammal. 1967, 48, 52–61. [Google Scholar] [CrossRef]
- Brooke, A.P. Tent selection, roosting ecology and social organization of the tent-making bat, Ectophylla alba. Costa Rica. J. Zool. 1990, 221, 11–19. [Google Scholar] [CrossRef]
- Agnarsson, I.; Zambrana-Torrelio, C.; Flores-Saldana, N.P.; May-Collado, L.J. A time-calibrated species-level phylogeny of bats (Chiroptera, Mammalia). PLoS Curr. 2011, 3, RRN1212. [Google Scholar] [CrossRef]
- Almeida, F.C.; Giannini, N.P.; Simmons, N.B.; Helgen, K.M. Each flying fox on its own branch: A phylogenetic tree for Pteropus and related genera (Chiroptera: Pteropodidae). Mol. Phylogenetics Evol. 2014, 77, 83–95. [Google Scholar] [CrossRef] [PubMed]
- Flores-Abreu, I.; Trejo-Salazar, R.; Sánchez-Reyes, L.; Good, S.; Magallón, S.; García-Mendoza, A.; Eguiarte, L. Tempo and mode in coevolution of Agave sensu lato (Agavoideae, Asparagaceae) and its bat pollinators, Glossophaginae (Phyllostomidae). Mol. Phylogenetics Evol. 2019, 133, 176–188. [Google Scholar] [CrossRef]
- Lack, J.B.; Bussche, R.A.V.D. Identifying the confounding factors in resolving phylogenetic relationships in Vespertilionidae. J. Mammal. 2010, 91, 1435–1448. [Google Scholar] [CrossRef]
- Jones, K.E.; Purvis, A.; Maclarnon, A.; Bininda-Emonds, O.R.P.; Simmons, N.B. A phylogenetics supertree of the bats. pdf. Biol. Rev. 2002, 77, 223–259. [Google Scholar] [CrossRef] [PubMed] [Green Version]
- Jones, K.E.; Bininda-Emonds, O.R.P.; Gittleman, J.L. Bats, clocks and rocks: Diversification patterns in Chiroptera. Evolution 2005, 59, 2243–2255. [Google Scholar] [CrossRef]
- Hassanin, A.; Bonillo, C.; Tshikung, D.; Shongo, C.P.; Pourrut, X.; Kadjo, B.; Nakouné, E.; Tu, V.T.; Prié, V.; Goodman, S.M. Phylogeny of African fruit bats (Chiroptera, Pteropodidae) based on complete mitochondrial genomes. J. Zool. Syst. Evol. Res. 2020, 58, 1395–1410. [Google Scholar] [CrossRef]
- Kumar, S.; Stecher, G.; Suleski, M.; Hedges, S.B. TimeTree: A Resource for Timelines, Timetrees, and Divergence Times. Mol. Biol. Evol. 2017, 34, 1812–1819. [Google Scholar] [CrossRef]
- Maddison, W.P.; Maddison, D.R. A Modular System for Evolutionary Analysis. Version 3.4. 2018.
- Revell, L.J. Phytools: An R package for phylogenetic comparative biology (and other things). Methods Ecol. Evol. 2012, 3, 217–223. [Google Scholar] [CrossRef]
- Muggeo, V.M.; Muggeo, M.V.M. Package “Segmented”. Biometrika 2017, 58, 516. [Google Scholar]
- Marom, S.; Korine, C.; Wojciechowski, M.S.; Tracy, C.R.; Pinshow, B. Energy Metabolism and Evaporative Water Loss in the European Free-Tailed Bat and Hemprich’s Long-Eared Bat (Microchiroptera): Species Sympatric in the Negev Desert. Physiol. Biochem. Zool. 2006, 79, 944–956. [Google Scholar] [CrossRef] [PubMed] [Green Version]
- Midford, P.E. PDAP, Phenotypic Diversity Analysis Program. 2010. [Google Scholar]
- Grafen, A.; Vickerman, K. The phylogenetic regression. Philos. Trans. R Soc. Lond. B Biol. Sci. 1989, 326, 119–157. [Google Scholar] [CrossRef] [PubMed]
- McNab, B.K. The economics of temperature regulation in neotropical bats. Comp. Biochem. Physiol. 1969, 31, 227–268. [Google Scholar] [CrossRef] [PubMed]
- Carpenter, R.E.; Graham, J.B. Physiological responses to temperature in the longnosed bat, Leptonycteris sanborni. Comp. Biochem. Physiol. 1967, 22, 709–722. [Google Scholar] [CrossRef] [PubMed]
- Hosken, D.J.; Withers, P.C. Temperature regulation and metabolism of an Australian bat, Chalinolobus gouldii (Chiroptera: Vespertilionidae) when euthermic and torpid. J. Comp. Physiol. B 1997, 167, 71–80. [Google Scholar] [CrossRef]
- McNab, B.K.; O’Donnell, C. The behavioral energetics of New Zealand’s bats: Daily torpor and hibernation, a continuum. Comp. Biochem. Physiol. Part. A Mol. Integr. Physiol. 2018, 223, 18–22. [Google Scholar] [CrossRef]
- Minnaar, I.A.; Bennett, N.C.; Chimimba, C.T.; McKechnie, A.E. Summit Metabolism and Metabolic Expansibility in Wahlberg’s Epauletted Fruit Bats (Epomophorus wahlbergi): Seasonal Acclimatisation and Effects of Captivity. J. Exp. Biol. 2014, 217, 1363–1369. [Google Scholar] [CrossRef] [Green Version]
- Herreid, C.F.; Schmidt-Nielsen, K. Oxygen consumption, temperature, and water loss in bats from different environments. Am. J. Physiol. Leg. Content 1966, 211, 1108–1112. [Google Scholar] [CrossRef]
- Cryan, P.M.; Wolf, B.O. Sex differences in the thermoregulation and evaporative water loss of a heterothermic bat, Lasiurus cinereus, during its spring migration. J. Exp. Biol. 2003, 206, 3381–3390. [Google Scholar] [CrossRef] [Green Version]
- Baudinette, R.V.; Churchill, S.K.; Christian, K.A.; Nelson, J.E.; Hudson, P.J. Energy, water balance and the roost microenvi-ronment in three Australian cave-dwelling bats (Microchiroptera). J. Comp. Physiol. B 2000, 170, 439–446. [Google Scholar] [CrossRef]
- Bell, G.P.; Bartholomew, G.A.; Nagy, K.A. The roles of energetics, water economy, foraging behavior, and geothermal refugia in the distribution of the bat, Macrotus californicus. J. Comp. Physiol. B 1986, 156, 441–450. [Google Scholar] [CrossRef]
- Maloney, S.K.; Bronner, G.N.; Buffenstein, R. Thermoregulation in the Angolan Free-Tailed Bat Mops condylurus: A Small Mammal That Uses Hot Roosts. Physiol. Biochem. Zool. 1999, 72, 385–396. [Google Scholar] [CrossRef] [PubMed]
- Toussaint, D.C.; McKechnie, A.E. Interspecific variation in thermoregulation among three sympatric bats inhabiting a hot, semi-arid environment. J. Comp. Physiol. B 2012, 182, 1129–1140. [Google Scholar] [CrossRef] [PubMed] [Green Version]
- Hosken, D.J.; Withers, P.C. Metabolic Physiology of Euthermic and Torpid Lesser Long-Eared Bats, Nyctophilus geoffroyi (Chiroptera: Vespertilionidae). J. Mammal. 1999, 80, 42–52. [Google Scholar] [CrossRef] [Green Version]
- Hosken, D.J. Thermal Biology and Metabolism of the Greater Long-eared Bat, Nyctophilus major (Chirop-tera: Vespertilionidae). Aust. J. Zool. 1997, 45, 145–156. [Google Scholar] [CrossRef]
- Muñoz-Garcia, A.; Larraín, P.; Ben-Hamo, M.; Cruz-Neto, A.; Williams, J.B.; Pinshow, B.; Korine, C. Metabolic rate, evapora-tive water loss and thermoregulatory state in four species of bats in the Negev desert. Comp. Biochem. Physiol. Part A Mol. Integr. Physiol. 2016, 191, 156–165. [Google Scholar] [CrossRef] [Green Version]
- Korine, C.; Arad, Z. Effect of Water Restriction on Temperature Regulation of the Fruit Bat Rousettus aegyptiacus. J. Comp. Phys. 1993, 163, 401–405. [Google Scholar] [CrossRef]
- Perry, R.W. Potential energy expenditure by litter-roosting bats associated with temperature under leaf litter during winter. J. Therm. Biol. 2013, 38, 467–473. [Google Scholar] [CrossRef]
- Tobe, S.S.; Kitchener, A.C.; Linacre, A.M.T. Reconstructing Mammalian Phylogenies: A Detailed Comparison of the Cyto-chrome b and Cytochrome Oxidase Subunit I Mitochondrial Genes. PLoS ONE 2010, 5, e14156. [Google Scholar] [CrossRef] [Green Version]
- Teeling, E.C.; Springer, M.S.; Madsen, O.; Bates, P.; O’Brien, S.J.; Murphy, W.J. A Molecular Phylogeny for Bats Illuminates Biogeography and the Fossil Record. Science 2005, 307, 580–584. [Google Scholar] [CrossRef] [PubMed]
- Lamb, J.M.; Ralph, T.M.C.; Naidoo, T.; Taylor, P.J.; Ratrimomanarivo, F.; Stanley, W.T.; Goodman, S.M. Toward a Molecular Phylogeny for the Molossidae (Chiroptera) of the Afro-Malagasy Region. Acta Chiropterol. 2011, 13, 1–16. [Google Scholar] [CrossRef]
- Gharaibeh, B.M.; Qumsiyeh, M.B. Otonycteris hemprichii. Mamm. Species 1995, 514, 1–4. [Google Scholar] [CrossRef]
- Hoofer, S.R.; Van Den Bussche, R.A.; Horáček, I. Generic status of the American pipistrelles (vespertilionidae) with description of a new genus. J. Mammal. 2006, 87, 981–992. [Google Scholar] [CrossRef] [Green Version]
- Flinn, J. Winter Roosting Behavior of Red Bats (Lasiurus borealis): Habitat Use, Microclimate, and Effects of Ambient Temperature on Roost Choice. Master’s Thesis, Michigan State University, Lansing, MI, USA, 2009. [Google Scholar]
- Bronrier, G.N.; Maloney, S.K.; Buffenstein, R. Survival tactics within thermally-challenging roosts: Heat tolerance and cold sensitivity in the Angolan free-tailed bat, Mops condylurus. S. Afr. J. Zool. 1999, 34, 1–10. [Google Scholar] [CrossRef]
- Muñoz-Garcia, A.; Oelbaum, P.; Korine, C. Stress Physiology, Foraging, and Ecophysiology of Bats in Urban Environments. In What Makes an Urban Bat? Bat Biology, Ecology, and Interactions with Humans in Urban Environments; Moretto, L., Fenton, M.B., Patriquin, K., Coleman, J., Korine, C., Davy, C., Eds.; Springer: Berlin/Heidelberg, Germany, 2022. [Google Scholar]
- Boyles, J.G.; Robbins, L.W. Characteristics of Summer and Winter Roost Trees Used by Evening Bats (Nycticeius humeralis) in Southwestern Missouri. Am. Midl. Nat. 2006, 155, 210–220. [Google Scholar] [CrossRef]
- Mormann, B.M.; Robbins, L.W. Winter Roosting Ecology of Eastern Red Bats in Southwest Missouri. J. Wildl. Manag. 2007, 71, 213–217. [Google Scholar] [CrossRef]
- Geiser, F.; Brigham, R.M. The Other Functions of Torpor. In Living in a Seasonal World; Ruf, T., Bieber, C., Arnold, W., Millesi, E., Eds.; Springer: Berlin/Heidelberg, Gernany, 2012; pp. 109–121. [Google Scholar]
- McKechnie, A.E.; Wolf, B.O. Solar radiation and the energetic cost of rewarming from torpor. In Life in the Cold: Evolution, Mechanisms, Adaptation and Application. In Proceedings of the 12th International Hibernation Symposium, Vancouver, BC, USA, 25 July–1 August 2004; pp. 63–70. [Google Scholar]
- Sedgeley, J.A. Quality of cavity microclimate as a factor influencing selection of maternity roosts by a tree-dwelling bat, Chalinolobus tuberculatus, in New Zealand. J. Appl. Ecol. 2001, 38, 425–438. [Google Scholar] [CrossRef]
- Racey, P.A.; Swift, S.M. Variations in gestation length in a colony of pipistrelle bats (Pipistrellus pipistrellus) from year to year. Reproduction 1981, 61, 123–129. [Google Scholar] [CrossRef] [Green Version]
- Wilde, C.J.; Knight, C.H.; Racey, P.A. Influence of torpor on milk protein composition and secretion in lactating bats. J. Exp. Zool. 1999, 284, 35–41. [Google Scholar] [CrossRef]
- Thomas, D.W.; Dorais, M.; Bergeron, J.-M. Winter Energy Budgets and Cost of Arousals for Hibernating Little Brown Bats, Myotis lucifugus. J. Mammal. 1990, 71, 475–479. [Google Scholar] [CrossRef]
- Brosset, A.; Charles-Dominique, P.; Cockle, A.; Cosson, J.-F.; Masson, D. Bat communities and deforestation in French Guiana. Can. J. Zool. 1996, 74, 1974–1982. [Google Scholar] [CrossRef]
- Law, B.; Anderson, J.; Chidel, M. Bat communities in a fragmented forest landscape on the south-west slopes of New South Wales, Australia. Biol. Conserv. 1999, 88, 333–345. [Google Scholar] [CrossRef]
- Jaberg, C.; Guisan, A. Modelling the distribution of bats in relation to landscape structure in a temperate mountain environment. J. Appl. Ecol. 2001, 38, 1169–1181. [Google Scholar] [CrossRef]
- Korine, C.; Pinshow, B. Guild Structure, Foraging Space Use, and Distribution in a Community of Insectivorous Bats in the Negev Desert. J. Zool. 2004, 262, 187–196. [Google Scholar] [CrossRef]
Figure 1.
Representation of a thermoregulatory polygon (TRP), using a hypothetical dataset. Data points are measurements of metabolic rates at different ambient temperatures (unfilled squares for measurements when the animal is normothermic; filled square for a measurement when the animal is in torpor). For each measurement, conductance can be calculated, assuming that, when ambient temperature equals body temperature, metabolic rate is zero. Measurement 1 gives the minimum value for conductance (Cmin), whereas Measurement 2 gives the maximum value for conductance (Cmax). The limits of the TRP are determined by the maximum and minimum value of metabolic rate (MRmax and MRmin, respectively) and Cmin and Cmax. We did not use the area of the TRP at values of ambient temperature below 0 °C in our analyses, because that was the minimum ambient temperature from which we have physiological data in our dataset.

Figure 2.
Phylogenetic tree for the 43 species of Chiroptera used in this study.

Figure 3.
The relationship between wet conductance and ambient temperature (Ta) in Otonycteris hemprichii (data in [47]) Below the breakpoint temperature (Tbk), conductance was relatively constant. We calculated the intercept of the relationship between conductance and Ta below the breakpoint (a1) for each species of bat (blue line). At temperatures above the Tbk, conductance increased linearly with Ta (blue line). We estimated the slope of the relationship between conductance and Ta above the breakpoint (b2) for each species of bat.

Figure 4.
The relationship between phylogenetically independent contrasts of body mass and phylogenetically independent contrasts of our physiological variables for the different categories of roost type and diet, using 43 species of bats, in our study. Black-filled circles and black dashed lines = “Caves”; red solid squares and red solid lines = “Tree cavities and hollow trees”; green solid triangles and green dashed lines = “Tree foliage and bark”. (A) Contrasts of mass against contrasts of minimum conductance, Cmin; (B) contrasts of mass against contrasts of maximum conductance, Cmax; (C) contrasts of mass against contrasts of the area of the thermoregulatory polygon (TRP); (D) contrasts of mass against contrasts of the breakpoint temperature, Tbk, see Figure 3; (E) contrasts of mass against contrasts of the intercept of the relationship between conductance and ambient temperature below the breakpoint (a1); and (F) contrasts of mass against contrasts of the slope of the relationship between conductance and ambient temperature above the breakpoint (b2).


Table 1.
Physiological data for the 43 species of bats used in this study. Cmin = minimum conductance; Cmax = maximum conductance; TRP = thermoregulatory polygon; Tbk = breakpoint temperature; a1 = intercept of the regression line between metabolic rate and ambient temperature below Tbk; b2 = slope of the regression line between metabolic rate and ambient temperature above Tbk; TFB = “Tree foliage and bark”; TCHTs = “Tree cavities and hollow trees”; MMSs = “Manmade structures”; RCs = “Rock crevices. References”: 1 [50] 2 [51] 3 [52] 4 [53] 5 [54] 6 [55] 7 [56] 8 [57] 9 [58] 10 [59] 11 [60] 12 [61] 13 [62] 14 [47] 15 [63] 16 [64].
| Species | Roost Type | Diet | Mass (g) | Cmin | Cmax | TRP Area | Tbk | a1 | b2 |
|---|---|---|---|---|---|---|---|---|---|
| Anoura caudifer 1 | Buildings | Omnivorous | 11.5 | 0.0160 | 0.1330 | 17.174 | 24.5 | 0.0156 | 0.0073 |
| Artibeus concolor 1 | TFB | Frugivorous | 19.7 | 0.0230 | 0.2460 | 15.919 | 27.5 | 0.0281 | 0.0142 |
| Artibeus hirsutum 2 | Caves | Frugivorous | 48.0 | 0.0396 | 1.0009 | 30.836 | 29.4 | 0.0328 | 0.1137 |
| Artibeus jamaicensis 1 | TFB | Frugivorous | 45.2 | 0.0340 | 0.9300 | 37.418 | 29.5 | 0.0409 | 0.0477 |
| Artibeus literatus 1 | TFB | Frugivorous | 70.1 | 0.0370 | 0.9410 | 75.401 | 31.8 | 0.0462 | 0.0303 |
| Carollia perspicillata 1 | Caves | Frugivorous | 14.9 | 0.0250 | 0.4080 | 29.078 | 31.0 | 0.0254 | 0.0186 |
| Chalinolobus gouldii 3 | TCHT | Insectivorous | 17.5 | 0.0191 | 0.0278 | 6.844 | 29.7 | 0.0076 | 0.0401 |
| Chalinolobus tuberculatus 4 | TCHT | Insectivorous | 9.0 | 0.0050 | 0.0380 | 5.656 | - | - | - |
| Chrotopterus auritus 1 | Caves | Carnivorous | 96.1 | 0.0510 | 0.3490 | 58.196 | 26.0 | 0.0678 | 0.0106 |
| Desmodus rotundus 1 | Caves | Sanguinivorous | 29.4 | 0.0010 | 0.1670 | 40.996 | 28.6 | 0.0307 | 0.0068 |
| Diaemus youngi 1 | TCHT | Sanguinivorous | 36.6 | 0.0290 | 1.0230 | 13.821 | 28.5 | 0.0351 | 0.0133 |
| Diphylla ecaudata 1 | Caves | Sanguinivorous | 27.8 | 0.0220 | 0.1620 | 22.413 | 28.1 | 0.0293 | 0.0137 |
| Epomophorus wahlbergi 5 | MMS | Frugivorous | 84.1 | 0.0372 | 2.7400 | 29.580 | 32.7 | 0.0575 | 0.4765 |
| Eptesicus fuscus 6 | MMS | Insectivorous | 10.4 | 0.0174 | 0.3259 | 29.443 | 33.8 | 0.0245 | 0.0596 |
| Glossophaga soricina 1 | Caves | Omnivorous | 9.6 | 0.0170 | 1.3910 | 19.016 | 29.5 | 0.0165 | 0.0160 |
| Histiotus velatus 1 | Buildings | Insectivorous | 11.2 | 0.0070 | 0.3890 | 12.690 | 29.1 | 0.0151 | 0.0617 |
| Lasiurus cinereus 7 | TFB | Insectivorous | 32.5 | 0.0025 | 0.3268 | 51.308 | 33.0 | 0.0252 | 0.0380 |
| Leptonycteris sanborni 2 | Caves | Frugivorous | 22.0 | 0.0308 | 0.1223 | 18.959 | 30.8 | 0.0284 | 0.0138 |
| Macroderma gigas 8 | MMS | Carnivorous | 107.2 | 0.0613 | 0.8543 | 32.419 | 34.3 | 0.0392 | 0.1327 |
| Macrotus californicus 9 | Caves | Insectivorous | 11.7 | 0.0233 | 0.0641 | 11.742 | 30.0 | 0.0233 | 0.0068 |
| Miniopterus schreibersii 8 | Buildings | Insectivorous | 10.9 | 0.0311 | 0.3669 | 14.150 | 33.9 | 0.0217 | 0.0570 |
| Molossus molossus 1 | Buildings | Insectivorous | 15.6 | 0.0240 | 0.2090 | 11.296 | 32.0 | 0.0157 | 0.0159 |
| Mops condylurus 10 | Buildings | Insectivorous | 23.2 | 0.0234 | 0.1871 | 23.780 | 33.6 | 0.0180 | 0.0197 |
| Mystacina tuberculata 4 | TCHT | Omnivorous | 13.5 | 0.0020 | 0.2720 | 9.431 | 25.9 | 0.0102 | 0.0809 |
| Noctilio albiventris 1 | MMS | Insectivorous | 39.9 | 0.0490 | 0.7770 | 38.578 | 27.5 | 0.0474 | 0.0512 |
| Noctilio leporinus 1 | MMS | Carnivorous | 61.0 | 0.0065 | 1.2290 | 80.950 | 30.2 | 0.0552 | 0.0321 |
| Nycteris thebaica 11 | TCHT | Insectivorous | 11.7 | 0.0088 | 0.0513 | 13.131 | 31.6 | 0.0123 | 0.0047 |
| Nyctophilus geoffroyi 12 | TFB | Insectivorous | 8.0 | 0.0027 | 0.1941 | 14.309 | 29.4 | 0.0123 | 0.0313 |
| Nyctophilus timoriensis 13 | TFB | Insectivorous | 13.6 | 0.0171 | 0.0406 | 5.947 | 24.2 | 0.0147 | 0.0023 |
| Otonycteris hemprichii 14 | RC | Insectivorous | 25.4 | 0.0098 | 0.1846 | 19.080 | 32.9 | 0.0096 | 0.0233 |
| Phyllostomus discolor 1 | TCHT | Omnivorous | 33.5 | 0.0280 | 1.3950 | 48.069 | 34.7 | 0.0137 | 0.1655 |
| Phyllostomus hastatus 1 | TCHT | Omnivorous | 84.2 | 0.0440 | 0.6980 | 88.235 | 30.7 | 0.0658 | 0.0313 |
| Pipistrellus kuhlii 15 | Buildings | Insectivorous | 6.9 | 0.0007 | 0.0359 | 10.593 | 25.0 | 0.0141 | 0.0058 |
| Plattyrhinus lineatus 1 | TFB | Omnivorous | 21.9 | 0.0280 | 0.1090 | 15.594 | 28.3 | 0.0235 | 0.0091 |
| Rhinonycteris aurantius 8 | Caves | Insectivorous | 8.3 | 0.0216 | 0.2385 | 8.616 | 34.2 | 0.0170 | 0.0629 |
| Rhinophylla pumilio 1 | TFB | Frugivorous | 9.5 | 0.0040 | 0.5580 | 18.690 | 29.5 | 0.0032 | 0.0180 |
| Roussetus aegyptiacus 16 | Buildings | Frugivorous | 150.8 | 0.1362 | 2.1028 | 28.257 | 32.5 | 0.1698 | 0.3783 |
| Sauromys petrophilus 11 | RC | Insectivorous | 11.0 | 0.0076 | 0.0842 | 3.969 | 39.2 | 0.0062 | 0.0255 |
| Sturnira lilium 1 | TCHT | Frugivorous | 21.9 | 0.0150 | 1.2320 | 36.367 | 34.2 | 0.0114 | 0.0617 |
| Tadarida brasiliensis 6 | Buildings | Insectivorous | 10.4 | 0.0207 | 0.0512 | 3.309 | 30.0 | 0.0246 | 0.0049 |
| Tadarida teniotis 14 | RC | Insectivorous | 32.0 | 0.0229 | 0.5977 | 21.634 | 31.0 | 0.0398 | 0.0489 |
| Taphozous mauritianus 11 | Buildings | Insectivorous | 26.2 | 0.0153 | 2.7478 | 17.542 | 32.5 | 0.0221 | 0.0115 |
| Tonatia bidens 1 | Caves | Carnivorous | 27.4 | 0.0178 | 1.1390 | 4.863 | 32.7 | 0.0196 | 0.0268 |
Table 2.
Sample sizes for the different categories of roosts and diets for the 43 species of bats used in this study. In parenthesis, sample sizes for the 42 nodes from phylogenetic independent contrasts assigned to the ancestral states for roost type and diet. MMSs = “Manmade structures”; RCs = “Rock crevices”; TCHTs = “Tree cavities and hollow trees”; TFB = “Tree foliage and bark”.
| Buildings | Caves | MMSs | RCs | TCHTs | TFB | All | |
|---|---|---|---|---|---|---|---|
| Frugivorous | 1 | 3 (2) | 1 | 1 | 4 (6) | 10 (8) | |
| Omnivorous | 1 | 1 (8) | 3 (2) | 1 | 6 (10) | ||
| Insectivorous | 7 | 2 (15) | 2 | 3 | 3 (6) | 3 (1) | 20 (22) |
| Carnivorous | 2 | 2 | 4 | ||||
| Sanguinivorous | 2 (2) | 1 | 3 | ||||
| All | 9 | 10 (27) | 5 | 3 | 8 (8) | 8 (7) | 43 (42) |
Table 3.
The p-values from ANCOVAs based on conventional least square regressions (CLSR ANCOVAs) and based on phylogenetic independent contrasts (PICs). Values in bold are significant at α < 0.05. In parenthesis, p-values for ANCOVAs in which outliers were removed. INT = interaction term. * Outliers for the analysis of b2: root node for the genus Artibeus.
| CLSR | PICs | |||||||
|---|---|---|---|---|---|---|---|---|
| Mass | Roost Type | Diet | INT | Mass | Roost Type | Diet | INT | |
| Cmin | <0.001 | - | 0.004 | 0.006 | 0.53 | 0.026 | ||
| <0.001 | 0.33 | 0.46 | 0.015 | 0.71 | 0.40 | |||
| Cmax | 0.002 | 0.79 | 0.78 | 0.17 | - | 0.038 | ||
| 0.005 | 0.62 | 0.088 | 0.25 | 0.22 | 0.29 | |||
| Area of TRP | <0.001 | - | <0.001 | 0.037 | - | 0.005 | ||
| <0.001 | - | 0.004 | 0.028 | 0.18 | 0.43 | |||
| Tbk | 0.58 | 0.23 | 0.088 | 0.63 | 0.44 | 0.088 | ||
| 0.34 | 0.37 | 0.87 | 0.77 | 0.90 | 0.22 | |||
| a1 | <0.001 | - | <0.001 | <0.001 | 0.52 | 0.061 | ||
| <0.001 | - | 0.032 | <0.001 | 0.99 | 0.98 | |||
| b2 | <0.001 | 0.56 | 0.10 | 0.33 | 0.23 | 0.055(0.014) * | ||
| <0.001 | 0.082 | 0.051 | 0.30 | 0.66 | 0.17 | |||
Table 4.
Estimated energy expenditure in three species of bats, using different kinds of roosts. Troost = temperature in the roost; Tb = body temperature; MR = metabolic rate; TEE = total energy expenditure per day. For Lasiurus borealis, we assumed that the temperature in the tree canopy would be the same as Ta (0 °C), whereas the temperature measured at 8 cm below leaf litter was 3.9 °C [65]. For both species of Scotophilus, we assumed Ta = 25 °C when the animals are euthermic [9]. According to the authors, the euthermic Tb of S. dinganii is approximately 33 °C, whereas, for S. mhlanganii, the euthermic Tb is approximately 33 °C. Bats will enter torpor at Ta of approximately 20 °C, with minimum Tb of 18.5 °C for both species. The duration of torpor bouts was 15 h for S. dinganii and 17 h for S. mhlanganii. Since these bats spend only one hour per day active, to calculate TEE, we assumed that S. dinganii and S. mhlanganii spent 15 and 17 h in torpor and 8 and 6 h euthermic, respectively, during the day. We also considered the scenario in which the euthermic Tb values were equal for both species at 36 °C and bats did not use any roost.
| Species | Body Mass (g) | Roost Type | Troost (°C) | Tb (°C) | Estimated MR (mW) | Estimated TEE (kJ) |
|---|---|---|---|---|---|---|
| Lasiurus borealis | 10 | Tree canopy | 0 | 36 | 358.1 | |
| 0 | 10 | 92.1 | ||||
| Leaf litter | 3.9 | 36 | 328.4 | |||
| 3.9 | 10 | 62.4 | ||||
| Scotophilus dinganii | 25.3 | Exterior building | 25 | 33 | 246.2 | |
| 20 | 18.5 | 76.8 | 3.12 | |||
| No roost | 25 | 36/18.5 | 3.49 | |||
| Scotophilus mhlanganii | 28.4 | Tree cavities | 25 | 36 | 314.5 | |
| 20 | 18.5 | 68.6 | 3.06 | |||
| No roost | 25 | 36/18.5 | 3.99 |
Disclaimer/Publisher’s Note: The statements, opinions and data contained in all publications are solely those of the individual author(s) and contributor(s) and not of MDPI and/or the editor(s). MDPI and/or the editor(s) disclaim responsibility for any injury to people or property resulting from any ideas, methods, instructions or products referred to in the content. |
© 2023 by the authors. Licensee MDPI, Basel, Switzerland. This article is an open access article distributed under the terms and conditions of the Creative Commons Attribution (CC BY) license (https://creativecommons.org/licenses/by/4.0/).
Share and Cite
MDPI and ACS Style
Marroquin, C.; Gerth, T.; Muñoz-Garcia, A. The Influence of Roost Type and Diet on Energy Expenditure in Bats. Diversity 2023, 15, 655. https://0-doi-org.brum.beds.ac.uk/10.3390/d15050655
AMA Style
Marroquin C, Gerth T, Muñoz-Garcia A. The Influence of Roost Type and Diet on Energy Expenditure in Bats. Diversity. 2023; 15(5):655. https://0-doi-org.brum.beds.ac.uk/10.3390/d15050655
Chicago/Turabian StyleMarroquin, Cynthia, Thomas Gerth, and Agustí Muñoz-Garcia. 2023. "The Influence of Roost Type and Diet on Energy Expenditure in Bats" Diversity 15, no. 5: 655. https://0-doi-org.brum.beds.ac.uk/10.3390/d15050655
Note that from the first issue of 2016, this journal uses article numbers instead of page numbers. See further details here.