
Farm Silage Facilities and Their Management for the Prevention of Anaerobic Bacteria Spore Contamination in Raw Milk

 , , ,
, , ,
Abstract
:1. Introduction
2. Materials and Methods
2.1. Farm Characteristics
2.2. Sample Collection, Preparation, and Microbiological Analyses
2.3. Statistical Analysis
3. Results
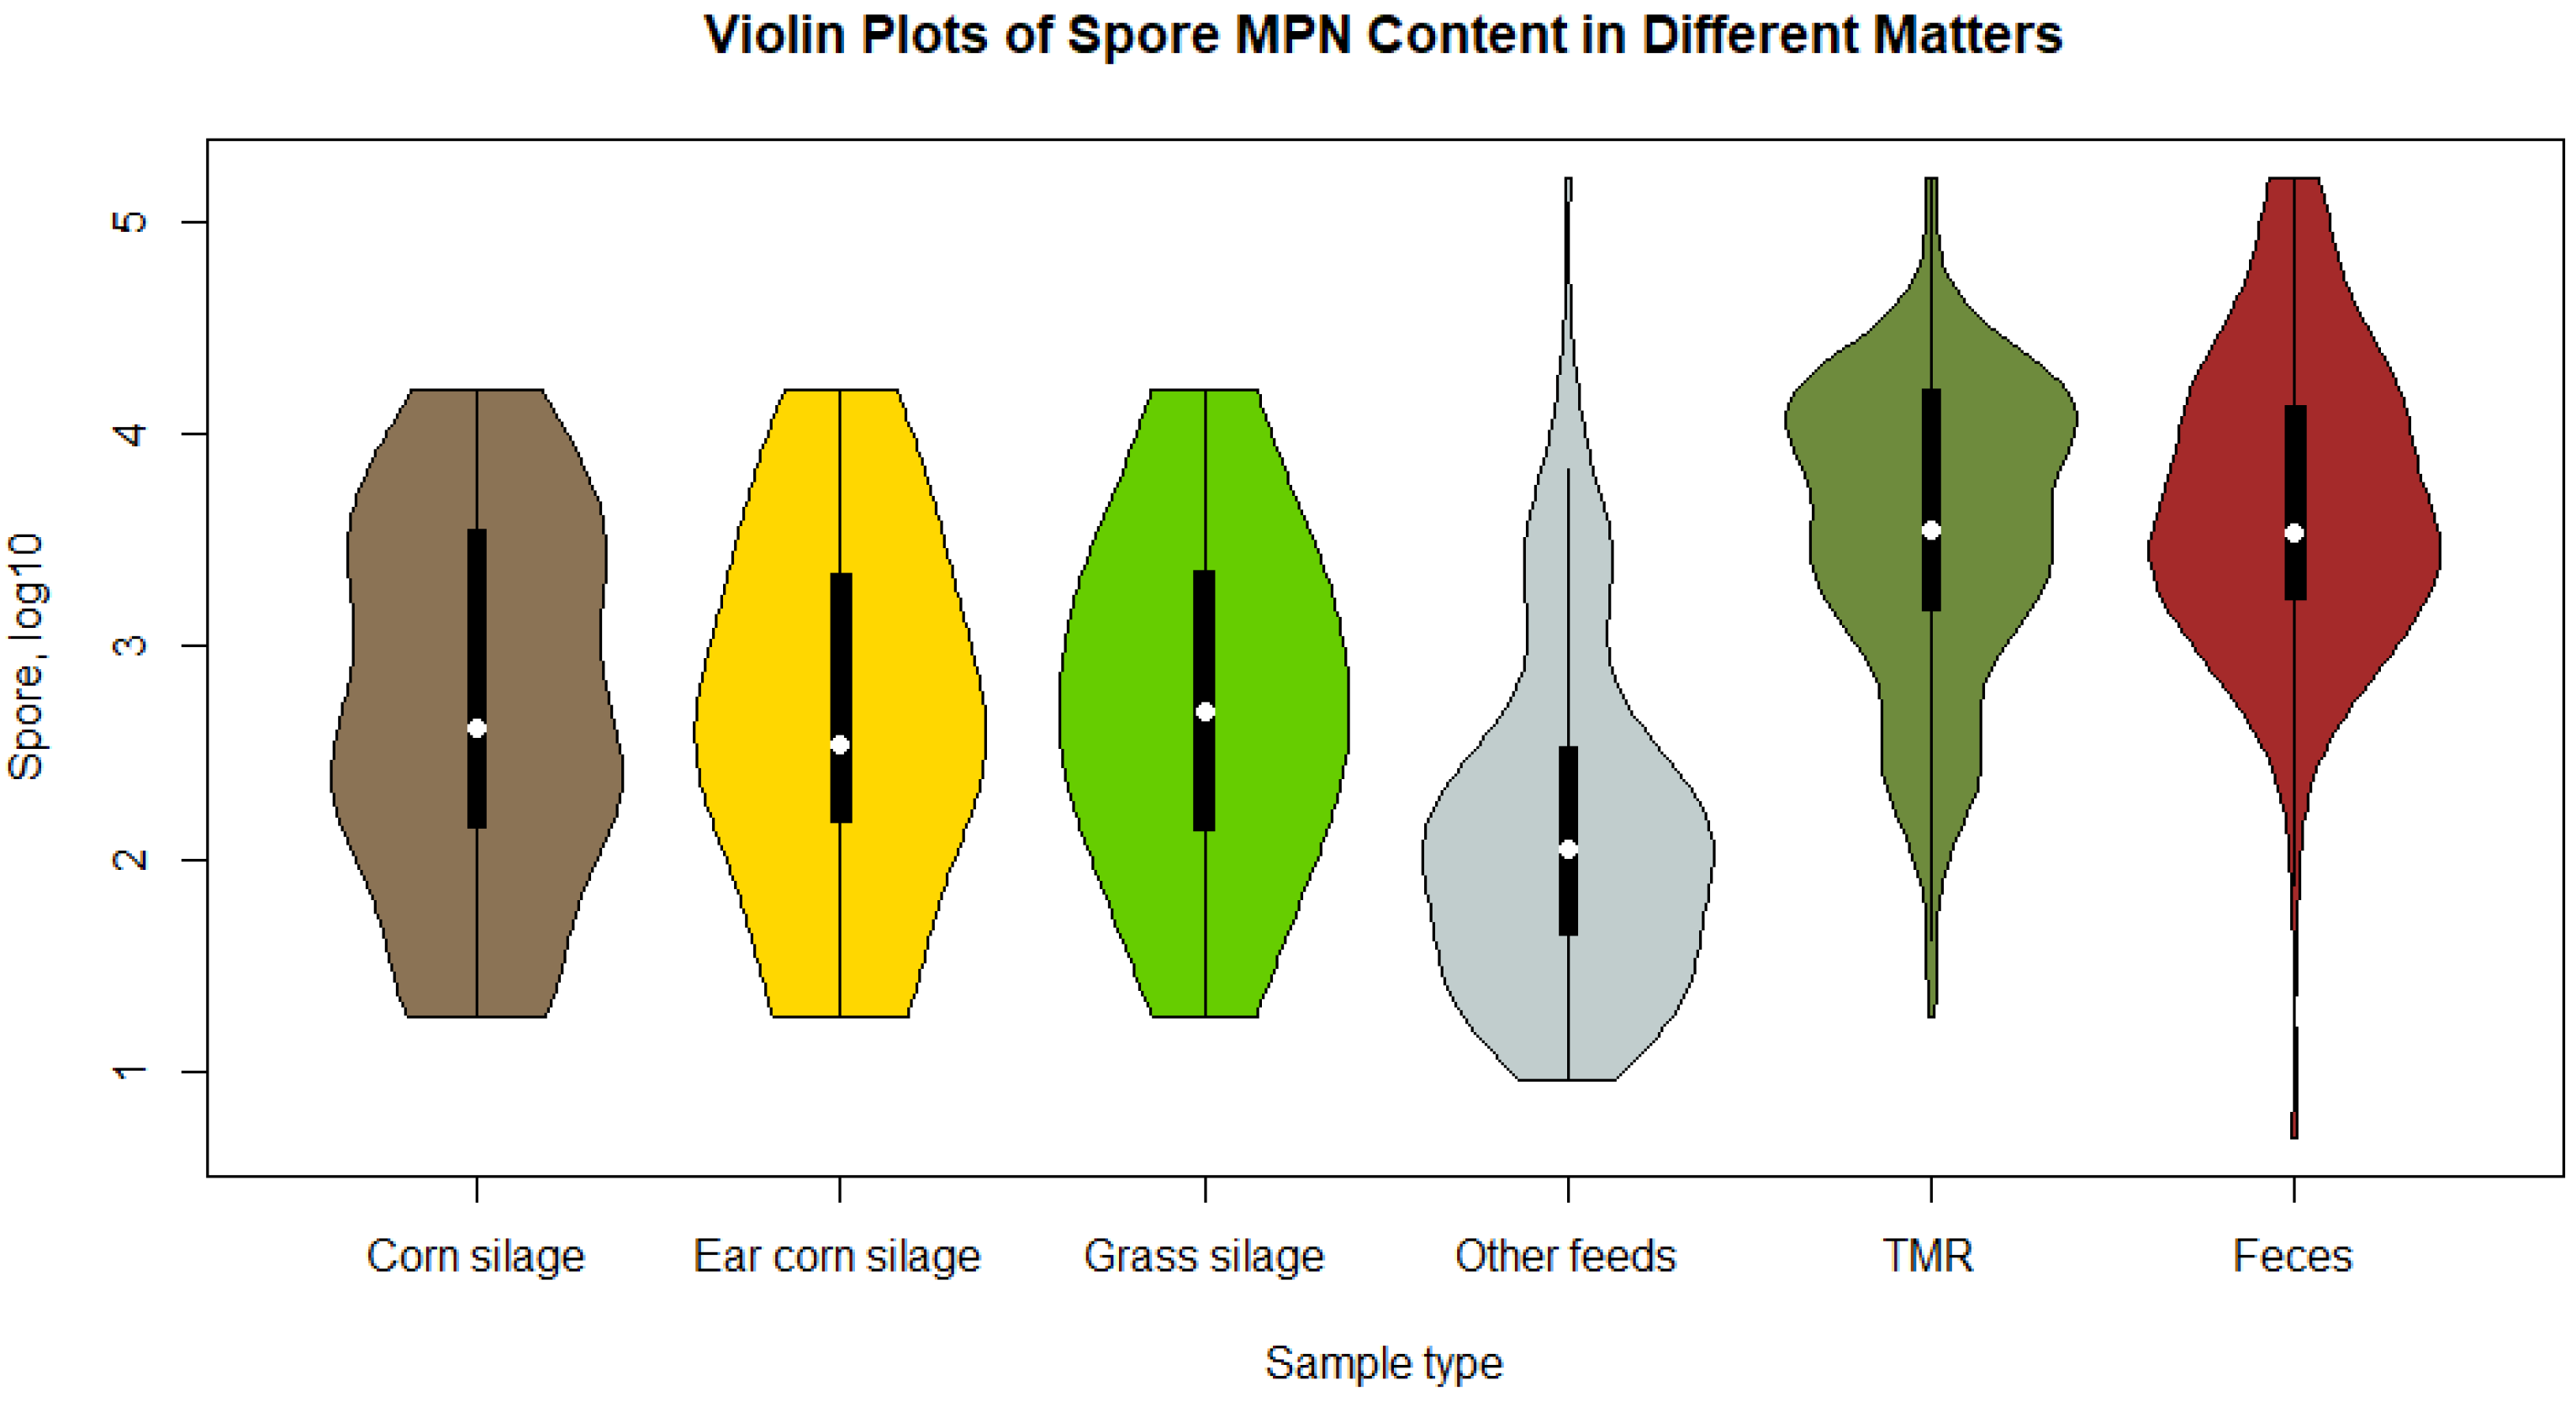
3.1. Anaerobic Spore-Forming Bacteria Determined in Different Matrices
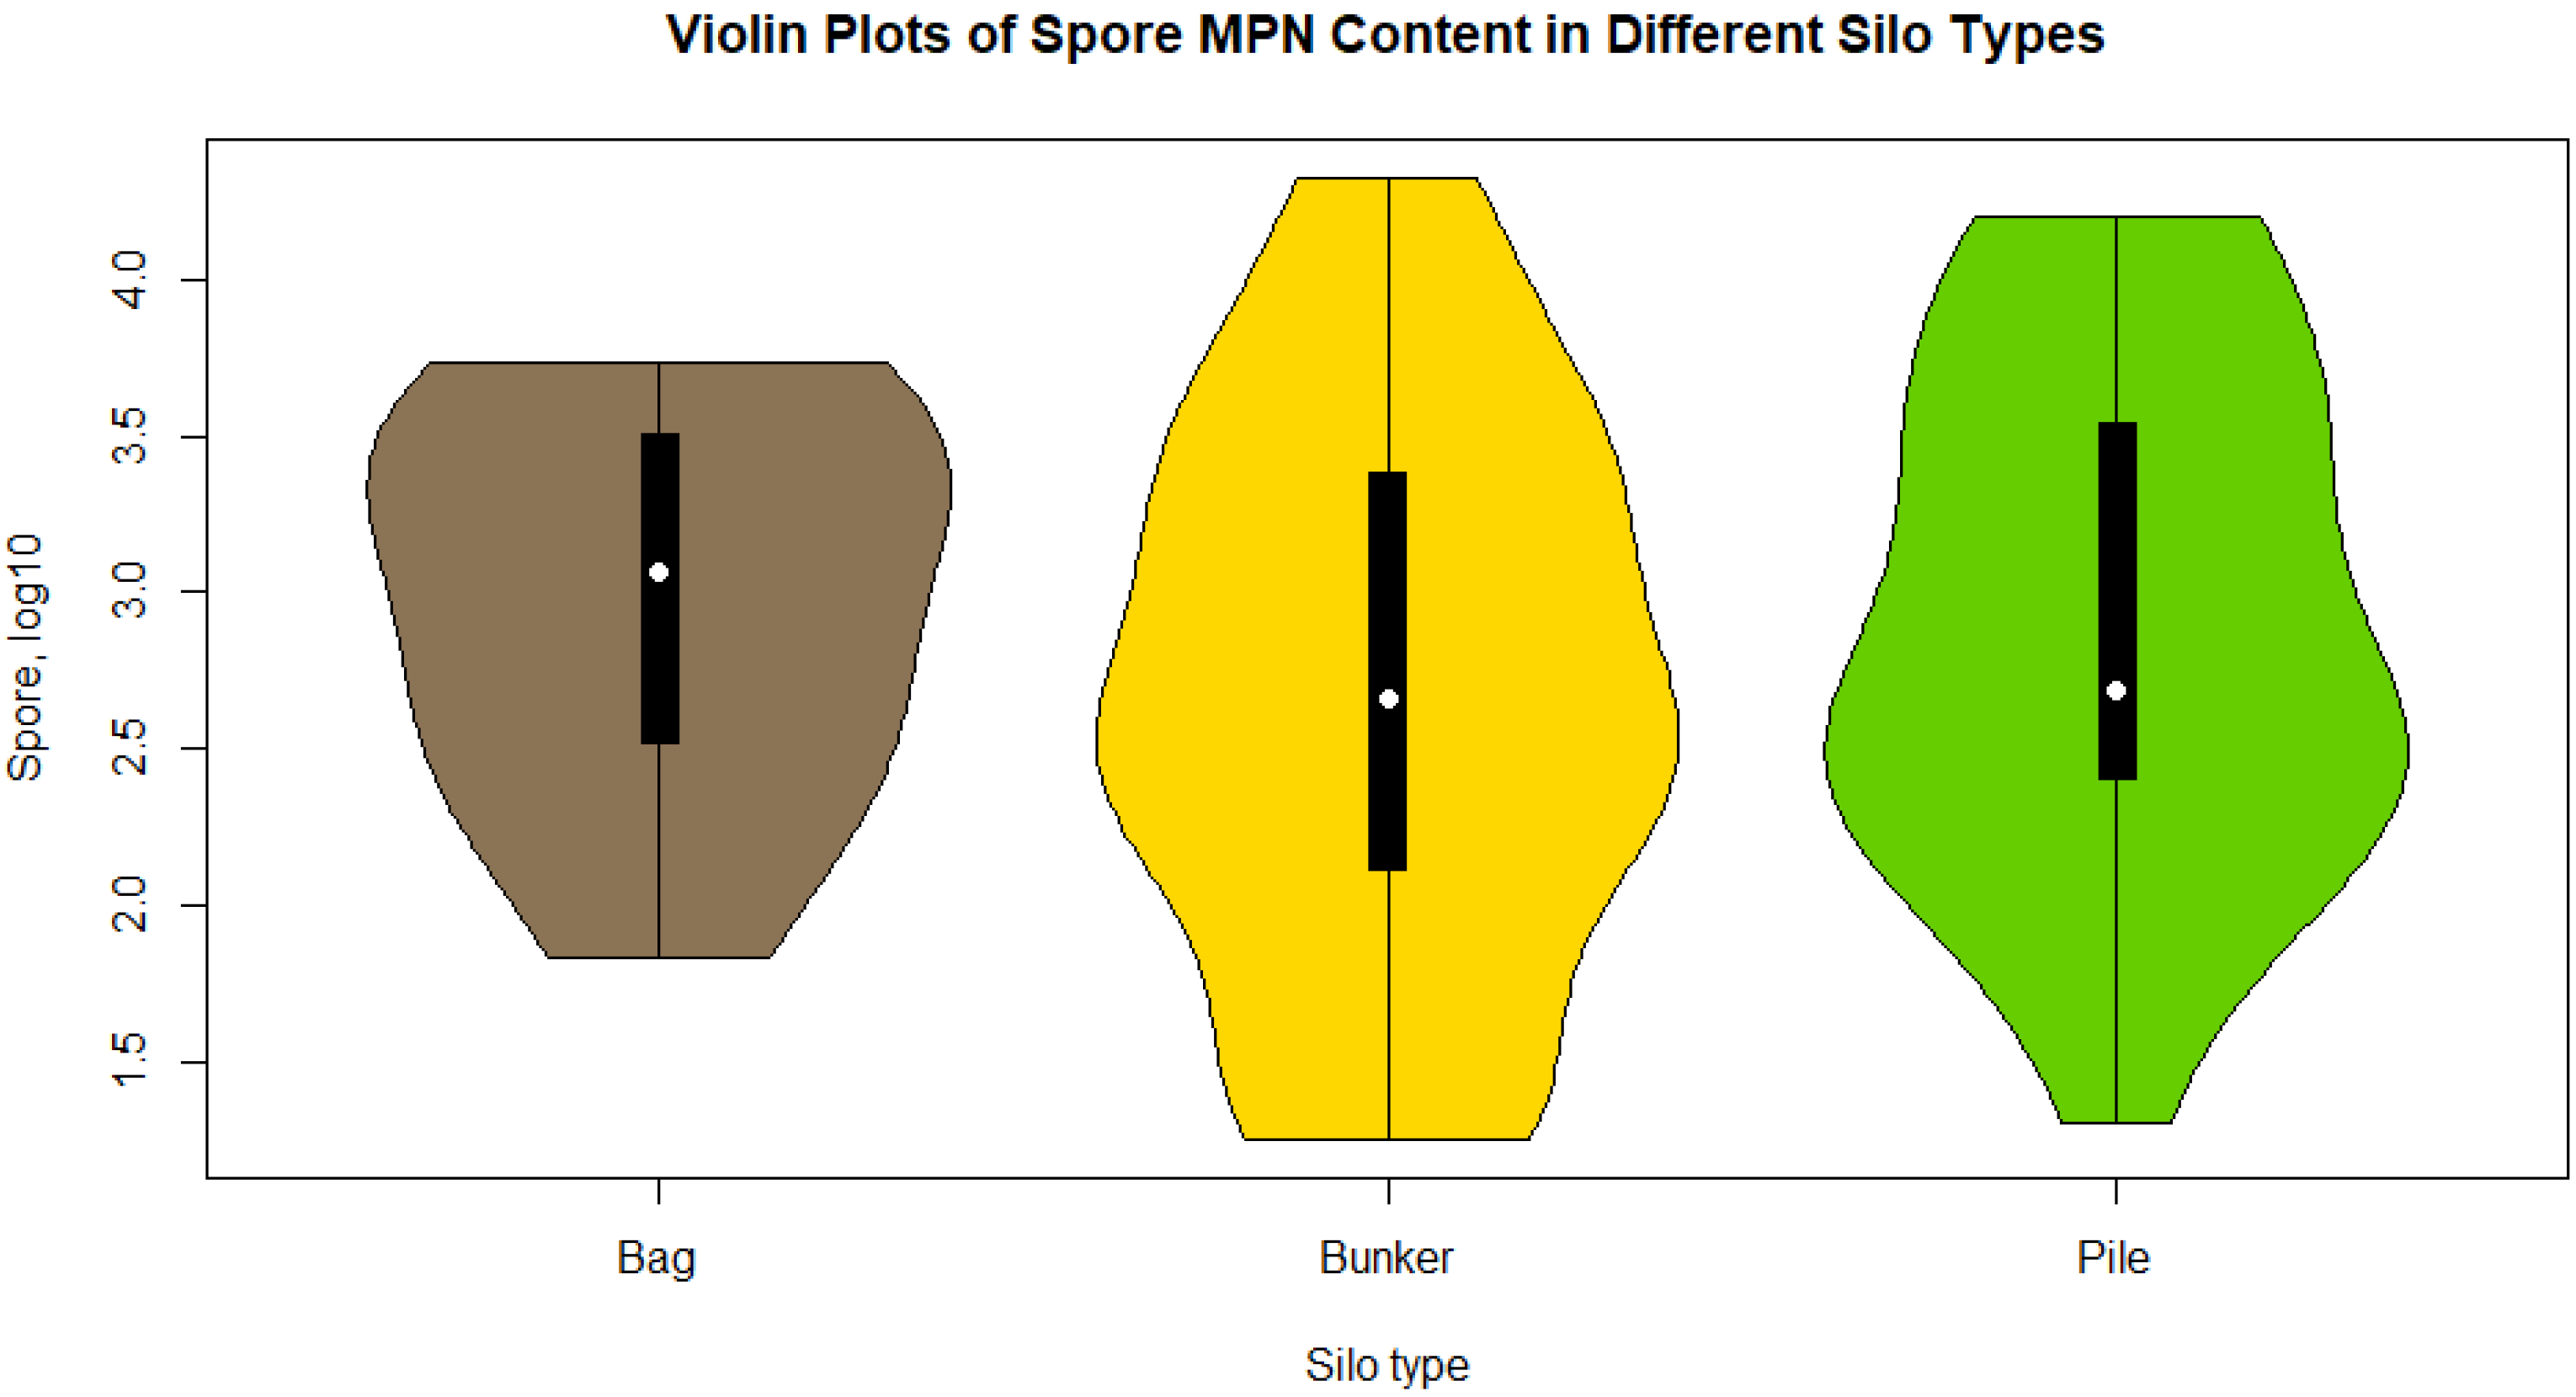
3.2. All of the Silos
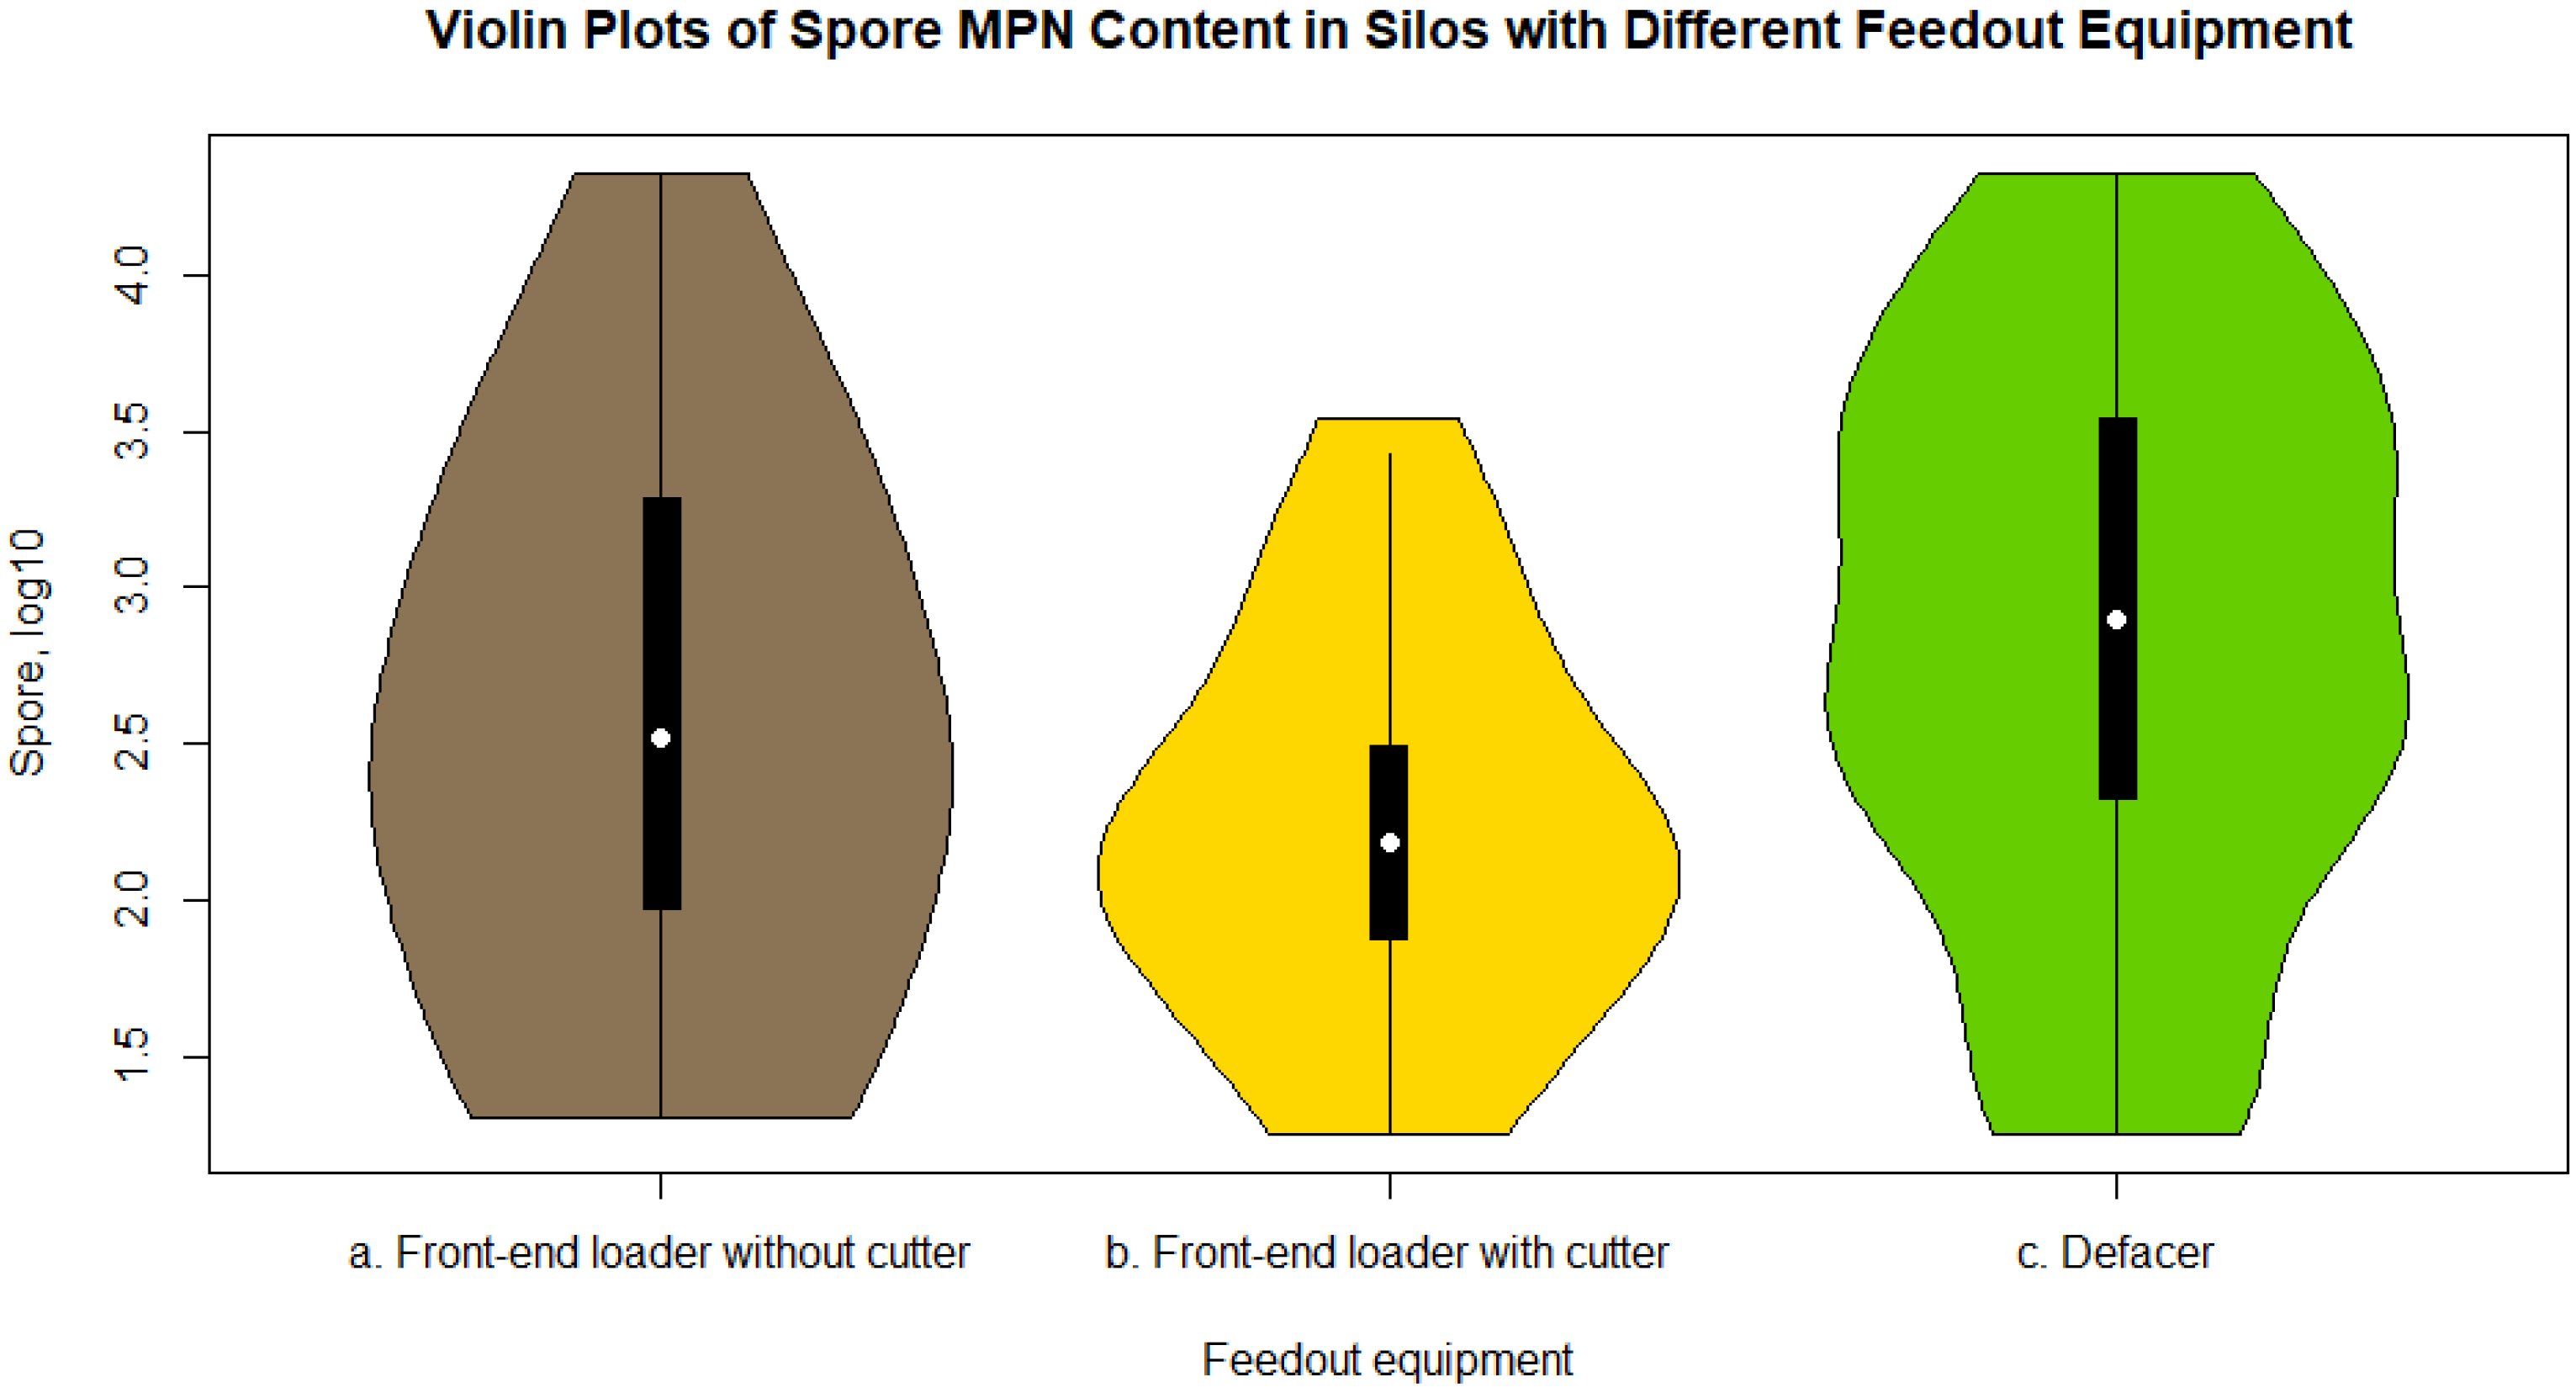
3.3. Silage Unloading Equipment
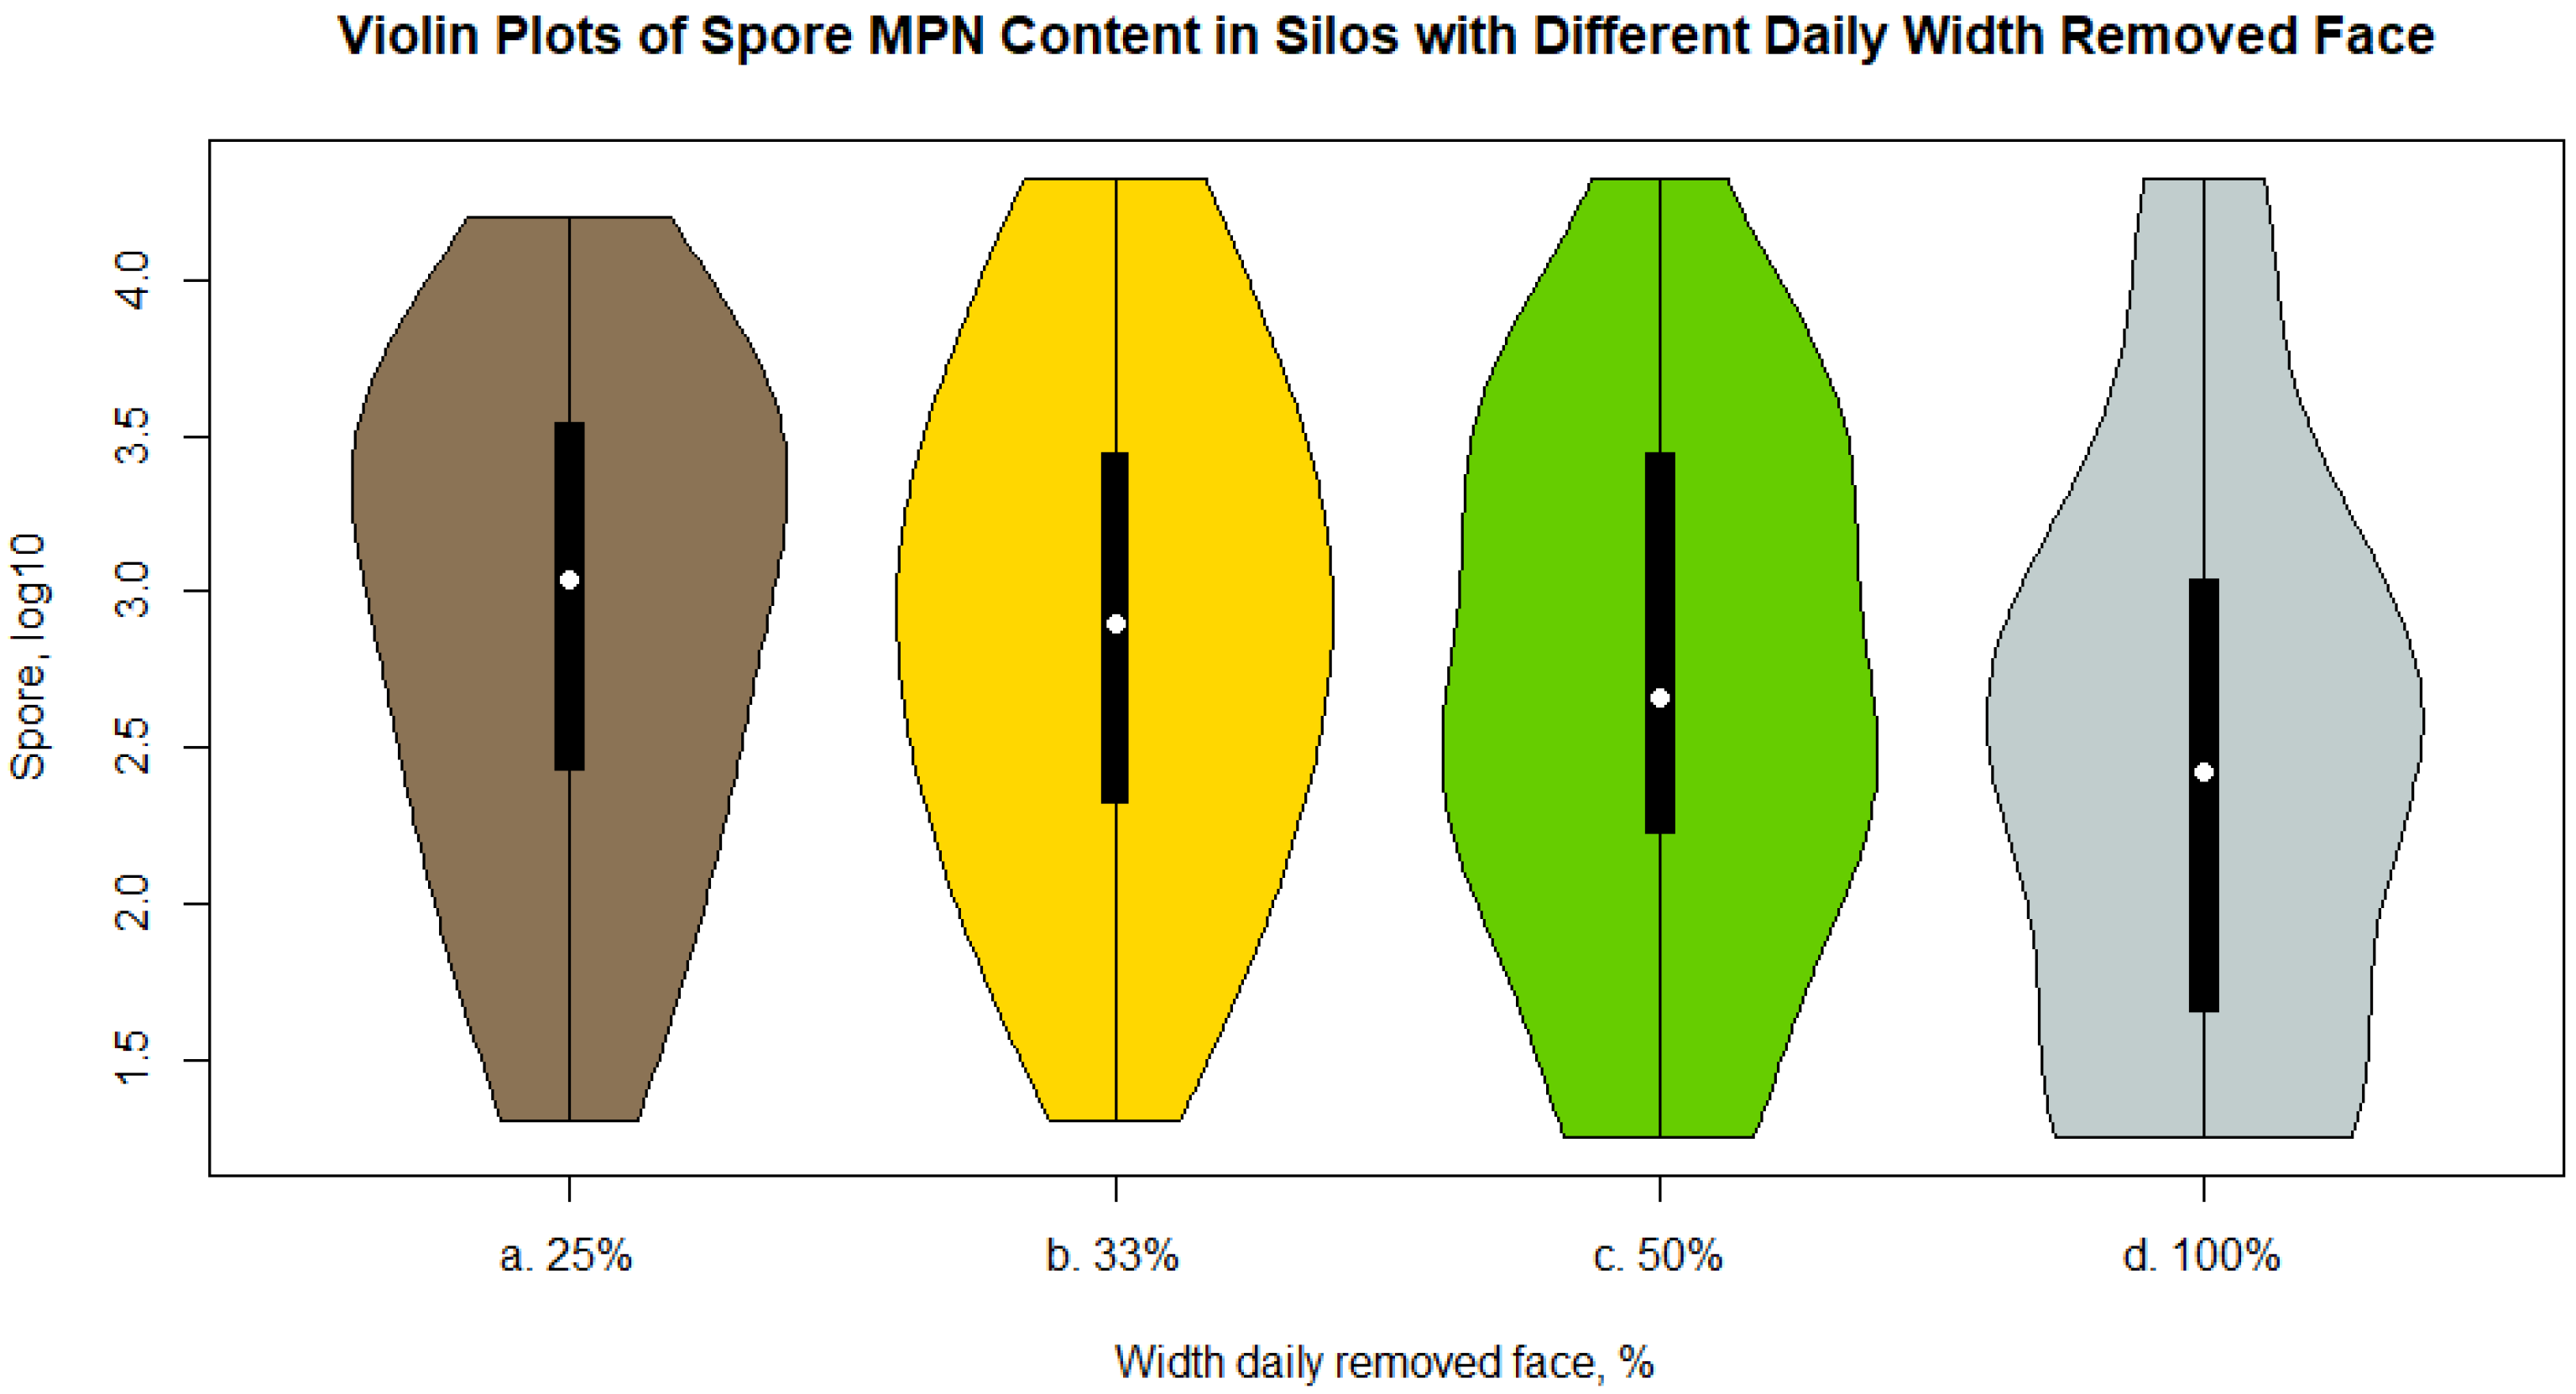
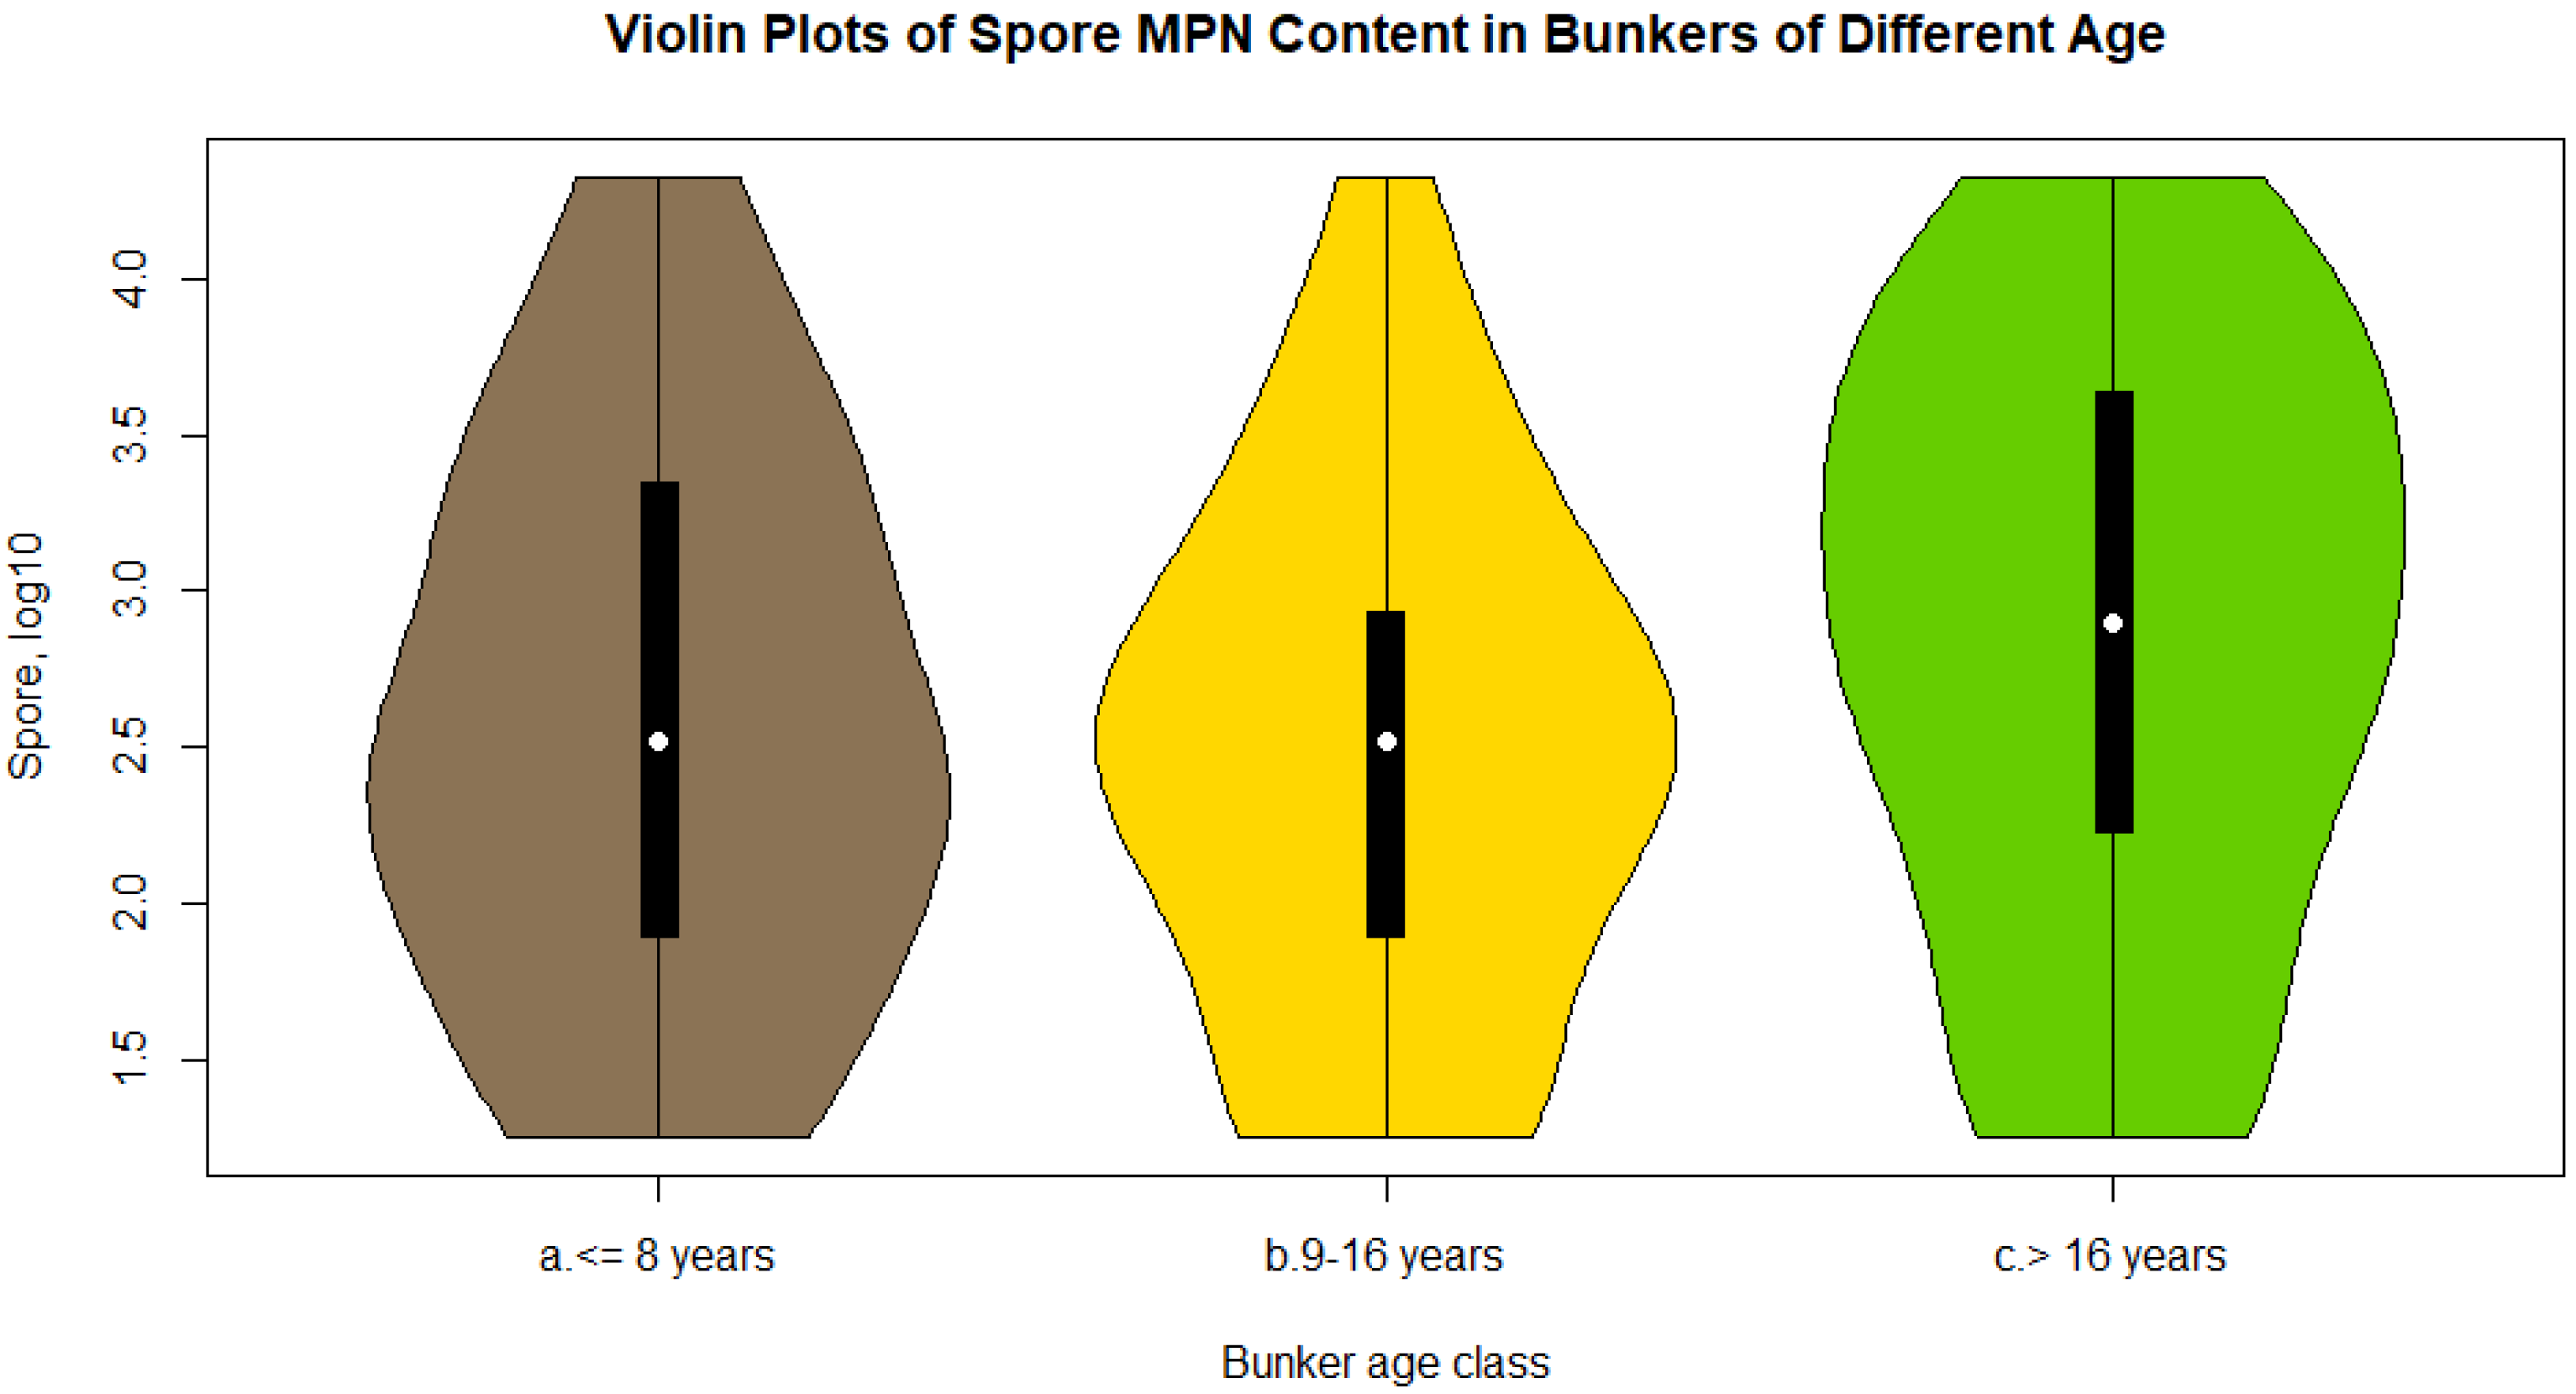
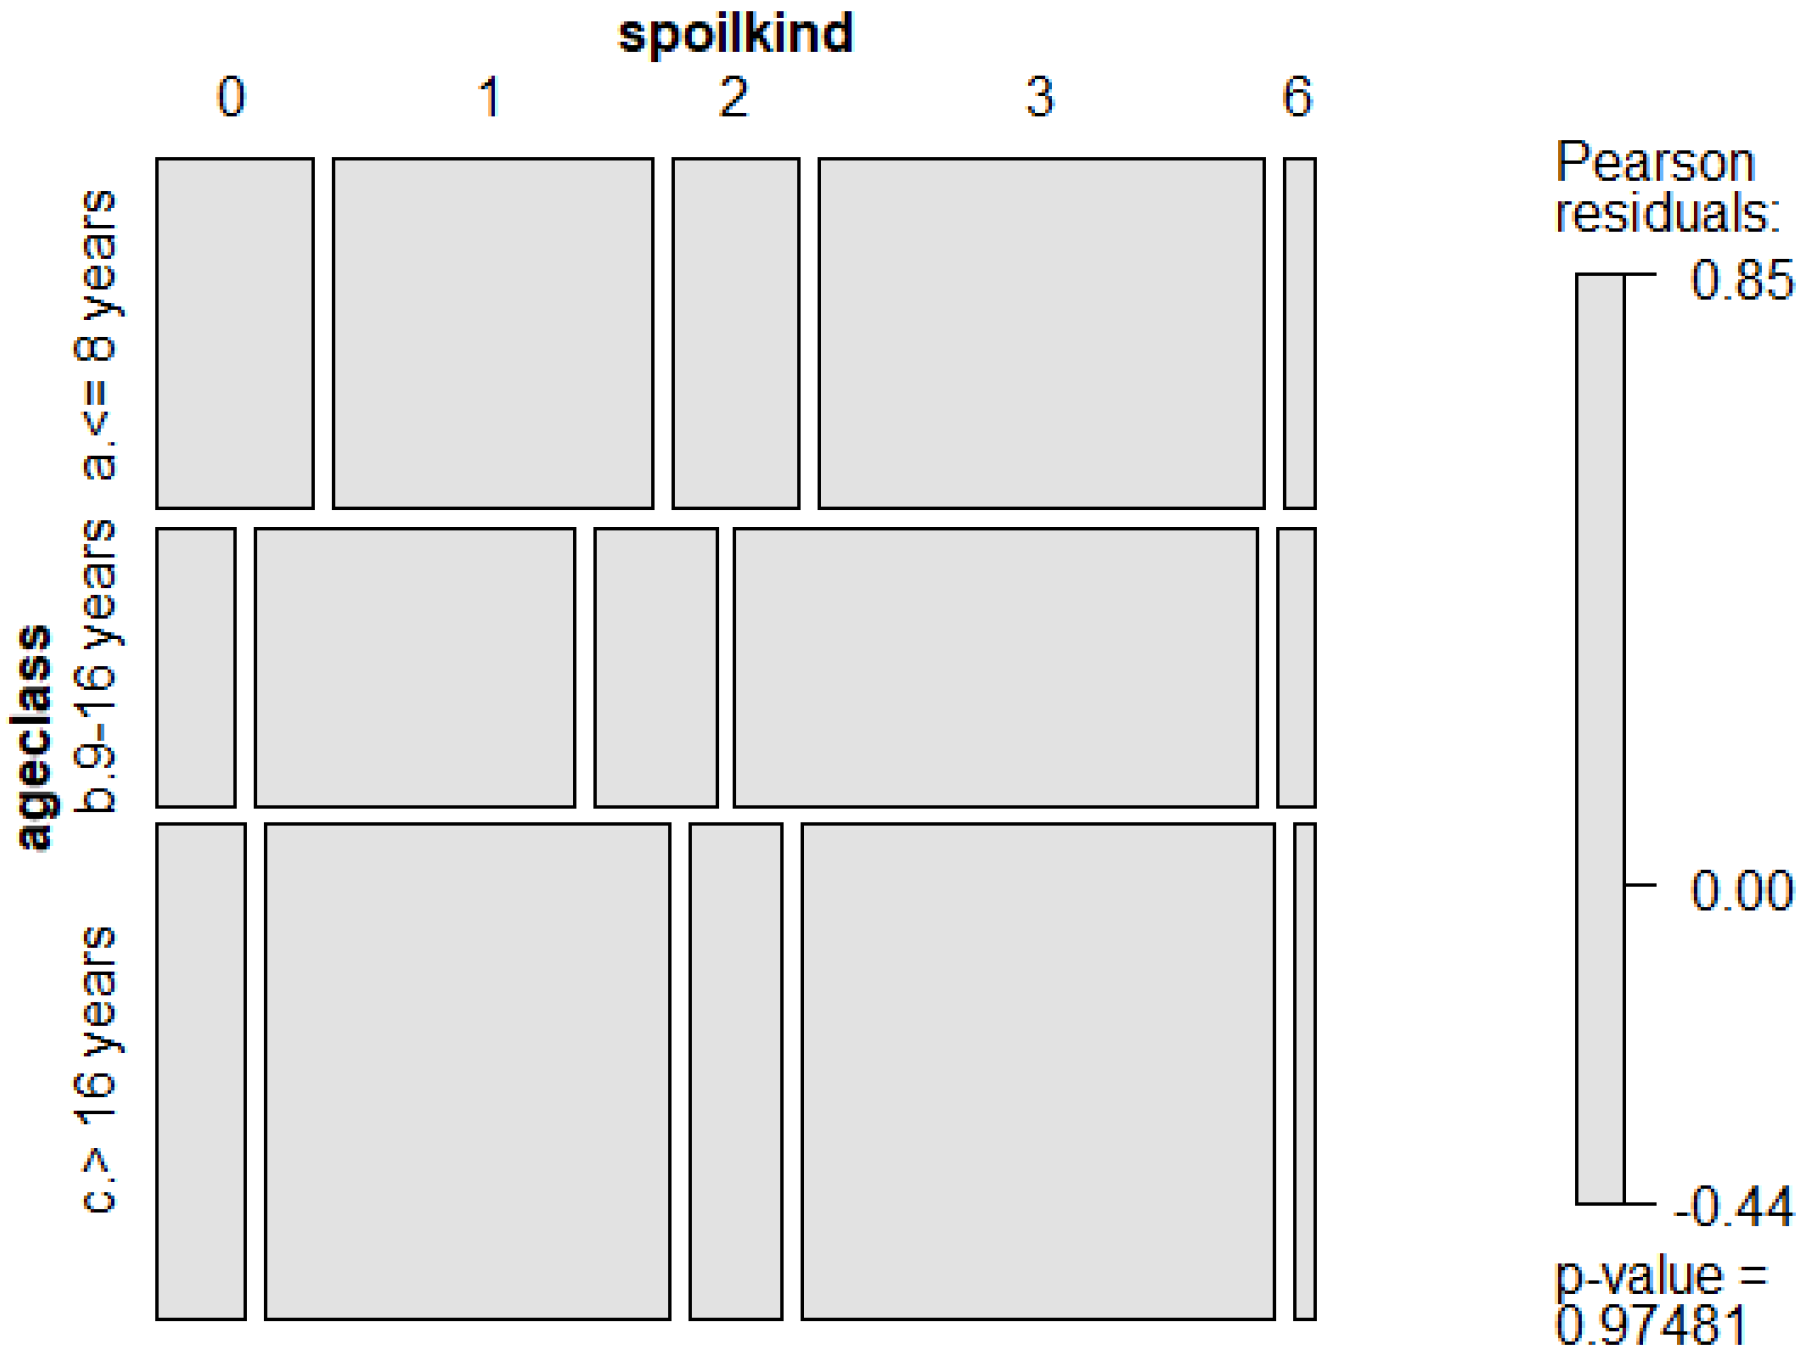
3.4. Bunker Silos
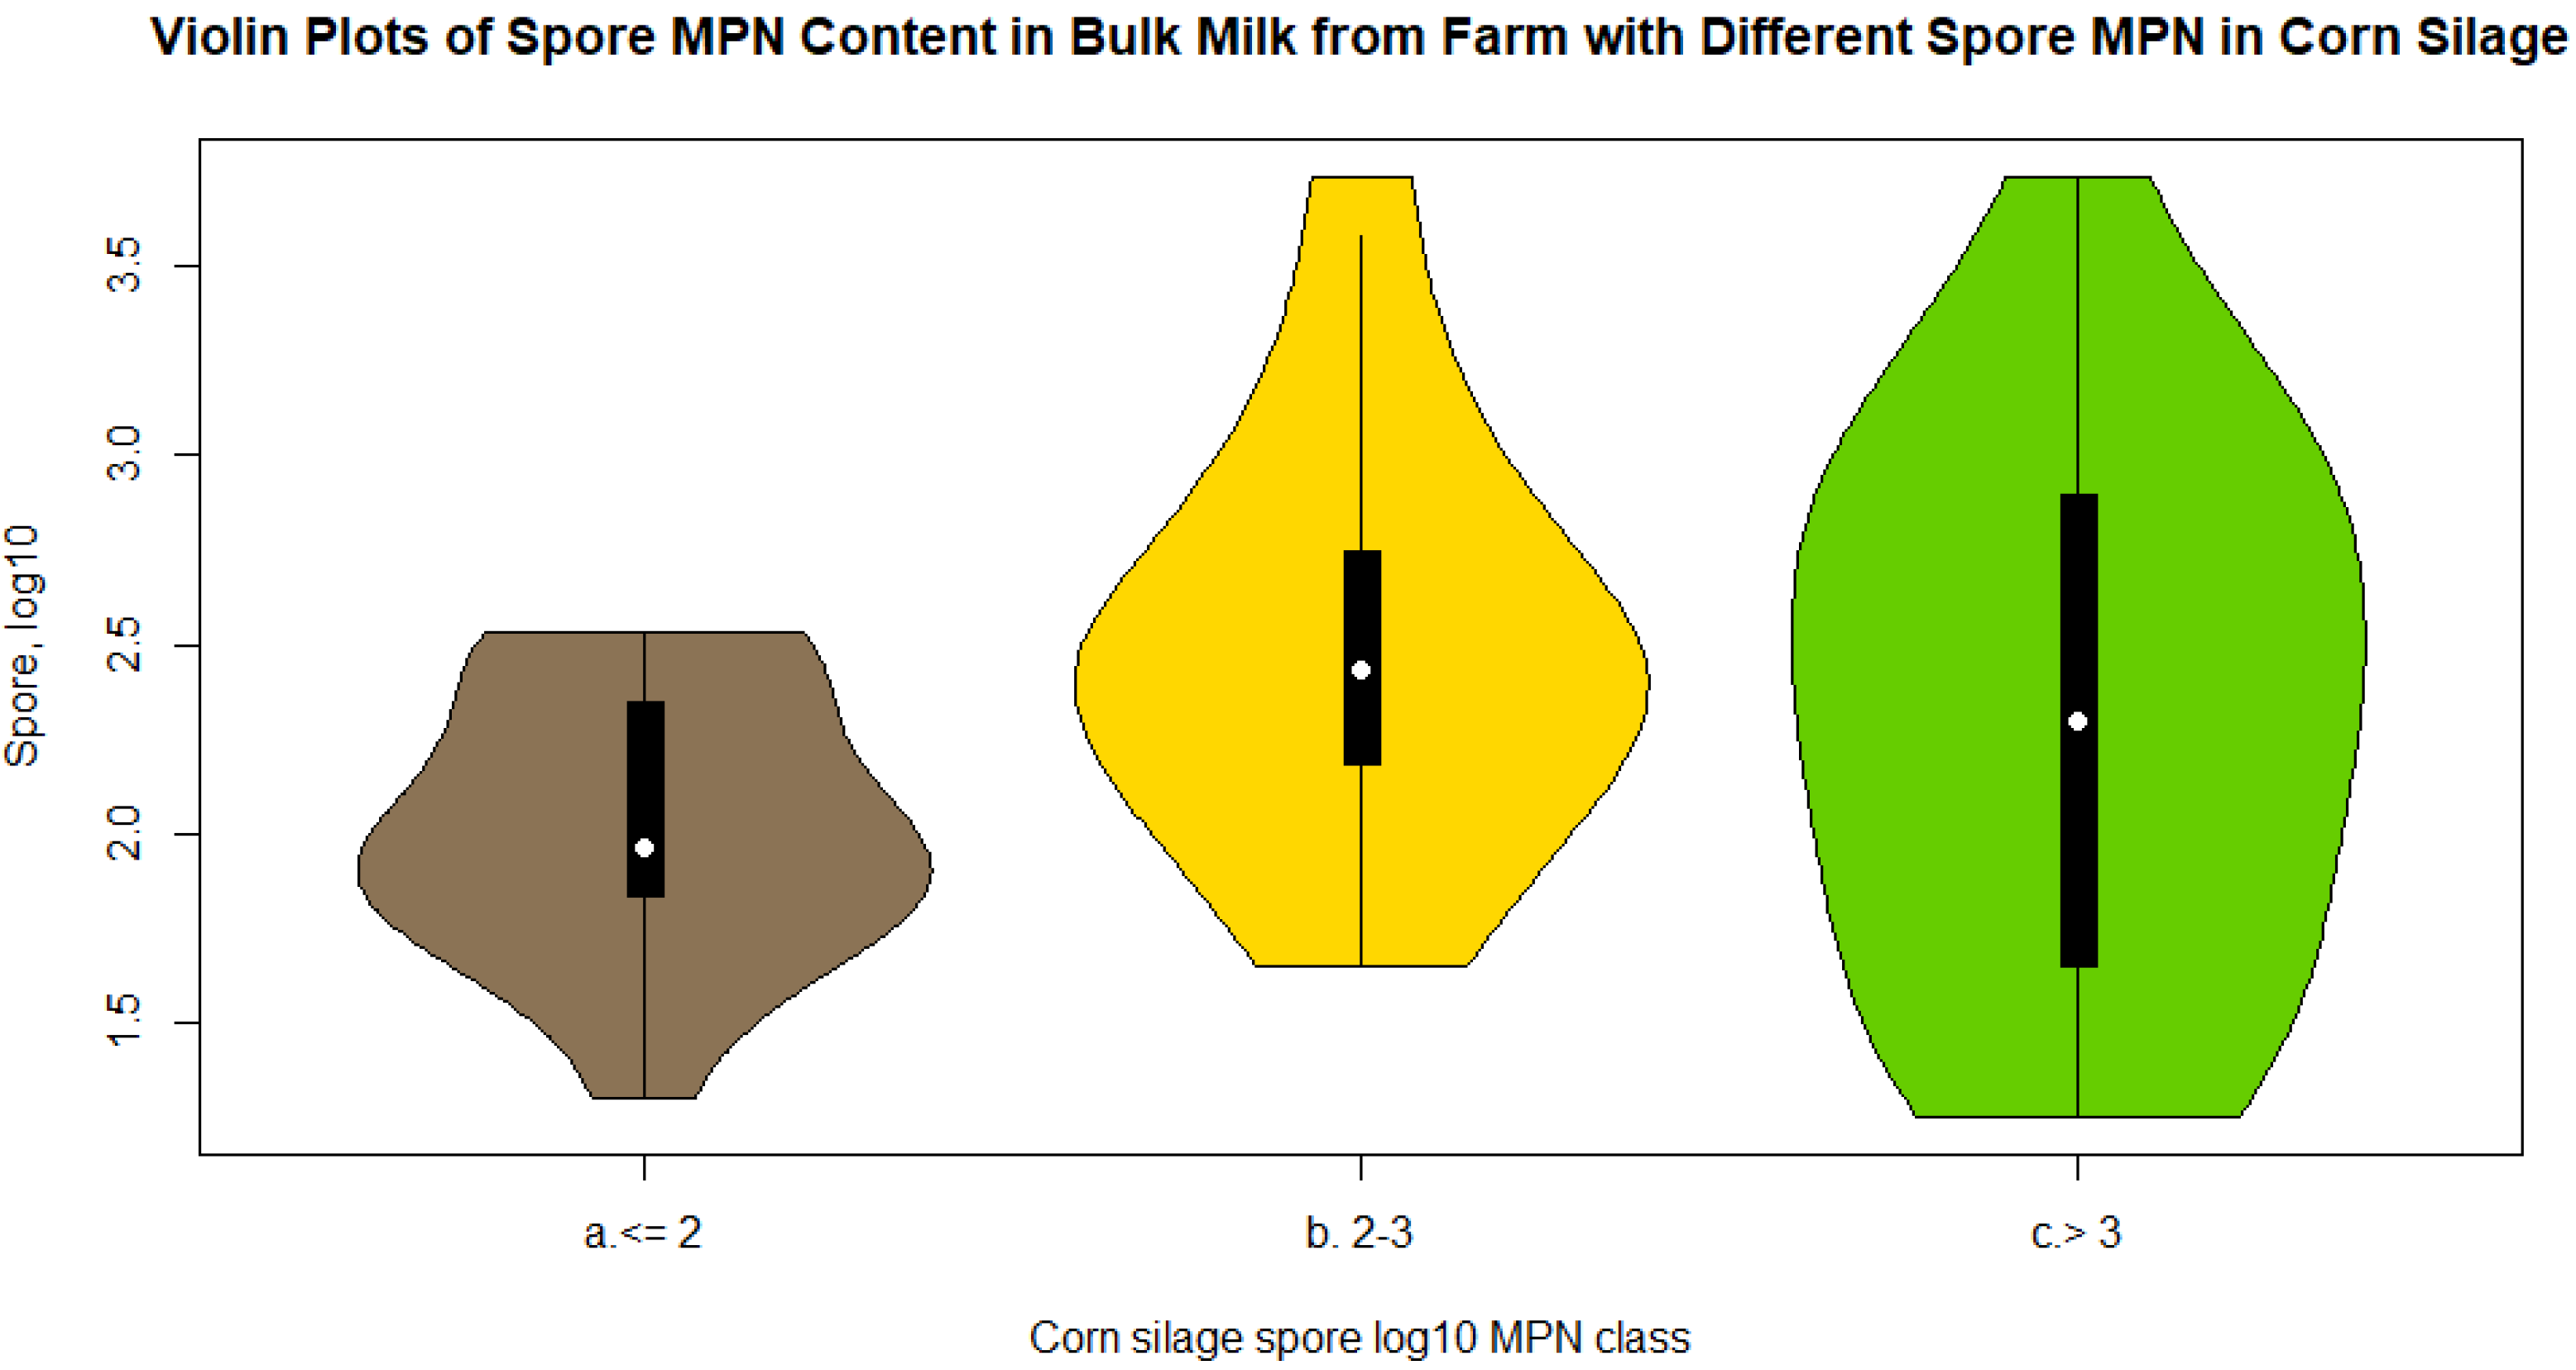
3.5. Farms
4. Discussion
4.1. Anaerobic Spore-Forming Bacteria in Different Matrices
4.2. All the Silos
4.3. Silage Unloading Equipment
4.4. Bunker Silos
4.5. Farms
5. Conclusions
Author Contributions
Funding
Institutional Review Board Statement
Informed Consent Statement
Data Availability Statement
Acknowledgments
Conflicts of Interest
References
- Tabacco, E.; Comino, L.; Borreani, G. Production efficiency, costs and environmental impacts of conventional and dynamic forage systems for dairy farms in Italy. Eur. J. Agron. 2018, 99, 1–12. [Google Scholar] [CrossRef]
- Borreani, G.; Coppa, M.; Revello-Chion, A.; Comino, L.; Giaccone, D.; Ferlay, A.; Tabacco, E. Effect of different feeding strategies in intensive dairy farming systems on milk fatty acid profiles, and implications on feeding costs in Italy. J. Dairy Sci. 2013, 96, 6840–6855. [Google Scholar] [CrossRef] [Green Version]
- Vissers, M.M.M.; Driehuis, F.; Te Giffel, M.C.; De Jong, P.; Lankveld, J.M.G. Improving Farm Management by Modeling the Contamination of Farm Tank Milk with Butyric Acid Bacteria. J. Dairy Sci. 2006, 89, 850–858. [Google Scholar] [CrossRef] [Green Version]
- Zucali, M.; Bava, L.; Colombini, S.; Brasca, M.; Decimo, M.; Morandi, S.; Tamburini, A.; Crovetto, G.M. Management practices and forage quality affecting the contamination of milk with anaerobic spore-forming bacteria. J. Sci. Food Agric. 2015, 95, 1294–1302. [Google Scholar] [CrossRef] [PubMed]
- D’Incecco, P.; Faoro, F.; Silvetti, T.; Schrader, K.; Pellegrino, L. Mechanisms of Clostridium tyrobutyricum removal through natural creaming of milk: A microscopy study. J. Dairy Sci. 2015, 98, 5164–5172. [Google Scholar] [CrossRef] [PubMed]
- Doyle, C.J.; Gleeson, D.; Jordan, K.; Beresford, T.P.; Ross, R.P.; Fitzgerald, G.F.; Cotter, P.D. Anaerobic sporeformers and their significance with respect to milk and dairy products. Int. J. Food Microbiol. 2015, 197, 77–87. [Google Scholar] [CrossRef] [PubMed]
- Bermúdez, J.; González, M.J.; Olivera, J.A.; Burgueño, J.A.; Juliano, P.; Fox, E.M.; Reginensi, S.M. Seasonal occurrence and molecular diversity of clostridia species spores along cheesemaking streams of 5 commercial dairy plants. J. Dairy Sci. 2016, 99, 3358–3366. [Google Scholar] [CrossRef] [Green Version]
- ISZ Istituto Zooprofilattico Sperimentale “Bruno Ubertini”. Sporigeni Anaerobi. Available online: https://www.izsler.it/pls/izs_bs/v3_s2ew_consultazione.mostra_pagina?id_pagina=529 (accessed on 17 May 2020).
- Miller, R.A.; Kent, D.J.; Boor, K.J.; Martin, N.H.; Wiedmann, M. Different management practices are associated with mesophilic and thermophilic spore levels in bulk tank raw milk. J. Dairy Sci. 2015, 98, 4338–4351. [Google Scholar] [CrossRef]
- Bava, L.; Colombini, S.; Zucali, M.; Decimo, M.; Morandi, S.; Silvetti, T.; Brasca, M.; Tamburini, A.; Crovetto, G.M.; Sandrucci, A. Efficient milking hygiene reduces bacterial spore contamination in milk. J. Dairy Res. 2017, 84, 322–328. [Google Scholar] [CrossRef]
- Evanowski, R.L.; Kent, D.J.; Wiedmann, M.; Martin, N.H. Milking time hygiene interventions on dairy farms reduce spore counts in raw milk. J. Dairy Sci. 2020, 103, 4088–4099. [Google Scholar] [CrossRef]
- Calamari, L.; Morera, P.; Bani, P.; Minuti, A.; Basiricò, L.; Vitali, A.; Bernabucci, U. Effect of hot season on blood parameters, fecal fermentative parameters, and occurrence of Clostridium tyrobutyricum spores in feces of lactating dairy cows. J. Dairy Sci. 2018, 101, 4437–4447. [Google Scholar] [CrossRef] [Green Version]
- Storm, I.M.L.D.; Kristensen, N.B.; Raun, B.M.L.; Smedsgaard, J.; Thrane, U. Dynamics in the microbiology of maize silage during whole-season storage. J. Appl. Microbiol. 2010, 109, 1017–1026. [Google Scholar] [CrossRef] [PubMed]
- Borreani, G.; Ferrero, F.; Nucera, D.; Casale, M.; Piano, S.; Tabacco, E. Dairy farm management practices and the risk of contamination of tank milk from Clostridium spp. and Paenibacillus spp. spores in silage, total mixed ration, dairy cow feces, and raw milk. J. Dairy Sci. 2019, 102, 8273–8289. [Google Scholar] [CrossRef] [PubMed]
- Vissers, M.M.M.; Driehuis, F.; Te Giffel, M.C.; De Jong, P.; Lankveld, J.M.G. Concentrations of Butyric Acid Bacteria Spores in Silage and Relationships with Aerobic Deterioration. J. Dairy Sci. 2007, 90, 928–936. [Google Scholar] [CrossRef]
- Bernardes, T.F.; Daniel, J.L.P.; Adesogan, A.T.; McAllister, T.A.; Drouin, P.; Nussio, L.G.; Huhtanen, P.; Tremblay, G.F.; Bélanger, G.; Cai, Y. Silage review: Unique challenges of silages made in hot and cold regions. J. Dairy Sci. 2018, 101, 4001–4019. [Google Scholar] [CrossRef] [PubMed]
- Ashbell, G.; Weinberg, Z.G.; Hen, Y.; Filya, I. The effects of temperature on the aerobic stability of wheat and corn silages. J. Ind. Microbiol. Biotechnol. 2002, 28, 261–263. [Google Scholar] [CrossRef] [PubMed]
- Holmes, B.J. Software applications for sizing silos to maximize silage quality. In Proceedings of International Symposium on Forage Quality and Conservation; University of São Paulo: Piracicaba, Brazil, 2009; pp. 189–208. [Google Scholar]
- Heguy, J.M.; Meyer, D.; Silva-del-Río, N. A survey of silage management practices on California dairies. J. Dairy Sci. 2016, 99, 1649–1654. [Google Scholar] [CrossRef] [Green Version]
- McGilliard, M.L.; Crowgey, J.H.; Pecsok, S.R.; James, R.E.; Kohl, D.M. Comparisons of Costs After Tax of Storing Silages in Four Types of Structures. J. Dairy Sci. 1987, 70, 724–731. [Google Scholar] [CrossRef]
- Mickan, F.J.; Martin, M.D.; Piltz, J.W. Silage Storage. In Successful Silage; Kaiser, A.G., Piltz, J.W., Burns, H.M., Griffiths, N.W., Eds.; Dairy Australia and New South Wales Department of Primary Industries: Orange, NSW, Australia, 2004; Chapter 9; pp. 217–252. ISBN 0734715835. [Google Scholar]
- Gallo, A.; Bertuzzi, T.; Giuberti, G.; Moschini, M.; Bruschi, S.; Cerioli, C.; Masoero, F. New assessment based on the use of principal factor analysis to investigate corn silage quality from nutritional traits, fermentation end products and mycotoxins. J. Sci. Food Agric. 2016, 96, 437–448. [Google Scholar] [CrossRef]
- Annibaldi, S. Modificazione della prova di Weinzirl per la ricerca dei clostridi butirrici nel latte. Sci. Tec. Latt. 1969, 20, 75–79. [Google Scholar]
- Lodi, R.; Brasca, M.; Nardi, C.; Tamburini, A. Determinazione del contenuto di anaerobi sporigeni in latte e prodotti del settore lattiero-caseario [Detection of anaerobic spore formers in milk and dairy products]. Il Latte 1997, 22, 196–205. [Google Scholar]
- Jarvis, B.; Wilrich, C.; Wilrich, P.-T. Reconsideration of the derivation of Most Probable Numbers, their standard deviations, confidence bounds and rarity values. J. Appl. Microbiol. 2010, 109, 1660–1667. [Google Scholar] [CrossRef]
- R Core Team. R: A Language and Environment for Statistical Computing. Available online: http://www.sthda.com/english/wiki/correlation-matrix-an-r-function-to-do-all-you-need (accessed on 2 March 2020).
- Mostafa, E.; Roesmann, M.; Maack, C.; Schmittmann, O.; Buescher, W. Automated pressure regulation for a silage bagging machine. Comput. Electron. Agric. 2020, 173, 105399. [Google Scholar] [CrossRef]
- Borreani, G.; Tabacco, E. Low Permeability to Oxygen of a New Barrier Film Prevents Butyric Acid Bacteria Spore Formation in Farm Corn Silage. J. Dairy Sci. 2008, 91, 4272–4281. [Google Scholar] [CrossRef] [PubMed]
- Pitt, R.E.; Muck, R.E. A Diffusion Model of Aerobic Deterioration at the Exposed Face of Bunker Silos. J. Agric. Eng. Res. 1993, 55, 11–26. [Google Scholar] [CrossRef]
- Okatsu, Y.; Swanepoel, N.; Maga, E.A.; Robinson, P.H. Impacts of some factors that effect spoilage of silage at the periphery of the exposed face of corn silage piles. Anim. Feed Sci. Technol. 2019, 247, 234–247. [Google Scholar] [CrossRef]
- Ruppel, K.A.; Pitt, R.E.; Chase, L.E.; Galton, D.M. Bunker Silo Management and Its Relationship to Forage Preservation on Dairy Farms. J. Dairy Sci. 1995, 78, 141–153. [Google Scholar] [CrossRef]


| Information | Description |
|---|---|
| General | ID code; location; dairy processor |
| Silo type | Bunker; pile; bag |
| Building year | (only for bunker) |
| State of maintenance | 1 = bad; 2 = fairly good; 3 = very good (only for bunker) |
| Dimensions | Length; width; lateral wall height; maximum silage mass height (only for bunker) |
| Top surface shape | 1 = spiked; 2 = rounded; 3 = flat |
| Forage type | … |
| Inoculants | 0 = absent; 1 = present |
| Covering material | 0 = only polyethylene film: 1 = with oxygen barrier film |
| Films on lateral walls | 0 = absent; 1 = present (only for bunker) |
| Materials above film | Gravel bags; concrete tiles; stones; other |
| Unloading system | 1 = front-end loader; 2 = front-end loader with cutter; 3 = defacer |
| Depth of face removed (daily) | 1 = < 15 cm d−1; 2 = 15–30 cm d−1; 3 = 30–45 cm d−1; 4 = > 45 cm d−1 |
| Width of face removed (daily) | 1 = < 25%; 2 = 33%; 3 = 50%; 4 = 100% |
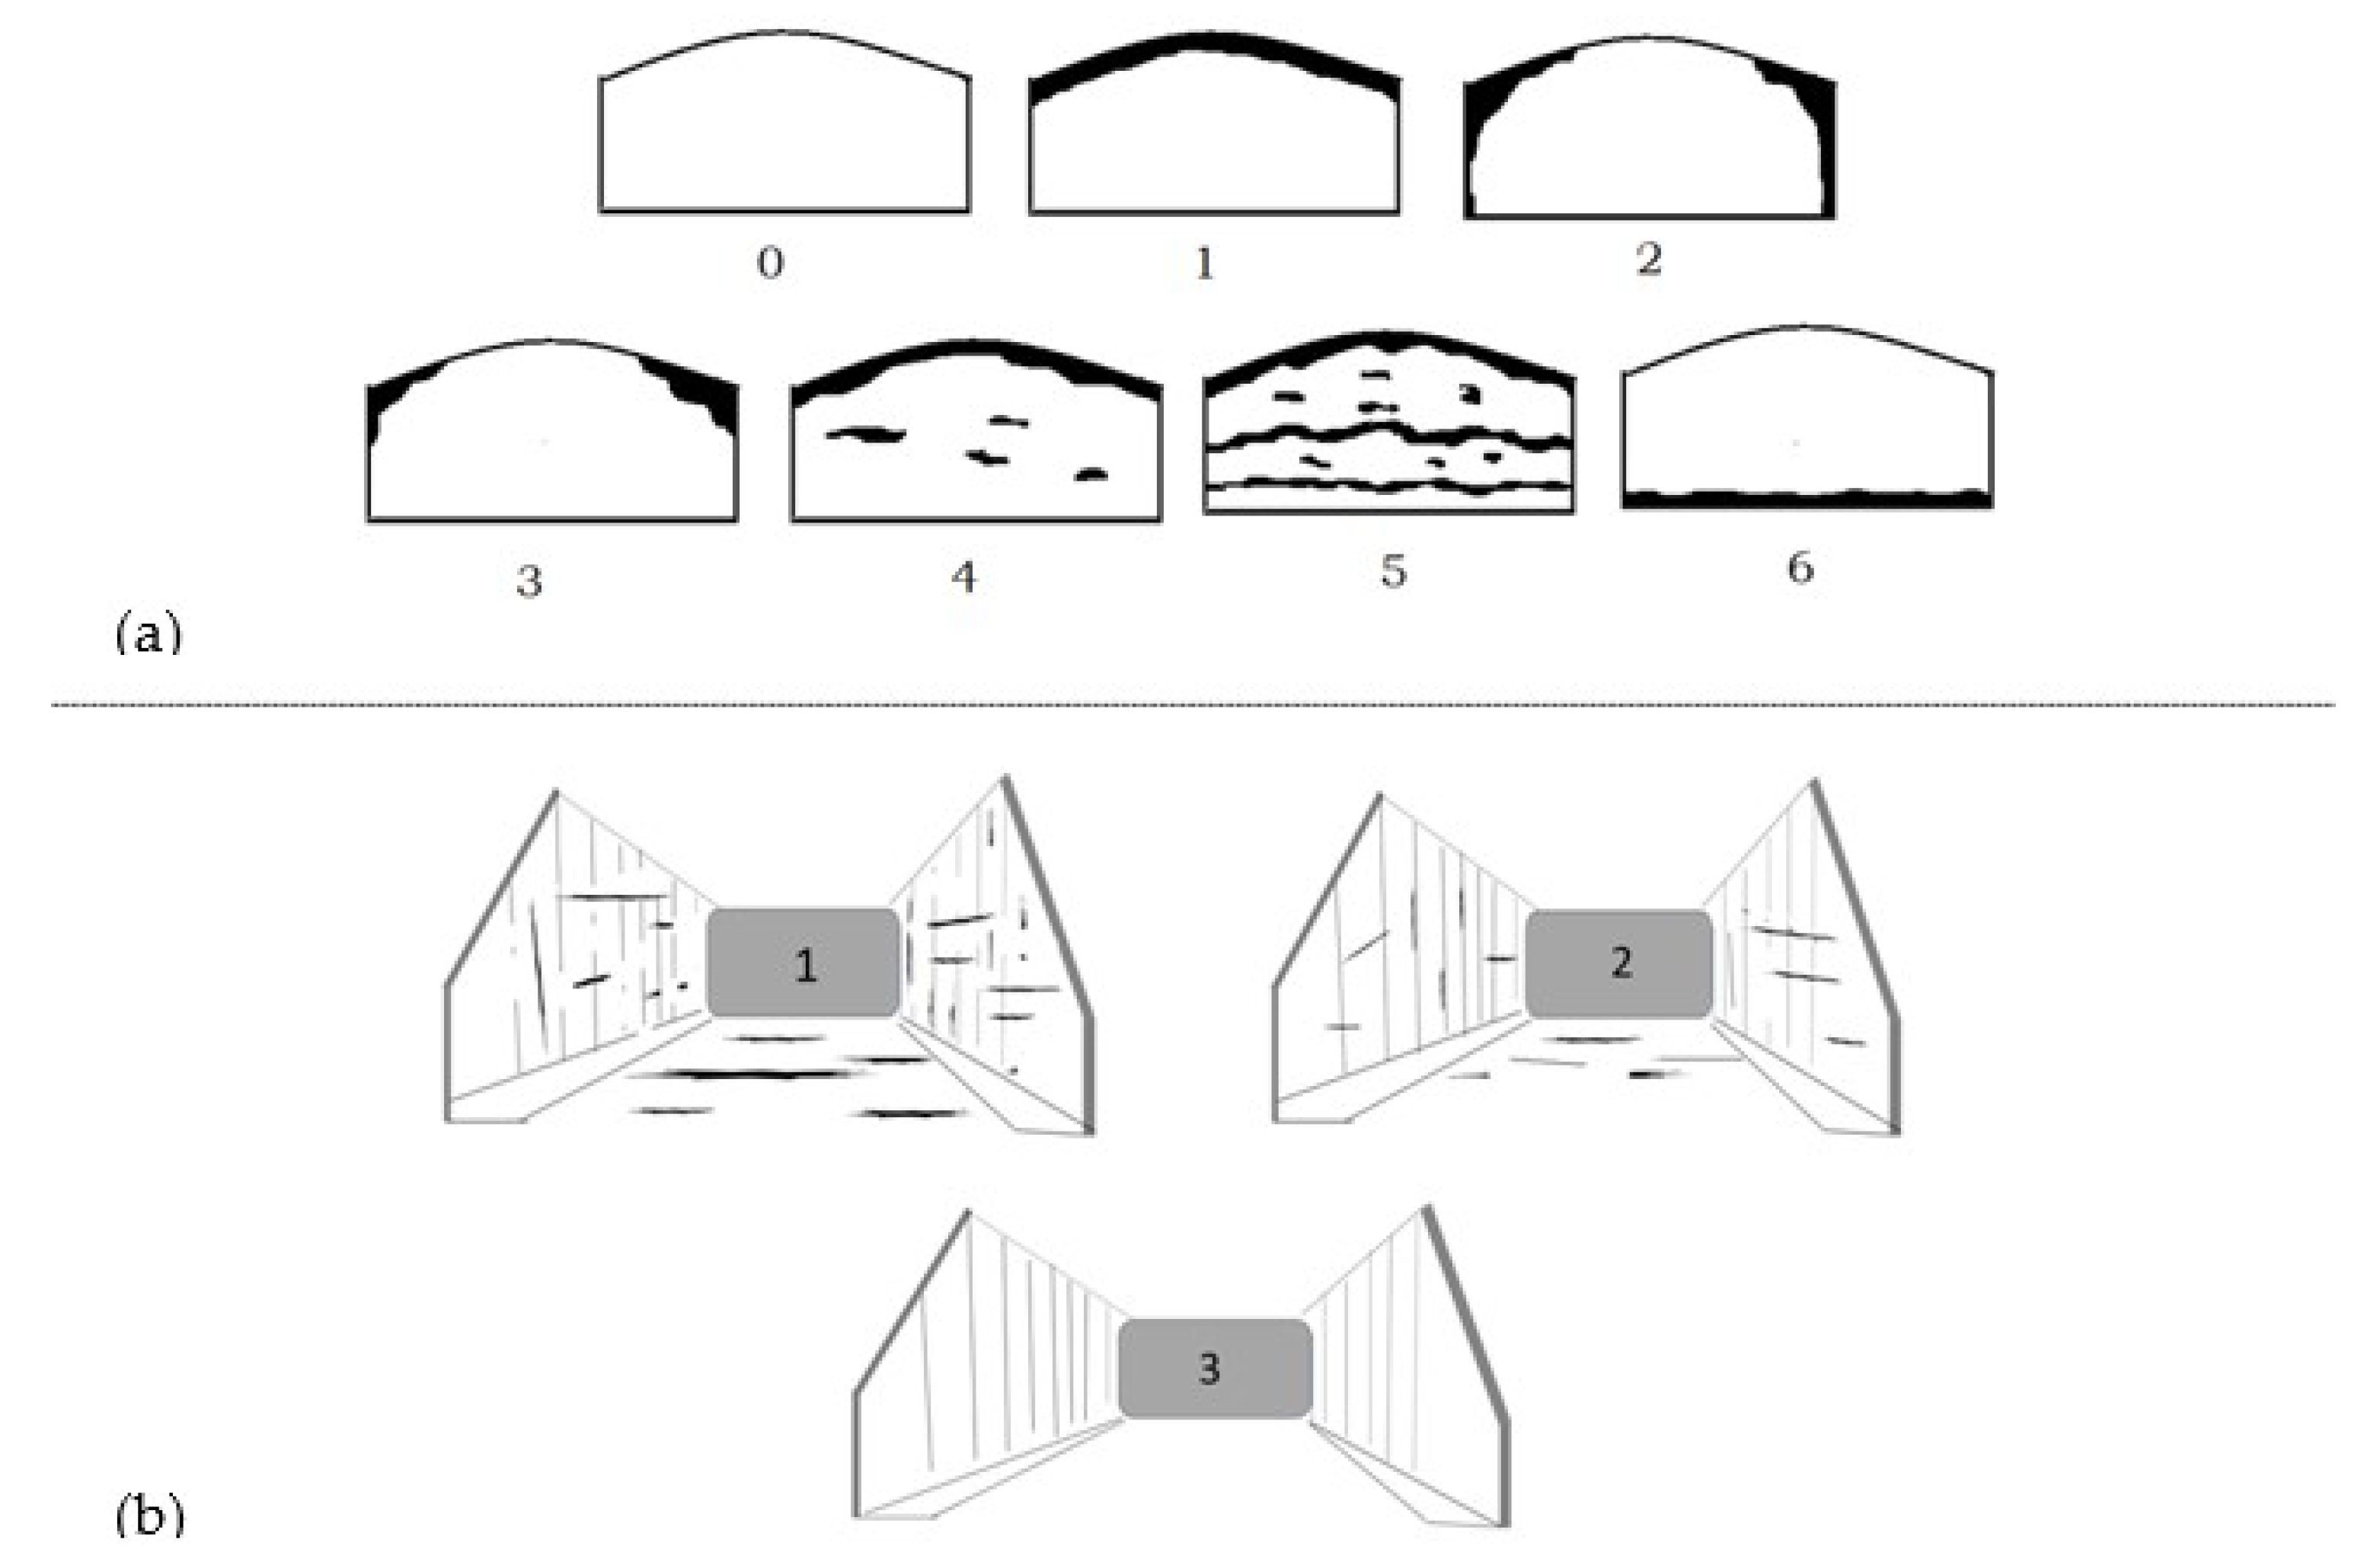
| Spoilage type 1 | 0 = not spoiled silage; 1 = upper surface of the mass; 2 = lateral border of the mass; 3 = upper lateral corners; 4 = upper surface and several spot within the mass; 5 = like “4”, with several horizontal layers within the mass; 6 = spoiled horizontal layer at the bottom of the mass |
| Ensiling Procedures (All) | Overall |
|---|---|
| Type of silage storage | |
| Bunkers | 80.3% |
| Piles | 13.9% |
| Bags | 5.8% |
| Silage additives | |
| No | 57.3% |
| Yes | 42.7% |
| Type of material placed on the top of plastic film1 | |
| None | |
| Gravel bags | 63.5% |
| Other materials | 45.8% |
| Unloading system | |
| Front-end loader without cutter | 12.6% |
| Front-end loader with cutter | 11.3% |
| Defacer | 76.2% |
| Type of longitudinal plastic film | |
| Single | 16.7% |
| Double (with oxygen-barrier) | 83.3% |
| Bunker | |
| Bunker dimensions | |
| Width, m | 10.36 ± 4.49 |
| Length, m | 43.58 ± 19.69 |
| Wall height, m | 2.83 ± 0.66 |
| Face surface, m2 | 30.48 ± 17.24 |
| Volume, m3 | 1372 ± 1133 |
| Lateral plastic film | |
| Absence | 34.5% |
| Presence | 65.5% |
| Coefficients | Estimate | Standard Error | t Value | p |
|---|---|---|---|---|
| (Intercept) | 3.5450000 | 0.3062000 | 11.575 | <0.001 |
| Silo length, cm | −0.0000915 | 0.0000448 | −2.042 | 0.0433 |
| Width of daily face removal, class 1 | −0.1577000 | 0.0765000 | −2.061 | 0.0414 |
| Residual standard error | 0.872 | |||
| DF | 123 | |||
| Multiple R-squared | 0.06248 | |||
| Adjusted R-squared | 0.04724 | |||
| F-statistic | 4.099 | 0.01891 |
| Coefficients | Estimate | Standard Error | t-Value | p |
|---|---|---|---|---|
| (Intercept) | 0.26822 | 0.71387 | 0.376 | 0.7083 |
| TMR spore content, log10 MPN g−1 | 0.20200 | 0.12298 | 1.643 | 0.1052 |
| Maize silage spore content, log10 MPN g−1 | 0.97769 | 0.50162 | 1.949 | 0.0555 |
| Maize silage spore content, (log10 MPN g−1)2 | −0.16210 | 0.09294 | −1.744 | 0.0858 |
| Residual standard error | 0.5611 | |||
| DF | 66 | |||
| Multiple R-squared | 0.1214 | |||
| Adjusted R-squared | 0.08151 | |||
| F-statistic | 3.041 | 0.03496 |
Publisher’s Note: MDPI stays neutral with regard to jurisdictional claims in published maps and institutional affiliations. |
© 2021 by the authors. Licensee MDPI, Basel, Switzerland. This article is an open access article distributed under the terms and conditions of the Creative Commons Attribution (CC BY) license (https://creativecommons.org/licenses/by/4.0/).
Share and Cite
Abeni, F.; Marino, R.; Petrera, F.; Segati, G.; Galli, A.; Carminati, D. Farm Silage Facilities and Their Management for the Prevention of Anaerobic Bacteria Spore Contamination in Raw Milk. Dairy 2021, 2, 500-514. https://0-doi-org.brum.beds.ac.uk/10.3390/dairy2030040
Abeni F, Marino R, Petrera F, Segati G, Galli A, Carminati D. Farm Silage Facilities and Their Management for the Prevention of Anaerobic Bacteria Spore Contamination in Raw Milk. Dairy. 2021; 2(3):500-514. https://0-doi-org.brum.beds.ac.uk/10.3390/dairy2030040
Chicago/Turabian StyleAbeni, Fabio, Rosanna Marino, Francesca Petrera, Giulia Segati, Andrea Galli, and Domenico Carminati. 2021. "Farm Silage Facilities and Their Management for the Prevention of Anaerobic Bacteria Spore Contamination in Raw Milk" Dairy 2, no. 3: 500-514. https://0-doi-org.brum.beds.ac.uk/10.3390/dairy2030040