Article

Multiple Regression Analysis and Frequent Itemset Mining of Electronic Medical Records: A Visual Analytics Approach Using VISA_M3R3

1
Insight Lab, Western University, London, ON N6A 3K7, Canada
2
Department of Medicine, Epidemiology and Biostatistics, Western University, London, ON N6A 3K7, Canada
3
ICES, London, ON N6A 3K7, Canada
*
Author to whom correspondence should be addressed.
Submission received: 20 February 2020 / Revised: 16 March 2020 / Accepted: 26 March 2020 / Published: 29 March 2020
(This article belongs to the Special Issue Data Quality and Data Access for Research)

Abstract

:
Medication-induced acute kidney injury (AKI) is a well-known problem in clinical medicine. This paper reports the first development of a visual analytics (VA) system that examines how different medications associate with AKI. In this paper, we introduce and describe VISA_M3R3, a VA system designed to assist healthcare researchers in identifying medications and medication combinations that associate with a higher risk of AKI using electronic medical records (EMRs). By integrating multiple regression models, frequent itemset mining, data visualization, and human-data interaction mechanisms, VISA_M3R3 allows users to explore complex relationships between medications and AKI in such a way that would be difficult or sometimes even impossible without the help of a VA system. Through an analysis of 595 medications using VISA_M3R3, we have identified 55 AKI-inducing medications, 24,212 frequent medication groups, and 78 medication groups that are associated with AKI. The purpose of this paper is to demonstrate the usefulness of VISA_M3R3 in the investigation of medication-induced AKI in particular and other clinical problems in general. Furthermore, this research highlights what needs to be considered in the future when designing VA systems that are intended to support gaining novel and deep insights into massive existing EMRs.

1. Introduction

As part of modernizing their operations, healthcare and medical organizations are adopting electronic medical records (EMRs) and deploying new information technology systems that generate, collect, digitize, and analyze their data [1]. With the development of EMRs and the extensive use of computerized provider order entry tools, patients’ medication profile data is now accessible and processable for secondary reuses [2,3]. The amount of prescription data available to clinical researchers, pharmaceutical scientists, and clinician-scientists continues to grow, creating an analyzable resource for generating insights that can help improve the healthcare system [4,5]. Healthcare providers use modern EMR-based systems to identify adverse drug events [6,7], study medication–medication interactions [8], investigate medication effects on particular medical conditions [9,10], and ultimately prevent medication errors [11,12,13].
A common problem in clinical medicine which may lead to development of acute kidney injury (AKI) is medication-induced nephrotoxicity [14,15,16]. AKI can be defined as a sudden loss of kidney function over a short period of time [17,18]. The rate of medication-induced AKI can be as high as 60% [19,20,21,22]. Many prior studies have assessed the impact of individual nephrotoxic medications on AKI [23,24,25]. The combination of multiple medications can further increase the risk of AKI through synergistic or accumulative nephrotoxicity [22]. For each additional nephrotoxic medication, the chance of developing AKI may increase by 53% [26]. Rivosecchi et al., through an exhaustive literature search, further emphasize the need for a comprehensive understanding of how medication combinations alter the risk of AKI [24]. According to a Center for Disease Control report, as of 2017, there were more than 5000 medications in the market and 1000 adverse medication effects known in the literature. So, for drug–drug interactions there may be 125 billion possible adverse medication effects between all possible pairs of medications [27,28]. An individual clinical study is often required to test the nephrotoxicity of each medication or medication combination. Therefore, it is impossible to comprehensively assess medication-induced AKI through this number of clinical studies.
Data analytics can offer a solution to this problem by employing algorithms, methods, and techniques from different fields, such as data mining, statistics, and machine learning [29]. Data analytics is the investigation of raw data to gain both novel and deeper insights on associations within the data [30]. There are several tools designed and developed in recent years that employ advanced machine learning techniques to improve drug-safety science, predict adverse drug reactions, and identify drug–drug interactions [31,32,33,34,35,36]. While most clinical machine learning tools are designed to incorporate large amounts of data, they are not capable of efficiently managing ill-defined problems that need human judgment. The main challenge of using machine learning techniques lies with their lack of interpretability and transparency, hence limiting their application in healthcare settings [36].
Interactive visualizations have the potential to address this challenge by providing a means to access the data at various levels of granularity and abstraction [37]. They can be defined as computational systems that store and process data and use visual representations to amplify human cognition [38,39]. Interactive visualizations allow users to explore the underlying data, modify representations, and change different visual elements to achieve their goals. In recent years, several EMR-based systems have been developed to interactively visualize patient prescription history [40], potential adverse medication events [41], and prescription behaviors [42]. Most of these systems only represent a limited number of attributes and relationships within the data [43,44,45,46]. When working with high-dimensional EMR data, it can be useful to analyze hidden, non-explicit, and unknown relationships among all the data attributes [47,48]. One of the main issues with traditional data visualization systems is that they do not incorporate analytical processes, which are essential for recognizing hidden patterns and trends in the data. Therefore, interactive data visualization systems, alone and without data analytics components, fall short of satisfying the computational needs and requirements of users.
While beneficial, both data analytics systems, with their advanced computational capabilities and interactive visualization systems, with powerful interaction and representation mechanisms, when used individually prove inadequate in certain situations. The emergence of a type of computational system known as visual analytics (VA) has the potential to reduce the complexity of EMR data by combining the strengths and alleviating the limitations of both aforementioned systems [49,50,51]. VA can improve the capabilities of users to perform complex data-driven tasks by analyzing EMRs in such a way that would be difficult or sometimes even impossible to do otherwise. Even though VA is suitable for different healthcare activities (e.g., prediction of diseases, exploration of patient history, and identification of adverse medication events), to date, healthcare environments lag behind other sectors in the development of such systems [1,52,53].
The purpose of this paper is to demonstrate how VA systems can be designed in a systematic way: (1) to examine the association between medications and AKI, in particular, and (2) to support other clinical investigations involving EMRs, in general. To this end, we present a novel system that we have developed, called VISA_M3R3—visual analytics, VISA for multiple regression analyses and frequent itemset mining of electronic medical records, M3R3. VISA_M3R3 is intended to assist clinicians and healthcare researchers at the ICES-KDT (Kidney Dialysis and Transplantation), located in London, Ontario, Canada. We demonstrate VISA_M3R3 by investigating the process of identifying medications and medication combinations that associate with a higher risk of AKI using ICES health administrative data. To our knowledge, no prior VA system has been designed to examine how different medications affect kidney function and increase the risk of developing AKI. While few VA systems have been developed for other areas in healthcare [48,49,54,55,56,57,58,59,60], VISA_M3R3 is novel in that it integrates multiple regression models (i.e., multivariable logistic regression), frequent itemset mining (i.e., Eclat algorithm), data visualization, and human–data interaction mechanisms in an integrated fashion. As such, the design concept of VISA_M3R3 can be generalized for the development of other EMR-based VA systems that apply multivariable regression and frequent itemset mining to gain novel and deep insights into massive clinical data that exist for different health conditions (e.g., diabetes and heart failure, to name a few).
The rest of this paper is organized as follows. Section 2 provides an overview of the terminological and conceptual background to understand the design of VISA_M3R3. Section 3 describes the methodology employed for the design of the proposed VA system. Section 4 presents VISA_M3R3 by providing a description of its structure, components, and results. Finally, Section 5 discusses the usefulness and limitations of the proposed system and some future areas of application.

2. Background

This section presents the necessary background concepts and terminology for understanding the design of VISA_M3R3. VA systems fuse the strengths of automated analysis and interactive visualizations to allow users to explore data interactively, identify patterns, apply filters, and manipulate data to achieve their goals. This process is more complicated than an automated internal analysis coupled with an external visualization to show the results. It is both data-driven and user-driven and requires re-computation when users manipulate data through visual representations. VA not only relies on computational techniques and analytics but also supports human-in-the-loop mechanisms that allow users to employ human judgment to reach evidence-based conclusions. To understand the concepts of VA, we discuss the spatial structure and different modules of VA systems in this section.

2.1. Spatial Structure of Visual Analytics

To conceptualize the spatial structure of VA, Sedig et al. [39,61] proposed its processing load to be divided into at least five spaces: information space, computing space, representation space, interaction space, and mental space. The information space represents bodies of data that come from different sources. Data may come from abstract spaces (e.g., treatment plans) or concrete spaces (e.g., prescriptions). Data is then processed in the computing space, which may include (1) pre-processing techniques such as data cleaning, filtering, fusion, integration, and normalization and (2) data processing and transformation techniques such as data mining, mathematical procedures, and statistical methods. Since the underlying processing is carried out in the computing space, users of the VA system ideally do not need to be concerned with any computational work of this space. Resulting data items are then encoded into perceptible visual forms in the representation space. In order to achieve their goals through a visually perceptible interface, users can choose actions from a set of available options (i.e., the interaction space) to act upon existing visualizations in the representation space. Finally, the mental space refers to users perceiving and processing changes in the interface through carrying out mental operations such as apprehension, induction, deduction, judgment, and memory encoding.
In healthcare settings, it is important for the designer to find a balanced distribution of the processing load among the above five spaces. VA systems can offer such a balanced distribution of processing load through a proper integration of advanced analytics techniques (i.e., data mining, statistics, and machine learning) with visual representations to facilitate high-level cognitive activities and tasks while at the same time allowing users to get more involved in interactive conversation with the data through its manipulation, analysis, and synthesis [62,63,64].

2.2. Modules of Visual Analytics Systems

The information processing load in a VA system is distributed between the user and the main components of the VA system—namely, the analytics and the interactive visualization modules [65,66,67,68,69,70]. The data analytics module encompasses the computing space and deals with the analysis of data from the information space. The interactive visualization module encompasses representation and interaction spaces.

2.1.1. Data Analytics Module

Human cognition has limitations when engaged in data-intensive mental tasks, especially when the data is large and complex [68,71]. The analytics module of the VA system supports user cognition by carrying out most of the computational load. It provides users with the ability to make time-critical decisions by placing the majority of the processing load in the computing space. In a VA system, data analytics should not be solely controlled by the system. Instead, users should be involved in controlling the parameters, settings, and intermediary steps of the processing stage. The primary responsibility of the analytics module is to store, prepare, analyze, transform, and perform computerized analysis of the raw data. In the context of VA, the analytics process can be divided into three main stages: data pre-processing, data transformation, and data analysis [68].
The raw data from the information space gets processed in the pre-processing stage. Data often contains errors, exceptions, noise, and/or uncertainty. There are several possible reasons for having inaccurate data in EMRs. For instance, problems might arise from a confusing data collection manual, faulty instruments, or incorrect data entry. The data analytics module might derive incorrect patterns if the data is noisy or erroneous. Therefore, it is very important to pre-process raw EMR data retrieved from a variety of sources. Data pre-processing includes cleaning, integration, and reduction [72].
The pre-processed data is then transformed into forms appropriate for data analytics algorithms. The quality of information, knowledge, and insight extracted from a dataset can be improved by its transformation [73]. Strategies for data transformation may include smoothing, attribute construction (i.e., feature generation), aggregation, normalization, and discretization [29].
Finally, data analysis is the stage to uncover previously undetected relationships among data items and extract the implicit, previously unknown, and possibly useful information from data [74,75]. The data analysis process includes, but is not limited to, frequent itemset mining, regression, classification, and clustering. Usually, these techniques allow analysis of limited types of variables and do not support heterogeneous data [66]. VA systems overcome this limitation by incorporating interactive visualizations and human reasoning in the decision-making loop.

2.1.2. Interactive Visualization Module

Interactive visualization is an integral part of VA for organizing data items in the information space and mapping them to visual structures. Interactive visual representations provide users with the ability to change and modify the displayed data and to guide the analysis process. This, in turn, will set off a chain of internal reactions that lead to the execution of additional data analysis processes. Interactive visualizations can potentially bridge the gap between the internal mental representation of the user and the external representations of the system by allowing the information processing load to be distributed between the user and the system.
Design of visualizations is straightforward when dealing with simple tasks. As tasks require completion of one or more subtasks, they become more complex. As tasks become more complex, design becomes less apparent, particularly when dealing with massive amounts of heterogeneous data [70,76]. To support complex, EMR-driven tasks, visualizations require some initial analysis [66]. For instance, the task of identifying high-risk medications for a certain medical condition includes sub-tasks such as finding associations between the medical condition and medications (through data analysis), observing their relationships (through visual representations), and filtering medications that are associated with the medical condition (through analysis and visualization). Furthermore, because external structures of data affect how users perform tasks, another challenge involves determining how to organize a large number of data items in the visual representations. To support the performance of complex tasks, VA combines advanced, behind-the-scene analytics techniques with interactive external visualizations that organize data items [77,78].

2.3. Visual Analytics and Analytical Reasoning

User-triggered actions, consequent reactions, and discourse with information are essential in a VA system whose function is to facilitate users’ analytical reasoning activities—activities that refer to both rational and logical analysis of data as well as evaluation of results. Such activities also involve analogical, deductive, and inductive reasoning to reach conclusions [70], and emerge from a series of lower-level tasks (e.g., developing hypotheses or identifying relationships among data elements) [63,79]. In order to reach a conclusion, some of these lower-level tasks take place in an iterative and non-linear manner depending on cognitive needs and overall goals of the user [70]. Generally speaking, analytical reasoning can be viewed as transforming given data into information, knowledge, and insight [70,80]. This derived knowledge and insight serves as a foundation for other cognitive activities such as decision-making or problem-solving [72,81].
EMRs contain large bodies of complex data, and, oftentimes, EMR-driven tasks are ill-defined. Thus, users have to rely on their experience, knowledge, and judgment to perform complex activities (i.e., decision-making and problem-solving) in a healthcare setting [82]. Human-in-the-loop mechanisms involving interaction with the visual and analytical modules of VA systems can thus help healthcare activities [71].

3. Materials and Methods

This section describes the methodology we have employed to design the proposed VA system, namely VISA_M3R3. For our EMR-based data, we use Ontario’s healthcare databases housed in the ICES facility to illustrate how VISA_M3R3 can be used to identify AKI-associated medications and medication combinations among older patients. In Section 3.1, we provide an overview of the design process and participants. We then describe data sources and cohort entry criteria in Section 3.2 and Section 3.3, respectively. Section 3.4 explains the implementation details of our VA system. Finally, in Section 3.5, we introduce the components of VISA_M3R3 and briefly describe how the overall system works, which is also discussed more extensively in Section 4.

3.1. Design Process and Participants

Healthcare tasks usually include both well- and ill-defined problems. The well-defined tasks have specific goals, clear expected solutions, and, oftentimes, a single solution path. On the contrary, ill-defined tasks do not have clear goals, expected solutions, or solution paths [83].
To help us understand how healthcare practitioners perform real-world tasks, and to help us conceptualize and design VISA_M3R3, we adopted a participatory design approach. Participatory design is a co-operative approach that involves all stakeholders (e.g., partners, end-users, or customers) in the design process to ensure the end product meets their needs [84]. A clinician-scientist, a statistician, an epidemiologist, data scientists, and computer scientists were involved in the design and evaluation process of VISA_M3R3. During the initial stage in the participatory design process, we realized that healthcare experts solve ill-defined problems in many different ways. It is difficult and sometimes impossible to determine a single correct problem-solving strategy (i.e., analytics and/or visualization techniques) for ill-defined tasks. Different techniques have their strengths and weaknesses, and there are different criteria to find out which technique is more appropriate for a specific problem. As such, we asked experts to provide us with (1) a list of varying real-world, EMR-driven tasks that they perform, (2) analytics techniques they usually rely on to accomplish those tasks, (3) visualization techniques with which they are familiar, and (4) formative feedback on design decisions. In our collaboration with experts, we recognized two high-level tasks to consider in designing VISA_M3R3 system. (1) They would like to study the relationships between prescribed medications and AKI; (2) They would like to identify commonly prescribed medication combinations and understand the impact of different combinations on AKI. We were told that healthcare experts usually use different regression techniques to accomplish these types of tasks. Since the system has been designed to assist clinicians and healthcare researchers at the ICES-KDT program, we decided to incorporate the analytical and visualization techniques with which they are more familiar. This was essential to build trust between the proposed system and its end-users.

3.2. Data Sources

For the particular version of VISA_M3R3, we are primarily interested in analyzing medications prescribed to older hospitalized patients in Ontario. Accordingly, we obtained patient characteristics, prescriptions, and hospital admission data from five health administrative databases. We used the Ontario Drug Benefit Program database to get medication use data. We acquired patient characteristics data from the Registered Persons Database, which contains demographic data on all Ontario residents who have ever been issued a health card. We obtained hospital admissions and emergency department (ED) visit data from the Canadian Institute for Health Information Discharge Abstract Database and National Ambulatory Care Reporting System, respectively. The International Classification of Diseases, ninth (pre-2002), and tenth revision (post-2002) codes, was used to identify the baseline comorbidities and incidence of AKI from ED visit and hospital admission data.

3.3. Cohort Entry Criteria

We developed a cohort of individuals aged 65 years or older who were admitted to hospital or who visited the ED between April 1, 2014 and March 31, 2016. The ED visit date or hospital admission date served as the index (cohort entry date). If an individual had multiple ED visits or hospital admissions, we selected the first incident. Individuals with an invalid healthcare number, age, and/or sex were excluded from the cohort. A 120-day look-back window from the index date was used to capture the associated medication use data. We used a 5-year look-back window to identify relevant baseline comorbidities.

3.4. Implementation Details
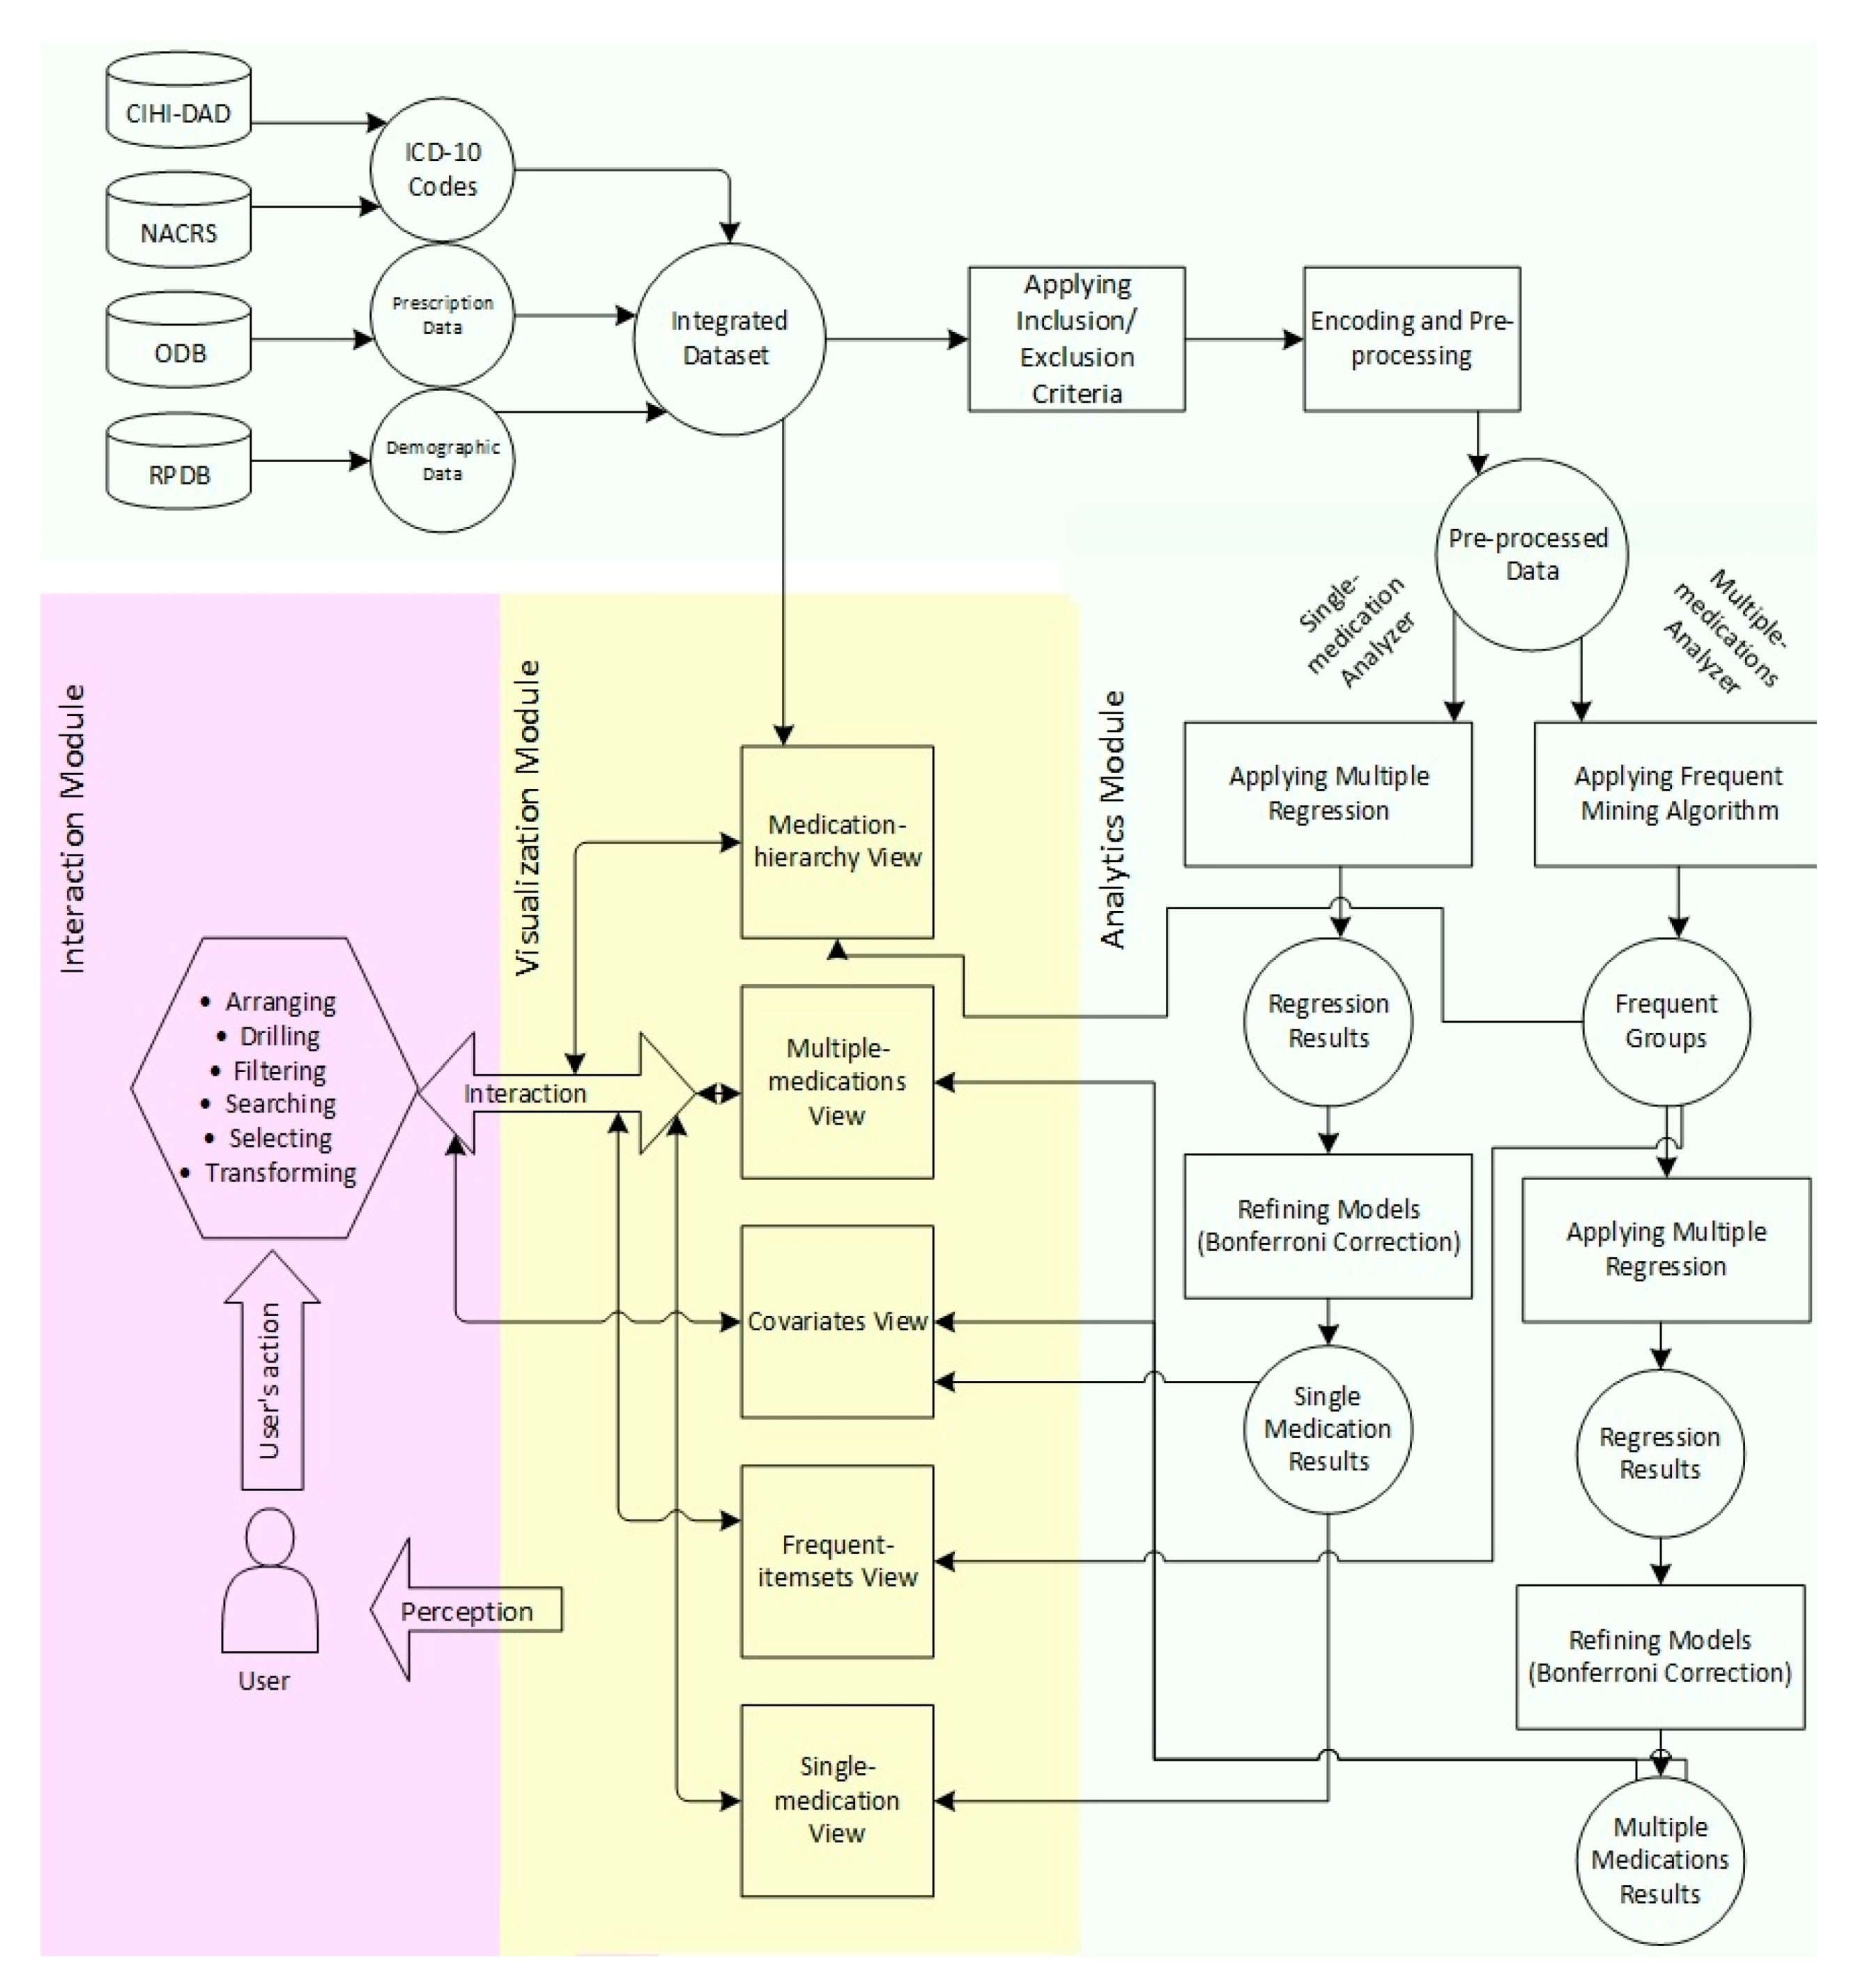
The current VISA_M3R3 system is implemented in HTML, JavaScript library D3, standard PHP programming language, and R packages. R was used to develop the Analytics module. Html and D3 were used to create various external representations in the Visualization module. The communication between these two modules was implemented using PHP and JavaScript.
Most of the data analytics components were developed in R (version-3) because it (1) provides extensive support for carrying out data mining operations such as regression and frequent itemset mining, (2) is available in ICES workstations, (3) has a vast array of libraries, (4) is a platform-independent tool, (5) is an open-source tool, and (6) is constantly growing and providing updates whenever new features are available.
We used D3 to implement external representations of the Visualization module because of the following reasons. (1) D3 offers a data-driven approach to help users attach their data to the DOM (document object model) element. (2) It allows users to get access to full capabilities of modern web-browsers. (3) D3 uses a functional style that enables users to reuse JavaScript code and add functionalities. (4) It is compatible with other programming languages and platforms that have been used in this system. (5) D3 is a free and open-source software.

3.5. Workflow

As shown in Figure 1, VISA_M3R3 has three modules: Analytics, Visualization, and Interaction. The Analytics module is composed of two components: (1) single-medication analyzer and (2) multiple-medications analyzer. The Visualization module is composed of five views: (1) single-medication view, (2) multiple-medications view, (3) frequent-itemsets view, (4) covariates view, and (5) medication-hierarchy view. The Interaction module provides users with six main actions: (1) arranging, (2) drilling, (3) filtering, (4) searching, (5) selecting, and (6) transforming. The basic workflow of the system is as follows.
First, an integrated dataset is created from different EMR databases stored at ICES. Next, the inclusion and exclusion criteria are applied to build the final cohort. The variables in the comorbidity and prescription data are then encoded and transformed into forms appropriate for analysis. After applying pre-processing techniques, we split the dataset into two groups. One contains the single medication data, and the other contains medication combination data; the latter is generated from the frequent itemset mining algorithm. We develop a number of multivariable regression models on both groups of data. The models are then validated through Bonferroni correction and mapped into respective visual representations. We developed five views to represent data items created from different analysis techniques. The output of the single-medication and multiple-medications analyzers are encoded into two scatter plots in the single-medication and multiple-medications views, respectively. The frequent-itemsets view represents the result of the frequent itemset mining algorithm using a chord diagram. The covariates view allows users to control the information presented in other views though sliders. The medication-hierarchy view includes a data table to display additional information about data elements from the original dataset. Users are allowed to perform a number of actions on the visual representations to manipulate data items. For instance, users can highlight and/or filter out certain items and drill down into the details of the selected data elements in different views.

4. Design of VISA_M3R3 and Results

In this section, we describe the three main components of VISA_M3R3 as well as some results. Section 4.1 (Analytics module) explains how the data is processed and offers a summary of its results. Section 4.2 (Visualization module) describes VISA_M3R3’s interfaces and discusses how the system helps users in interpreting results. Finally, Section 4.3 (Interaction module) illustrates how users can interact with the displayed data.

4.1. Analytics Module

We used VISA_M3R3 to analyze ICES’ EMRs to identify individual medications and medication combinations that are associated with AKI. Our system aims to facilitate understanding of relationships among medications, medication combinations, and AKI. The Analytics module of VISA_M3R3 performed an individual and group analysis using logistic regression and frequent itemset mining to achieve this goal.

4.1.1. Single-Medication Analyzer

Single-medication analyzer includes the regression models created to identify the association between each medication and AKI. In order to capture an accurate association, we included the demographic and comorbidity variables as potential covariates in the models. For demographics (i.e., the study of a population based on certain non-medical factors), we included the following variables in the models: age, sex, income quintile, rural location, and long-term care. For comorbidity (commonly defined as any distinct additional disease or condition that has existed during the clinical course of a patient who has the first disease or condition under observation), we included the following variables in the models: diabetes mellitus, hypertension, heart failure, coronary artery disease, cerebrovascular disease, peripheral vascular disease, chronic liver disease, chronic kidney disease, major cancers, and kidney stones. We obtained the medication prescription data from the Ontario Drug Benefit Program database. This database includes medication name, medication dose, date filled, and route-of-administration of the prescriptions. We identified 595 different medications by analyzing prescriptions that were filled 120 days before the index date. Thus, we created 595 binary variables to record the medication use data for each medication and each patient. We also gathered the class and subclass information of these medications from the literature.
We combined data from different sources into a single dataset. The combined dataset contained 5 demographic, 10 comorbidity, and 595 medication variables for each patient included in the cohort. In total, there were 926,005 unique patients in the dataset. Next, we applied the necessary pre-processing and transformation techniques on the combined dataset to make it ready for the regression analysis. We used the “glm” function in R packages to develop separate multivariable logistic regression models [85] for each medication in the dataset. Thus, the regression formula included AKI as the response variable and medication, demographics, and comorbidities as predictor variables. The “family” argument in the “glm” formula was set to “binomial”. We used the “summary” function to obtain the estimate, p-value, standard error, and z-score for each coefficient. In addition, the “confit” function was used to compute 95% confidence intervals and odds ratio.
VISA_M3R3 provides users with the ability to compare regression models based on their odds ratios, confidence intervals, p-values, and standard errors. Odds ratio measures the association between medication and AKI. A high odds ratio for a specific medication indicates a stronger positive association between that medication and AKI. A list of statistically significant medications was created by filtering models based on the p-value of the medication variable’s coefficient. A small p-value indicated that it was unlikely that an observed relationship between the predictor (i.e., medication) and response variable (i.e., AKI) was due to chance. Out of 595, we found 55 medications that were strongly associated with AKI. In order to avoid false positives when comparing multiple independent models, we made the alpha value lower based on the Bonferroni correction to account for the number of comparisons being done. A p-value less than 8.4 × 10⁻⁵ (divide 0.05 by 595) was considered to be statistically significant in this context. Next, we calculated the frequency of each medication in the list. Data items produced through the single-medication analyzer included odds ratios, confidence intervals, p-values, standard errors, and usage frequencies of 55 medications. Users of VISA_M3R3 could explore and manipulate these data items to make sense of how an individual medication can affect AKI. Users’ sensemaking tasks included, but were not limited to, identifying medications with high odds ratio and lower p-value, understanding the comparative risk of medications, assessing the behavior of medication class or subclass, and exploring data items at various levels of abstraction.

4.1.2. Multiple-Medications Analyzer

In order to identify the medication combinations that are associated with AKI, we first prepared a dataset of frequently prescribed medications. Since we had 595 individual medications, the total number of combinations was a large number. Therefore, we used the Eclat algorithm [74] to obtain frequent combinations with a support of 0.07%. Eclat is a frequent itemset mining algorithm that employs a depth-first search to discover groups of items that frequently occur in a transaction database. An itemset that appears in at least a pre-defined number of transactions is called a frequent itemset. At this stage, a total of 24,212 frequent itemsets (i.e., medication groups) were produced from 595 individual medications.
A number of binary variables were created to record the usage of the mediation groups. We set the value of a particular medication group for a patient when that patient was dispensed all medications within the group within 120 days before the index date (at least once per medication). Next, we applied a multivariable logistic regression model on each medication group to identify potential accumulative nephrotoxicity. The formula included group variables, individual medication variables that belong to the group, demographic variables, and comorbidities as predictors. Statistically significant medication groups were identified by filtering the models based on a Bonferroni-corrected alpha value (divide 0.05 by the number of medication groups). We also calculated the usage frequency of 78 medication groups that were found to be statistically significant.
In the multiple-medications analyzer, we employed a combination of frequent itemset mining and logistic regression to generate data items such as frequent medication combinations, statistically significant medication groups, p-values, odds ratios, confidence intervals, and standard errors. These data items allowed users to understand the synergistic effect of a combination of different medications on AKI. Users’ sensemaking tasks included, but were not limited to, identifying medication groups with high impact on AKI, understanding the comparative risk of medications within a group, and exploring data items at various levels of abstraction. VISA_M3R3 organizes data items in different visual representations to allow users to perform these tasks.

4.2. Visualization Module

VISA_M3R3 (Figure 2) is composed of five main views: single-medication view, multiple-medications view, covariates view, medication-hierarchy view, and frequent-itemsets view. These views are supported by a number of selection controls, such as search bar and collapsible tree structures. Each of these visualizations represents an important aspect of the Analytics module. In this section, we discuss how data items generated in the Analytics module are encoded as visual representations to allow users perform the activities and tasks mentioned in the previous section.

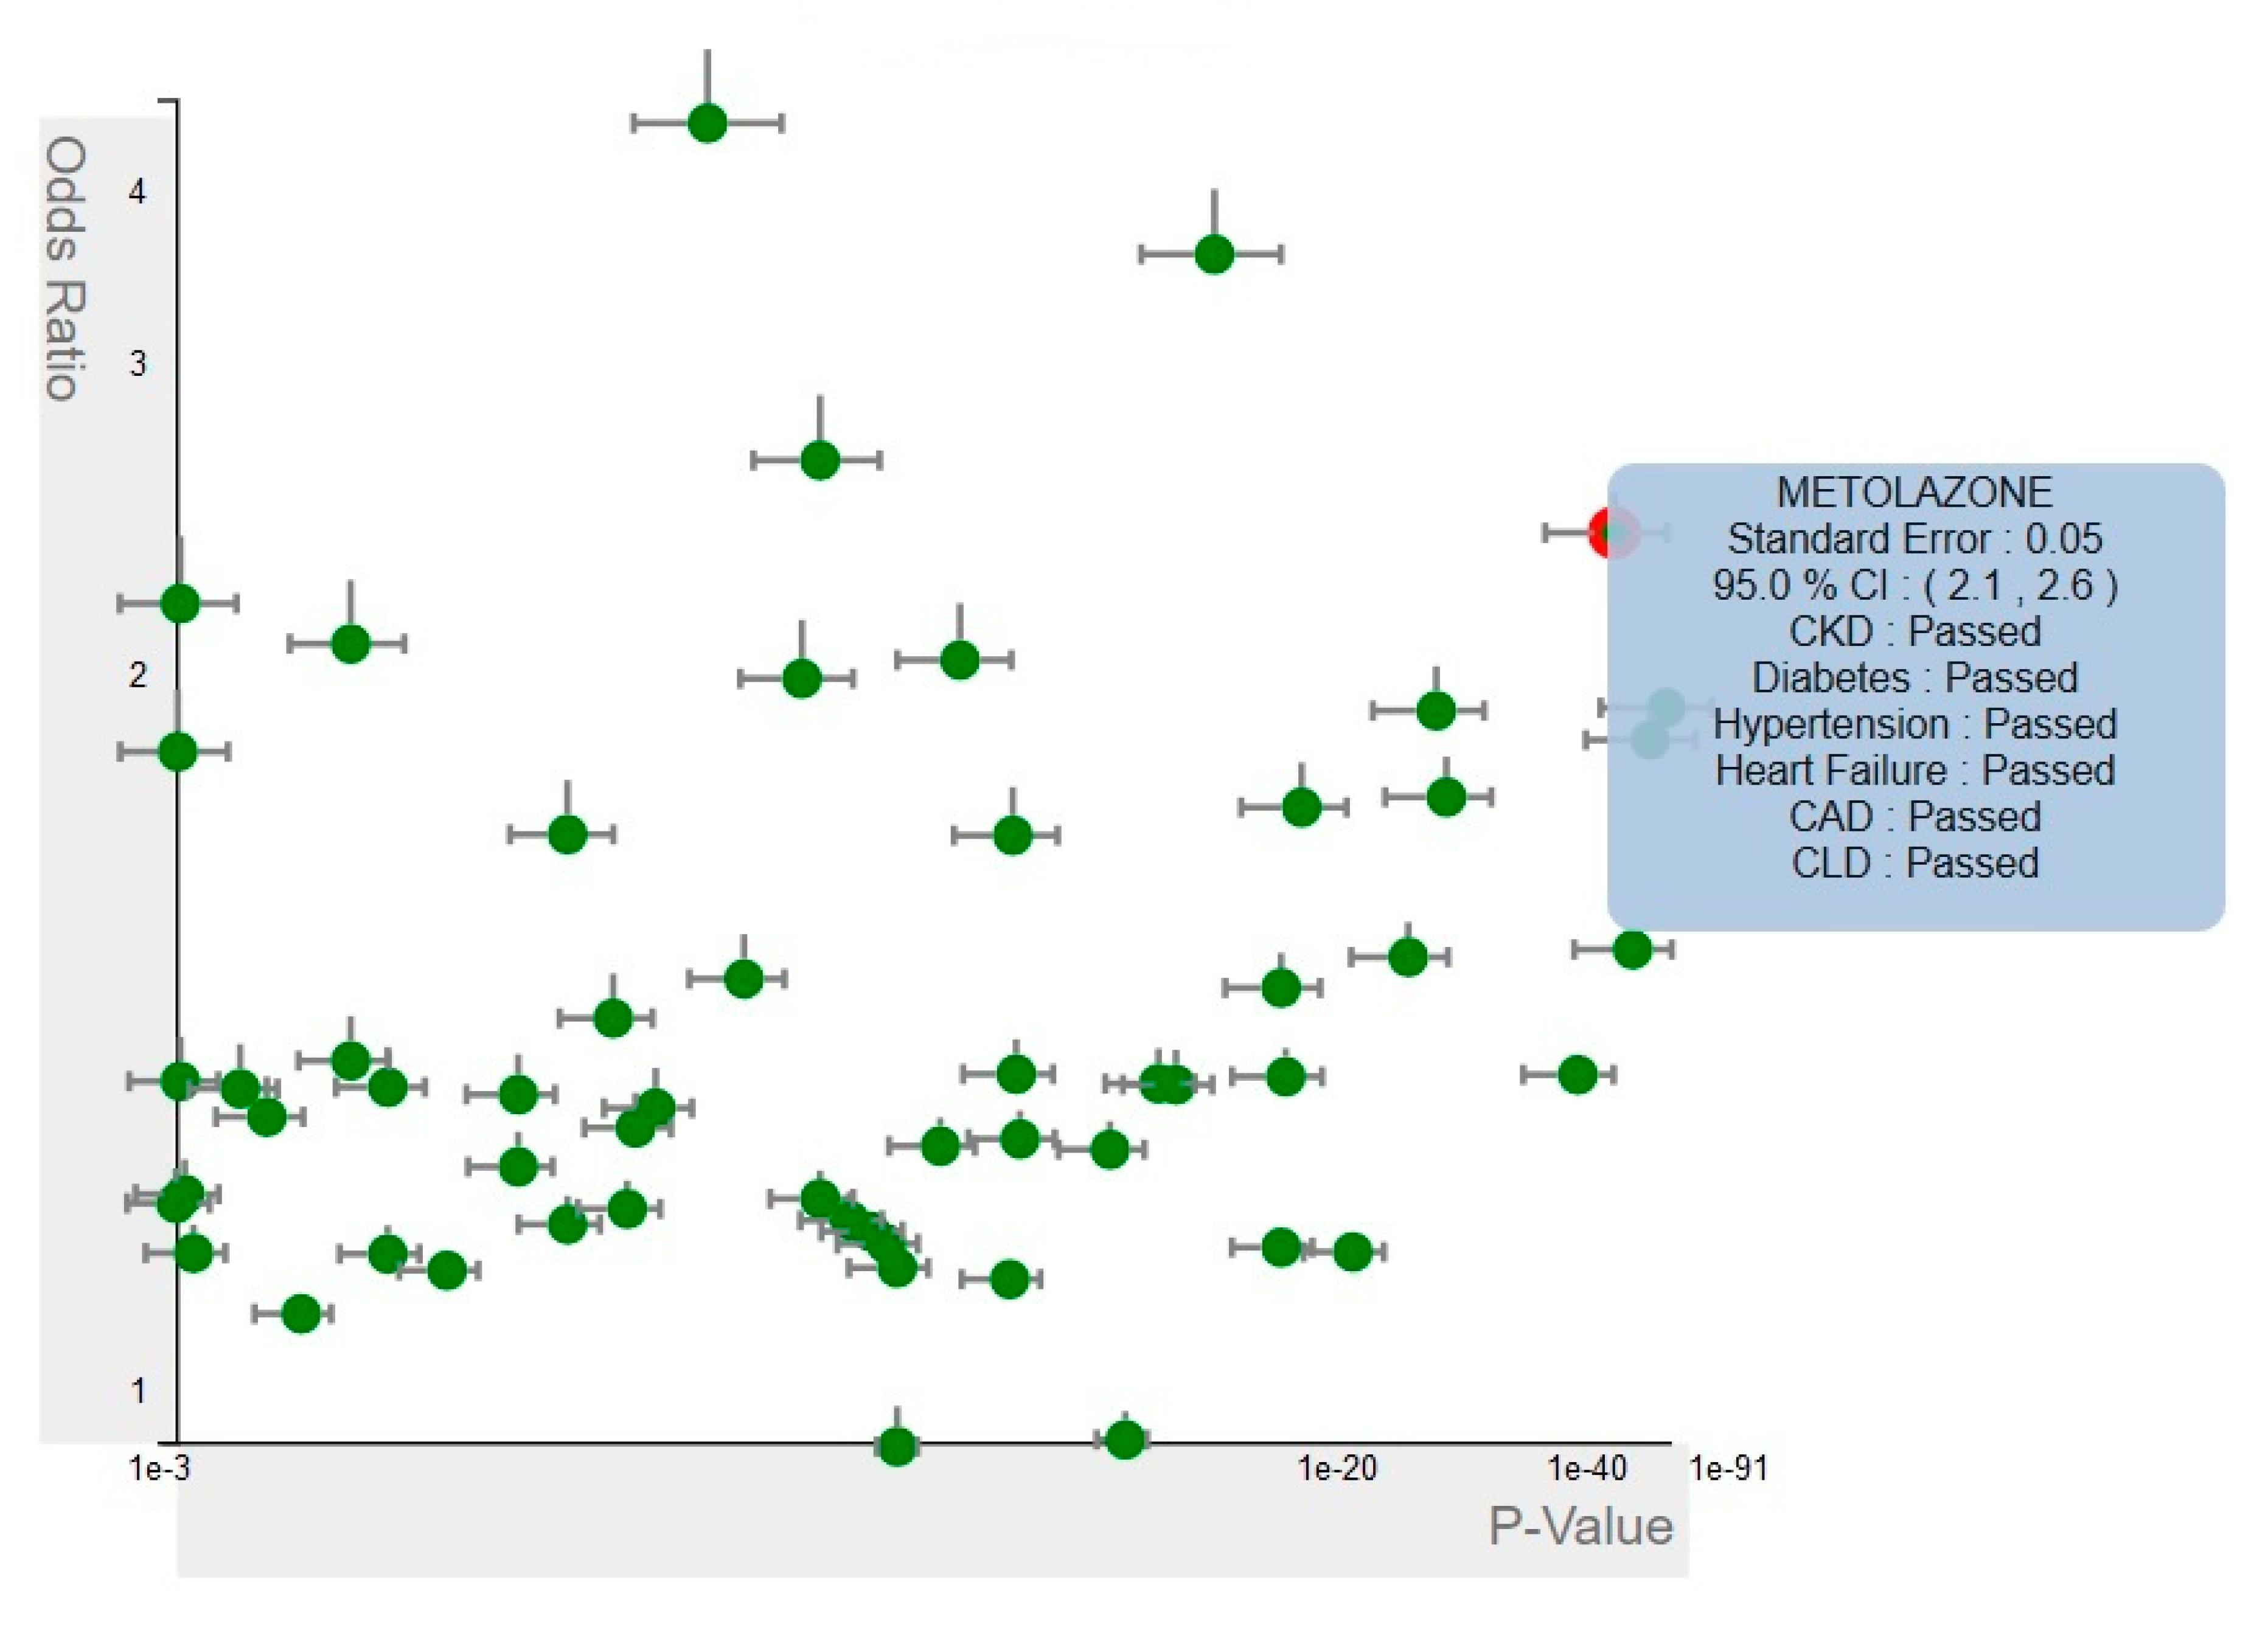
4.2.1. Single-Medication View

Single-medication view uses a scatter plot to represent the results of individual regression models for all the medications, as displayed in Figure 3. The generated scatter plot displays each model in proximity to each other based on their p-value and odds ratio. A linear scale is used for the vertical axis (odds ratio), whereas a log scale is used for the horizontal axis (p-value) since the p-value is exponential. Medications that are plotted closer together affect the risk of developing AKI in a similar manner. The regression model for each medication is encoded as a glyph where horizontal lines on both sides of each circle represent the confidence interval, and the vertical line shows the standard error of the model. The single-medication view enables users to identify high-risk medications that are associated with AKI and understand the comparative risk of these medications. For instance, the glyph in the top-right corner with a p-value of 1 × 10−45 and an odds ratio of 2.4 represents Metolazone. These values suggest that the odds of developing AKI for a patient using this medication are more than two times higher than a patient with similar conditions who is not using it.

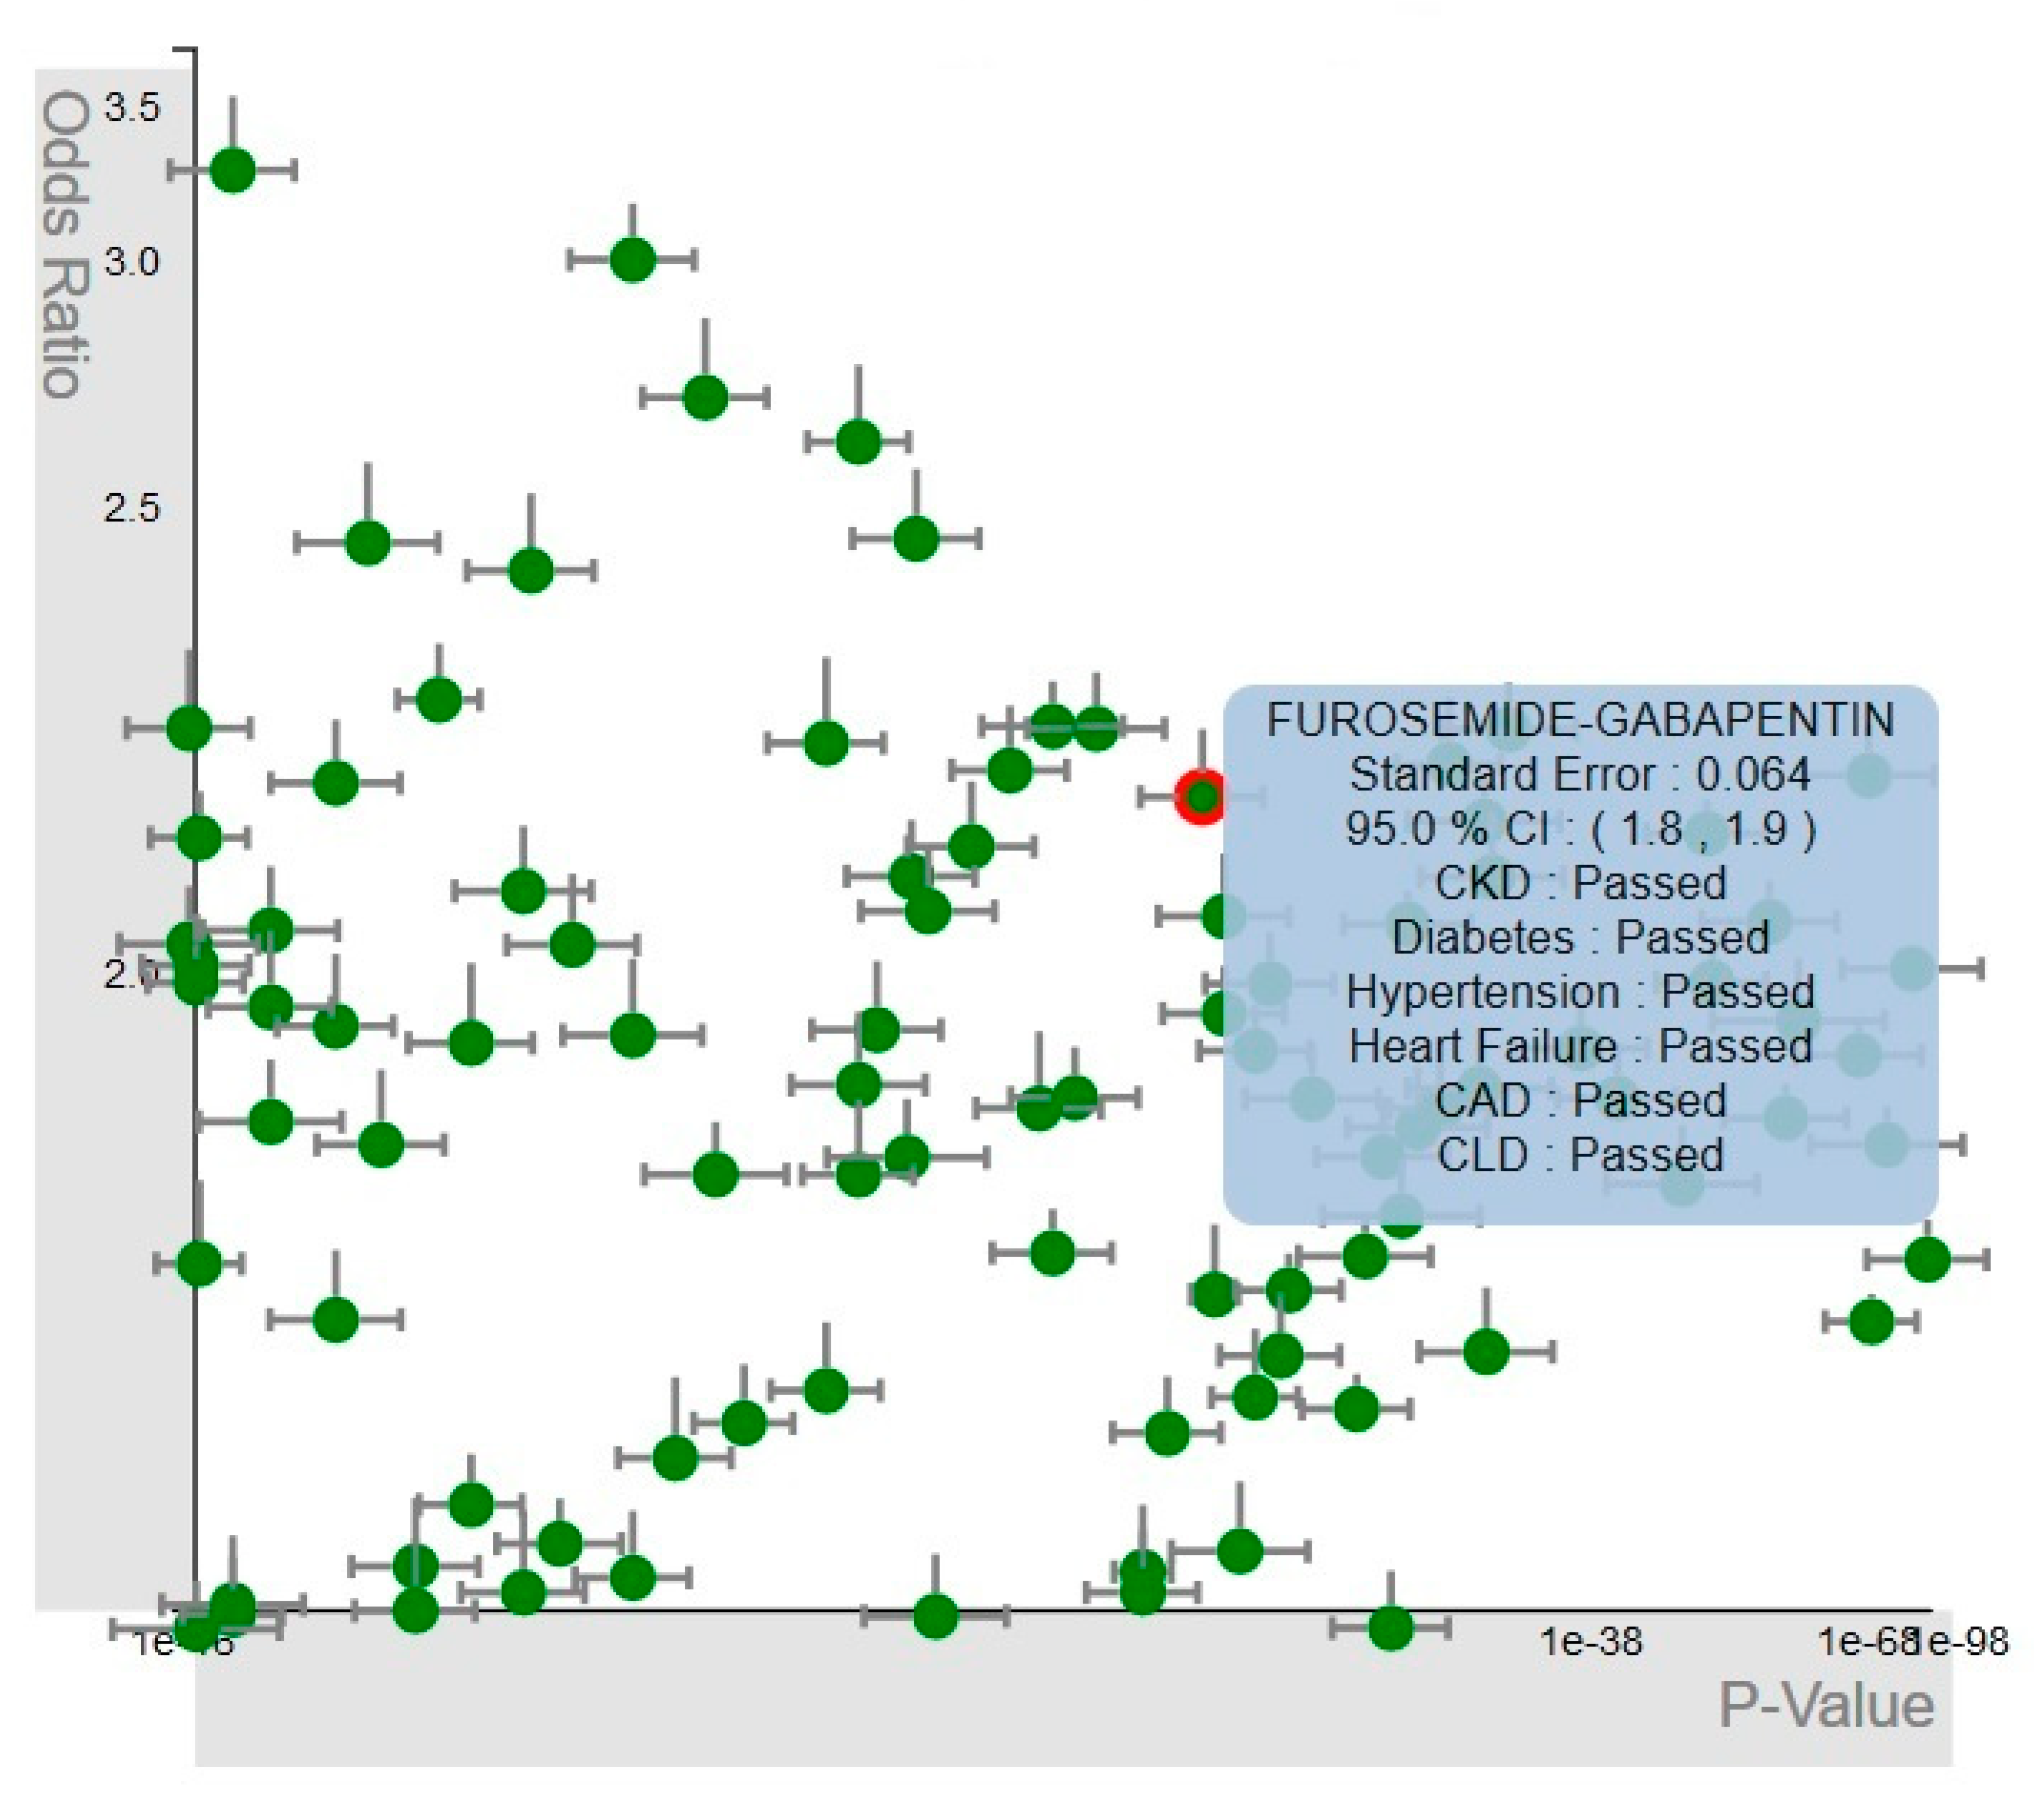
4.2.2. Multiple-Medications View

The multiple-medications view, displayed in Figure 4, uses another scatter plot to represent the results of the regression analysis of groups that are created by the frequent itemset mining algorithm. Each glyph in this scatter plot encodes a medication group model. Similar to the single-medication view, horizontal lines on both sides of each circle in the glyph represent the confidence interval, and the vertical line shows the standard error of the model. We map the p-value and odds ratio to the x- and y-axis, respectively. The multiple-medications view provides users with the ability to detect medication groups that are associated with AKI. For instance, through frequent itemset mining analysis, we find that the pair of Gabapentin and Furosemide medications is frequently prescribed together. As shown in Figure 4, this pair appears to be associated with AKI with a p-value of 1 × 10⁻²⁶.

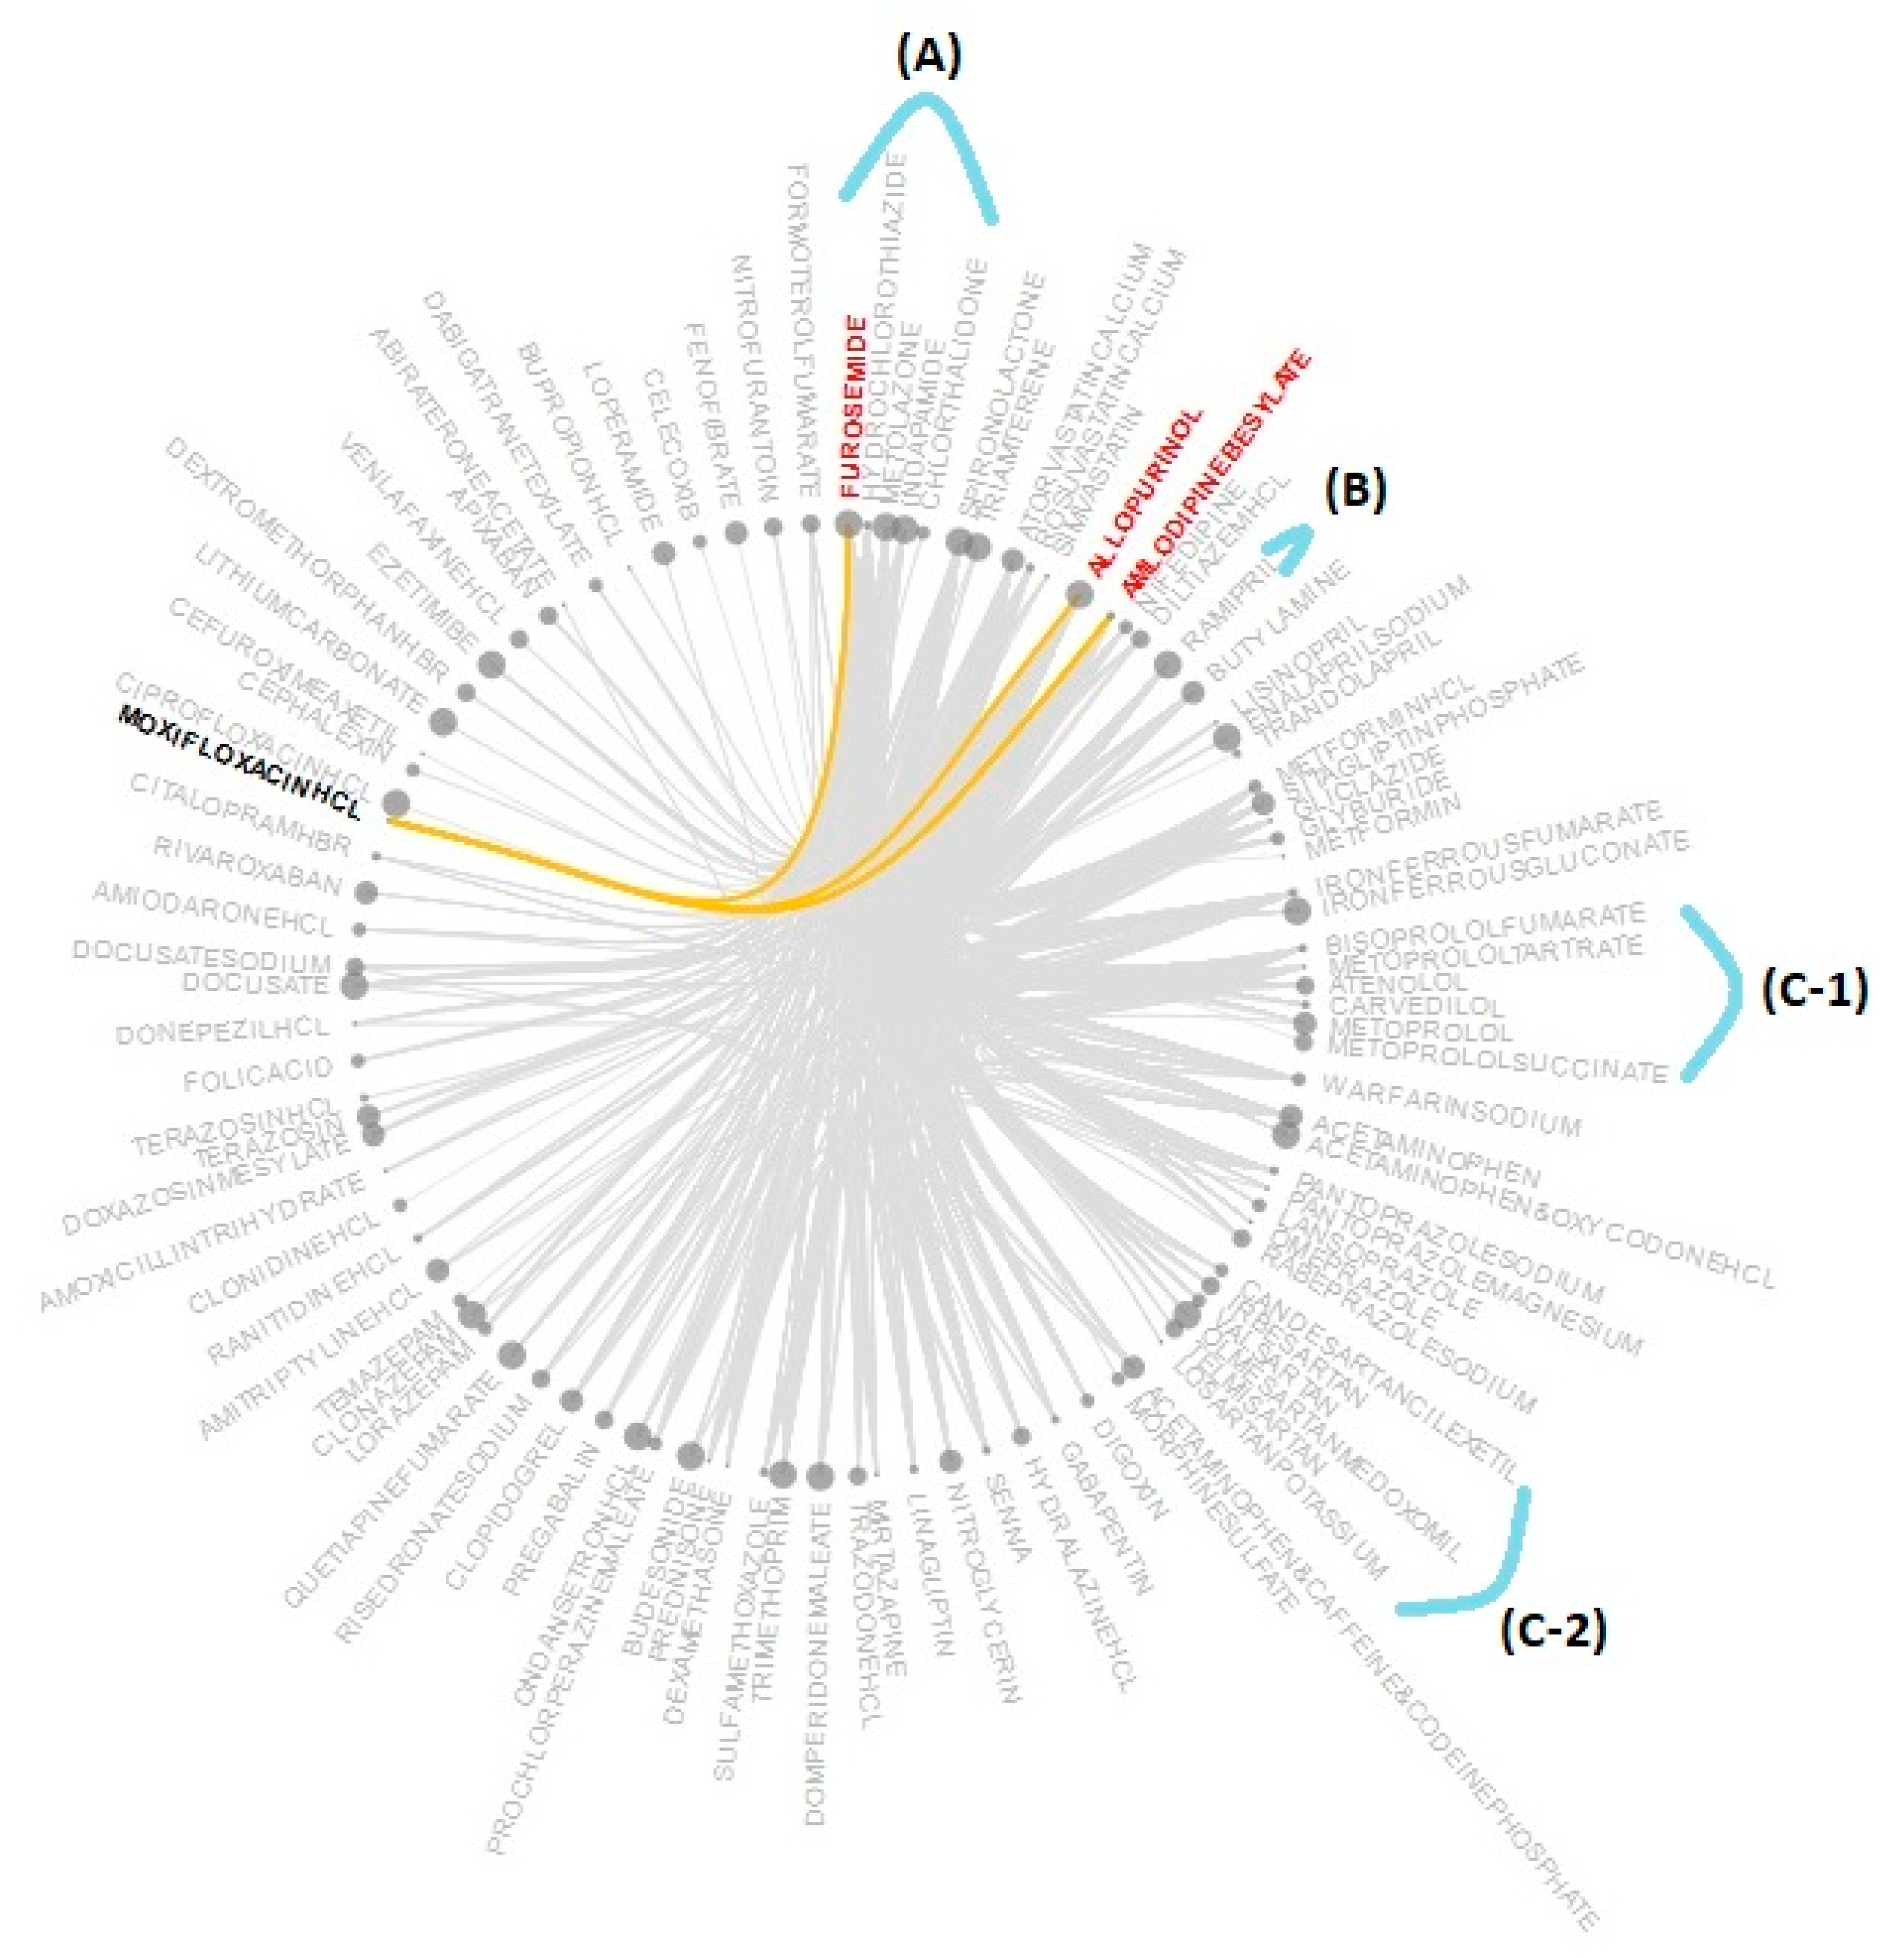
4.2.3. Frequent-Itemsets View

Frequent-itemsets view represents the result of the frequent itemset mining analysis by showing all possible combinations of the most frequent items using a chord diagram. As shown in Figure 5, medications are mapped to nodes along the circumference of the circle. Each node consists of an individual circle and a text field showing the name of the medication. Each chord (link) connects two nodes (medications) if they co-occur in the dataset within a certain timeframe. For instance, as shown in Figure 5, there are links between Moxifloxacin Hcl and three other medications (Furosemide, Allopurinol, and Amlodipine besylate) because these three medications have been prescribed with Moxifloxacin Hcl more than a certain number of times (0.07 percent of the total population) within 120 days prior to the index date.
The size of the circle of each node displays the frequency of the medication in the dataset. Higher usage frequency of a certain medication results in a larger radius for the circle representing that medication. This allows users to visually compare medications based on their use frequency. For instance, a relatively large radius of the circle representing Ramipril indicates that it is one of the frequently prescribed medications in Figure 5B.
The nodes that belong to the same subclass are placed close to each other separated by spaces. This enables users to visually identify the nodes that share common characteristics (i.e., belong to the same subclass). For instance, users can detect that Furosemide, Hydrochlorothiazide, Metolazone, Indapamide, and Chlorthalidone are all diuretics; therefore, they are placed in the same group (Figure 5A). The frequent-itemsets view also reveals subclasses that are composed of a higher number of AKI-associated medications. It can be observed from Figure 5C-1,C-2 that there are two subclasses (Angiotensin and Beta-blockers) that contain six medications that are associated with AKI.

4.2.4. Covariates View

The covariates view is composed of several sliders that filter data items with respect to different covariates involved in the regression model. The number of sliders depends on the number of covariates that are found to be statistically significant based on the result of the regression analysis. As displayed in Figure 6, six sliders were generated to create control for cancer, diabetes, hypertension, heart failure, coronary artery disease, and coronary liver disease.
Each slider included in the covariates view had three components (a rectangle, vertical lines, and two arc-shaped handles). The rectangle contained the other two components in it. The length of the rectangle represented a linear or log scale, depending on the type of variable it was representing. A linear scale was used when the slider represented the odds ratio of a covariate. We used a log scale to represent the p-value of a covariate. All sliders were generated based on the p-value of the covariates. The vertical lines in the rectangles represented the regression models of both single-medication and multiple-medications analyzers. The placement of the line on the horizontal axis depends on the p-value or odds ratio of the covariate in the corresponding model. For instance, in the slider representing diabetes (second from the top in Figure 6), most of the models are densely clustered in the right corner. This indicates that diabetes has a high impact on the association between medications and AKI. Two arc-shaped handles are placed on both ends of the rectangle to allow users to choose a range of values on the horizontal axis.

4.2.5. Medication-Hierarchy View

The medication-hierarchy view contains a data table to provide a list of medications that have been selected through other views, as displayed in Figure 7. The table has three sortable columns for medications, subclasses, and higher-level classes. Each subclass contains a set of medications that share common chemical structures and mechanisms of action, and/or are used to treat similar diseases. A class contains medication subclasses that can be grouped together because of their similarity.

4.3. Interaction Module

The Interaction module of VISA_M3R3 is intended to support human-in-the-loop processes of VA. Using the many interactions provided by this module, users can gain insight into the data and manipulate the incorporated data analysis techniques. In this section, we will explore these interactions and discuss how they assist users in identifying high-risk medications and understanding the association between medication groups and AKI. We describe interactions that can be performed in each of the views discussed in the previous section. These interactions not only affect displayed data at the selected view but also change the representation of the data in other views.

4.3.1. Single-Medication View Interactions

As shown in Figure 8, the glyphs representing regression models of individual medications are placed very close to each other in the scatter plot. It is sometimes difficult for users to distinguish between models when the glyphs are densely clustered. In order to address this issue, we used the Cartesian fisheye distortion technique on both axes of the scatter plot. Fisheye distortion enables users to zoom in on small areas of the plot without losing sense of its overall structure. Users can apply fisheye distortion by moving their mouse pointer over the grey rectangular areas on both axes of the scatter plot. Fisheye distortion magnifies the local region around the mouse continuously. Users have the ability to enable and disable the fisheye distortion action by clicking on the grey rectangular areas. The color of the rectangular area gets lighter when the fisheye distortion action is disabled. As shown in Figure 8, fisheye on the top-left scatter plot is disabled (light grey rectangles) and bottom-left scatter plot is enabled (relatively dark grey rectangles).
The model selection interaction of the single-medication view affects all the other views. Using this interaction (Figure 8), users can highlight a single medication model throughout VISA_M3R3 in order to (1) determine positions of group models that include the selected medication in the multiple-medications view, (2) detect the position of the selected medication in the covariates view, (3) observe the class and subclass of the selected medication in the medication-hierarchy view, and (4) identify other medications that are frequently prescribed with the selected medication in the frequent-itemsets view. The selected medication is highlighted using the red color in the top-left scatter plot in Figure 8. The glyphs representing corresponding groups in the bottom-left scatter plot, vertical lines representing the medication in the covariates view, and links between selected medication and other frequently used medications in the frequent-itemsets view are all highlighted using the amber color. The utility of this interaction is when users are interested in learning more about a medication that is strongly associated with AKI. They would select a glyph at the top-right corner of the scatter plot, whereupon VISA_M3R3 would highlight and display the relevant information associated with that glyph. Another interaction supported by this view is hovered drilling. This interaction enables users to drill into scatter plot glyphs and get additional information about their corresponding model (Figure 3).

4.3.2. Multiple-Medications View Interactions

We designed the interactions of the multiple-medications view in a similar manner to the interactions of the single-medication view. The only difference was how we designed the selection interaction. The group model selection interaction affects all the other views. Using this interaction (Figure 9), users can highlight a group model throughout the system in order to (1) identify the position of single models included in the selected group in the single-medication view, (2) determine the position of the selected group in the covariates view, (3) observe the class and subclass of medications included in the selected group in the medication-hierarchy view, and (4) highlight the nodes and links representing the group in the frequent-itemsets view. To maintain consistency across all views, the color scheme of the multiple-medications view is similar to the single-medication view. This interaction can be used when users want additional information about a specific group model; they can select the corresponding glyph and observe whether medications included in the selected group are associated with AKI individually in the single-medication view.

4.3.3. Covariates View Interactions

The single-medication and multiple-medications analyzers produce a set of regression models. These models can be described by a certain number of common attributes (e.g., p-value and odds ratio of each covariate) because all of them include the same set of demographic and comorbidity variables as their covariates. The value of an attribute changes based on how each covariate affects the model. It is essential to understand the impact of covariates on both single and group models.
Users can create complex queries composed of several simpler queries related to attributes of different covariates. In each simple query, users apply a filter to the models by selecting a specific range in each slider. Figure 10 shows an example of a complex query involving p-value of six covariates. Users can drag both ends of the given sliders to choose a certain range. The color of the range selector changes from green to red when a slider is active. The color of the vertical line representing the model changes from grey to amber when the corresponding model satisfies the criteria of the complex query. Also, the medication-hierarchy view displays the list of models that meet the criteria of the complex query.
In many situations, users struggle to choose appropriate ranges for the sliders. As a result, the query might produce an empty or a limited result set. In order to address this issue, we implemented a sensitivity encoding mechanism in VISA_M3R3 [86]. The sliders are set to their maximum and minimum ranges by default. In this case, the color of the glyphs in both scatter plots is set to green because all models satisfy the query. The color of the glyph in the scatter plots encodes the number of simple queries its corresponding model satisfies in the covariates view, as shown in Table 1 and Figure 10.

4.3.4. Frequent-Itemsets View Interactions

The selection interaction of the frequent-itemsets view affects the single-medication view, covariates view, and medication-hierarchy view. Using this action (Figure 11), users can select a single medication from the chord diagram by clicking on its corresponding node in order to (1) identify other medications that are frequently prescribed with the selected medication in the frequent-itemsets view, (2) understand the association between the selected medication and AKI in the single-medication view, (3) determine the position of the selected medication in the covariates view, and (4) observe the class and subclass of the selected medication in the medication-hierarchy view. Figure 11 shows an example of this interaction. Selecting Moxifloxacin Hcl would highlight the links and the names of the other medications (i.e., Furosemide, Allopurinol, and Amlodipine besylate) that are frequently consumed with Moxifloxacin Hcl.

4.3.5. Medication-Hierarchy View Interactions

Medication-hierarchy view supports two interactions as shown in Figure 12. Users can sort the table based on medication name, subclass, or class by clicking on the corresponding column header. For instance, if they click on “Medication”, medication names in the table get sorted alphabetically. They can also sort in the opposite order by clicking on the same header again. In addition, users can click on any row in the table to select the corresponding medication or medication groups. Selected medications get highlighted in all other views.

4.3.6. Selection Controls

Selection controls include a search bar, a collapsible tree structure, and several buttons to control the information displayed in different views (top-right corner of Figure 12). If users are interested in learning about a specific medication, they can enter the name of that medication (or part of the name) in the search bar and the information related to that medication gets displayed in the medication-hierarchy view. Users can expand the tree structure by clicking on the “+” icon at the top-right corner to get a menu of medication subclasses. Each item in the menu is linked to a checkbox. It is possible to limit data items displayed in other views by selecting these checkboxes. For instance, as shown in Figure 12, users have selected a number of subclasses such as Iron preparations, Vasodilator antihypertensive, and Antiemetics and Antinauseants in the collapsible tree structure to limit the number of data items shown in the scatter plots, data table, and chord diagram.

5. Discussion

In this paper, we have shown how VA systems can be designed to address the challenges of prescription data stored in EMRs in a systematic way. To achieve this, we have reported the development of VISA_M3R3, a VA system designed to assist medical researchers at ICES’ KDT program. VISA_M3R3 incorporates three main components: an Analytics module, made up of single-medication analyzer and multiple-medications analyzer; a Visualization module, made up of five views: single-medication view, multiple-medications view, covariates view, frequent-itemsets view, and medication-hierarchy view; and an Interaction module, made up of a set of different human-data interactions. VISA_M3R3 is unique in the manner in which it combines multivariable regression with Eclat to support underlying processing in the computing space and implements fisheye and sensitivity encoding to provide support for the representation and interaction spaces. It offers a balanced distribution of processing load through a proper integration of analytics techniques (i.e., regression and frequent itemset mining in the Analytics module) with visual representations (i.e., different interactive views in the Visualization module) to facilitate high-level cognitive tasks. Some of the main tasks commonly performed by researchers, and which VISA_M3R3 is designed to support, include: (1) compare multiple regression models, (2) understand the relationship between different predictors and a response variable, (3) identify the frequent itemsets from items of interest, and (4) interpret multivariable regression models. VISA_M3R3 is primarily designed as a research tool for the medical researchers at ICES’ KDT program, and it is up to them to decide how this system will be applied within the healthcare system. A number of training materials have been prepared to assist new users who are not familiar with the analytics and visualization techniques incorporated in VISA_M3R3 to use the system effectively.
We have demonstrated how VISA_M3R3 can be used to detect AKI-associated medications among older patients who visited the hospital or emergency department in Ontario between 2014 to 2016 using ICES health administrative data. We have seen that VISA_M3R3 allows healthcare researchers to generate hypotheses, understand the relationships among data elements (e.g., medications and diseases), and recognize patterns and trends that would be otherwise difficult to identify. About 9% of all the medications that are prescribed to the older patients have been found to be associated with AKI. Using VISA_M3R3, we detect 55 medications (Furosemide, Allopurinol, Hydrochlorothiazide, Atorvastatin, Spironolactone, Olmesartan Medoxomil, to name a few) and 78 medication combinations (Furosemide and Oseltamivir Phosphate, Allopurinol and Metolazone, Celecoxib and Quetiapine, and so on) that are associated with an increased risk of AKI. In general, medications belong to Angiotensin Receptor Blockers, Diuretics, Nonsteroidal Anti-inflammatory, and Xanthine Oxidase Inhibitors classes are found to be strongly associated with AKI. Moreover, some combinations of medication classes such as Anti-inflammatory and Antidepressants and Diuretics and Antiviral Agents have been identified with the evidence for increased risk of developing AKI. The lists of medications and medication combinations have been reviewed by a nephrologist to validate the results. Most of these medications are already known to be nephrotoxic in the existing literature, which confirms the accuracy of our findings through VISA_M3R3 [87,88,89,90,91,92].
In terms of the extensibility and scalability of VISA_M3R3, we have designed it in a modular way so that it can easily accept new data sources, data types, and analysis techniques. VISA_M3R3 can be used to investigate many other clinical problems, such as identifying risk factors associated with hypertension, and understanding the relationship between dietary habits and diabetes. To test the applicability of the system in different healthcare areas, we have used VISA_M3R3 to detect hospital admission codes (i.e., reasons for hospitalization) that are associated with AKI using healthcare utilization database housed at ICES. We detected 8543 itemsets by analyzing the hospital admission codes that co-occur frequently. Using VISA_M3R3 to analyze this data, 185 individual codes and 215 group codes are found to be statistically significant. The top few reasons for hospitalization (representing admission codes associated with AKI) included (1) essential hypertension, (2) malignant neoplasm of bladder, (3) non-follicular (diffuse) lymphoma, (4) mycosis fungoides, (5) iron deficiency anemia, and (6) chronic obstructive pulmonary disease. This result also aligns with what has already been known from the literature, which more generally and comprehensively proves the efficacy of VISA_M3R3’s design [93,94,95,96,97].
There are four key limitations to the development of VISA_M3R3. The first one is that it reports the regression analysis result of the group models but does not consider how individual items within the group are affecting the outcome. For instance, in the study with medications, VISA_M3R3 reveals that the combination of Furosemide and Metoprolol increases the risk of AKI. However, it does not explain the additive risk of using Metoprolol with or without Furosemide and vice versa. This issue can be resolved by incorporating a stratified analysis on each item available in at least one group. The second limitation is that, even though we have had a participatory design and medical experts have evaluated VISA_M3R3 and have found it very useful and usable, we have not conducted any formal experimental usability studies to evaluate its performance, nor the efficacy of its human-data discourse mechanisms. The third one is that VISA_M3R3 incorporates a limited number of analytics techniques. Although there are more advanced machine learning algorithms in the literature, we decided to design the system based on techniques that are more interpretable to our end-users (i.e., clinicians and healthcare researchers). Fourth, the preparation of the dataset for VISA_M3R3 could be labor-intensive in some situations, depending on the data source and problem at hand. However, there are a number of readily available libraries and packages available to assist users with the data cut and preparative work.

6. Conclusions

The purpose of this paper is to demonstrate how VA systems can be designed in a systematic way to support EMR-driven tasks and investigation of different clinical problems. We report the development of a VA system (called VISA_M3R3) and demonstrate how it can be used to help medical practitioners and researchers identify medications and medication combinations that associate with a higher risk of AKI. VISA_M3R3’s novelty stems from its design; it incorporates multivariable regression, frequent itemset mining, data visualization, and human–data interaction mechanisms in an integrated fashion to support ill-defined, complex EMR-driven tasks. Using VISA_M3R3, we analyzed ICES health administrative data. Through this analysis, 55 medications and 78 medication groups, strongly associated with AKI, were identified. Although, through clinical studies, a number of these AKI-associated medications and medication groups are known by medical researchers, some of them have never been studied before. VISA_M3R3 can alert and raise physicians’ awareness of such potentially AKI-associated medications. This, in turn, can prompt healthcare providers to conduct further clinical investigations to improve healthcare research outcomes. Finally, VISA_M3R3’s design concepts are generalizable. They can be used to systematically develop any VA system whose goal is to support medical tasks involving analysis of EMR data using multiple regression models and frequent itemset mining. Applications of such VA systems can lead to the emergence of best practices for developing similar VA systems in other medical domains.

Author Contributions

Conceptualization, S.S.A., N.R., K.S., A.X.G., and E.M.; methodology, S.S.A., N.R., and K.S.; Software, S.S.A. and N.R.; Validation, S.S.A., N.R., K.S., A.X.G., and E.M.; Formal Analysis, S.S.A. and N.R.; Data Curation, S.S.A., N.R., and E.M.; writing—original draft preparation, S.S.A. and N.R.; writing—review and editing, S.S.A., N.R., K.S., A.X.G., and E.M.; Visualization, S.S.A., N.R., and K.S.; supervision, K.S. and A.X.G. All authors have read and agreed to the published version of the manuscript.

Funding

This research received no external funding.

Acknowledgments

We would like to thank all ICES and Western staff who helped us throughout the process.

Conflicts of Interest

The authors declare that there is no conflict of interest. Dr. Amit Garg is supported by the Dr. Adam Linton, Chair in Kidney Health Analytics and a Clinician Investigator Award from the Canadian Institutes of Health Research (CIHR).

References

  1. Caban, J.J.; Gotz, D. Visual analytics in healthcare—Opportunities and research challenges. J. Am. Med. Inform. Assoc. 2015, 22, 260–262. [Google Scholar] [CrossRef] [PubMed] [Green Version]
  2. Delamarre, D.; Bouzille, G.; Dalleau, K.; Courtel, D.; Cuggia, M. Semantic integration of medication data into the EHOP Clinical Data Warehouse. Stud. Health Technol. Inform. 2015, 210, 702–706. [Google Scholar] [PubMed]
  3. Abramson, E.L.; Barrón, Y.; Quaresimo, J.; Kaushal, R. Electronic prescribing within an electronic health record reduces ambulatory prescribing errors. Jt. Comm. J. Qual. Patient Saf. 2011, 37, 470–478. [Google Scholar] [CrossRef]
  4. Kamal, N. Big Data and Visual Analytics in Health and Medicine: From Pipe Dream to Reality. J. Health Med. Inform. 2014, 5, e25. [Google Scholar] [CrossRef]
  5. Murdoch, T.B.; Detsky, A.S. The inevitable application of big data to health care. JAMA J. Am. Med. Assoc. 2013, 309, 1351–1352. [Google Scholar] [CrossRef]
  6. Honigman, B.; Light, P.; Pulling, R.M.; Bates, D.W. A computerized method for identifying incidents associated with adverse drug events in outpatients. Int. J. Med. Inform. 2001, 61, 21–32. [Google Scholar] [CrossRef]
  7. Hannan, T.J. Detecting adverse drug reactions to improve patient outcomes. Int. J. Med. Inform. 1999, 55, 61–64. [Google Scholar] [CrossRef]
  8. Rinner, C.; Grossmann, W.; Sauter, S.K.; Wolzt, M.; Gall, W. Effects of Shared Electronic Health Record Systems on Drug-Drug Interaction and Duplication Warning Detection. Biomed Res. Int. 2015, 2015, 380497. [Google Scholar] [CrossRef] [Green Version]
  9. Gruchalla, R.S. Clinical assessment of drug-induced disease. Lancet 2000, 356, 1505–1511. [Google Scholar] [CrossRef]
  10. Tandon, V.R.; Khajuria, V.; Mahajan, V.; Sharma, A.; Gillani, Z.; Mahajan, A. Drug-induced diseases (DIDs): An experience of a tertiary care teaching hospital from India. Indian J. Med. Res. 2015, 142, 33–39. [Google Scholar] [CrossRef]
  11. Gildon, B.; Condren, M.; Hughes, C. Impact of Electronic Health Record Systems on Prescribing Errors in Pediatric Clinics. Healthcare 2019, 7, 57. [Google Scholar] [CrossRef] [PubMed] [Green Version]
  12. Singer, A.; Duarte Fernandez, R. The effect of electronic medical record system use on communication between pharmacists and prescribers. BMC Fam. Pract. 2015, 16, 155. [Google Scholar] [CrossRef] [PubMed] [Green Version]
  13. Agrawal, A. Medication errors: Prevention using information technology systems. Br. J. Clin. Pharmacol. 2009, 67, 681–686. [Google Scholar] [CrossRef] [PubMed] [Green Version]
  14. Assadi, F.; Ghane Shahrbaf, F. Drug-induced renal disorders. J. Ren. Inj. Prev. 2015, 4, 57–60. [Google Scholar]
  15. Khan, S.; Loi, V.; Rosner, M.H. Drug-Induced Kidney Injury in the Elderly. Drugs Aging 2017, 34, 729–741. [Google Scholar] [CrossRef] [PubMed]
  16. Fusco, S.; Garasto, S.; Corsonello, A.; Vena, S.; Mari, V.; Gareri, P.; Ruotolo, G.; Luciani, F.; Roncone, A.; Maggio, M.; et al. Medication-Induced Nephrotoxicity in Older Patients. Curr. Drug Metab. 2016, 17, 608–625. [Google Scholar] [CrossRef]
  17. Selby, N.M.; Crowley, L.; Fluck, R.J.; McIntyre, C.W.; Monaghan, J.; Lawson, N.; Kolhe, N.V. Use of electronic results reporting to diagnose and monitor AKI in hospitalized patients. Clin. J. Am. Soc. Nephrol. 2012, 7, 533–540. [Google Scholar] [CrossRef] [Green Version]
  18. Porter, C.J.; Juurlink, I.; Bisset, L.H.; Bavakunji, R.; Mehta, R.L.; Devonald, M.A.J. A real-time electronic alert to improve detection of acute kidney injury in a large teaching hospital. Nephrol. Dial. Transplant. 2014, 29, 1888–1893. [Google Scholar] [CrossRef] [Green Version]
  19. Kaufman, J.; Dhakal, M.; Patel, B.; Hamburger, R. Community-Acquired Acute Renal Failure. Am. J. Kidney Dis. 1991, 17, 191–198. [Google Scholar] [CrossRef]
  20. Nash, K.; Hafeez, A.; Hou, S. Hospital-acquired renal insufficiency. Am. J. Kidney Dis. 2002, 39, 930–936. [Google Scholar] [CrossRef]
  21. Gandhi, T.K.; Burstin, H.R.; Cook, E.F.; Puopolo, A.L.; Haas, J.S.; Brennan, T.A.; Bates, D.W. Drug complications in outpatients. J. Gen. Intern. Med. 2000, 15, 149–154. [Google Scholar] [CrossRef] [PubMed] [Green Version]
  22. Schetz, M.; Dasta, J.; Goldstein, S.; Golper, T. Drug-induced acute kidney injury. Curr. Opin. Crit. Care 2005, 11, 555–565. [Google Scholar] [CrossRef] [PubMed]
  23. Moffett, B.S.; Goldstei, S.L. Acute kidney injury and increasing nephrotoxic-medication exposure in noncritically-Ill children. Clin. J. Am. Soc. Nephrol. 2011, 6, 856–863. [Google Scholar] [CrossRef] [PubMed] [Green Version]
  24. Rivosecchi, R.M.; Kellum, J.A.; Dasta, J.F.; Armahizer, M.J.; Bolesta, S.; Buckley, M.S.; Dzierba, A.L.; Frazee, E.N.; Johnson, H.J.; Kim, C.; et al. Drug Class Combination-Associated Acute Kidney Injury. Ann. Pharmacother. 2016, 50, 953–972. [Google Scholar] [CrossRef]
  25. Alexander, T.; McArthur, E.; Jandoc, R.; Welk, B.; Hayward, J.S.; Jain, A.K.; Braam, B.; Flockerzi, V.; Garg, A.X.; Quinn, R.R. Antihypertensive medications and the risk of kidney stones in older adults: A retrospective cohort study. Hypertens. Res. 2017, 40, 837–842. [Google Scholar] [CrossRef]
  26. Cartin-Ceba, R.; Kashiouris, M.; Plataki, M.; Kor, D.J.; Gajic, O.; Casey, E.T. Risk factors for development of acute kidney injury in critically ill patients: A systematic review and meta-analysis of observational studies. Crit. Care Res. Pract. 2012, 2012, 691013. [Google Scholar] [CrossRef]
  27. Zitnik, M.; Agrawal, M.; Leskovec, J. Modeling polypharmacy side effects with graph convolutional networks. Bioinformatics 2018, 34, i457–i466. [Google Scholar] [CrossRef] [Green Version]
  28. Collins, N. AI Predicts Drug Pair Side Effects/Stanford News. Available online: https://news.stanford.edu/2018/07/10/ai-predicts-drug-pair-side-effects/ (accessed on 5 January 2020).
  29. Han, J.; Kamber, M. Data Mining: Concepts and Techniques; Elsevier: Amsterdam, The Netherlands, 2011. [Google Scholar]
  30. Koh, H.C.; Tan, G. Data mining applications in healthcare. J. Healthc. Inf. Manag. 2005, 19, 64–72. [Google Scholar]
  31. Basile, A.O.; Yahi, A.; Tatonetti, N.P. Artificial Intelligence for Drug Toxicity and Safety. Trends Pharmacol. Sci. 2019, 40, 624–635. [Google Scholar] [CrossRef]
  32. Lysenko, A.; Sharma, A.; Boroevich, K.A.; Tsunoda, T. An integrative machine learning approach for prediction of toxicity-related drug safety. Life Sci. Alliance 2018, 1, e201800098. [Google Scholar] [CrossRef] [Green Version]
  33. Schmider, J.; Kumar, K.; LaForest, C.; Swankoski, B.; Naim, K.; Caubel, P.M. Innovation in Pharmacovigilance: Use of Artificial Intelligence in Adverse Event Case Processing. Clin. Pharmacol. Ther. 2019, 105, 954–961. [Google Scholar] [CrossRef] [PubMed] [Green Version]
  34. Dey, S.; Luo, H.; Fokoue, A.; Hu, J.; Zhang, P. Predicting adverse drug reactions through interpretable deep learning framework. BMC Bioinform. 2018, 19, 476. [Google Scholar] [CrossRef] [PubMed] [Green Version]
  35. Munsaka, M.S. Leveraging Machine Learning in the Analysis of Safety Data in Drug Research and Healthcare Informatics. In Proceedings of the Joint Statistical Meetings-Section for Statistical Programmers and Analysis, Baltimore, MD, USA, 29 July–3 August 2017. [Google Scholar]
  36. Vamathevan, J.; Clark, D.; Czodrowski, P.; Dunham, I.; Ferran, E.; Lee, G.; Li, B.; Madabhushi, A.; Shah, P.; Spitzer, M.; et al. Applications of machine learning in drug discovery and development. Nat. Rev. Drug Discov. 2019, 18, 463–477. [Google Scholar] [CrossRef]
  37. Rind, A.; Aigner, W.; Miksch, S.; Wiltner, S.; Pohl, M.; Turic, T.; Drexler, F. Visual Exploration of Time-Oriented Patient Data for Chronic Diseases: Design Study and Evaluation; Springer: Berlin/Heidelberg, Germany, 2011; pp. 301–320. [Google Scholar]
  38. Wilson, J.R. Fundamentals of systems ergonomics/human factors. Appl. Ergon. 2014, 45, 5–13. [Google Scholar] [CrossRef] [PubMed]
  39. Sedig, K.; Parsons, P. Design of Visualizations for Human-Information Interaction: A Pattern-Based Framework. Synth. Lect. Vis. 2016, 4, 1–185. [Google Scholar] [CrossRef]
  40. Ozturk, S.; Kayaalp, M.; McDonald, C.J. Visualization of patient prescription history data in emergency care. AMIA Annu. Symp. Proc. 2014, 2014, 963–968. [Google Scholar] [PubMed]
  41. Duke, J.D.; Li, X.; Grannis, S.J. Data visualization speeds review of potential adverse drug events in patients on multiple medications. J. Biomed. Inform. 2010, 43, 326–331. [Google Scholar] [CrossRef] [PubMed] [Green Version]
  42. Van der Corput, P.; Arends, J.; Van Wijk, J.J. Visualization of Medicine Prescription Behavior. Comput. Graph. Forum 2014, 33, 161–170. [Google Scholar] [CrossRef]
  43. Rind, A.; Wang, T.D.; Aigner, W.; Miksch, S.; Wongsuphasawat, K.; Plaisant, C.; Shneiderman, B.; Alexander Rind, B.; David Wang, T.; Aigner, W.; et al. Interactive Information Visualization to Explore and Query Electronic Health Records. Found. Trends Hum.-Comput. Interact. 2011, 5, 207–298. [Google Scholar] [CrossRef]
  44. Lavado, R.; Hayrapetyan, S.; Kharazyan, S. Expansion of the Benifits Package: The Experience of Armenia; World Bank: Yerevan, Armenia, 2018. [Google Scholar]
  45. Kosara, R.; Miksch, S. Visualization methods for data analysis and planning in medical applications. Int. J. Med. Inform. 2002, 68, 141–153. [Google Scholar] [CrossRef]
  46. Faisal, S.; Blandford, A.; Potts, H.W. Making sense of personal health information: Challenges for information visualization. Health Inform. J. 2013, 19, 198–217. [Google Scholar] [CrossRef] [PubMed] [Green Version]
  47. Lee, C.H.; Yoon, H.J. Medical big data: Promise and challenges. Kidney Res. Clin. Pract. 2017, 36, 3–11. [Google Scholar] [CrossRef] [PubMed] [Green Version]
  48. Perer, A.; Wang, F.; Hu, J. Mining and exploring care pathways from electronic medical records with visual analytics. J. Biomed. Inform. 2015, 56, 369–378. [Google Scholar] [CrossRef] [PubMed] [Green Version]
  49. Simpao, A.F.; Ahumada, L.M.; Desai, B.R.; Bonafide, C.P.; Galvez, J.A.; Rehman, M.A.; Jawad, A.F.; Palma, K.L.; Shelov, E.D. Optimization of drug-drug interaction alert rules in a pediatric hospital’s electronic health record system using a visual analytics dashboard. J. Am. Med. Inform. Assoc. 2015, 22, 361–369. [Google Scholar] [CrossRef] [PubMed] [Green Version]
  50. Saffer, J.D.; Burnett, V.L.; Chen, G.; van der Spek, P. Visual analytics in the pharmaceutical industry. IEEE Comput. Graph. Appl. 2004, 24, 10–15. [Google Scholar] [CrossRef]
  51. Parsons, P.; Sedig, K.; Mercer, R.E.; Khordad, M.; Knoll, J.; Rogan, P. Visual Analytics for supporting evidence-based interpretation of molecular cytogenomic findings. In Proceedings of the 2015 Workshop on Visual Analytics in Healthcare, New York, NY, USA, 25 October 2015; pp. 1–8. [Google Scholar]
  52. Amarasingham, R.; Patzer, R.E.; Huesch, M.; Nguyen, N.Q.; Xie, B. Implementing electronic health care predictive analytics: Considerations and challenges. Health Aff. 2014, 33, 1148–1154. [Google Scholar] [CrossRef]
  53. Feng, C.; Le, D.; Mccoy, A.B. Using Electronic Health Records to Identify Adverse Drug Events in Ambulatory Care: A Systematic Review Background and Significance. Appl. Clin. Inform. 2019, 10, 123–128. [Google Scholar] [CrossRef]
  54. Mittelstädt, S.; Hao, M.C.; Dayal, U.; Hsu, M.C.; Terdiman, J.; Keim, D.A. Advanced visual analytics interfaces for adverse drug event detection. In Proceedings of the 2014 International Working Conference on Advanced Visual Interfaces, Como, Italy, 27–30 May 2014; pp. 237–244. [Google Scholar]
  55. Ninkov, A.; Sedig, K. VINCENT: A visual analytics system for investigating the online vaccine debate. Online J. Public Health Inform. 2019, 11, e5. [Google Scholar] [CrossRef] [Green Version]
  56. Bernard, J.; Sessler, D.; Bannach, A.; May, T.; Kohlhammer, J. A visual active learning system for the assessment of patient well-being in prostate cancer research. In Proceedings of the 2015 Workshop on Visual Analytics in Healthcare, Chicago, IL, USA, 25 October 2015. [Google Scholar]
  57. Basole, R.C.; Braunstein, M.L.; Kumar, V.; Park, H.; Kahng, M.; Chau, D.H.; Tamersoy, A.; Hirsh, D.A.; Serban, N.; Bost, J.; et al. Understanding variations in pediatric asthma care processes in the emergency department using visual analytics. J. Am. Med. Inform. Assoc. 2015, 22, 318–323. [Google Scholar] [CrossRef] [Green Version]
  58. Huang, C.W.; Syed-Abdul, S.; Jian, W.S.; Iqbal, U.; Nguyen, P.A.; Lee, P.; Lin, S.H.; Hsu, W.D.; Wu, M.S.; Wang, C.F.; et al. A novel tool for visualizing chronic kidney disease associated polymorbidity: A 13-year cohort study in Taiwan. J. Am. Med. Inform. Assoc. 2015, 22, 290–298. [Google Scholar] [CrossRef]
  59. Klimov, D.; Shknevsky, A.; Shahar, Y. Exploration of patterns predicting renal damage in patients with diabetes type II using a visual temporal analysis laboratory. J. Am. Med. Inform. Assoc. 2015, 22, 275–289. [Google Scholar] [CrossRef] [PubMed] [Green Version]
  60. Gotz, D.H.; Sun, J.; Cao, N. Multifaceted visual analytics for healthcare applications. IBM J. Res. Dev. 2012, 56, 12. [Google Scholar] [CrossRef]
  61. Sedig, K.; Parsons, P.; Babanski, A. Towards a Characterization of Interactivity in Visual Analytics. JMPT 2012, 3, 12–28. [Google Scholar]
  62. Keim, D.; Kohlhammer, J.; Ellis, G.; Mansmann, F. Mastering The Information Age—Solving Problems with Visual Analytics. Eurographics association: Geneva, Switzerland, 2010; ISBN 978-3-905673-77-7. [Google Scholar]
  63. Thomas, J.J.; Cook, K.A. A visual analytics agenda. IEEE Comput. Graph. Appl. 2006, 26, 10–13. [Google Scholar] [CrossRef]
  64. Ola, O.; Sedig, K. Discourse with Visual Health Data: Design of Human-Data Interaction. Multimodal Technol. Interact. 2018, 2, 10. [Google Scholar] [CrossRef] [Green Version]
  65. Cui, W. Visual Analytics: A Comprehensive Overview. IEEE Access 2019, 7, 81555–81573. [Google Scholar] [CrossRef]
  66. Keim, D.; Mansmann, F.; Thomas, J. Visual Analytics: How Much Visualization and How Much Analytics? ACM SIGKDD Explor. Newsl. 2010, 11, 5–8. [Google Scholar] [CrossRef]
  67. Jeong, D.H.; Ji, S.Y.; Suma, E.A.; Yu, B.; Chang, R. Designing a collaborative visual analytics system to support users’ continuous analytical processes. Hum.-Centric Comput. Inf. Sci. 2015, 5, 5. [Google Scholar] [CrossRef] [Green Version]
  68. Ola, O.; Sedig, K. The Challenge of Big Data in Public Helth: An Opportunity for Visual Analytics. Online J. Public Health Inform. 2014, 5, 223. [Google Scholar]
  69. Parsons, P.; Sedig, K. Distribution of information processing while performing complex cognitive activities with visualization tools. In Handbook of Human Centric Visualization; Springer: New York, NY, USA, 2014; pp. 693–715. ISBN 9781461474852. [Google Scholar]
  70. Sedig, K.; Parsons, P. Interaction Design for Complex Cognitive Activities with Visual Representations: A Pattern-Based Approach. AIS Trans. Hum.-Comput. Interact. 2013, 5, 84–133. [Google Scholar] [CrossRef] [Green Version]
  71. Green, T.M.; Maciejewski, R. A role for reasoning in visual analytics. In Proceedings of the 2013 46th Hawaii International Conference on System Sciences, Wailea, HI, USA, 7–10 January 2013; pp. 1495–1504. [Google Scholar]
  72. Han, J.; Kamber, M.; Pei, J. Data Mining. Concepts and Techniques, 3rd ed.; The Morgan Kaufmann Series in Data Management Systems; Elsevier: Amsterdam, The Netherlands, 2011. [Google Scholar]
  73. Kusiak, A. Feature transformation methods in data mining. IEEE Trans. Electron. Packag. Manuf. 2001, 24, 214–221. [Google Scholar] [CrossRef]
  74. Agrawal, R.; Swami, A.; Imielinski, T. Database Mining: A Performance Perspective. IEEE Trans. Knowl. Data Eng. 1993, 5, 914–925. [Google Scholar] [CrossRef] [Green Version]
  75. Sahu, H.; Shrma, S.; Gondhalakar, S. A Brief Overview on Data Mining Survey. IJCTEE 2008, 1, 114–121. [Google Scholar]
  76. Heer, J.; Kandel, S. Interactive analysis of big data. XRDS Crossroads ACM Mag. Stud. 2012, 19, 50–54. [Google Scholar] [CrossRef]
  77. Keim, D.; Mansmann, F.; Schneidewind, J.; Thomas, J.; Ziegler, H. Visual analytics: Scope and challenges. In Lecture Notes in Computer Science; Springer: Berlin/Heidelberg, Germany, 2008; pp. 76–90. [Google Scholar]
  78. Kehrer, J.; Hauser, H. Visualization and visual analysis of multifaceted scientific data: A survey. IEEE Trans. Vis. Comput. Graph. 2013, 19, 495–513. [Google Scholar] [CrossRef] [PubMed]
  79. Heuer, R.J. Psychology of Intelligence Analysis; Center for the Study of Intelligence, Central Intelligence Agency: McLean, VA, USA, 1999; ISBN 9781929667000. [Google Scholar]
  80. Gilhooly, K.J. Working Memory and Reasoning. In The Nature of Reasoning; Cambridge University Press: Cambridge, UK, 2004; pp. 49–77, ISBN 0-521-81090-6 (Hardcover), 0-521-00928-6 (Paperback). [Google Scholar]
  81. Leighton, J.P. Defining and Describing Reason. In The Nature of Reasoning; Cambridge University Press: Cambridge, UK, 2004; pp. 3–11, ISBN 0-521-81090-6 (Hardcover); 0-521-00928-6 (Paperback). [Google Scholar]
  82. Varga, M.; Varga, C. Visual Analytics: Data, Analytical and Reasoning Provenance. In Building Trust in Information; Springer: Cham, Switzerland, 2016; pp. 141–150. [Google Scholar]
  83. Arifin, S.; Zulkardi, Z.; Indra Putri, R.; Hartono, Y.; Susanti, E. Developing Ill-defined problem-solving for the context of “South Sumatera”. J. Phys. Conf. Ser. 2017, 943, 12038. [Google Scholar] [CrossRef]
  84. Muller, M. Participatory Design: The third space in HCI. In The Human-Computer Interaction Handbook; CRC Press: Boca Raton, FL, USA, 2007; pp. 1087–1108. [Google Scholar]
  85. Williams, D.A.; McCullagh, P.; Nelder, J.A. Generalized Linear Models. Biometrics 1984, 40, 566. [Google Scholar] [CrossRef]
  86. Spence, R. Sensitivity encoding to support information space navigation: A design guideline. Inf. Vis. 2002, 1, 120–129. [Google Scholar] [CrossRef]
  87. Wu, X.; Zhang, W.; Ren, H.; Chen, X.; Xie, J.; Chen, N. Diuretics associated acute kidney injury: Clinical and pathological analysis. Ren. Fail. 2014, 36, 1051–1055. [Google Scholar] [CrossRef]
  88. Chao, C.-T.; Tsai, H.-B.; Wu, C.-Y.; Lin, Y.-F.; Hsu, N.-C.; Chen, J.-S.; Hung, K.-Y. Cumulative Cardiovascular Polypharmacy Is Associated With the Risk of Acute Kidney Injury in Elderly Patients. Medicine 2015, 94, e1251. [Google Scholar] [CrossRef]
  89. Ho, K.M.; Power, B.M. Benefits and risks of furosemide in acute kidney injury. Anaesthesia 2010, 65, 283–293. [Google Scholar] [CrossRef] [PubMed]
  90. Verdoodt, A.; Honore, P.M.; Jacobs, R.; De Waele, E.; Gorp, V.V.; De Regt, J.; Spapen, H.D. Do statins induce or protect from acute kidney injury and chronic kidney disease: An update review in 2018. J. Transl. Intern. Med. 2018, 6, 21–25. [Google Scholar] [CrossRef] [PubMed] [Green Version]
  91. Pierson-Marchandise, M.; Gras, V.; Moragny, J.; Micallef, J.; Gaboriau, L.; Picard, S.; Choukroun, G.; Masmoudi, K.; Liabeuf, S. The drugs that mostly frequently induce acute kidney injury: A case—Noncase study of a pharmacovigilance database. Br. J. Clin. Pharmacol. 2017, 83, 1341–1349. [Google Scholar] [CrossRef] [PubMed] [Green Version]
  92. Perez-Ruiz, F. Treatment with Allopurinol is Associated with Lower Risk of Acute Kidney Injury in Patients with Gout: A Retrospective Analysis of a Nested Cohort. Rheumatol. Ther. 2017, 4, 419–425. [Google Scholar] [CrossRef] [PubMed] [Green Version]
  93. Malbrain, M.L.N.G.; Lambrecht, G.L.Y.; Daelemans, R.; Lins, R.L.; Hermans, P.; Zachee, P. Acute renal failure due to bilateral lymphomatous infiltrates—Primary extranodal non-Hodgkin’s lymphoma (p-EN-NHL) of the kidneys: Does it really exist? Clin. Nephrol. 1994, 42, 163–169. [Google Scholar]
  94. Anderson, F.A.; Wyman, A.; Varon, J.; McCullough, P.A.; Devlin, J.W.; Weir, M.R.; Katz, J.N.; Szczech, L.A.; Granger, C.B.; Dasta, J.F.; et al. Acute Kidney Injury and Cardiovascular Outcomes in Acute Severe Hypertension Acute Kidney Injury and Cardiovascular Outcomes in Acute Severe Hypertension. Circulation 2010, 121, 2183–2191. [Google Scholar]
  95. Kandler, K.; Jensen, M.E.; Nilsson, J.C.; Møller, C.H.; Steinbrüchel, D.A. Acute kidney injury is independently associated with higher mortality after cardiac surgery. J. Cardiothorac. Vasc. Anesth. 2014, 28, 1448–1452. [Google Scholar] [CrossRef]
  96. Martines, A.M.F.; Masereeuw, R.; Tjalsma, H.; Hoenderop, J.G.; Wetzels, J.F.M.; Swinkels, D.W. Iron metabolism in the pathogenesis of iron-induced kidney injury. Nat. Rev. Nephrol. 2013, 9, 385–398. [Google Scholar] [CrossRef]
  97. Da’as, N.; Polliack, A.; Cohen, Y.; Amir, G.; Darmon, D.; Kleinman, Y.; Goldfarb, A.W.; Ben-Yehuda, D. Kidney involvement and renal manifestations in non-Hodgkin’s lymphoma and lymphocytic leukemia: A retrospective study in 700 patients. Eur. J. Haematol. 2001, 67, 158–164. [Google Scholar] [CrossRef]
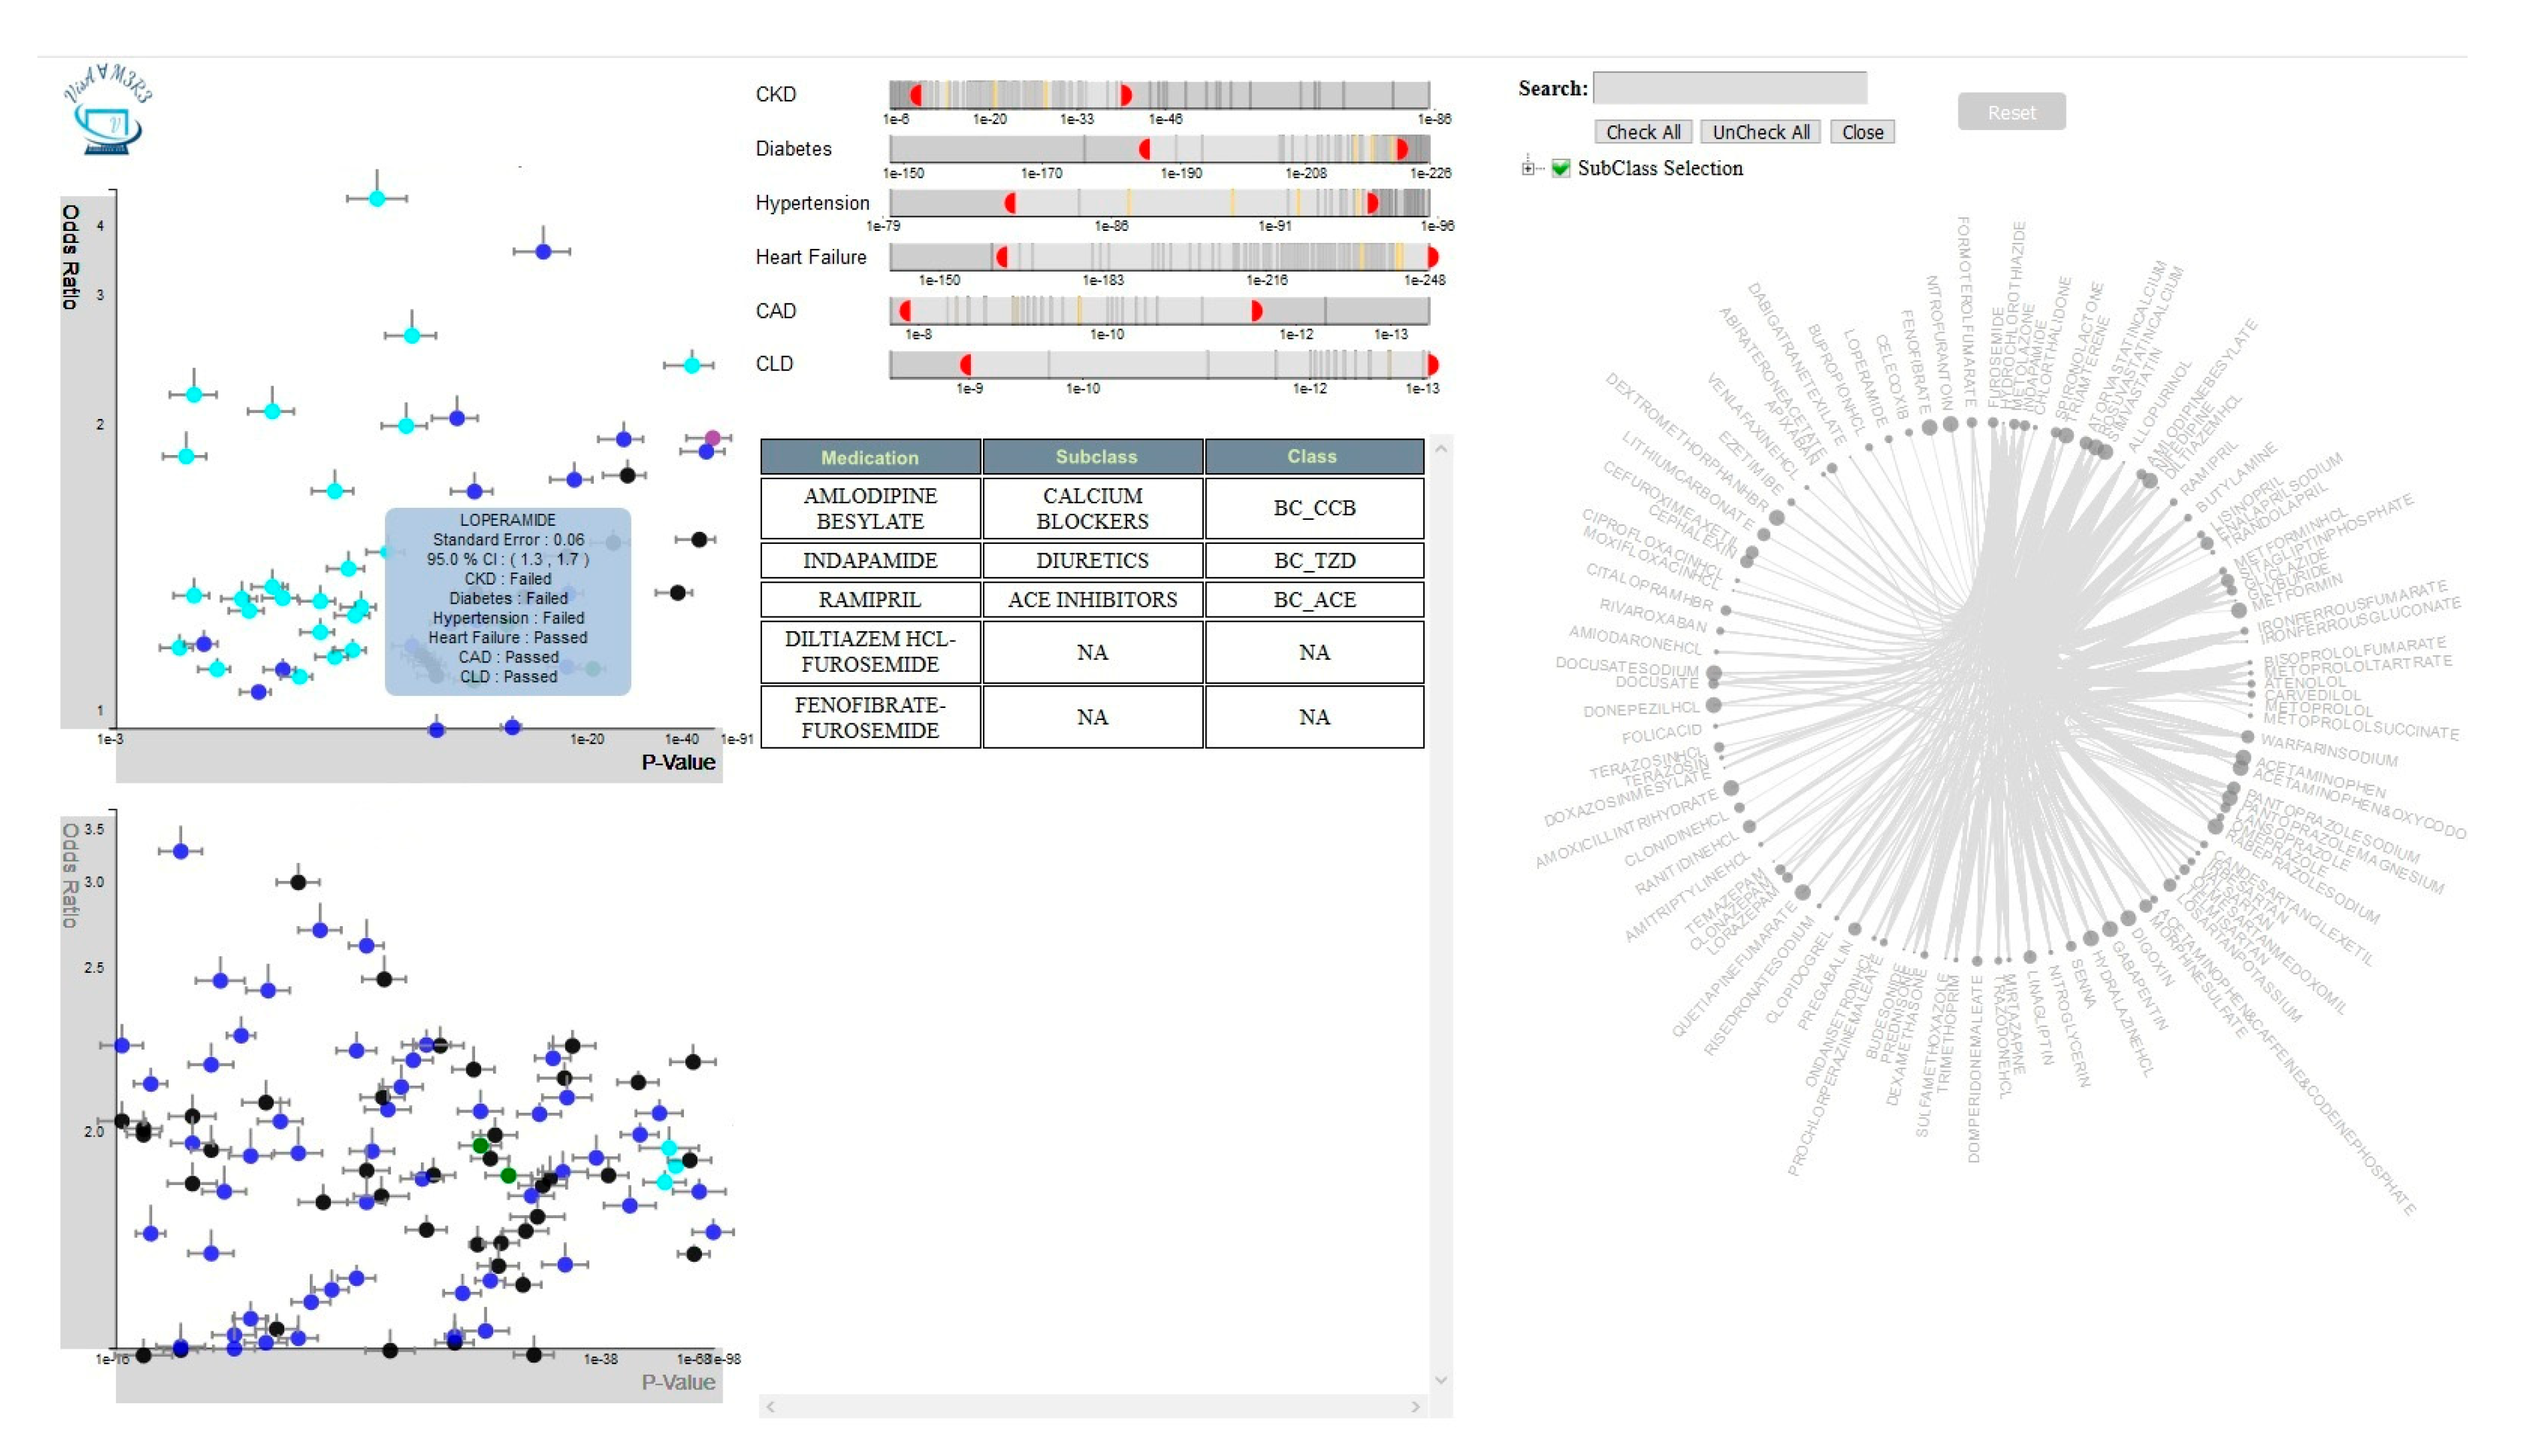
Figure 1. Workflow diagram of VISA_M3R3. Different colors are used to show the separation of the three main modules.
Data 05 00033 g001
Figure 2. The Visualization module of VISA_M3R3 is composed of five views: (A) single-medication view, (B) multiple-medications view, (C) covariates view, (D) medication-hierarchy view, and (E) frequent-itemsets view.
Data 05 00033 g002
Figure 3. Scatter plot of single-medication view.
Data 05 00033 g003
Figure 4. Scatterplot of multiple-medications view.
Data 05 00033 g004
Figure 5. Chord diagram showing the results of the frequent itemset mining analysis in the frequent-itemsets view.
Data 05 00033 g005
Figure 6. Six sliders representing different covariates in the covariates view.
Data 05 00033 g006
Figure 7. The medication-hierarchy view shows the list of medications and their classes and subclasses.
Data 05 00033 g007
Figure 8. Overview of interactions in the single-medication view.
Data 05 00033 g008
Figure 9. Overview of interactions in the multiple-medications view.
Data 05 00033 g009
Figure 10. Overview of interactions in the covariates view.
Data 05 00033 g010
Figure 11. Overview of interactions in the frequent-itemsets view.
Data 05 00033 g011
Figure 12. Overview of interactions in the medication-hierarchy view and selection controls.
Data 05 00033 g012
Table 1. Sensitivity encoding using color coding of glyphs.
Number of Satisfied FiltersColor of the Glyphs
6Green
5Black
4Blue
3Cyan
2Purple
1Grey
0Yellow

