Data Wrangling in Database Systems: Purging of Dirty Data


German Center for Higher Education Research and Science Studies (DZHW), Schützenstraße 6a, Berlin 10117, Germany
Data 2020, 5(2), 50; https://0-doi-org.brum.beds.ac.uk/10.3390/data5020050
Submission received: 30 March 2020
/
Revised: 20 May 2020
/
Accepted: 2 June 2020
/
Published: 5 June 2020
(This article belongs to the Special Issue Challenges in Business Intelligence)
Abstract
:Researchers need to be able to integrate ever-increasing amounts of data into their institutional databases, regardless of the source, format, or size of the data. It is then necessary to use the increasing diversity of data to derive greater value from data for their organization. The processing of electronic data plays a central role in modern society. Data constitute a fundamental part of operational processes in companies and scientific organizations. In addition, they form the basis for decisions. Bad data quality can negatively affect decisions and have a negative impact on results. The quality of the data is crucial. This includes the new theme of data wrangling, sometimes referred to as data munging or data crunching, to find the dirty data and to transform and clean them. The aim of data wrangling is to prepare a lot of raw data in their original state so that they can be used for further analysis steps. Only then can knowledge be obtained that may bring added value. This paper shows how the data wrangling process works and how it can be used in database systems to clean up data from heterogeneous data sources during their acquisition and integration.
1. Motivation
In an analysis, the quality of the evidence and the benefits of the resulting decisions depend heavily on the quality of the underlying data. The amounts of data to be processed are becoming larger and more diverse in their nature and structure. Nevertheless, they should be processed as close to real time as possible. This combination of volume, velocity, and variety is referred to as the big data 3V. It is important to note that not only people, but also machines consume data. Examples of such consumers are algorithms from the field of machine learning and data mining. For example, automatic processing (e.g., natural language processing (NLP)) often occurs in pipelines. This plays a role in the analysis of social media data or free text fields. Various machine learning algorithms are used, which build successively on each other. The result of an analysis step serves as input for a further analysis step. This can increase quality issues and severely limit the benefits of the bottom line. In addition to classic typical data quality criteria such as accuracy, completeness, correctness, reliability, consistency, timeliness, precision, and conciseness [1], what is decisive is “fitness for use” [2]. “Information and data quality is a topic of highest importance for organizations” [3], so data must be provided in the way that data consumers expect, including in terms of structure or format. “Data quality is subjective and, consequently, whether the quality of information or data is high or low always depends on the user’s context” [3]. Previous studies have shown that maintaining a consistently high quality of data in databases poses a significant challenge and burden for organizations [4,5,6].
So that an analysis can be carried out, all data must be brought into the appropriate form, a process which is also referred to as data wrangling. The emergence of data wrangling was born out of necessity, so organizations can better understand and exploit the informational content of their data. Today, more and more data sources can be used for analysis. However, many organizations do not have the tools to understand, cleanse, and format their data. A significant portion of the data that employees at organizations are dealing with today is increasingly available in a variety of formats and sizes. For working in traditional tools like Excel, these data is either too large or too complex. The new term data wrangling is designed to handle a variety of complex data of any size. This requires a highly structured database or information system in which the basis for further analysis and visualization is stored [7]. Data wrangling not only covers data quality issues and cleans up data, but also integrates heterogeneous data sources. Data wrangling is an iterative process of getting data into a form suitable for further analysis. Ref [8] defines data wrangling “as a process of iterative data exploration and transformation that enables analysis. One goal is to make data usable, i.e., to put them in a form that can be parsed and manipulated by analysis tools. Data usability is determined relative to the tools by which the data will be processed. Such tools might include spreadsheets, statistics packages, and visualization tools”. Using data wrangling, many errors or abnormalities can be resolved, e.g., attributes are neatly structured in rows and columns, changes to the layout of the record, the derivation of new attributes, the filtering of observations, the compilation of summary values, the grouping of data, the formation of subsets from the set of attributes, and the combination with other records. Data wrangling can be implemented to work with dirty data in database systems.
There is little work in the literature on the functionality of data wrangling. The paper of [8] discusses a wide range of topics and problems in the field of data wrangling, especially with regard to visualization. For example, graphs and charts can help identify data quality issues, such as missing values. In the paper of [7], a concrete overview of the topic of data wrangling is given and the selected software solutions and techniques are discussed.
The explosion of internal and external data sources (e.g., publication databases) in the field of research data management is becoming an increasingly serious problem for institutions. The more decisions are made based on digital data, the more important questions about their origin and quality become. This necessitates finding, cleaning, and integrating data. Good metadata are no guarantee of the quality of data itself. It is imperative to subject the data to a quality control. For example, incorrect, redundant, incomplete and outdated data can be checked and deleted or interpolated if errors occur. In order to counteract the data quality problems that arise, a systematic approach should be developed. So, the analysis and elimination of causes for identified problems is the decisive basis for sustainable success.
Against this background, the present paper examines how the new topic of data wrangling can be used to solve data quality problems. The aim was to introduce the importance of data quality in the databases (such as research data management) to the reader and to illuminate the handling of incorrect data in the process of data wrangling with a practical tool and to show approaches. However, this paper focuses on the aspect of data quality in the context of data wrangling. The topic of data quality is not new territory for institutions or companies and is nevertheless usually perceived only as an annoying addition to large data and therefore usually treated as a tiresome consequence.
Although there are many efforts in the literature for evaluating data quality, it is not yet clear how to deal adequately with the knowledge of data quality problems in databases. According to this view, data profiling and data cleansing only form part of the data wrangling. For more details and information on using the two terms, data cleansing and data profiling, in a newly developed database or federated information system (research information system (RIS), other names for the term RIS are current research information system (CRIS), especially in Europe, and RIMS (research information management system), RNS (research networking system), or FAR (faculty activity reporting)), see the both papers by [9] and [10].
The paper is divided into five sections. Following the introduction in Section 1, Section 2 discusses typical data quality problems in database systems or data management systems that can be improved by using data wrangling. Section 3 will give an overview of the topic data wrangling and its process will be described in more detail. Section 4 describes the potential use of data wrangling and presents a practical example. Section 5 summarizes the important findings of the paper and shows future work on this topic.
2. Typical Data Quality Problems
The impact of erroneous data is greatest in databases. A poor database can have far-reaching consequences, because a high quality of information is the basic requirement for functioning business processes. Many organizations rely on industry-standard solutions or implement standard applications for data quality issues, but these cannot meet the sometimes complex and specific requirements. Instead, these problems require effective action. For this the necessity of data wrangling is to be used, which can resolve any data quality issues that arise. Typical solved data quality problems in databases or information systems using data wrangling are:
- Not maintained attributes;
- Abuse of attributes for additional information;
- Incorrect data caused by incorrect input, including, e.g., wrong reading, etc.;
- Typing error;
- Inaccurate data;
- Missing data;
- Redundant and inconsistent data;
- Various incorrect formats;
- Duplicate records;
- Outdated information.
These data quality problems are based on a compilation of cases discussed in the literature [8,11,12]. Data quality problems can have different causes. To improve data quality, the cause must be known. Only if the cause is remedied can a lasting improvement of the data quality be achieved. Data wrangling protects against corrupt data. Organizations that have changing data must consistently and systematically review the information they have to ensure consistency. This is especially important when merging databases. High data quality are not just desirable, but one of the main criteria that determines whether the project is successful, and the resulting information is correct [13]. As [14] said: “The presentation of data, the way they are identified, selected and included (or excluded) in databases and the information provided to users to re-contextualize them are fundamental to producing knowledge, and significantly influence its content. Concerns around interpreting data and assessing their quality can be tackled by cultivating governance strategies around how data are collected, managed and processed.” Wrangling data can result in more turnover and decision-making, as well as improved management and analysis because deficient data sources can be very costly, even leading to a database or information system failure.
3. Functionality of Data Wrangling
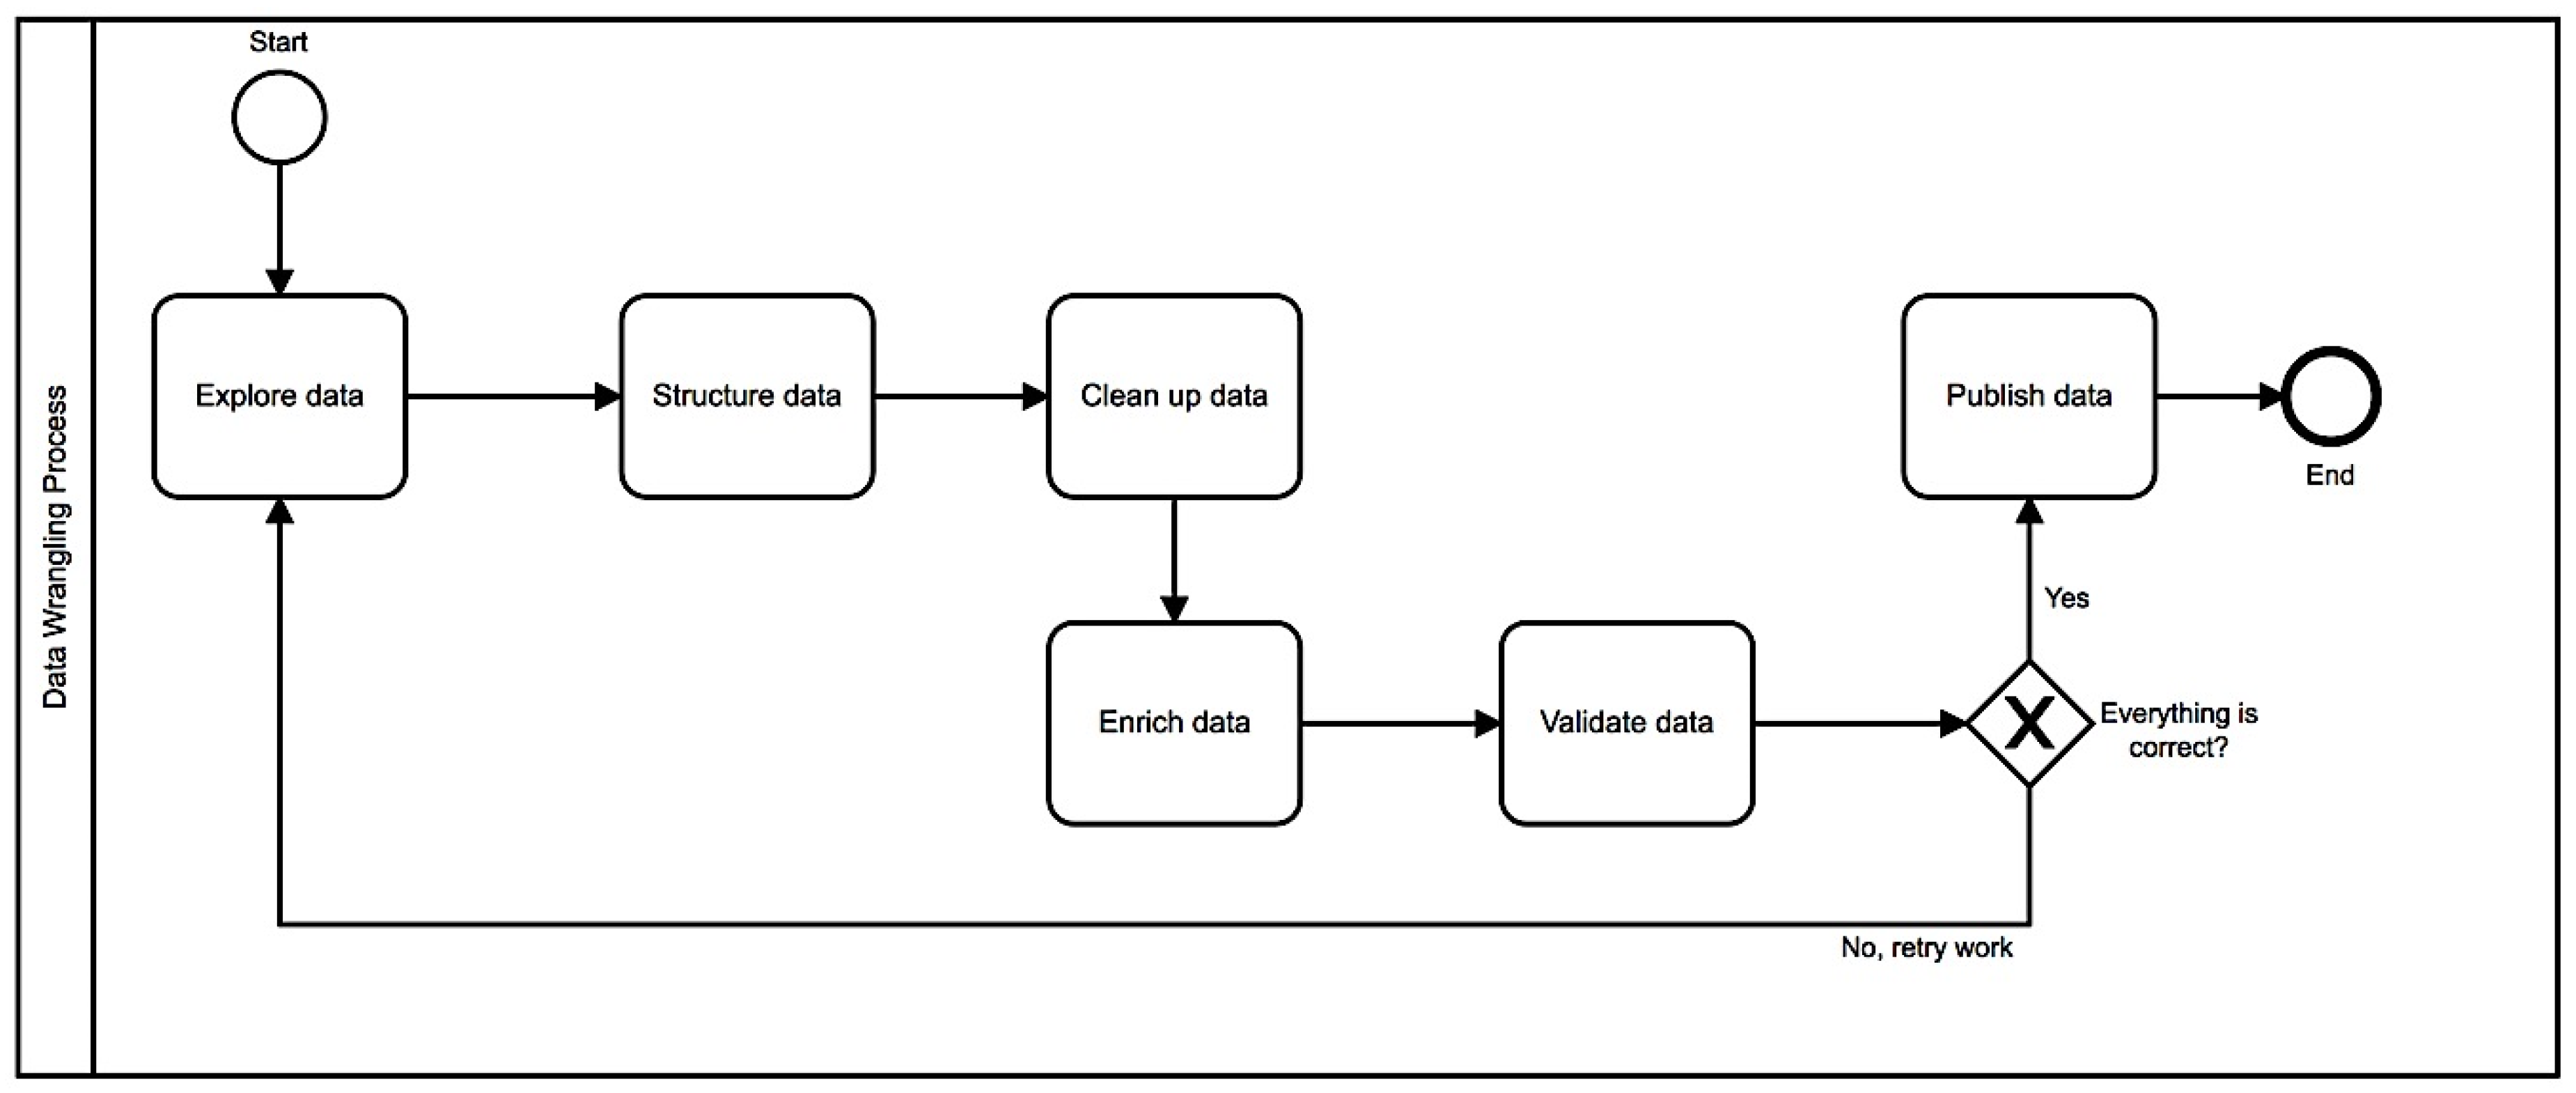
Data wrangling is an elaborate and iterative process of processing and enriching data for the purpose of subsequent analysis and visualization. Such a process of data analysis can be referred to as data preparation. This process, like the data analysis itself, can be iterative if the output of the data wrangling process involves new data or errors. This means that the program sequences may repeat until the desired result is achieved (for example, an accurate, correct record that can be further processed or imported directly and contains no bugs or errors). Compared to data curation or data stewardship, which is much more complex and challenging, data wrangling can be seen as a relatively small process. Data wrangling is limited to data quality, but data curation is a holistic process and describes the continuous management of data throughout its entire life cycle, from creation and first storage to the point in time at which it is archived or outdated and deleted for future analysis [15]. Data curation is not only technical, it can also play an important role in achieving business goals by using data effectively [16]. Figure 1 shows the data wrangling process, which consists of several substeps.
The following describes the steps involved in data wrangling:
Step 1 “Exploring”: In the first step, the data must provide understanding. That means, where does the data come from? How are the data structured? Everyone has to have a good idea about their data before they can start on the next steps (e.g., implementing the cleanup methods). Data wrangling must be done in a certain way, based on some criteria that could delineate and divide the data appropriately, and this can be identified in the exploring step.
Step 2 “Structuring”: Some data are transmitted arbitrarily, but without structure, and data come in a variety of shapes and sizes. This step is required to correct and uniformly restructure the data so that it can be used for analysis. This may be, for example, the omission or generation of new columns by the separation or extraction of values.
Step 3 “Cleaning”: There are certainly some outliers in data sources or data that can distort the results of the analysis. These must be cleaned to get the best results. The cleanup step thoroughly cleans up the data for higher information content and high-quality analysis. For example, this step is designed to increase data quality by handling zero values, duplicates, outdated, invalid, and unformatted data.
Step 4 “Enriching”: Steps 1–3 give the data wrangler an impression of the information content of the data. After cleanup, the data must be enriched, and this is done in the enrichment step. The point here is to add more data, from other internal or external data sources, to the existing data or to derive new columns from existing data via calculation rules to improve them, for example, by folding probability measures or converting a time stamp into a day of the week. Furthermore, it makes sense to link data from the publications with author profiles.
Step 5 “Validating”: The validation step will reveal any data quality issues and data consistency, or it will confirm that an appropriate transformation has been made. Validations should be done on multiple dimensions or rules. In any case, it should be checked if the values of an attribute or field are correct and comply with the syntactic and distribution constraints. For example, a Boolean field should be coded as true or false rather than 1/0 or [True, False]. In a publication database (e.g., Web of Science), the authors’ birthdays should be distributed almost evenly over the months of the calendar year. In addition, one should pay attention to the consistency of the attributes or fields across the data records. Posts published by the author, for example, should be assigned to uniform types such as volume, issue, year or pages. The validation rule checks the data to detect inconsistencies and thereby ensure high data quality.
Step 6 “Publishing”: This is the last publishing step that deals with how the edited data are subsequently provided to subject analysts and for which applications so that they can later be used for other purposes. Publishing refers to the preparation and transfer of data wrangling output for use in downstream or future projects such as loading into specific analysis software or documenting and archiving the transformation logic. Some analysis tools work much faster if the input data are structured appropriately. Good data wrangler tools know this and format the processed data so that the target system can optimally utilize it. In many cases, it makes sense to replicate the data wrangling steps and methods of a project for use on other databases.
For successful analytics, organizations need accurate, well-structured data that are tailored to the needs of their job. However, at the present time, data volumes are larger and more complex than ever, and it is time-consuming and technically difficult to prepare for analysis. Performing several steps of data wrangling will identify and resolve multiple data quality issues before the analysis can continue and be used for important business purposes.
4. Practice Results
Data preprocessing and preparation takes a lot of time in projects. The reasons for this are that the data usually have to be merged from different source systems and the data quality has to be checked and ensured. An explorative data analysis will also be performed during this phase to identify any abnormalities in the data. For this purpose, methods from the data wrangling process are used. Data wrangling methods can provide data-driven insights that help organizations identify, report, and prevent threats. It is important not only to analyze in retrospect, but to continuously monitor the process in order to foresee possible problems during the execution, and to intervene preventively.
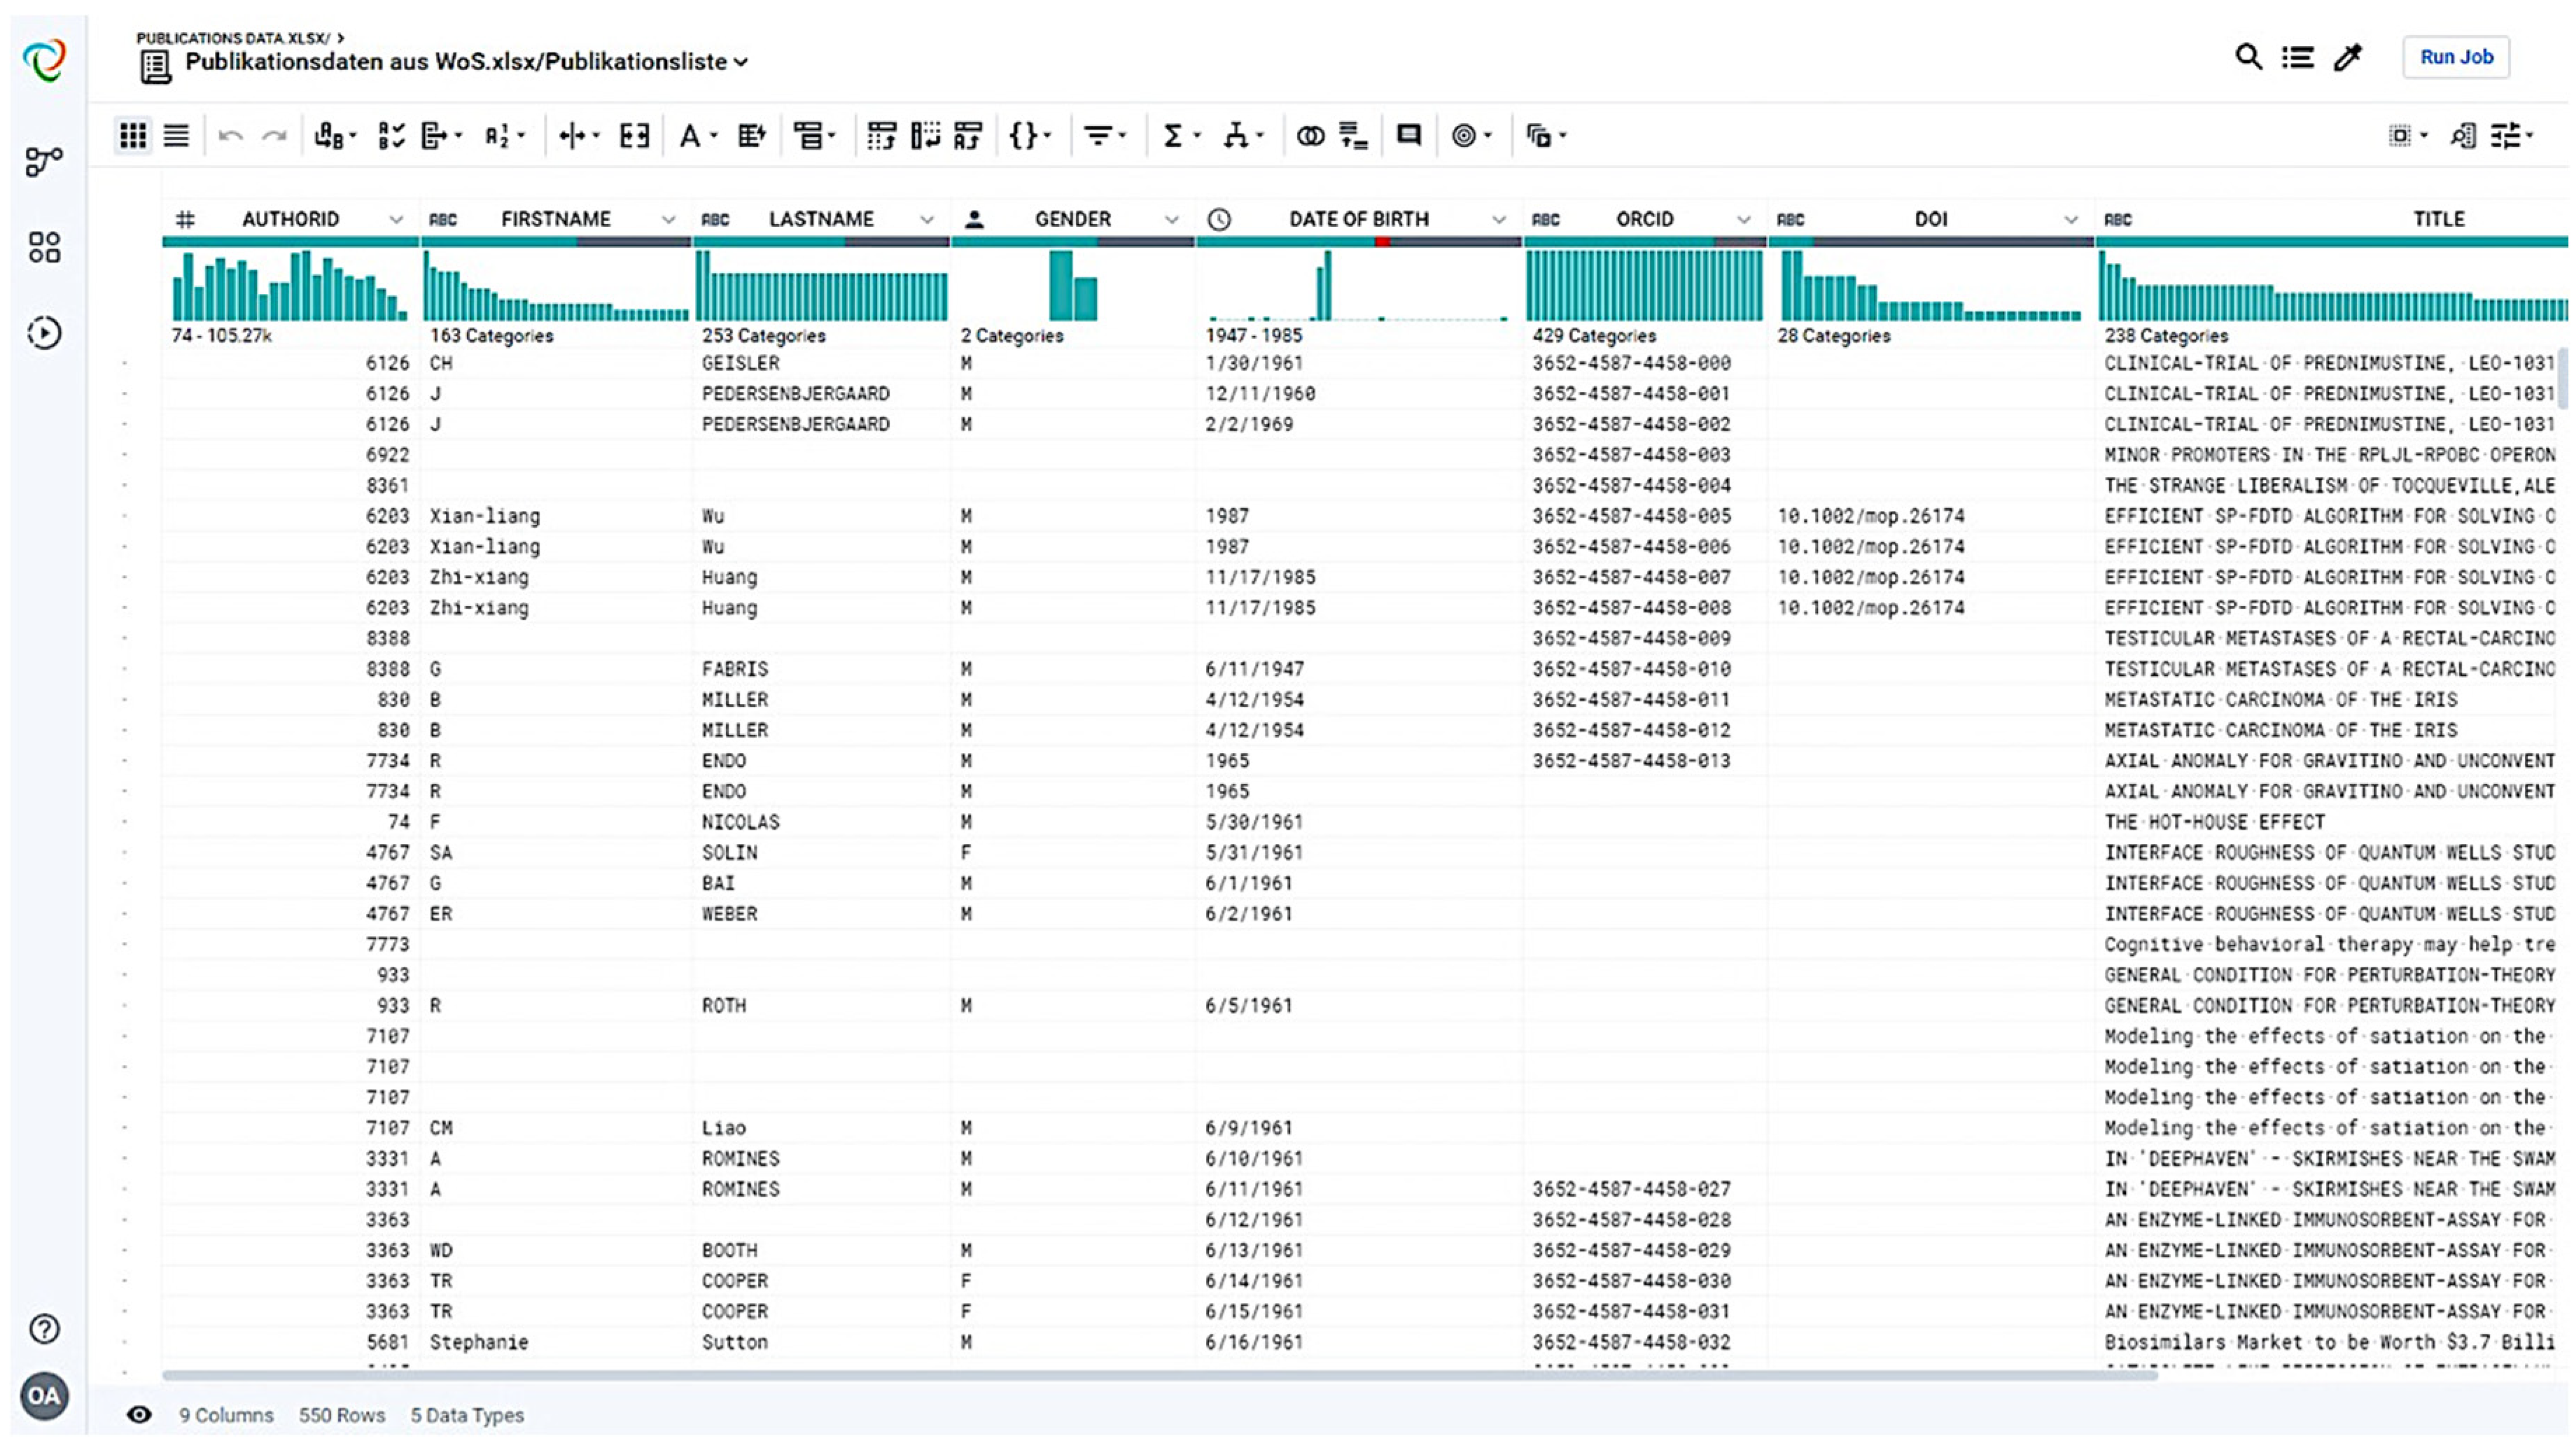
To understand how data wrangling looks and works, this section presents a practical example of structuring, cleansing, enriching, and validating Web of Science publication data before integrating it into a database using the Trifacta® Wrangler tool (https://www.trifacta.com/). Trifacta Wrangler was launched in 2012 as a result of academic research at UC Berkeley and Stanford and is a visual data editing application that allows users to transform structured and unstructured data and profile the output of those transforms through an interactive interface [17]. When working in Trifacta Wrangler, data does not need to be explicitly divided into rows and columns, or completely populated [17]. In addition, Trifacta Wrangler “supports a variety of different data types, from the most basic integers, strings, and booleans, to more complex custom types like dates, US states, and phone numbers” [17].
Due to the power of the tool, only one important and practical function is presented here to give a first impression of using the data wrangling with Trifacta Wrangler as a data management solution. Data wrangling is an essential step in the data quality process and is particularly useful for many users (e.g., for data integrators without programming experience) who can interactively examine and prepare more than 60% of their time with their data sources. Users can perform data wrangling processes without code to improve operational productivity by using Trifacta Wrangler for troubleshooting, standardization (e.g., removing all outliers and anomalies and shaping them) and creating high quality data to support business decisions.
Figure 2 shows a practical example of the imported publication data to check the data quality in Trifacta Wrangler Tool. The data wrangling methods always clean up the data according to the user’s rules and various best practice settings can be used. The results showed that the tool enables unstructured data (generally dirty data) to be cleaned up, different data sources to be merged, and external data to be integrated. Furthermore, Trifacta Wrangler takes over the extraction of the necessary data from the source systems by connectors, the cleaning of postal data, the enrichment with further information or the identification of duplicates or their complex consolidation.
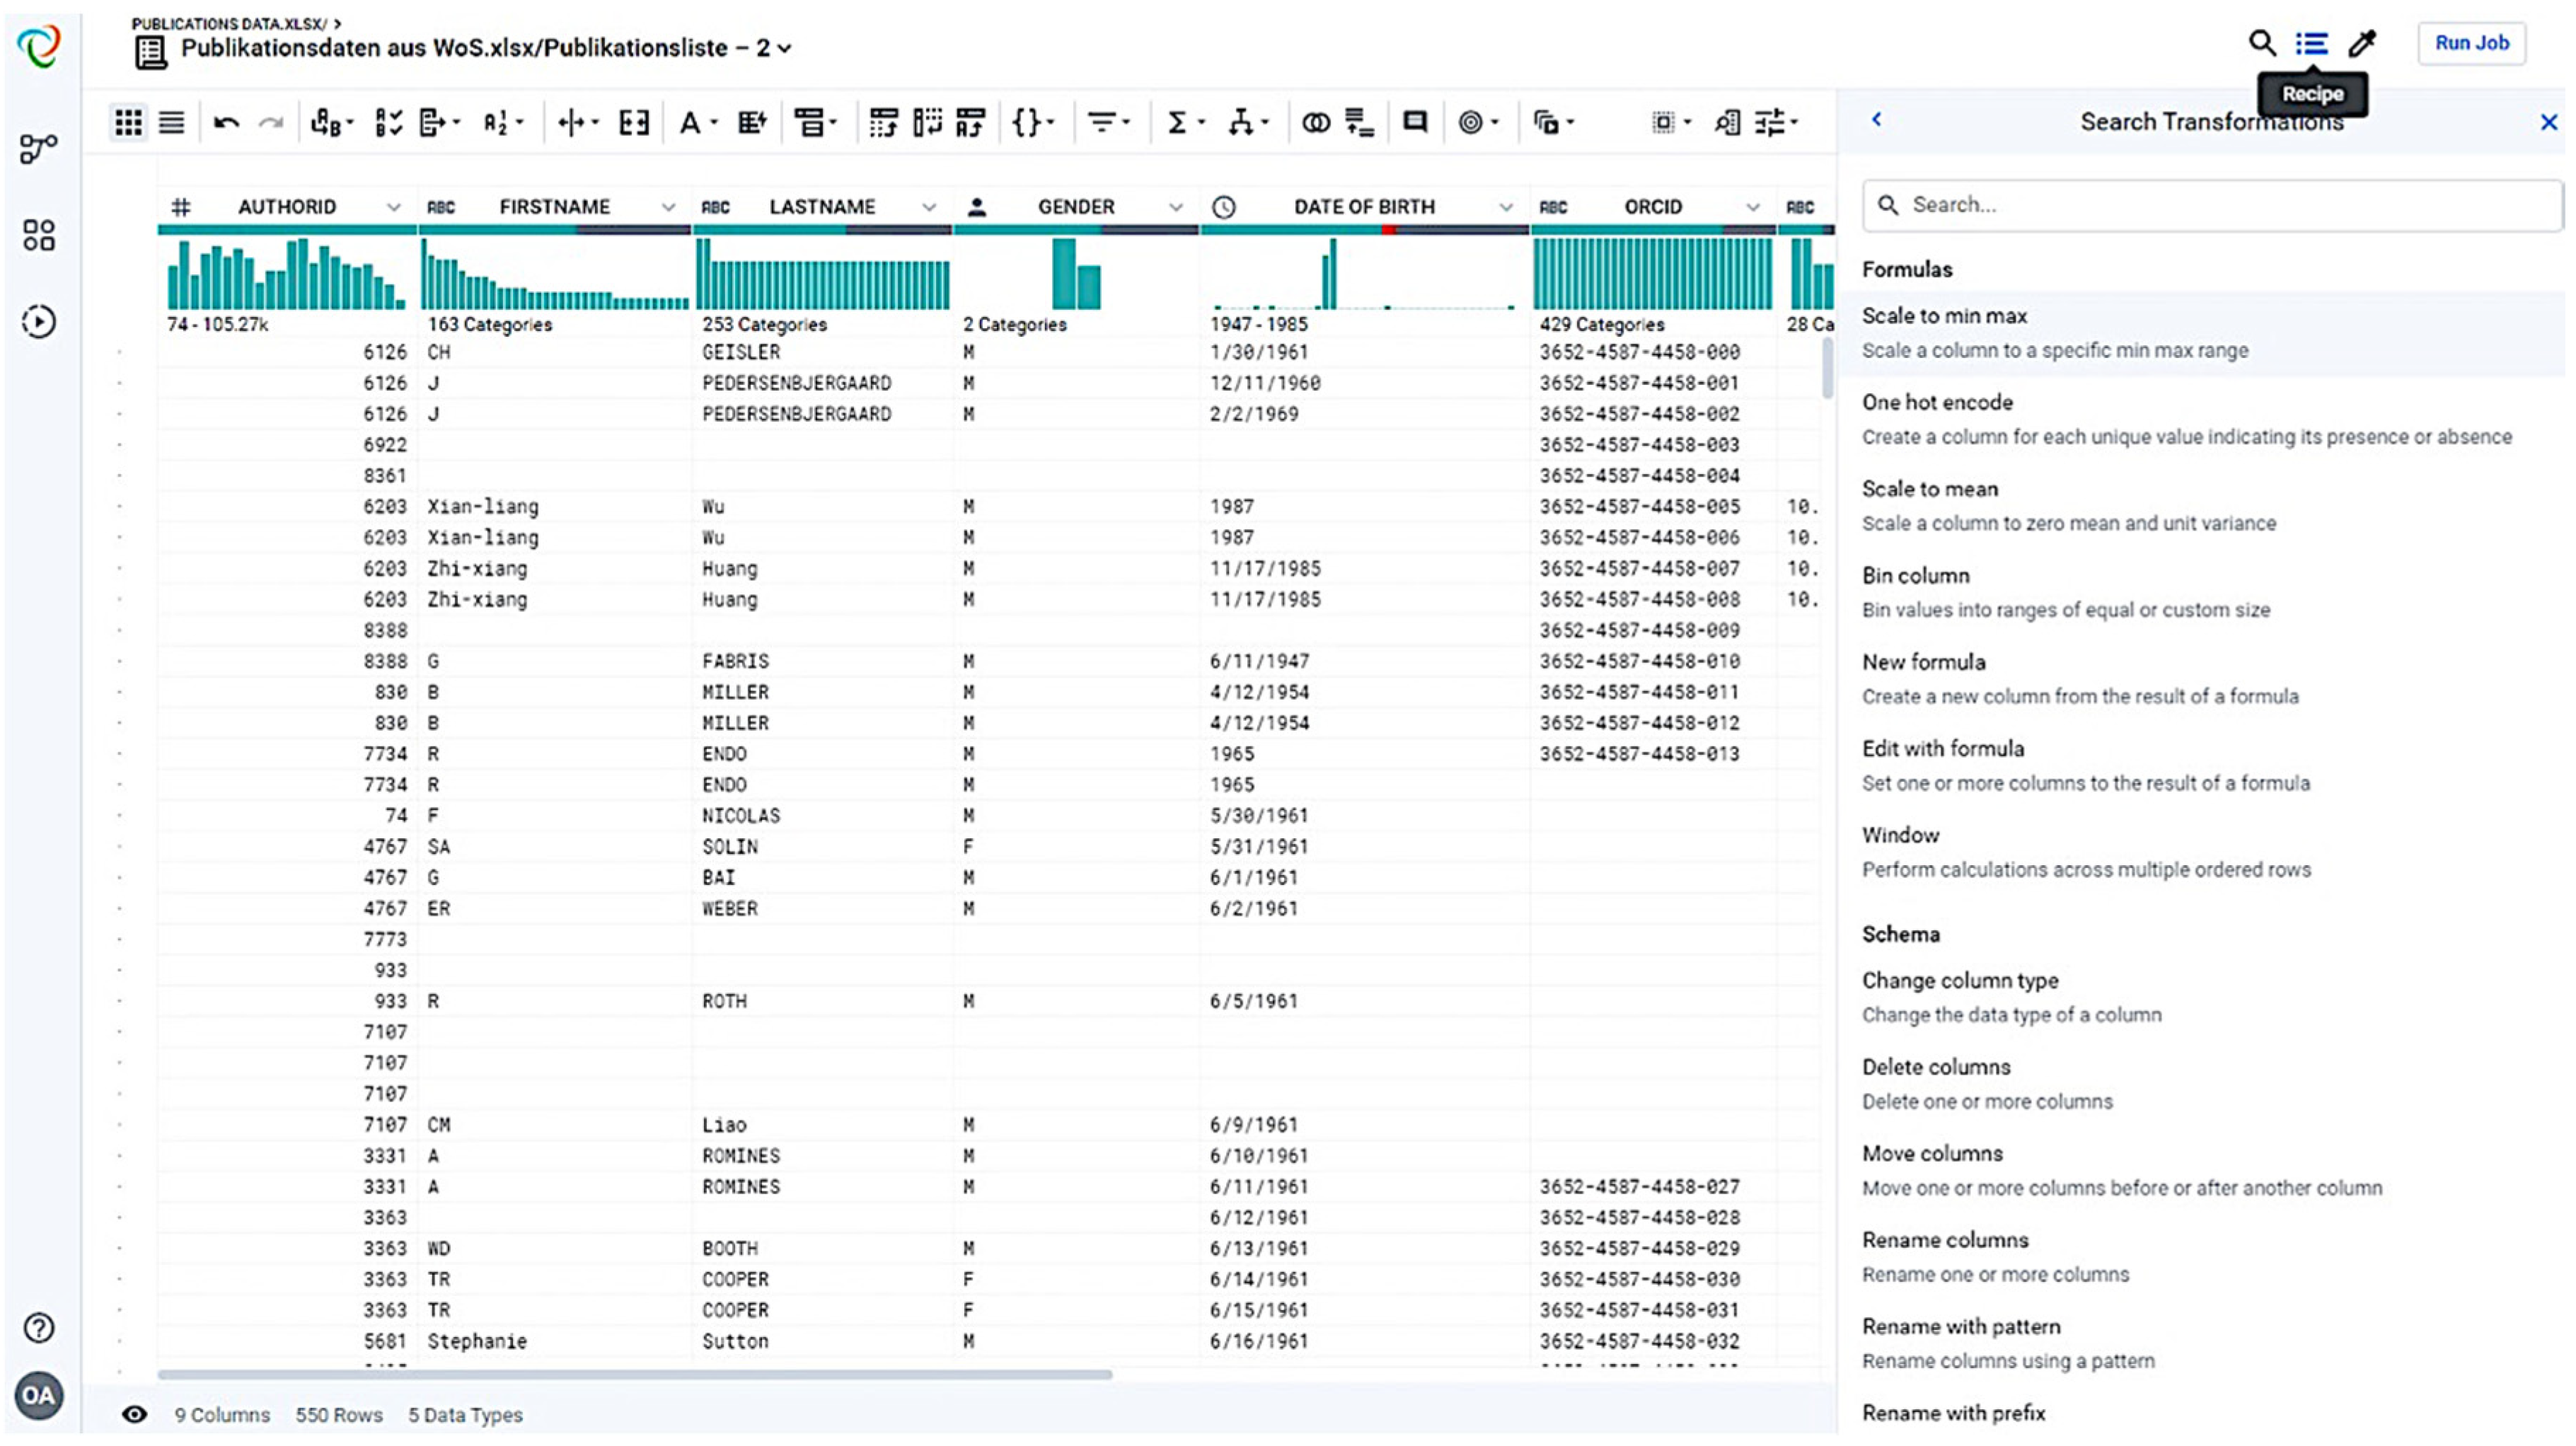
For large data sets, the tool works on a sample, which can be selected with different sample methods. If the user is very satisfied with the preparation of the sample, then the “Recipe” can be applied. The recipe at Trifacta Wrangler (Figure 3) contains the methods of structuring, cleansing, enriching, and validating the data to improve the quality and structure of the imported data set. With the help of the recipes, it is always possible to return to previous processing steps and to edit them or to remove selected work steps. The recipe thus facilitates both the documentation of the processing and the subsequent troubleshooting. Furthermore, an already created recipe can be executed on additional data records, so that the cleansing and structuring of data within an organization can be standardized with little effort.
Overall, the use of a Trifacta Wrangler for data wrangling is promising. Regardless of how large the amount of data to be analyzed, data wrangling solutions can make an enormous contribution to making the time-consuming and manual work of data preparation easier. The data processing functions that make work easier include the following:
- Resetting columns of confusing records with one click in column values.
- Changing the order and categorization of data.
- Changing column names.
- Creating new columns and group columns.
- Changing data types.
- Splitting columns.
- Calculating column values.
- Filling in empty cells and formatting cells.
Due to the mass of data and the complexity of the data structures, the analysis and cleansing of the data is often no longer possible without powerful software tools. With the free of charge and error-free cloud service Trifacta Wrangler Tool, complex tasks have been simplified and the analysis process has been drastically accelerated. This free service helps users analyze, clean, and prepare messy data as quickly and accurately as possible. As soon as data records are imported into Trifacta Wrangler, the data are automatically organized and structured. Trifacta Wrangler then suggests common transformations and aggregations, as well as cleansing steps. If the users are satisfied with the resulting data set, they can export the file for a data initiative.
For the cleanup process and the automation of many data quality tasks, it is enough for the Trifacta Wrangler, who treats the data in isolation via migration aids, knows the data source and the data target and understands their technical requirements, as well as comprehensive solutions with which tailor-made process requirements and the associated workflows define and have implemented. Trifacta Wrangler offers flexible options for correcting data errors, processing exceptional cases and data validation. Detailed reporting functions and automatic warning messages if minimum requirements are not met allow an overview of the current status of the data at any time. Such a platform with interfaces to the existing system landscape enables continuous quality assurance and also copes with growing amounts of data.
The result or advantage of this Trifacta Wrangler tool can be seen directly during testing. The time required for the process depends on the user and his experience with the tool, and can therefore vary. It offers more advantages, such as:
- Improving data quality through:
- ○
- Detection and avoidance of duplicates and similar entries.
- ○
- Standardization of formats and spellings.
- ○
- Eliminate invalid information.
- ○
- Enrichment of data.
- Efficient project execution.
- Reliable merging of multiple data sources.
- Fast return on investment by improving process quality based on data quality.
- Individual configuration of the degree of automation to adjust effort and benefit.
- Ability to integrate Trifacta Wrangler solutions into existing systems.
The tool shows disadvantages with regard to the unsupported file formats. Since adding UDFs (user defined functions) involves overheads, it would also be desirable to be able to write UDFs in programming language (such as Python or Scala) directly in Trifacta without having to install them as UDFs.
In summary, Trifacta Wrangler or a similar tool is very easy to use, and any user outside of the IT area can also work with the tool. With the tool, comparatively surprising large data transformations and data cleansing tasks can be done easily without programming effort via the browser in the cloud. The technology of data wrangling continues to evolve very fast to prove and establish itself as the industry standard software for organizations (self-service data wrangling tool). Alternatives to Trifacta Wrangler (e.g., OpenRefine, Google DataPrep, Tabula, DataWrangler, etc.) can be also applied. The choice of the data wrangling tool depends on what the user wants to do with his data.
5. Conclusion
With the rapid growth of data volumes and increasing amount of heterogeneous data sources delivering data at high speed, organizations are facing major challenges. They are forced to use the data available to them, be they internal or external, to generate competitive advantages in order to survive on the market in the long term. In the eyes of many, data wrangling is the appropriate tool for this. The most important topic of data quality plays a crucial role in data wrangling. The data wrangling tasks can be easily divided into six steps. These steps have the advantage that the errors in records can be detected, eliminated, and used for other scenarios. Data wrangling tools can help discover data quality problems in records. For example, outliers in a graph can often be recognized as conspicuous extremes. Gaps in the graph indicate missing values. It should be noted that the type of representation has a great influence. Some data quality problems can be easily recognized by diagrams or other special representations. Others can only be detected by inspecting the raw data.
The handling of dirty data, i.e., data with quality problems, is an important topic. With data wrangling it is possible to eliminate diagnosed data quality problems in databases or information systems. As a rule, data wrangling can save a lot of time because the processes do not have to be carried out manually. Especially with large amounts of data, data wrangling can provide a significant advantage. Problems that can be solved with data wrangling are relatively common, not only in research information (e.g., publication data, project data, patent data, etc.), but also in other areas. Organizations can benefit greatly from the use of data wrangling. So, even if the road is rocky, it is worthwhile and should be unavoidable, especially for organizations that want to act in data-driven manner.
In the future work, I plan to investigate the data wrangling process with the new topic “data lake” in the context of a data management system (e.g., current research information system (CRIS)) to clean up and unify non-uniform and complex research information from heterogeneous data sources because, after the cleanup, the data provide a higher quality of information. As a result, research organizations can work more reliably and make informed decisions.
Funding
This research received no external funding.
Conflicts of Interest
The author declares no conflict of interest.
References
- Wang, R.Y.; Strong, D.M. Beyond accuracy: What data quality means to data consumers. J. Manag. Inf. Syst. 1996, 12, 5–33. [Google Scholar] [CrossRef]
- Azeroual, O.; Saake, G.; Abuosba, M. ETL best practices for data quality checks in RIS databases. Informatics 2019, 6, 10. [Google Scholar] [CrossRef] [Green Version]
- Otto, B.; Lee, Y.W.; Caballero, I. Information and data quality in networked business. Electron. Mark. 2011, 21, 79–81. [Google Scholar] [CrossRef] [Green Version]
- Redman, T. The impact of poor data quality on the typical entreprise. Commun. ACM 1998, 41, 79–82. [Google Scholar] [CrossRef]
- Strong, D.M.; Lee, Y.W.; Wang, R.Y. Data quality in context. Commun. ACM 1997, 40, 103–110. [Google Scholar] [CrossRef]
- Wang, R.Y. A product perspective on total data quality management. Commun. ACM 1998, 41, 58–65. [Google Scholar] [CrossRef]
- Endel, F.; Piringer, H. Data Wrangling: Making data useful again. IFAC-PapersOnLine 2015, 48, 111–112. [Google Scholar] [CrossRef]
- Kandel, S.; Heer, J.; Plaisant, C.; Kennedy, J.; van Ham, F.; Riche, N.H.; Weaver, C.; Lee, B.; Brodbeck, D.; Buono, P. Research directions in data wrangling: Visualizations and transformations for usable and credible data. J. Inf. Vis. 2011, 10, 271–288. [Google Scholar] [CrossRef] [Green Version]
- Azeroual, O.; Saake, G.; Abuosba, M. Data quality measures and data cleansing for research information systems. J. Digit. Inf. Manag. 2018, 16, 12–21. [Google Scholar]
- Azeroual, O.; Saake, G.; Schallehn, E. Analyzing data quality issues in research information systems via data profiling. Int. J. Inf. Manag. 2018, 41, 50–56. [Google Scholar] [CrossRef]
- Kandel, S.; Paepcke, A.; Hellerstein, J.; Heer, J. Wrangler: Interactive visual specification of data transformation scripts. In Proceedings of the International Conference on Human Factors in Computing Systems, CHI 2011, Vancouver, BC, Canada, 7–12 May 2011; pp. 3363–3372. [Google Scholar]
- McCallum, Q.E. Bad Data Handbook; O’Reilly Media: Sebastopol, Canada, 2012. [Google Scholar]
- Rud, O.P. Data Mining Cookbook: Modeling Data for Marketing, Eisk and Customer Eelationship Management; Wiley: New York, NY, USA, 2001. [Google Scholar]
- Leonelli, S. Data Governance is Key to Interpretation: Reconceptualizing Data in Data Science. Harv. Data Sci. Rev. 2019, 1. [Google Scholar] [CrossRef]
- Horowitz, B.M. Artificial Intelligence for the Internet of Everything; William, L., Ranjeev, M., Donald, S., Ira, S.S.M., Stephen, R., Eds.; The 2018 AAAI Spring Symposium Series; Elsevier: San Diego, CA, USA, 2019; pp. 87–100. [Google Scholar] [CrossRef]
- Xie, I.; Matusiak, K. Chapter 11 – New developments and challenges. In Discover Digital Libraries; Elsevier: San Diego, CA, USA, 2016; pp. 319–339. [Google Scholar] [CrossRef]
- Rattenbury, T.; Hellerstein, J.; Heer, J.; Kandel, S.; Carreras, C. Principles of Data Wrangling: Practical Techniques for Data Preparation, 1st ed.; O’Reilly Media: Sebastopol, CA, USA, 2017. [Google Scholar]
Figure 1.
Data wrangling process.

Figure 2.
Imported dataset in Trifacta Wrangler.

Figure 3.
The important function “Recipe”.

© 2020 by the author. Licensee MDPI, Basel, Switzerland. This article is an open access article distributed under the terms and conditions of the Creative Commons Attribution (CC BY) license (http://creativecommons.org/licenses/by/4.0/).
Share and Cite
MDPI and ACS Style
Azeroual, O. Data Wrangling in Database Systems: Purging of Dirty Data. Data 2020, 5, 50. https://0-doi-org.brum.beds.ac.uk/10.3390/data5020050
AMA Style
Azeroual O. Data Wrangling in Database Systems: Purging of Dirty Data. Data. 2020; 5(2):50. https://0-doi-org.brum.beds.ac.uk/10.3390/data5020050
Chicago/Turabian StyleAzeroual, Otmane. 2020. "Data Wrangling in Database Systems: Purging of Dirty Data" Data 5, no. 2: 50. https://0-doi-org.brum.beds.ac.uk/10.3390/data5020050