Multi-Slot BLE Raw Database for Accurate Positioning in Mixed Indoor/Outdoor Environments
by
 ,
,
Fernando J. Aranda
1,*, 
Felipe Parralejo
1,
Fernando J. Álvarez
1 and
Joaquín Torres-Sospedra
2,3
1
Sensory Systems Research Group, University of Extremadura, 06006 Badajoz, Spain
2
UBIK Geospatial Solutions S.L., Espaitec2, Campus de Riu Sec, Avda. Vicente Sos Baynat S/N, 12006 Castellón, Spain
3
Institute of New Imaging Technologies, Universitat Jaume I, Avda. Vicente Sos Baynat S/N, 12071 Castellón, Spain
*
Author to whom correspondence should be addressed.
Data 2020, 5(3), 67; https://0-doi-org.brum.beds.ac.uk/10.3390/data5030067
Submission received: 19 June 2020
/
Revised: 24 July 2020
/
Accepted: 28 July 2020
/
Published: 30 July 2020
(This article belongs to the Special Issue Data from Smartphones and Wearables)
Abstract
:The technologies and sensors embedded in smartphones have contributed to the spread of disruptive applications built on top of Location Based Services (LBSs). Among them, Bluetooth Low Energy (BLE) has been widely adopted for proximity and localization, as it is a simple but efficient positioning technology. This article presents a database of received signal strength measurements (RSSIs) on BLE signals in a real positioning system. The system was deployed on two buildings belonging to the campus of the University of Extremadura in Badajoz. the database is divided into three different deployments, changing in each of them the number of measurement points and the configuration of the BLE beacons. the beacons used in this work can broadcast up to six emission slots simultaneously. Fingerprinting positioning experiments are presented in this work using multiple slots, improving positioning accuracy when compared with the traditional single slot approach.
Dataset: 10.5281/zenodo.3927588
Dataset License: CC-BY
1. Introduction
The quick growth of wireless communication networks has fostered new uses beyond simple information exchange. Among others, wireless networks can be used as a backing for applications that serve a certain task according to the user’s position. This kind of developments, known as Location-Based Services (LBSs), has grown exponentially in recent years because of its integration with smartphone devices [1]. The most extended technology for LBS is the Global Navigation Satellite System (GNSS), which can provide position accuracy within the order of meters [2], high accuracy may be obtained with, for instance, Precise Point Positioning and augmentation services [3]. Despite its world-wide range, GNSS loses accuracy in complex environments, such as indoor scenarios, because of the physical barriers that the signal must go through [4]. Withal, of the daily time is spent on these environments [5], and therefore, an alternative is needed to provide position estimations for LBS in indoor areas. Many technologies have been tested to build Local Positioning Systems (LPS). Among those are Ultrasound [6,7], Visible Light Communication (VLC) [8] and radio-frequency networks, such as Radio-Frequency Identification (RFID) [9], ZigBee [10], Wi-Fi [11], Bluetooth Low Energy (BLE) [12] and Ultra Wide Band (UWB), [13]. Some of these, as the ultrasound and UWB, can provide centimeter precision, but need special hardware, increasing the price. A special group of technologies are those that are embedded in most off-the-shelf smartphones and hence do not need extra components on the receiver, like BLE and Wi-Fi.
In addition to the diversity of technologies, several positioning techniques have been used for the development of these systems. Some of the best-known techniques are the time of flight (ToA), which is the travel time of a signal from the transmitter to a receiver. Similarly, the time differential of arrival (TDoA) measures the time difference between signals arrival to an anchor. Other types of techniques, such as the angle of arrival (AoA), is used to estimate the orientation of the signal. The received signal strength indicator (RSSI) is very popular in smartphone applications since no additional hardware is required to measure it. RSSI-positioning can be used in three different ways: proximity, ranging, and fingerprinting. Proximity applications use the position of the emitter with the highest RSSI [14], meanwhile ranging methods model signal propagation between transmitter and receiver to estimate the distance between them [15]. Fingerprinting or scene analysis positioning compares real-time with previous measurements in known positions [16].
Despite its implementations, Wi-Fi scanning process is being restricted in many operating systems [17] which might decrease or restrict the amount of information available for positioning. The closest alternative is Bluetooth Low Energy (BLE), a radio frequency communication protocol designed for short and energy-saving communications in the context of the Internet Of Things (IoT). it was born as part of the Bluetooth 4.0 core specification and works in the same Industrial Scientific and Medical (ISM) band of 2.4 GHz where Wi-Fi, Zig-Bee, and classic Bluetooth works. BLE transmitters, known as beacons, are small encapsulated devices that can work with a battery for more than a year, broadcasting BLE signals with specific pieces of information. The BLE has already been used successfully for LBS in indoor environments such as airports [14] and museums [18,19,20]. In this situation, many researchers have concentrated on the techniques and algorithms used to increase the accuracy and robustness of this system.
The need for databases with experimental data for the scientific community has proved to be very important. Not all researchers have the resources to develop long-scale indoor positioning experiments and, at the same time, recent events have reduced the possibility of conducting these experiments. Experimental data sharing is a solution to this inconvenience because it allows researchers to test their algorithms and methods over real data. The publishing of the experimental measurements in the form of a database assures the reproducibility and comparability of results by different researchers and it can also help to test new works in uncommon scenarios. Moreover, evaluating a new indoor positioning system over multiple diverse datasets, as commonly done in machine learning, might bring a more relevant evaluation in terms of generalization and statistical robustness.
The primary contribution of this work is to introduce to the research community a new BLE RSSI database. The database is composed of raw measurements from different smartphones for the development of indoor positioning and proximity techniques. The experiments were carried out in the buildings of the Faculty of Science at the University of Extremadura (UEx) in its campus in Badajoz (Spain). We used three different deployment configurations to assess the robustness of the system and the influence of its characteristics. All measurements were correctly labeled with its area identification (for proximity applications) and coordinates in a local positioning system (for positioning applications). These data provide information to test the effects of different configurations within the same environment, the effects of diverse devices and the effects of using more than one signal (slot) for each transmitter device. Moreover, additional resources like the environmental description and examples on how to use the data for proximity and positioning applications are also provided along with the database.
The remainder of this work is organized as follows. In Section 2 related BLE datasets are described. Section 3 explains the collection procedure and the test environment of the database introduced in this paper. Section 4 presents the database organization. Section 5 shows some of the examples on how to use the supplementary materials and the implementation of a basic positioning algorithm. Finally, a discussion and the main conclusions are presented in Section 6.
2. Related Works
There are currently some databases for indoor positioning purposes, mainly for Wi-Fi fingerprinting. For example, Laoudias et al. database [21] provides an extensive measurement campaign at the KIOS Research Center with five devices for 2D positioning, whereas Mendoza et al. database [22] provides measurements from various devices and with various collection campaigns, repeated over fifteen months within 2 floors of the library building. Regarding BLE, a systematic search criteria has been followed to include works with BLE RSSI positioning applications that have real and public accessible data. Some works are data descriptors, where the dataset itself is the main subject, while others pursue specific applications that give the experimental data some publicly.
A summary of the information of each dataset is shown in Table 1. Some considerations must be taken into account regarding the information provided about each set:
- Active developments are defined as those in which the user carries the receiver. On the contrary, in passive systems the user carries a transmitter that is detected by the static receivers.
- There are basically two ways of storing the data: raw and fingerprinting. Raw measurements correspond to the individual measurements of each transmitter-receiver pair in a specific time. Fingerprint vectors contain the measurements of all available transmitters in a time window. The fingerprint representation is less valuable as it looses some valuable information. e.g., if the same transmitter has been detected multiple times in the window, only one processed value (average, median, maximum or latest) is stored assigning just one timestamp to the full fingerprint vector.
- Different works have different labels for the positions, x-y coordinates on a local reference system, room or zone ID and cell ID. As an exception, only in one work position information is presented as the distance between the transmitter and the receiver. In those databases where no deployment area is given this area has been estimated using the planes and figures attached to the database itself or the related academic paper.
- Some works repeat the same experiment with different transmission configurations. In Table 1 these are presented as different subsets of the same database. This consideration is not taken for those works that use more than one receiver because training and test can be done with different devices.
- the number of Reference Points (RP) is the number of sample points with a position label and an RSSI associated with it. The number of samples is the amount of independent units of data presented by a database regardless the format.
- BLE beacons parameters are the transmission power, expressed in decibel-milliwatts (dBm) and the frequency, expressed as hertz (Hz). Some values can be found in the dataset descriptor or the related academic paper; while others are calculated directly from the databases themselves.
- The collection procedure can be done statically, going through all the RP and taking measurements only when the user is over them or while moving through a path. This is indicated in the table in the collection procedure section. Databases that include both are indicated as partial in the table. Usually, for fingerprinting applications the training set is collected statically and the test dynamically.
- The transmission power of the beacons is expressed in decibel-milliwatts (dBm) which is the ratio in decibels (dB) with reference to one milliwatt (mW).
Missing values in the table means that, to the best of the authors knowledge, that information was not given neither in the datasets nor in the data descriptors. In some works, the relevant information is not explicitly provided. The database must be loaded to determine the missing information, thus, the researchers must use its resources to load and work with the database to identify the missing descriptive data and the technical issues of each system.
Mendoza et al. [23] give a multi-scenario BLE database for fingerprinting positioning. The data were collected in two different scenarios with some set-ups in each one. The first set is acquired in a laboratory in which the collection was repeated for different transmission powers. In the second scenario, a university library, only one transmission power is used but with three different smartphones. Data are given as RSSI fingerprinting vectors, with local coordinates as position labels. Apart from the database itself, a set of Matlab scripts are provided with the database. These scripts give an easy way to handle the database, with different loading and filtering options. The environmental information, which includes walls and obstacles, is attached in the form of Matlab plots. Moreover, some basic positioning algorithms and usage-examples are implemented. This database presents the data as a fingerprinting vector for each measurement in each reference point. Different measurements from the same beacon within a time window are averaged, thus, losing information about the RSSI experimental distribution. The database and the supporting materials can be downloaded from the Zenodo repository at [23].
Miskolc IIS Hybrid IPS [25] is a hybrid indoor positioning dataset with data from custom hardware with magnetometer, Wi-Fi and Bluetooth modules. Measurements were taken in in a multifloor university building using the ILONA system [26] only one device was part of the building infrastructure. On the other hand, all the detected Wi-Fi access points were part of the building itself or nearby facilities. Results were reported as a single CSV file in which each row was a fingerprinting vector, represented as null if the access point was not detected in a particular location. Each datum is labeled with both, absolute position in a local coordinates system and symbolic location. Beacons and Wi-Fi access point are unknown and the data descriptor does not specify if the Bluetooth measurements are from classic Bluetooth devices or BLE.
In [27] an indoor positioning and tracking system based on convolutional neural networks and image recognition is deployed and evaluated in a hospital. Each participant wore a Gimbal Series 10 beacon [38] detected by a set of Raspberry Pi 3 boards installed in the ceiling. RSSI measurements for each beacon are transformed into a B&W image, which is the input of their algorithm. The dataset is divided in two groups: (i) raw BLE RSSI measurements with timestamps, beacons ID and Raspberry ID, and (ii) the B&W images. Training and test data are presented in different files. The beacons were configured to emit with a power of dBm at a rate of 10 Hz. The database is available in [28].
Byrne et al. [29], performed a series of experiments in several houses using different kinds of sensors. All the environments were marked with tags on the floor that were recognized by a camera embedded in a custom wearable device worn by the user. This custom device also integrated a tri-axial accelerometer and a BLE antenna. BLE advertising signals were used to send the accelerometer measures from the wearable to a set of Raspberry Pi 3 boards distributed in each house. At each Raspberry the BLE RSSI for each incoming package was recorded and transmitted to a server via Wi-Fi. The recorded video and its timestamp are used as ground truth of the systems. In total, the experiment was repeated in four houses with different configurations (rooms and floors), one user, and between 8 and 11 Raspberry Pi boards per house. Supporting materials are also provided with the database, like the layout for each floor and an script in python to load and work with the dataset. The database can be downloaded from [30].
Sikeridis et al. [31] describe a dataset of BLE measurements in a multifloor indoor environment. Several Raspberry PI 3 boards were distributed inside a university building to detect the signals of the Gimbal 10 Series worn by the users. In total, 46 participants carried the beacon during the month that the experiment lasted. The beacons were configured to emit at 1 Hz and with +1 dBm. The exact position of the Raspberry Pi boards are not given and no positioning label information is attached to the measurements. Each processed BLE package is individually stored as a vector containing the timestamp, RSSI, beacon ID and receiver ID. Apart from the metadata, no further material is provided, neither in the original work, nor in the repository [32] where the database can be downloaded.
In [15] Sadowski et al. the use of different wireless technologies is evaluated, including BLE, for indoor positioning. Two sets of experiments are presented in two different indoor scenarios. In each of them, two configurations are repeated with three beacons and three measurement points. The first set is focused on establishing the RSSI relationship with distance meanwhile the second aims to test each technology using trilateration as an indoor positioning algorithm. Three different Gimbal beacons were used as emitters and a Raspberry Pi 3 board was used as the receiver. RSSI in a set of text files and transmitter-receiver distances are given in the original work. The database itself can be found in [33].
Mohammadi et al. [34] present as a database the experimental tests carried out for their system based on a semi-supervised machine learning algorithm. A set of beacons was distributed using a regular grid in a university hall. A user with a smartphone and a custom application detected and stored the signals from each beacon. The environment was divided into cells following a regular grid, so that each cell could be identified from the indices that determine their row and column. The data is given as fingerprinted vectors with the missing values replaced by a constant value of dBm. Besides, another set of measures, much more numerous, but not labeled, is also provided. These data are used for the development of the semi-supervised learning algorithm. Regardless of the tag, each one has, in addition to the RSSI of each beacon, the timestamp of the fingerprint. The iBeacon protocol was used although the specific hardware for the BLE beacons is not specified in the work.
Baronti et al. [36] present a complete BLE database that take into account different passive and active fingerprinting developments in a floor of a university building. The database is divided in six sections: a train set with static measurements; a test set with dynamic measurements, in which a user followed a path; and four different social scenarios in which different users interact in different ways. In each experiment the users worn two devices at the same time: a Rad Beacon Dot by Radius Networks [39] and an Honor 8 Smartphone with a custom Android application. On the the other a set of Raspberry Pi boards boards with the BLED112 USB dongle Bluetooth [40] is used as receiver (for the RadBeaconTags) and as transmitter (for the Android device). All the experiments were repeated for three transmission power configurations: dBm, dBm and 3 dBm for both the RadBeacon and the Raspberrys Pi boards. The ground truth was given separately using the cell ID of the measurement and the timestamp. BLE files contained the raw RSSI, a timestamp and the transmitter and receiver IDs.
3. Setup and Measurement Procedure
The beacons used in this work were the IBKs Plus from Accent System [41] with a Nordic Semiconductor nRF51822 chipset controller [42]. We chose them because they could simultaneously broadcast up to six different signals, with two individually configurable slots following iBeacon®protocol and four slots following Eddystone®protocol. The configurable parameters were the advertising period, the identification code, the emission power, and a calibration factor. The identification code was implemented differently in both protocols. iBeacon®had three distinct identification elements: the Unique Universal Identifier (UUID), a 128-bit hexadecimal code, and two unsigned 256-bit integer values known as major and minor numbers. Usually, the same UUID was used within all the beacons in a system and the major and minor are used to differentiate between elements. Eddystone®had different versions according to what kind of information is being broadcast. The simplest version used a Unique Identifier (UID), which is a unique 16-byte hexadecimal code, to distinguish between beacons. Other versions of the protocol were designed to transmit specific data, such as a Uniform Resource Locator (URL) or sensor and telemetry information, but all of them used the same UIDs for source identification. Aside, all slots within a beacon shared the same media access control address (MAC), which was defined by the BLE protocol. In this work, the UUID and the UID were used to characterize each slot following a custom-defined format. The emission period was set to 200 ms for all the slots, and the calibration was left with its default value. The transmission power was configured differently for each slot as shown in Table 2, but following the same pattern in all the beacons.
Measurements were performed using three different smartphones with a custom developed application. This app uses the standard Android BLE application program interface (API) and does not incorporate any third-party libraries. The most aggressive scanning mode, called Low Latency, was used for all the experiments. Android allows two ways to handle BLE scanning results. In the first option, all the results received in a time window are delivered to the application layer (the top of BLE layer stack) at the same time, while in the second option each result is reported individually when detected. In this work, the second mode was used since the first one did not update measurements on the same device within the same time window, causing a loss of information.
All the experiments were performed in the buildings of the Physics and Mathematics departments of the Faculty of Science at the University of Extremadura, on its campus in Badajoz, Spain. Three different deployments were made at these locations, varying in each one the position as well as number of reference points, and the area covered by the system, as shown in Table 3.
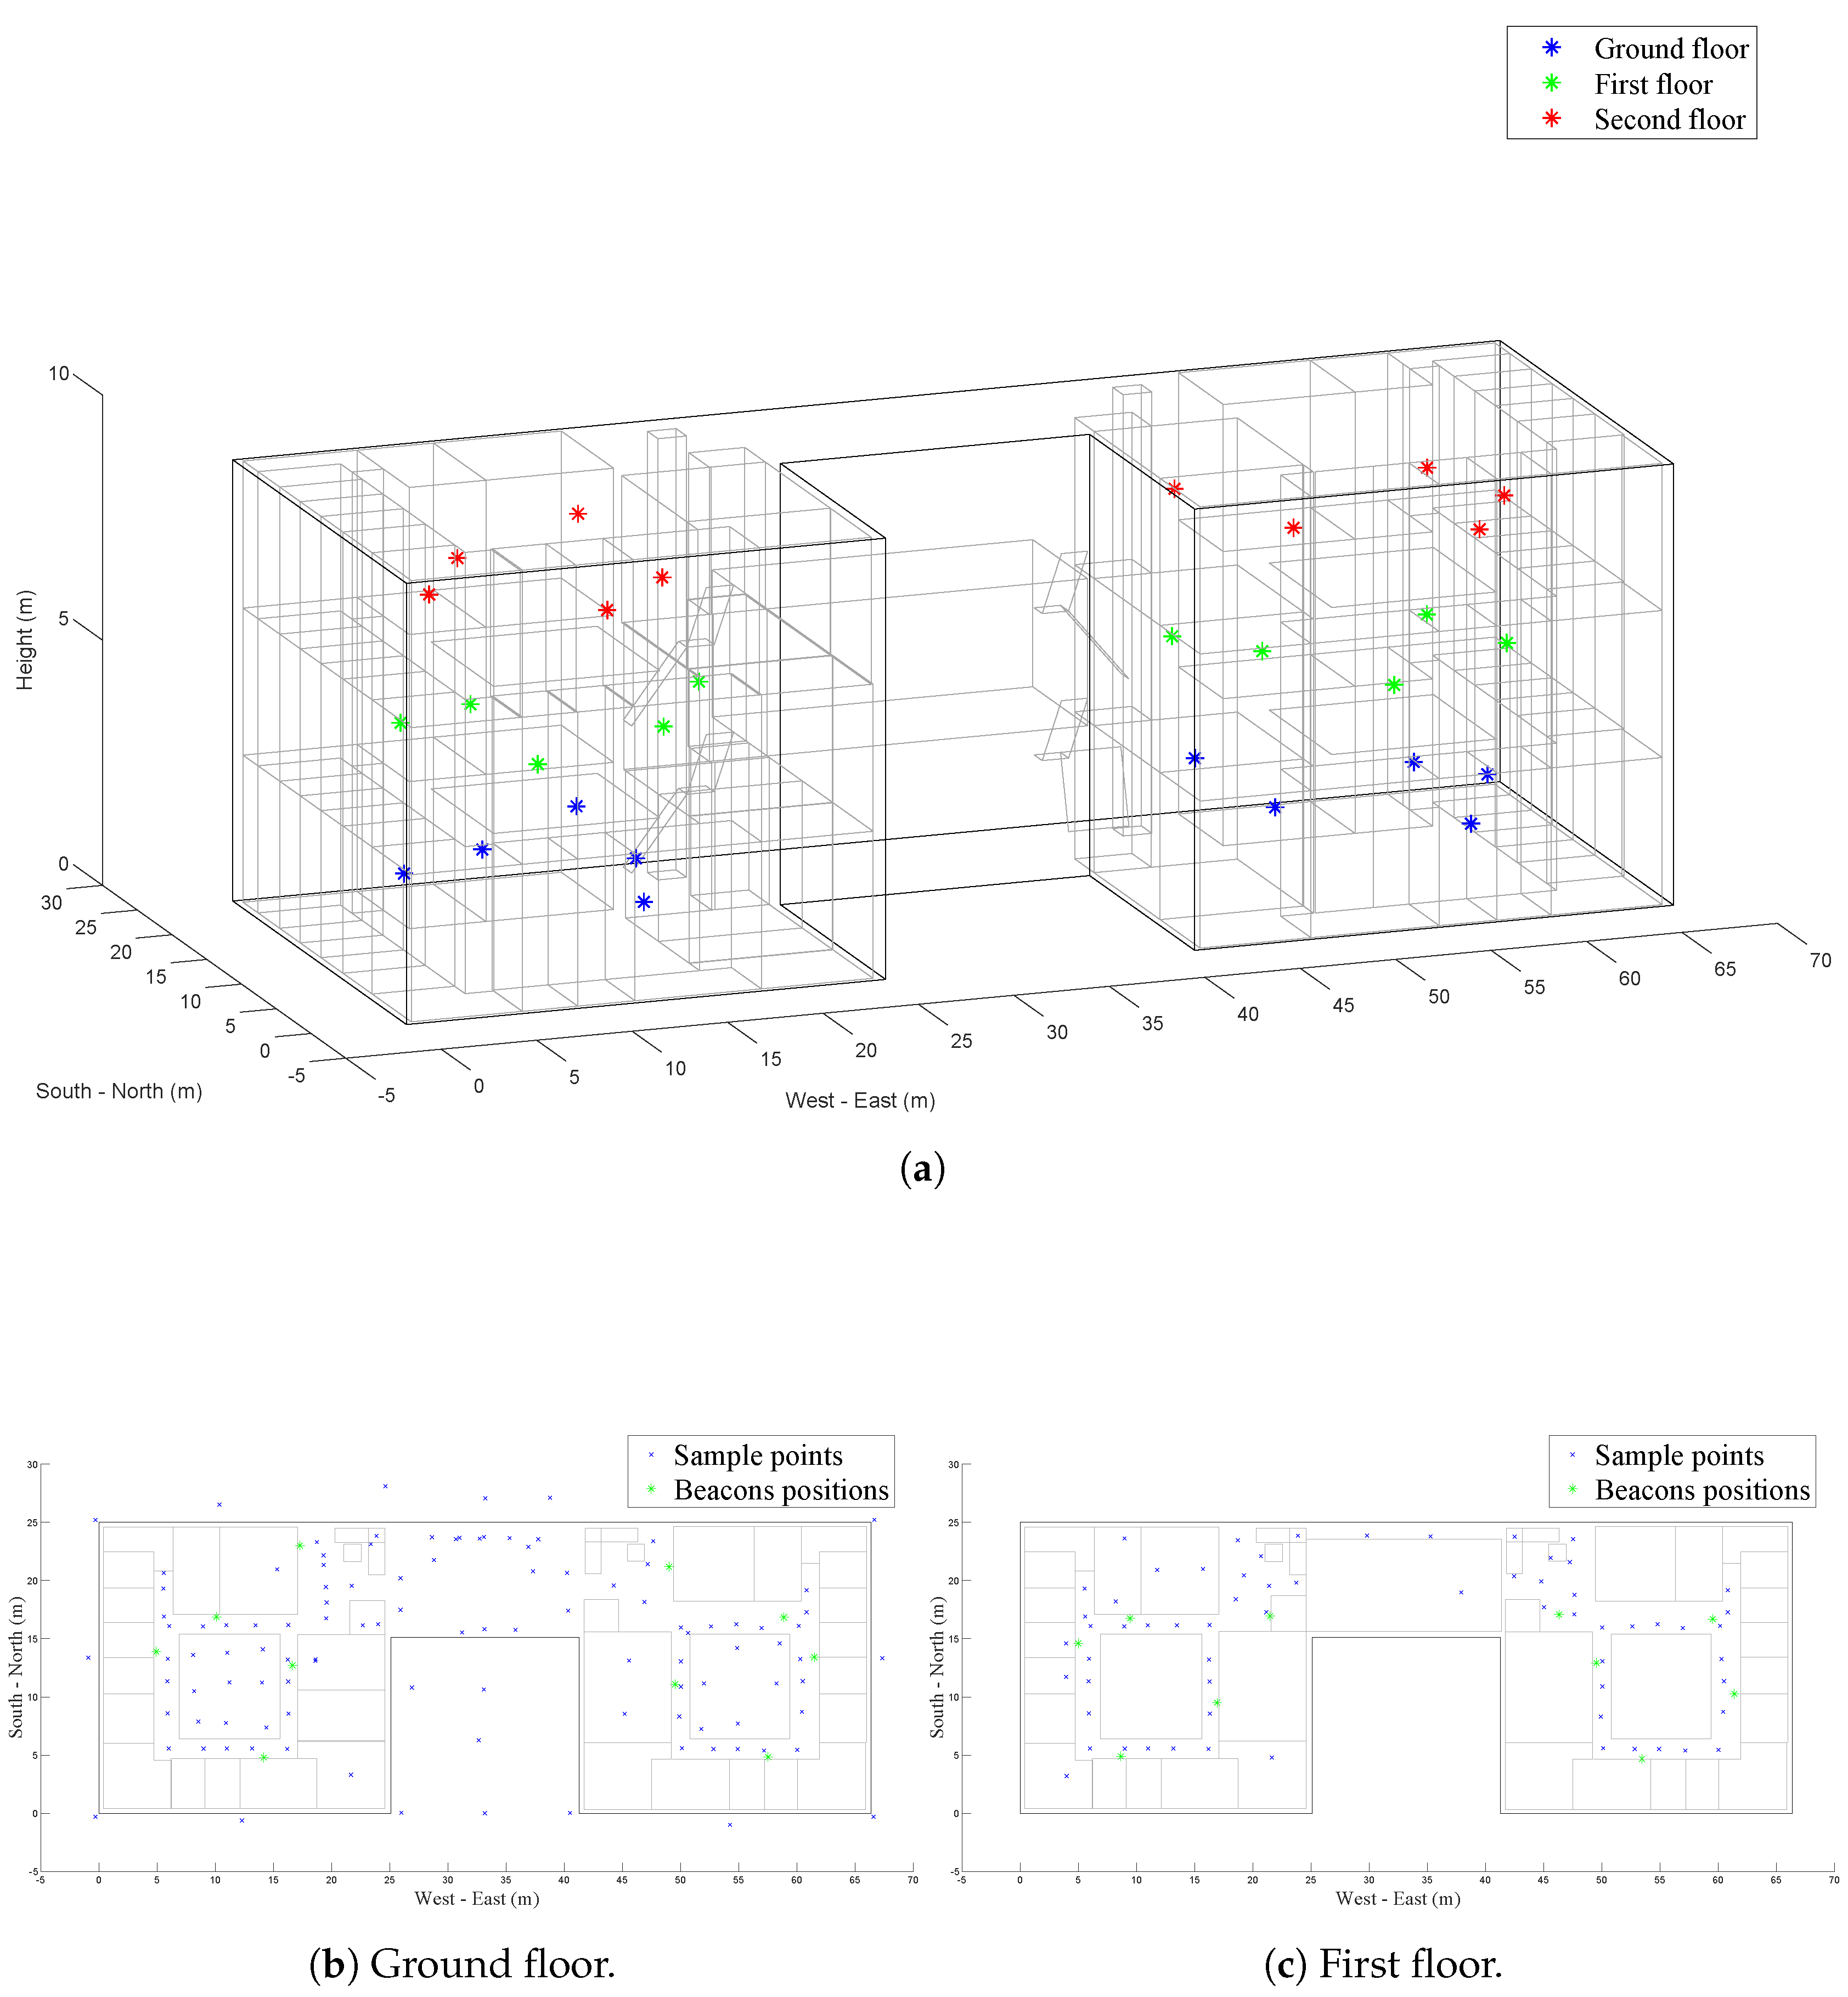
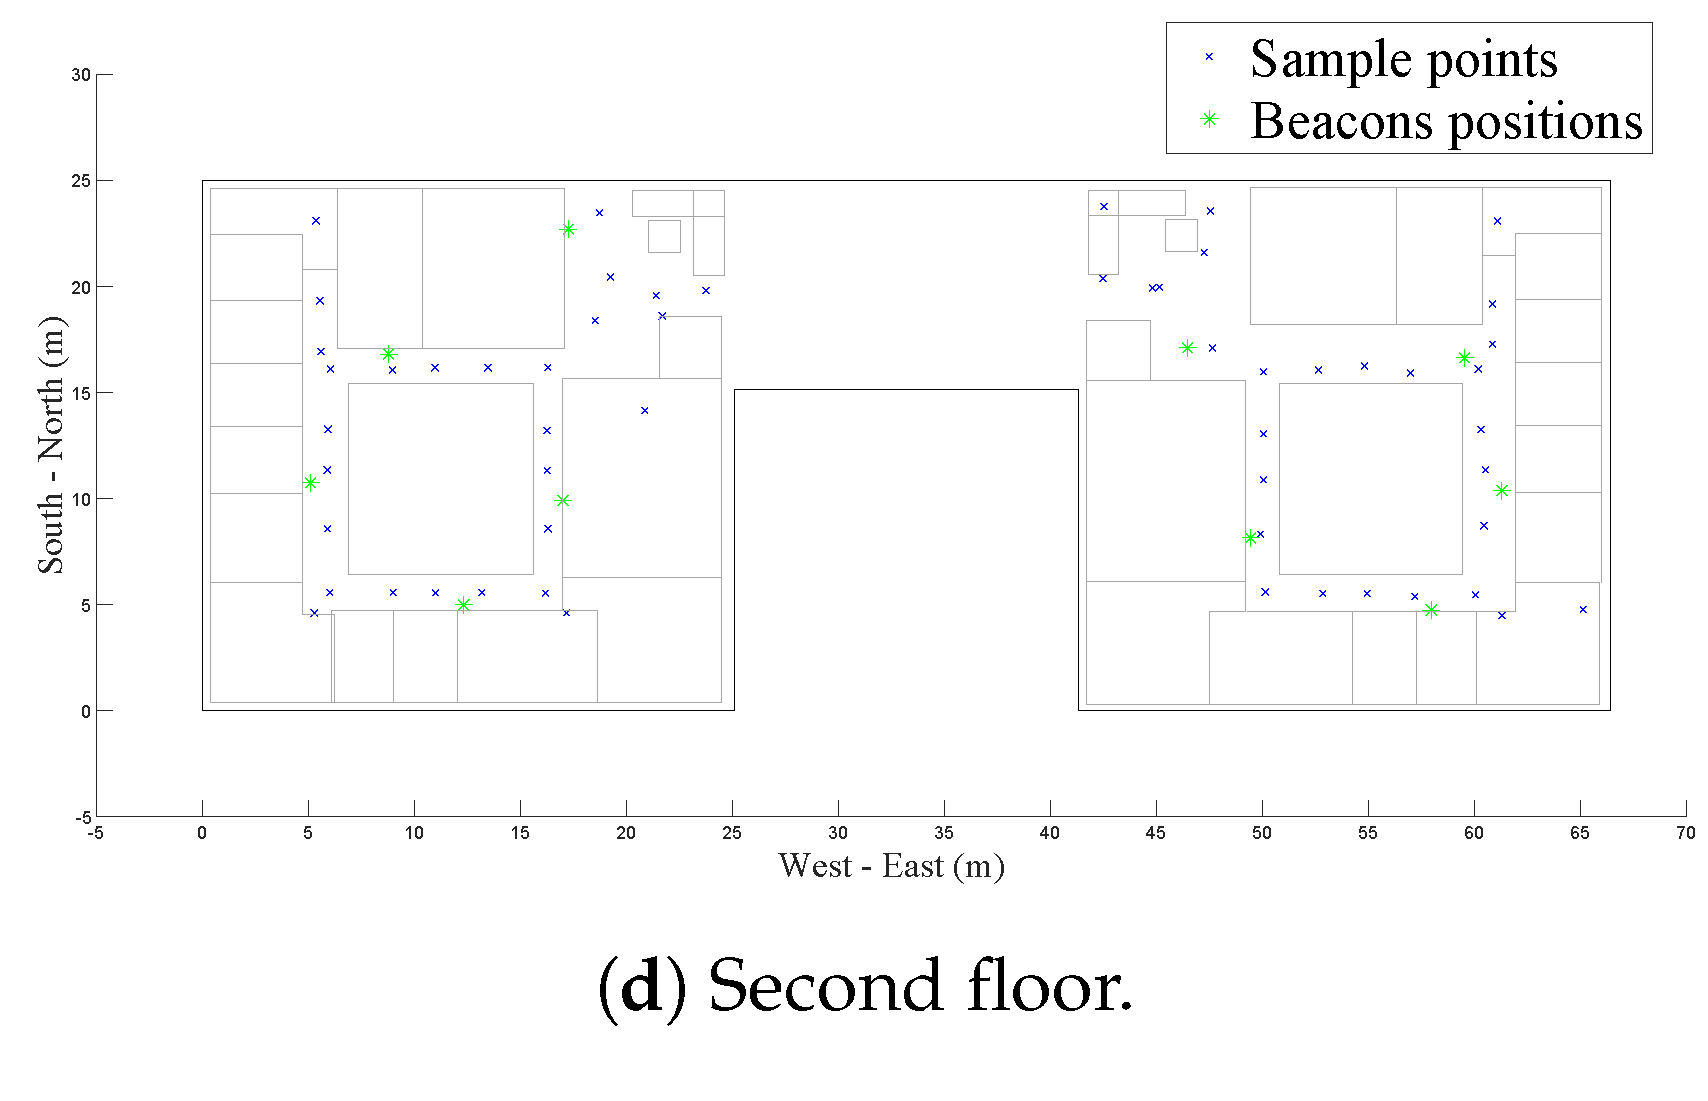
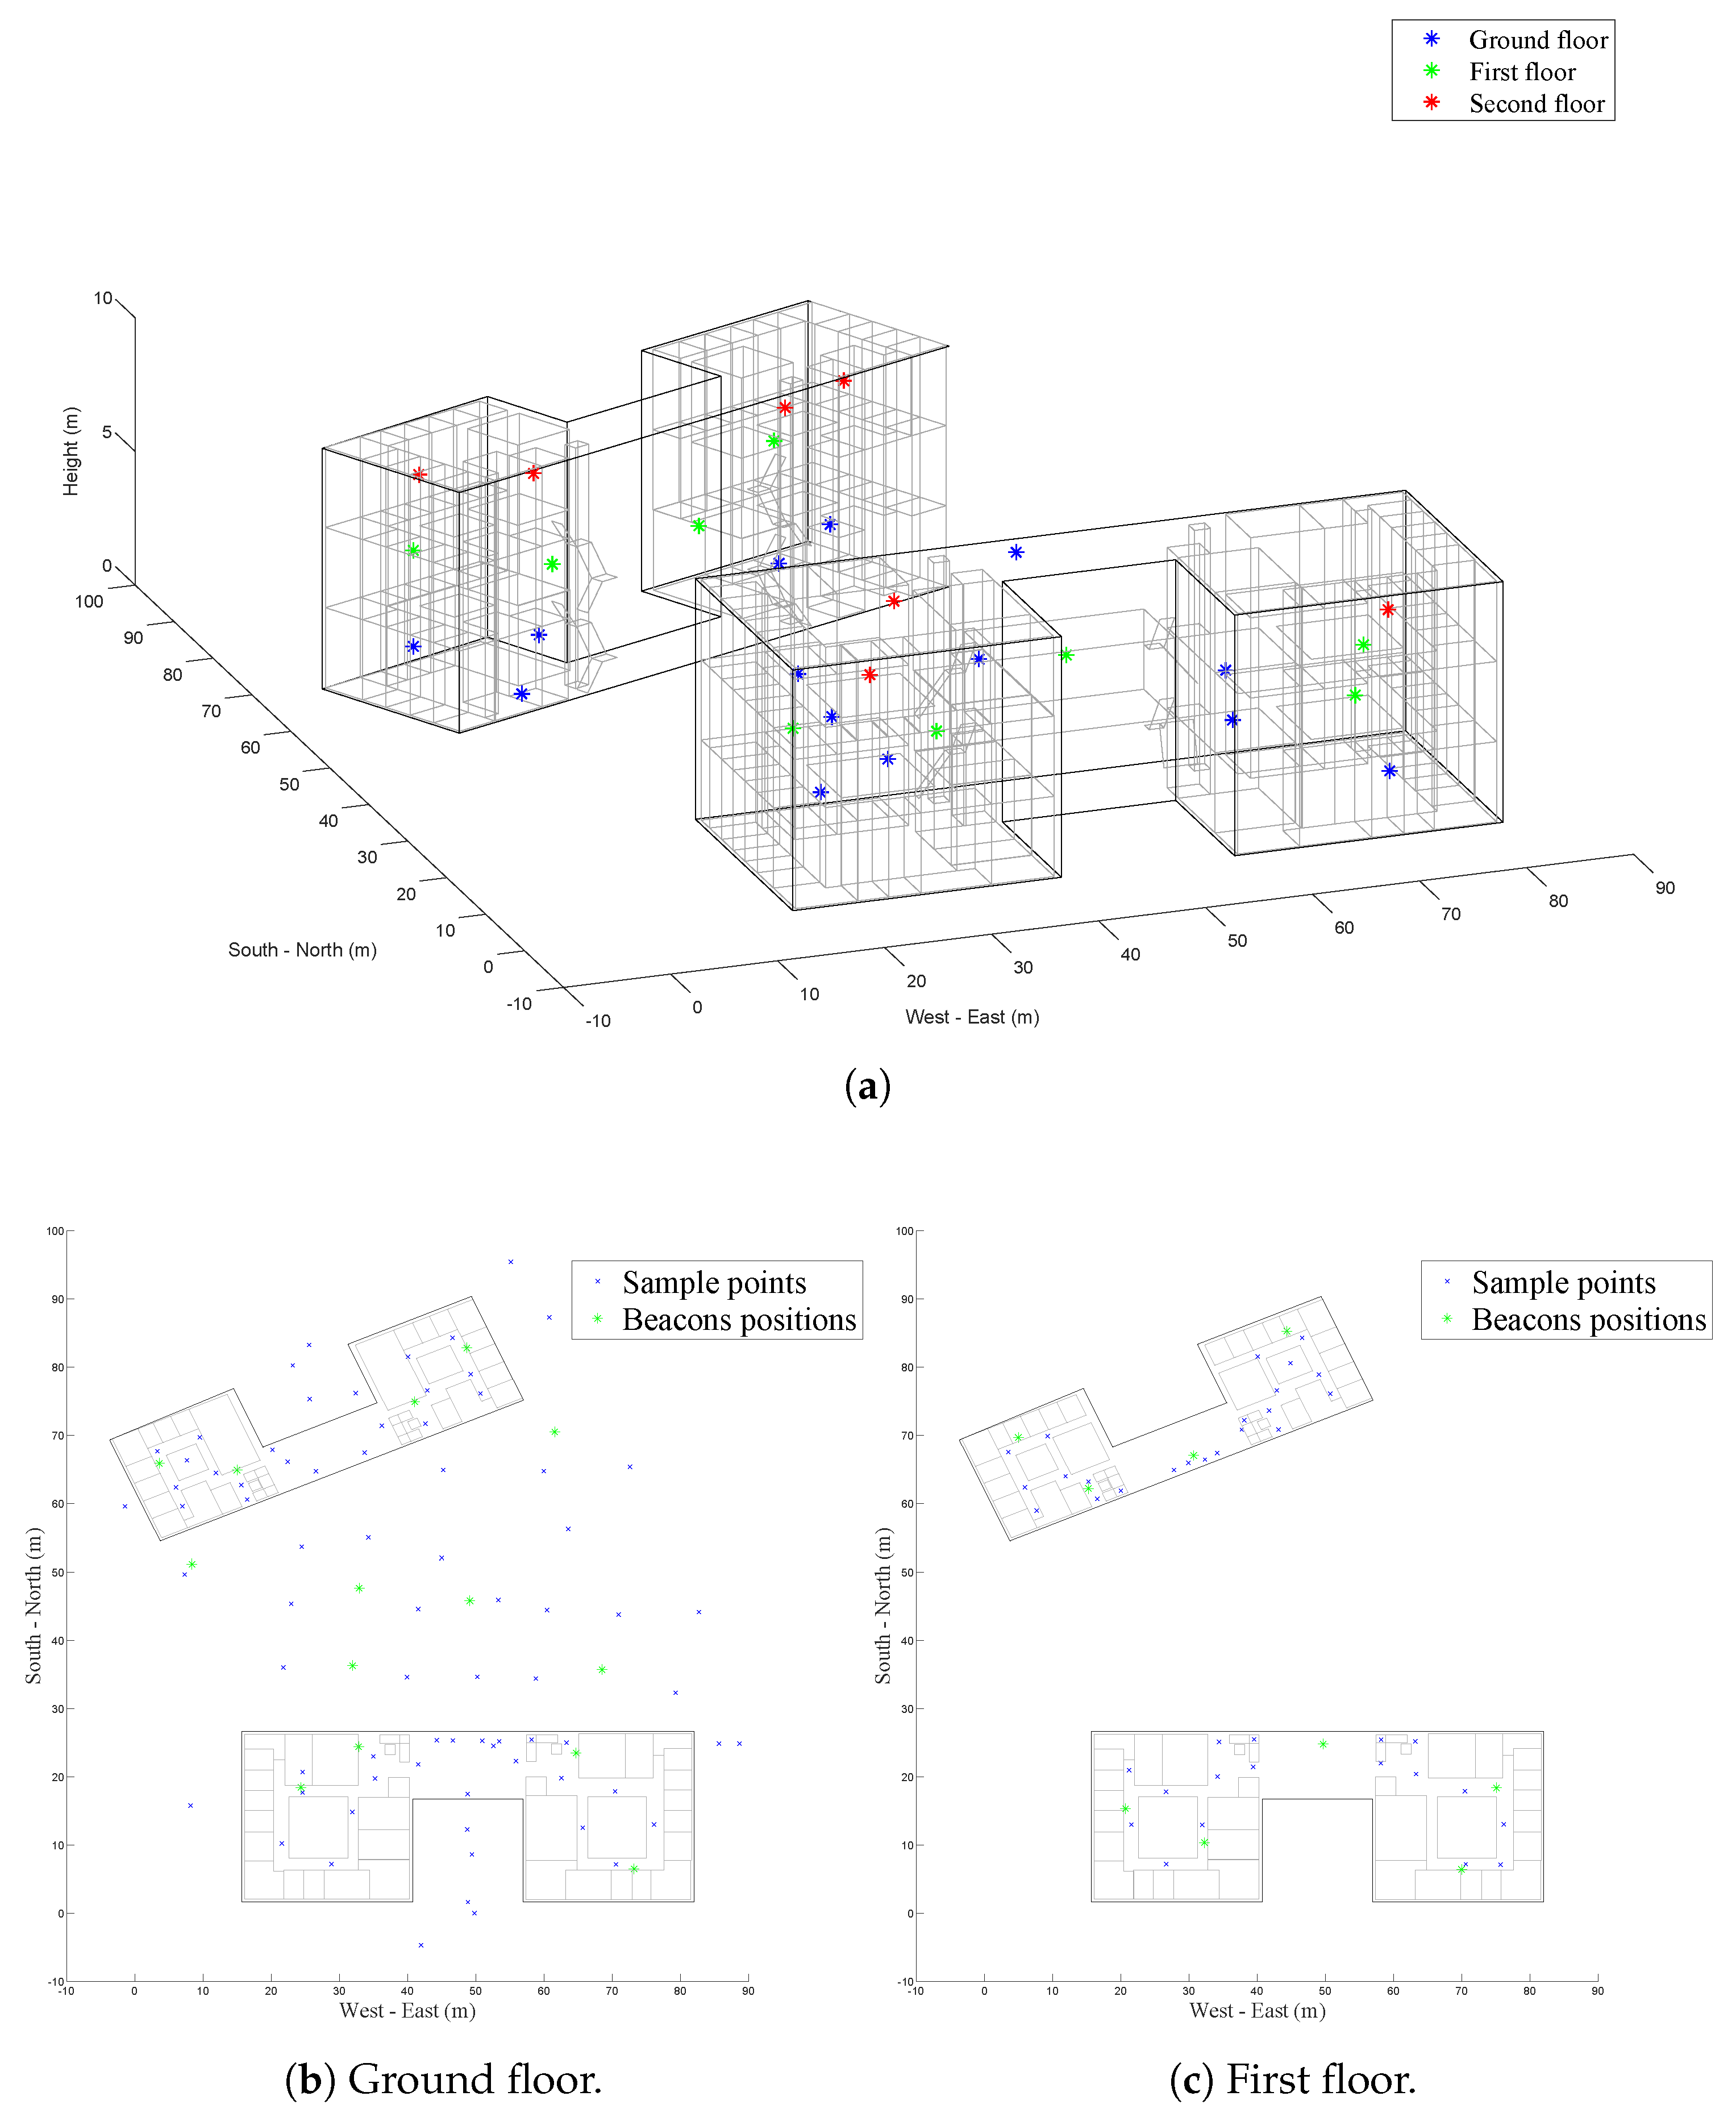
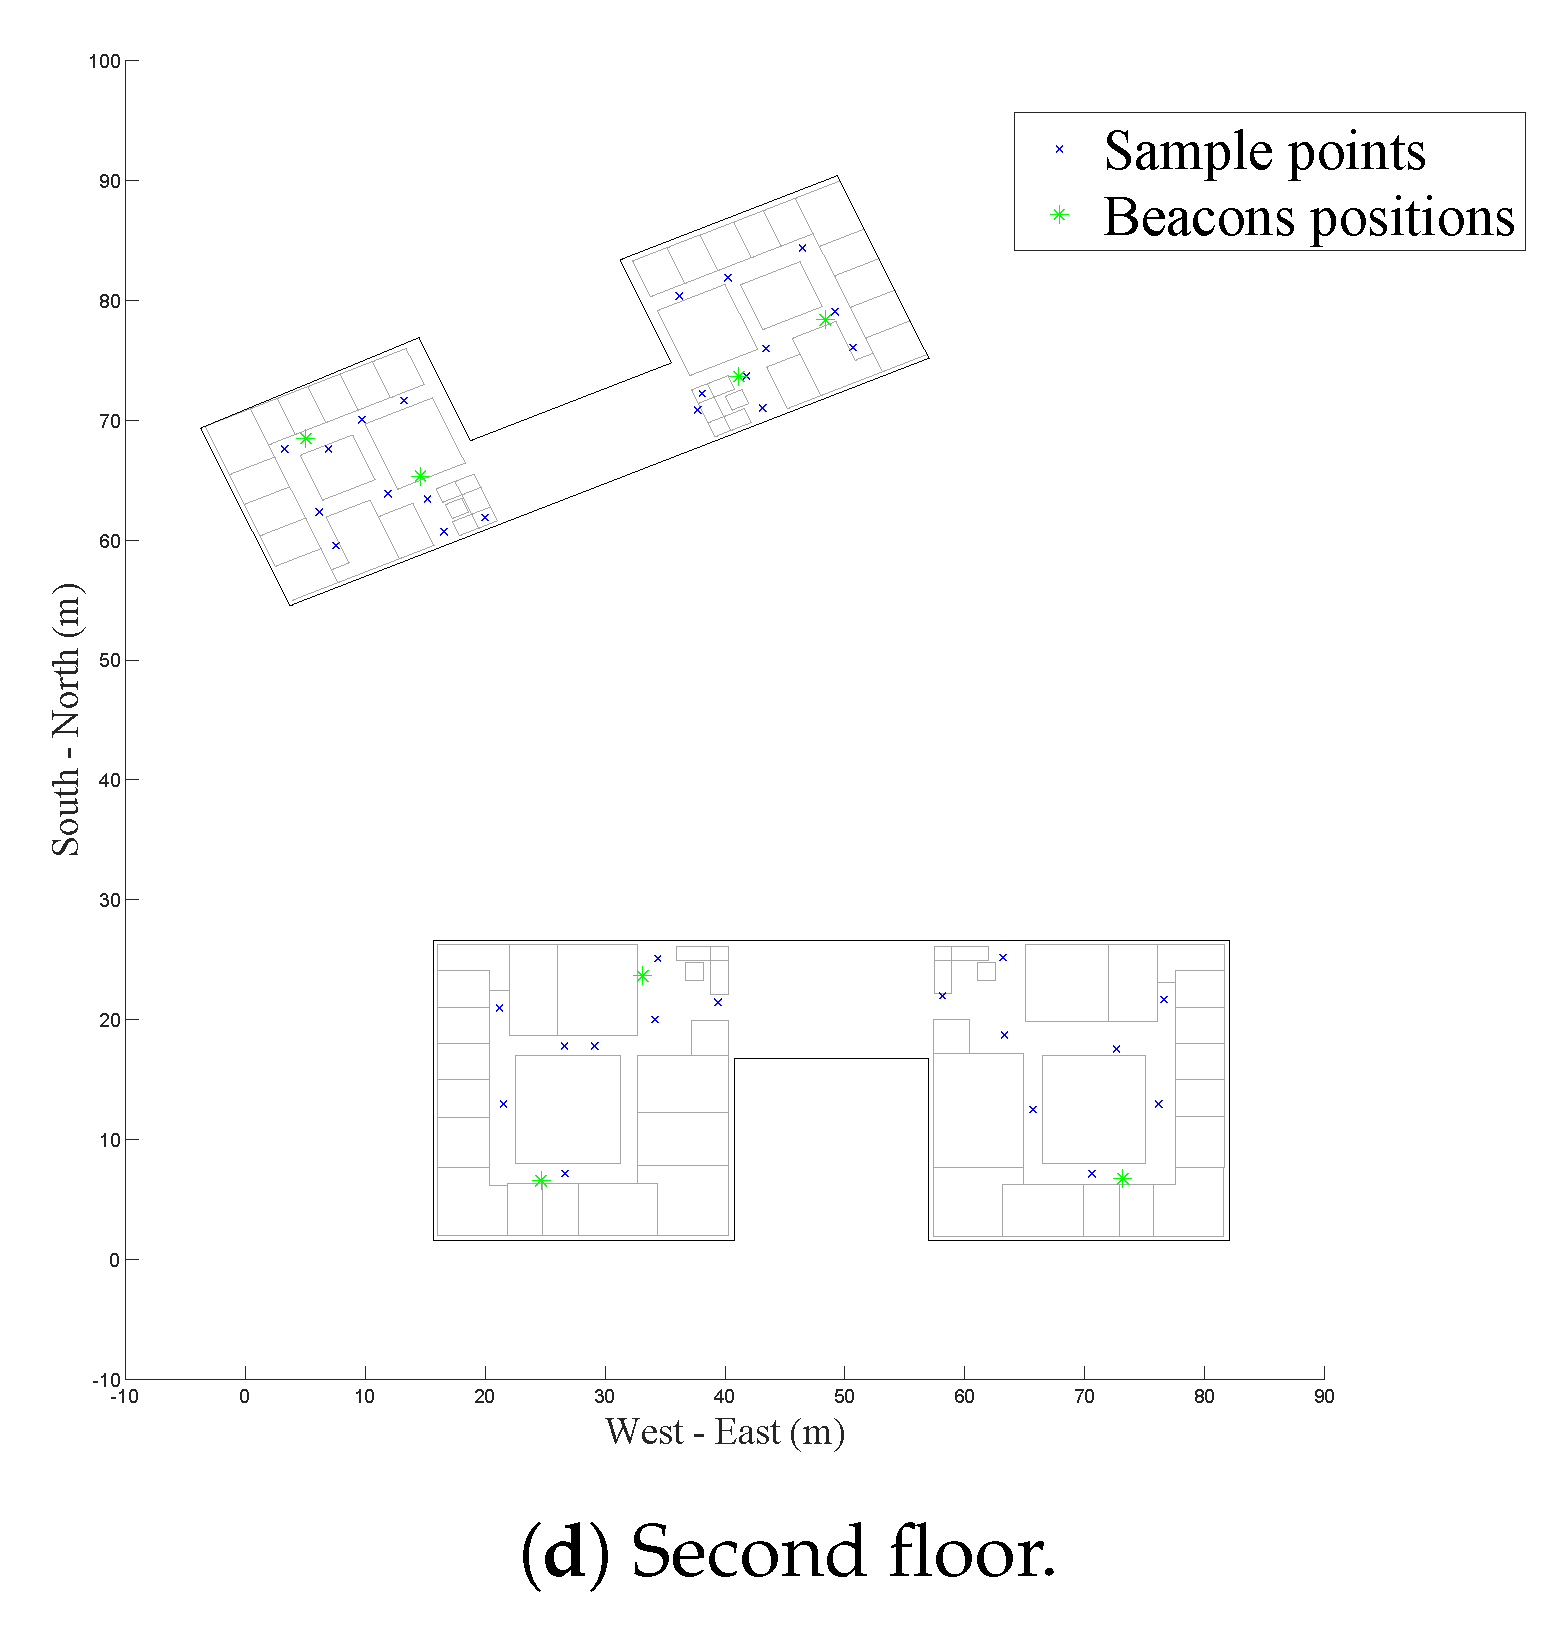
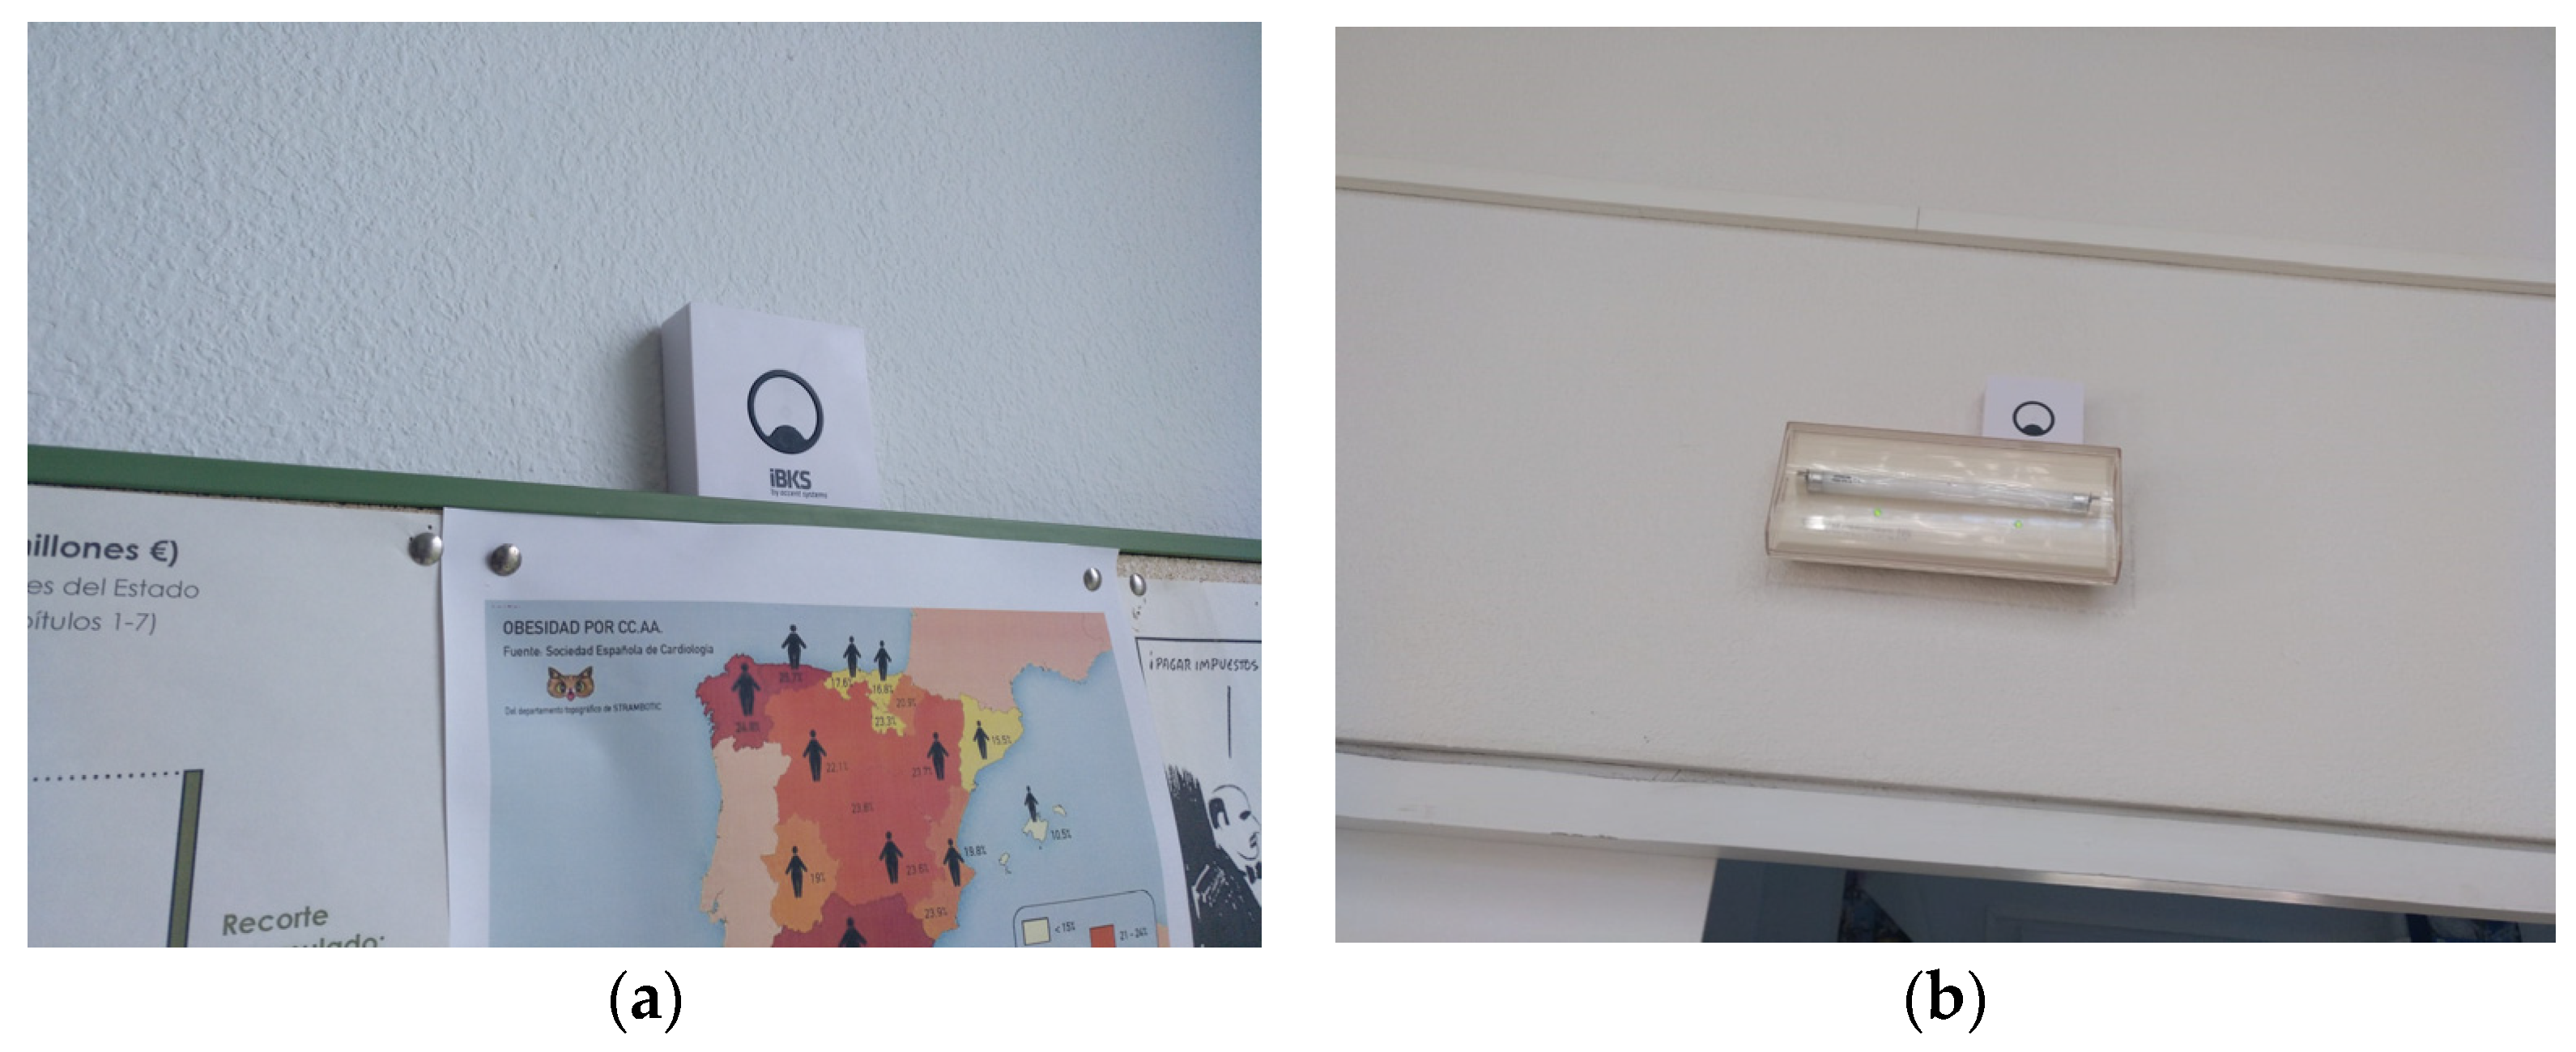
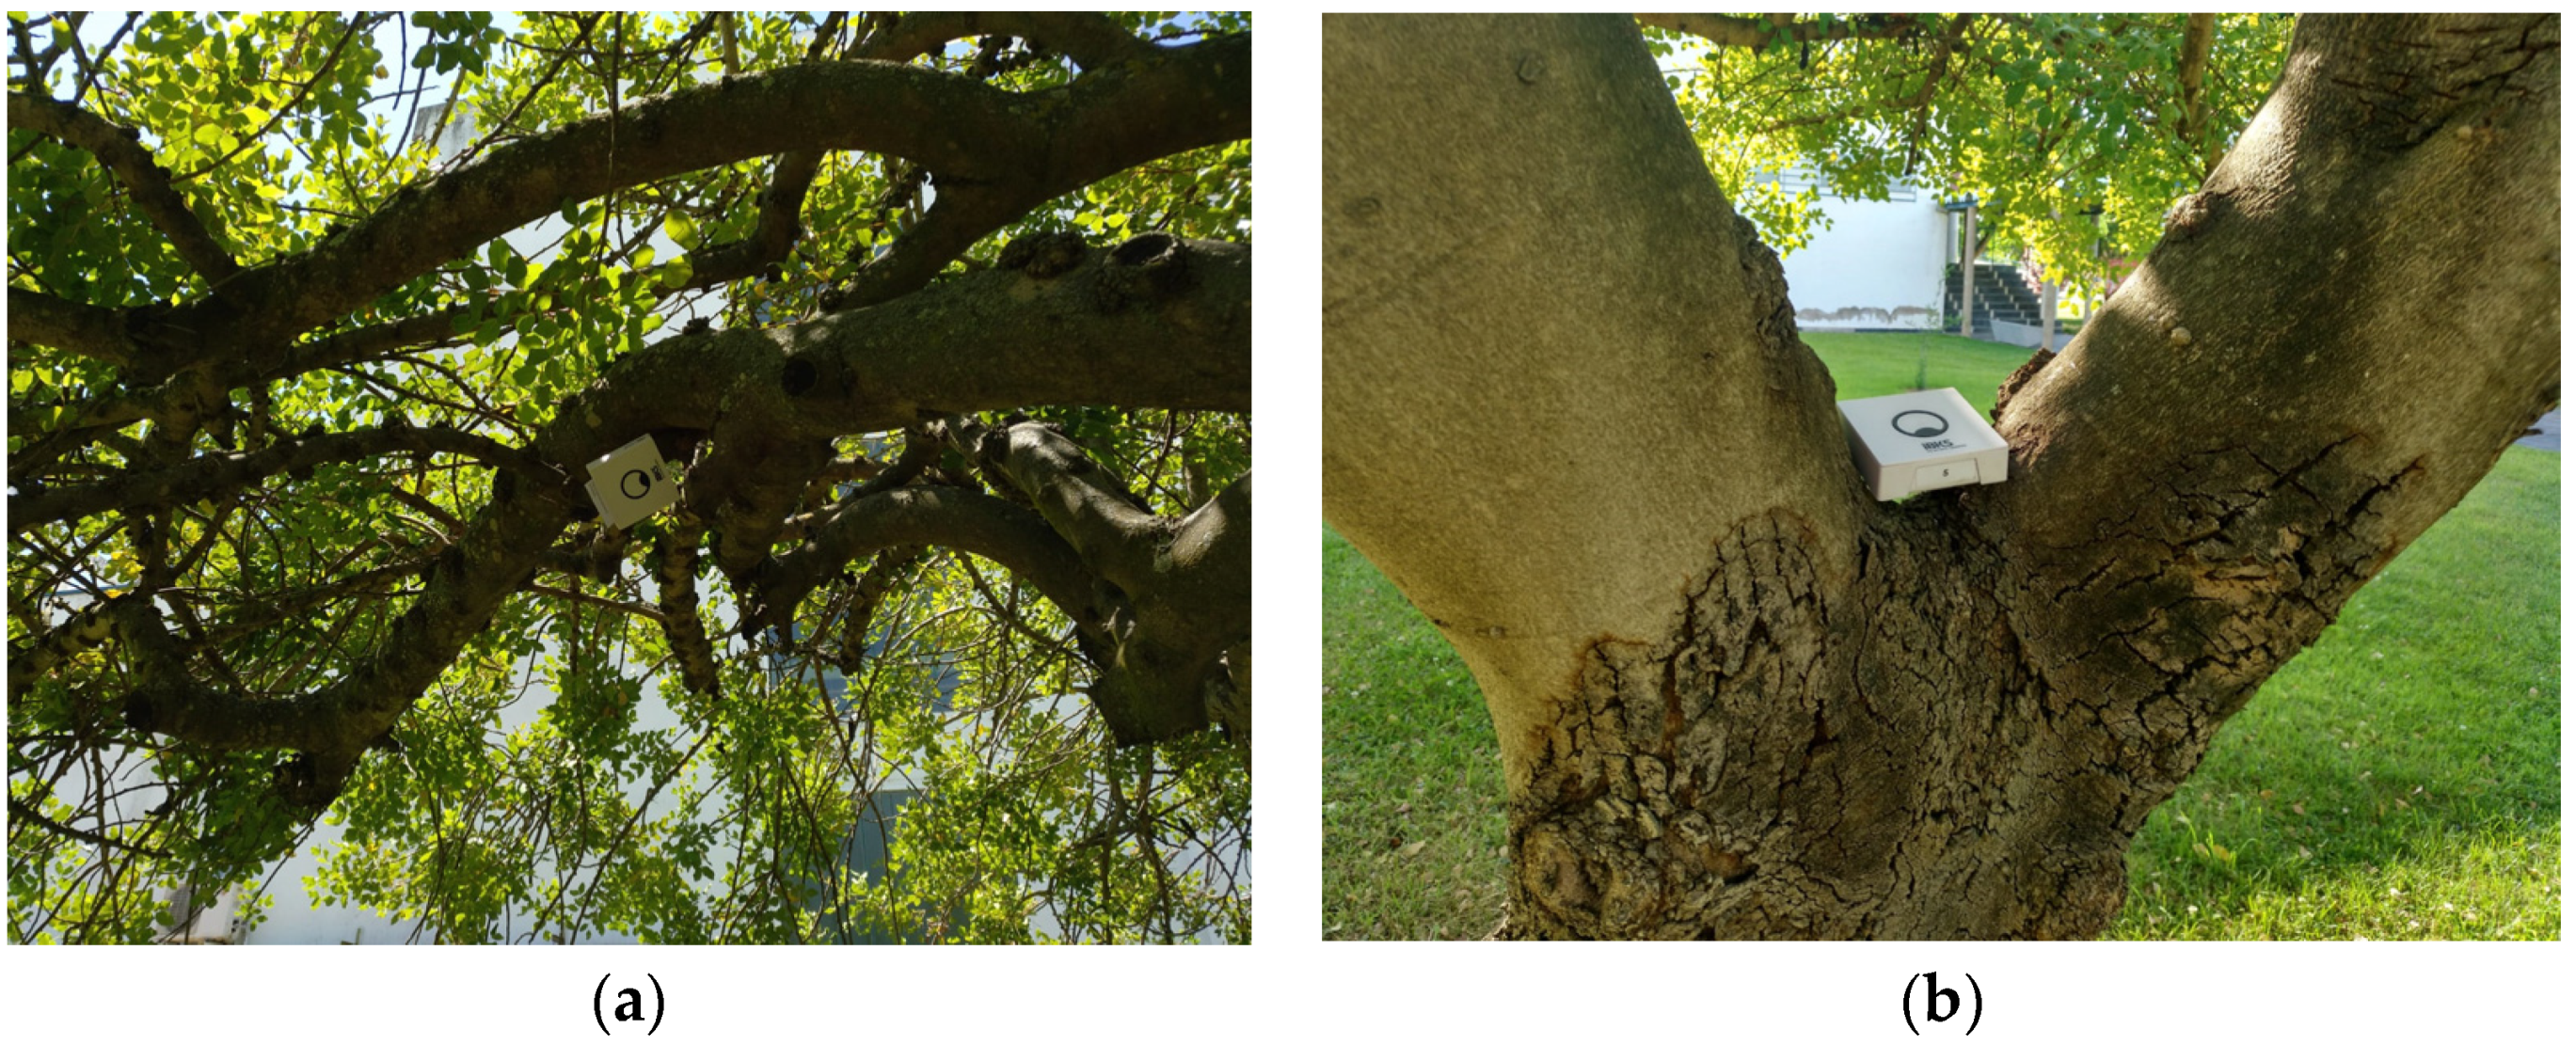
The first deployment is focused on the Physics department buildings. These were shaped by two cubic structures joined by a walkway on the first floor. The second deployment was an extension appending new RP outside the buildings and new levels in specific locations inside. The last deployment extended the scheme to cover the buildings of both the Physics and Mathematics departments, as well as the space in between. A scheme of this scenario is depicted in Figure 1, where subfigure (a) shows a 3D view of the environment used in the first two deployments with the beacon locations using a different color for each floor. Subfigures (b)–(c) shows the drawing of each floor with the beacons location in green and the sample points in blue. Beacon positions for the first two deployments were the same but the sample points depicted were the ones used in the second deployment. In Figure 1 a scheme of the environment used in the last deployment is shown following the same criteria Figure 2. In Figure 3 the region of each deployment is shown. Examples of the beacons in the indoor and outdoor sections are shown in Figure 4 and Figure 5, respectively. For each deployment, a user moved through all the RP with a smartphone, starting the measurement once the user is on the reference point that is selected in the application. Measurements lasted 30 seconds and the user’s orientation was changed to match four orientations (north, south, west, and east) during the collection procedure. The collection procedure could have been done with the user in motion instead of statically. This would have add a new dimension to the positioning system, taking into account tracking and navigation features that are out of the scope of this work. Three different smartphones were used: a BQ Aquaris, a Samsung Galaxy S6, and Xiaomi M8, hereinafter BQ, S6 and M8 respectively. A different user held each phone during the collection procedure. Measurements were done without following a particular order and during holiday time to ensure that the environment had low presence of people.
4. The BLE RSSI Database
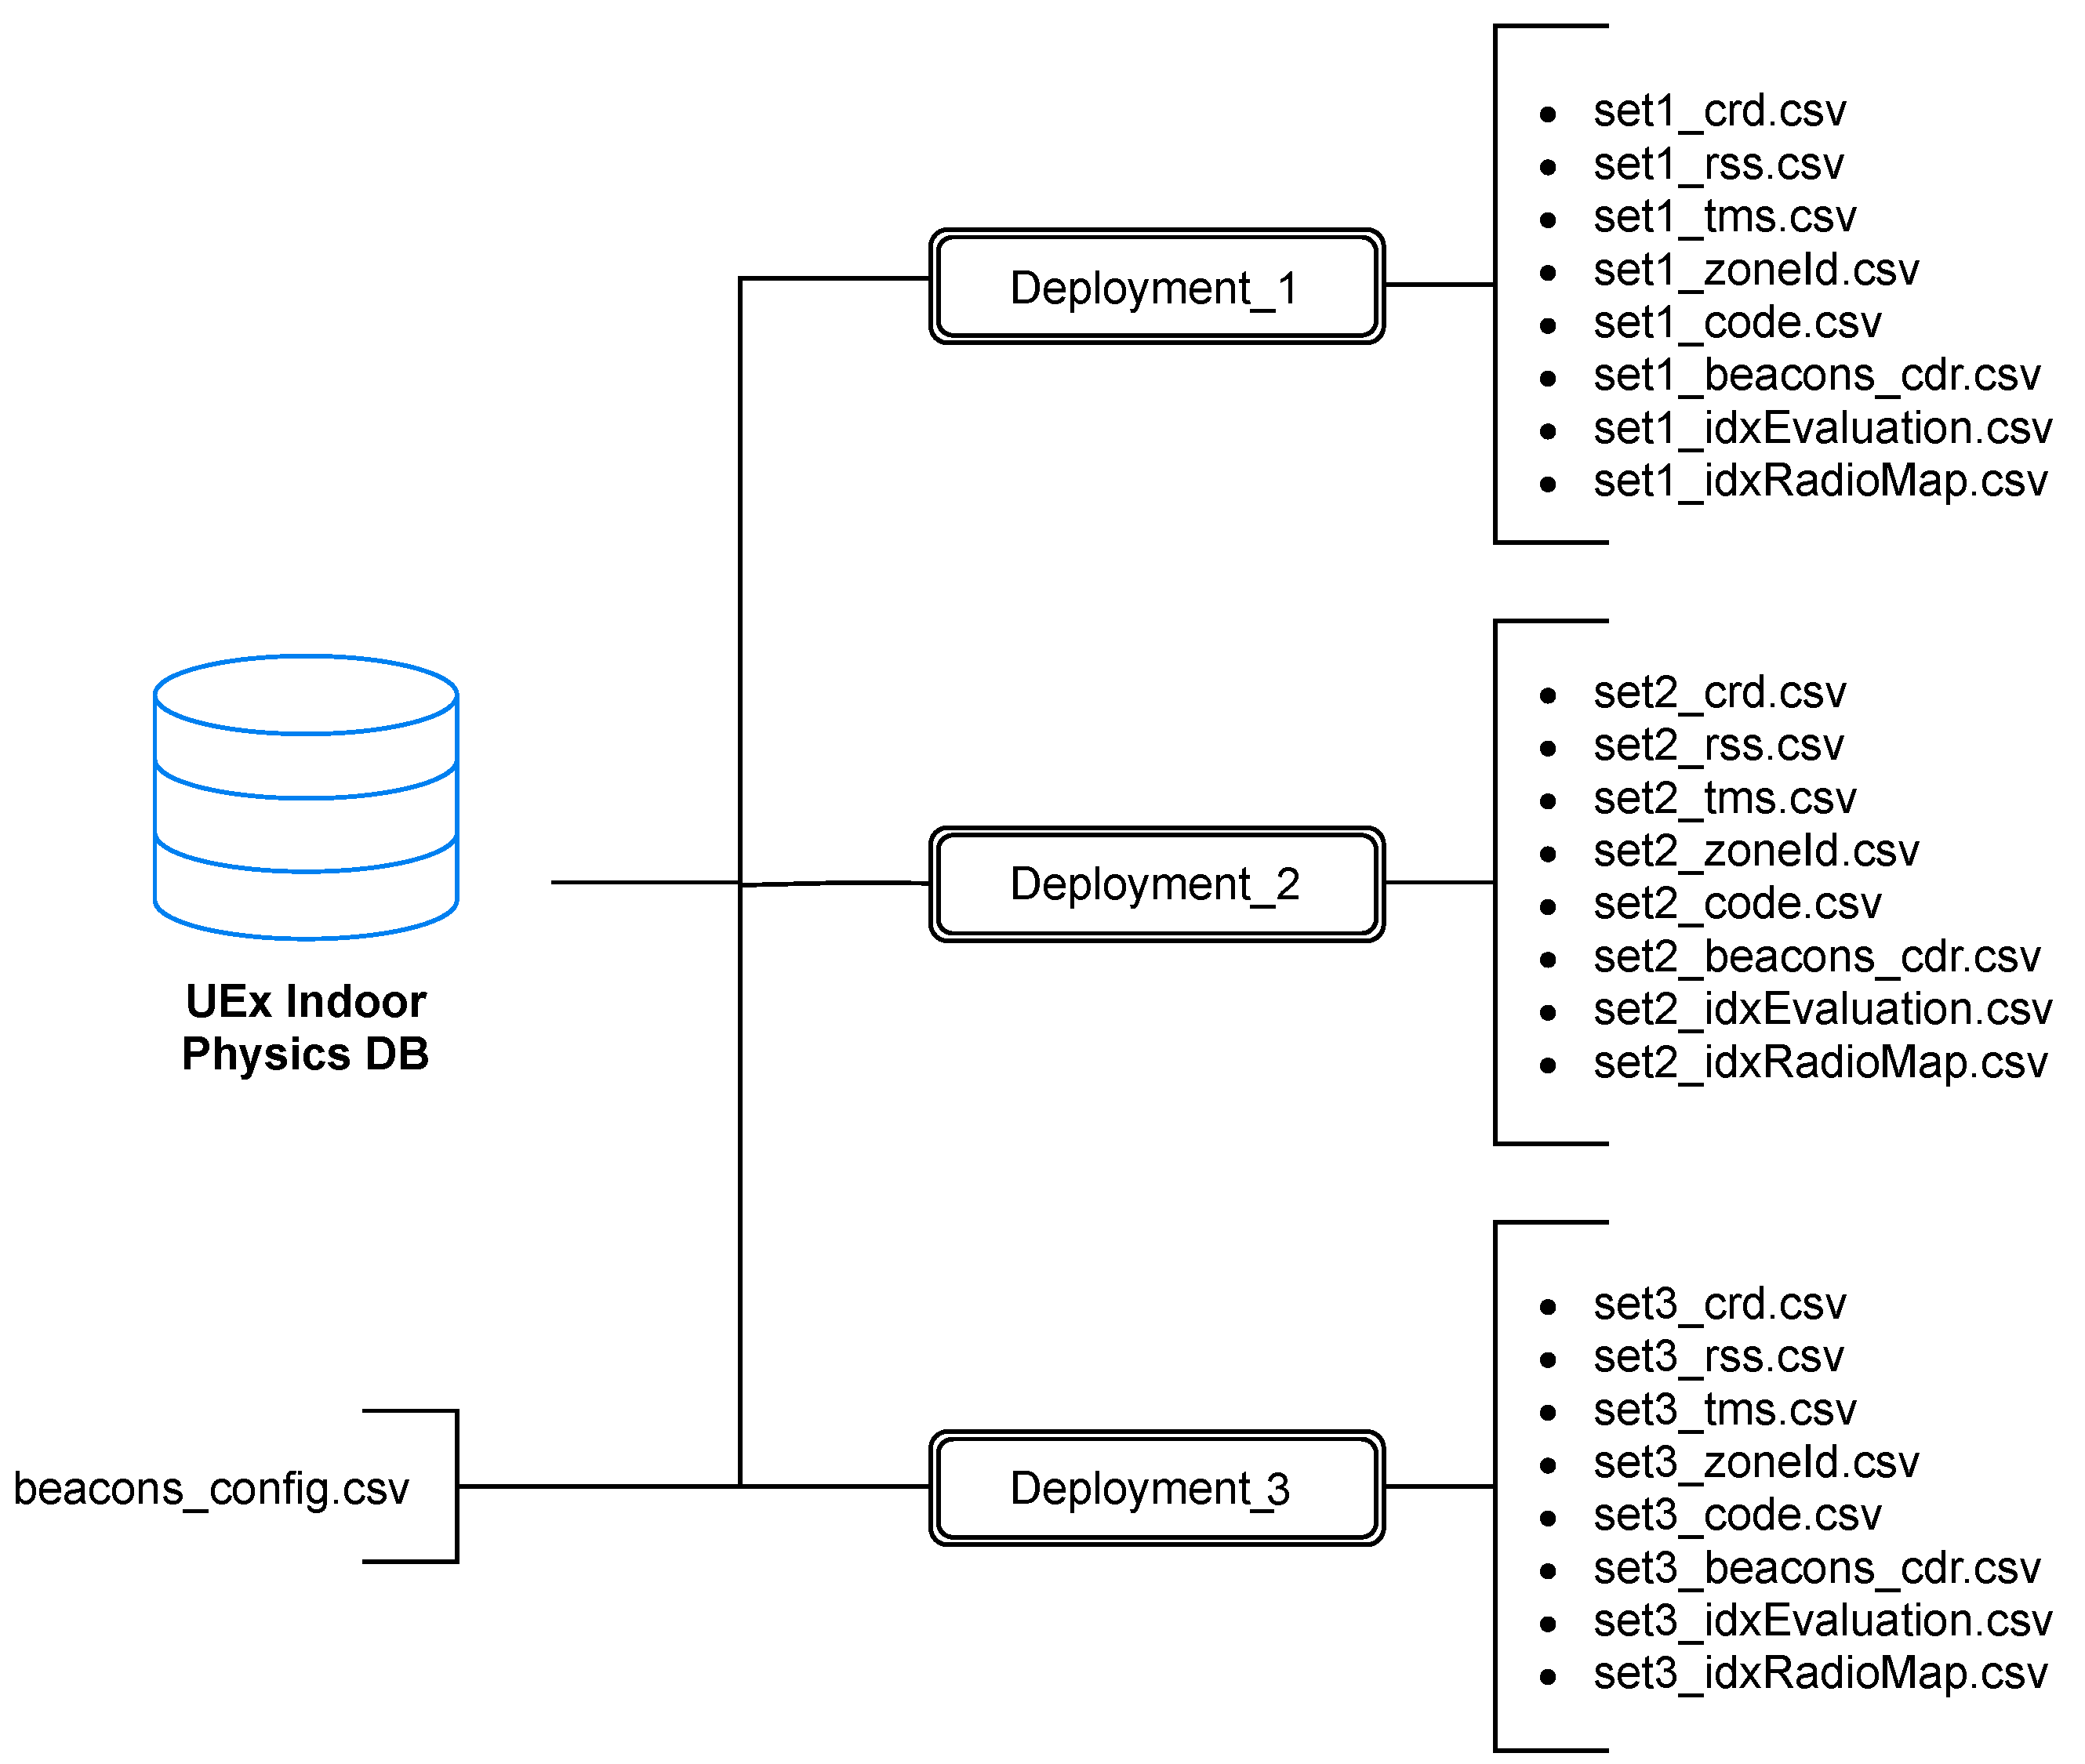
The database and the supplementary material are available at [43]. The different deployments presented in the previous section are treated as independent databases, following the same structure for all of them. Each dataset is presented as a set of eight CSV files: RSSI values, positions, timestamps, identification codes, and training and test indexes. A scheme of each data set structure is shown in Figure 6. These files have the same number of rows, which is determined by the number of different measurements in each deployment.
The set of RSSI values is presented as a list of all the individual measurements as they were reported by the smartphone. These values are presented in the seti_rss.csv file. For some points and beacons there are a lot of measurements whiles for others there are only a few or even none at all. Raw RSSI values are reported as they were by the application developed for these experiments. In the situation that no signal was detected for a given beacon the value -110 dBm was assigned assigned, which is three units lower than the minimum RSSI detected.
The seti_tms.csv file contains the timestamps of each measurement. The timestamp is measured as milliseconds since the beginning of the first of January of 1970 in Greenwich Mean Time (GMT).
The positions, presented in the seti_crd.csv file, are the local coordinates of the measurement position. The origin of these coordinates was chosen to work always with positive values inside the building. These origins were the same for the first two deployments, but different for the last one.
The seti_ZoneId.csv file contains the identification label of each measurement for symbolic positioning applications. There are 13 of these labels, six for each building: three floors and left and right sections, and a label for points in the outdoor scenario. Each of this labels corresponds to a department in the buildings, for example, the first label is associated with the modern physics department, the second one with the electronics department and so on.
Two files with boolean values indicate if a measurement is either part of the training or the test subsets. These files are seti_idxRadioMap.csv and seti_idxEvaluation.csv
An auxiliary code identifier is added to uniquely identify each measurement and to distinguish measurement in the same set from different phones. The code for each measurement has five numbers. The first one indicates the deployment, the second the phone, the third the RP and the last two the beacon and the emission slot. BQ, S6 and M8 phones are represented as 1, 2 and 3 respectively. Finally all the coordinates of the measurement points are contained in the seti_RpCrd.csv file.
The set of beacon configurations used in the experiment is presented in the beacons_config_.csv file. Each row of every file defines the configuration of each beacon. Within each beacon there are up to six emission slots whose configuration is described following the structure presented in Table 2. The transmission frequency was the same for all the slots and set to 5Hz. Finally, the zoneId_def.csv file contains the definition of the zone tag used for symbolic positioning.
5. Analysis on the Datasets and Baselines
In addition to the database, which is the basis of this work, some examples of use are presented in this section. These are provided as Matlab scripts and contain all the functions needed to load, filter and manipulate the data. This section is intended to be a starting point to facilitate the use of this database for other researchers.
This database is devoted to evaluation of indoor positioning algorithms. For this reason, the implementation of a simple but widely adopted positioning algorithm is provided for the baseline analysis of the provided databases. Mathematically modeling signal propagation in indoor environments, especially for applications that require high-resolution positioning, is a very difficult task. Fingerprinting methods offer an alternative that avoids this problem. These methods can be sorted in three groups: deterministic, probabilistic and machine learning-based approaches. Deterministic methods assume a distance function to compare and sort the elements of the training set according to test measurements. Probabilistic algorithms use the distribution of the RSSI over the measurement points to assess the position [11,44,45]. This distribution can be used assuming a known statistical distribution, such as a Gaussian, or using the experimental distribution with a normalized histogram. The machine learning-based methods use a mathematical structure whose parameters are automatically determined in a training procedure in which the data is used. These methods include the Artificial Neural Networks [46,47], Support Vector Machines [48,49,50] and Decision Trees [51,52]. In the supporting material the implementation of the deterministic One Nearest Neighbor (NN) algorithm is provided as a base line to start using the database. The NN assigns a distance measurement to every RSSI fingerprint vector in the radio map using a metric function. Usually, the Euclidean distance is used but other alternatives can be implemented [16,53]. The coordinates or position labels associated with the element with the smallest distance is the output of the algorithm. A complex version of the algorithm takes the average of more than one element, k-NN, or a weighted value using some kind of weight function, Wk-NN. In classification tasks, such as Tag ID identification, the k-NN algorithm implements a voting scheme instead of coordinates average. To apply the NN algorithm, raw data must be processed in some way. Our approach to generate the fingerprint vectors from raw RSS data is included in the supporting material and consists of averaging all the RSSI values of a beacon in a single RP, thus, creating a fingerprinting RSSI vector for each reference point.
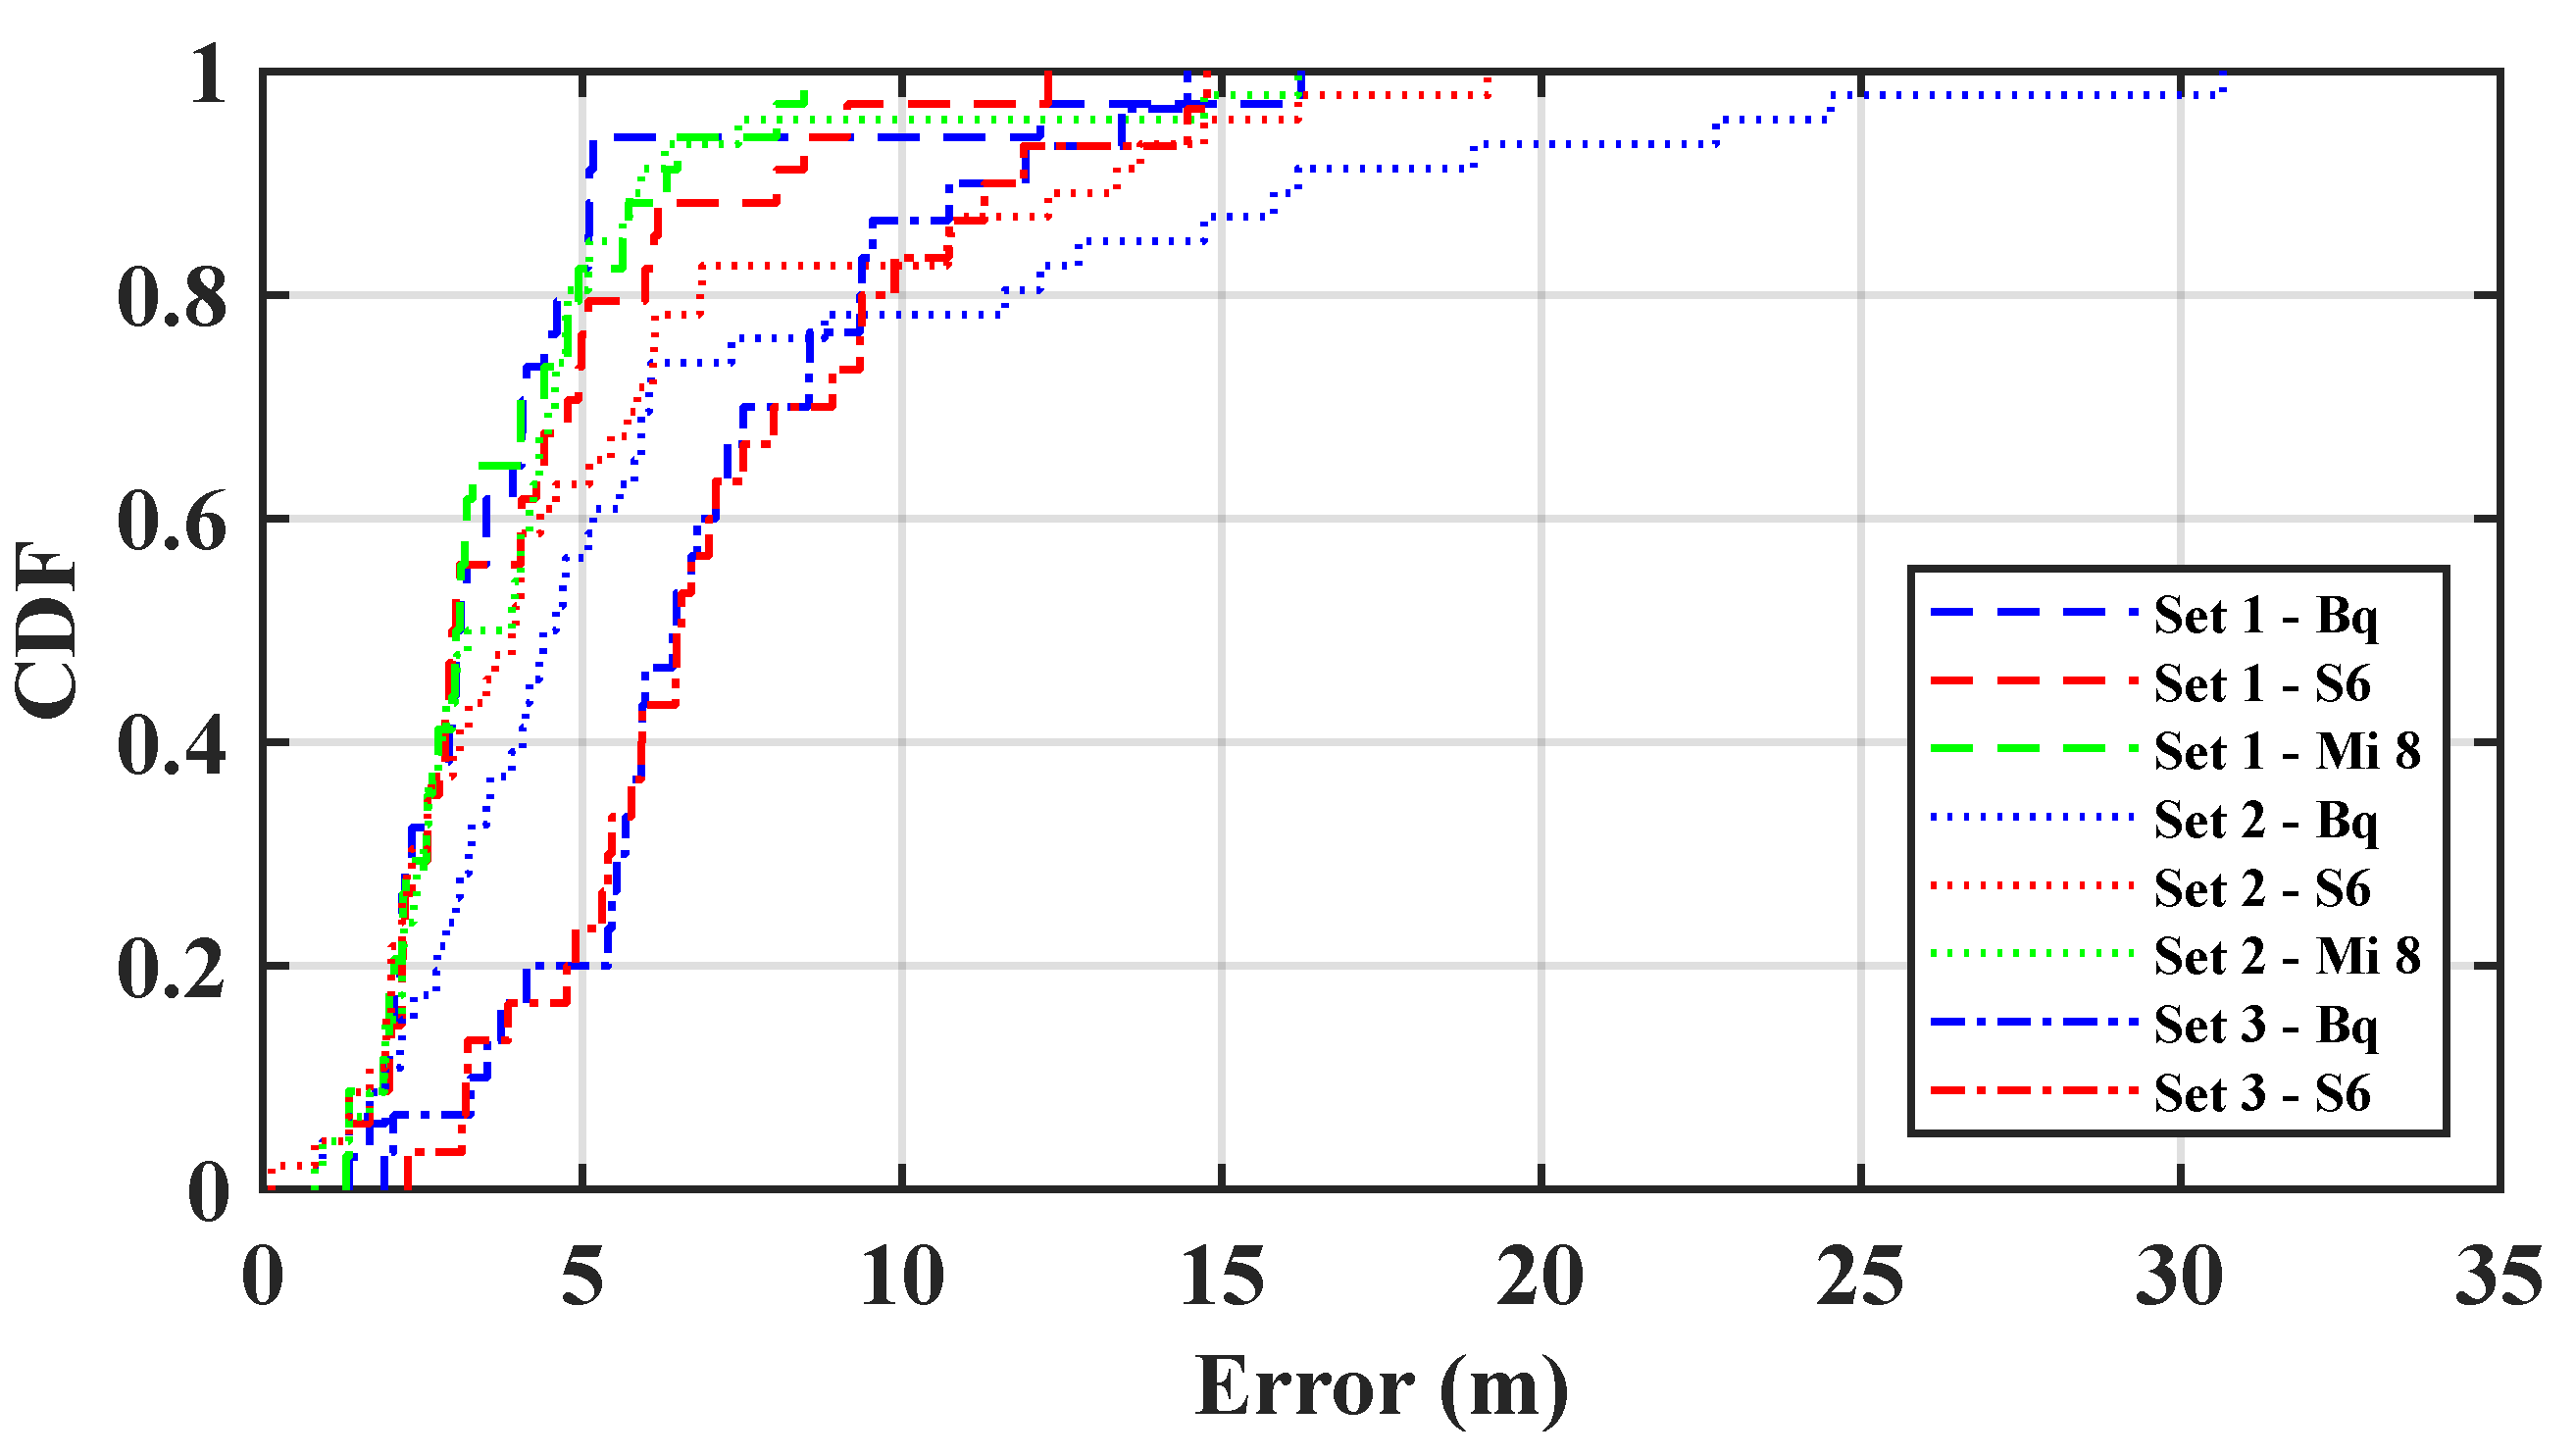
One of the features of this database is the use of more than one emission slot for each beacon, i.e., each hardware device is broadcasting different signals at the same time. The 1-NN algorithm is used as positioning algorithm considering all different slots as different beacons; therefore, the fingerprinting vector has length of 180 samples. For this indoor positioning application, the data have been divided between training and test subsets, using 20% of the data for test and 20% for training. The Cumulative Distribution Function (CDF) of the error in the test samples is shown in Figure 7 for each phone (BQ, S6 and MI 8) and each deployment set. Some statistical parameters of the error distribution, such as the mean value, the median (percentile), the percentile and the floor detection rate are shown in Table 4 whose last column also shows the Tag ID recognition rate.
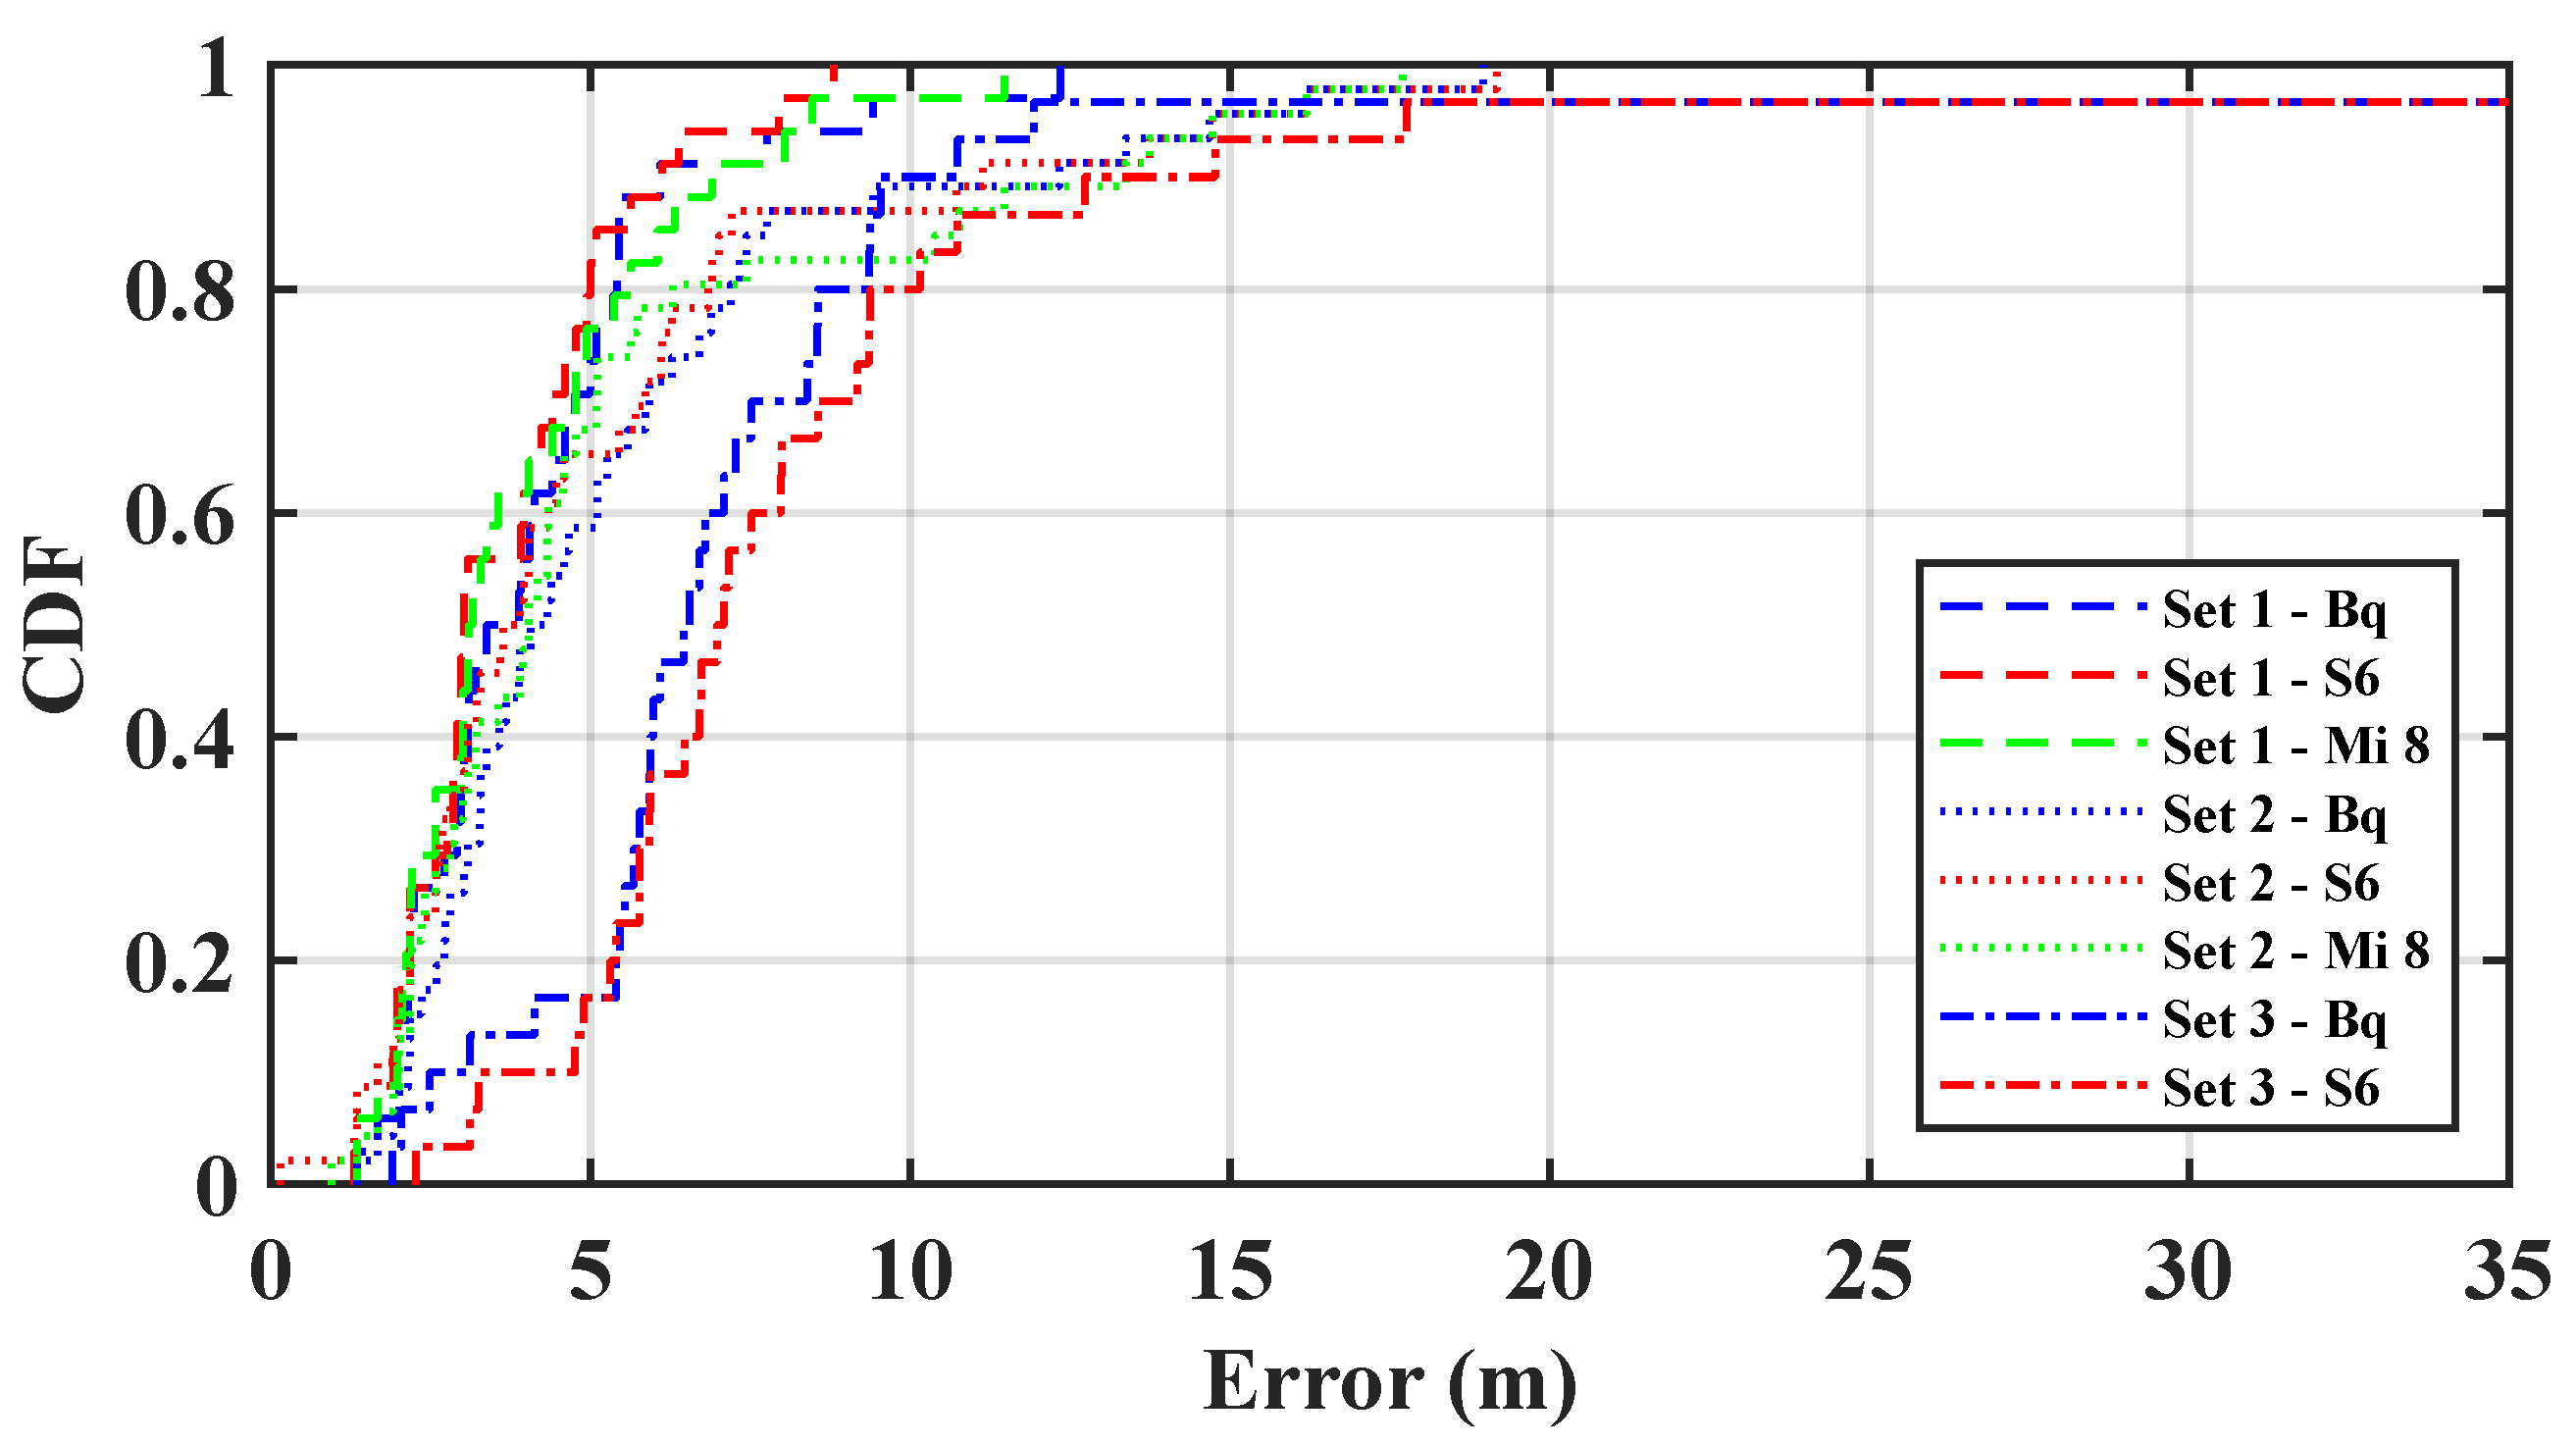
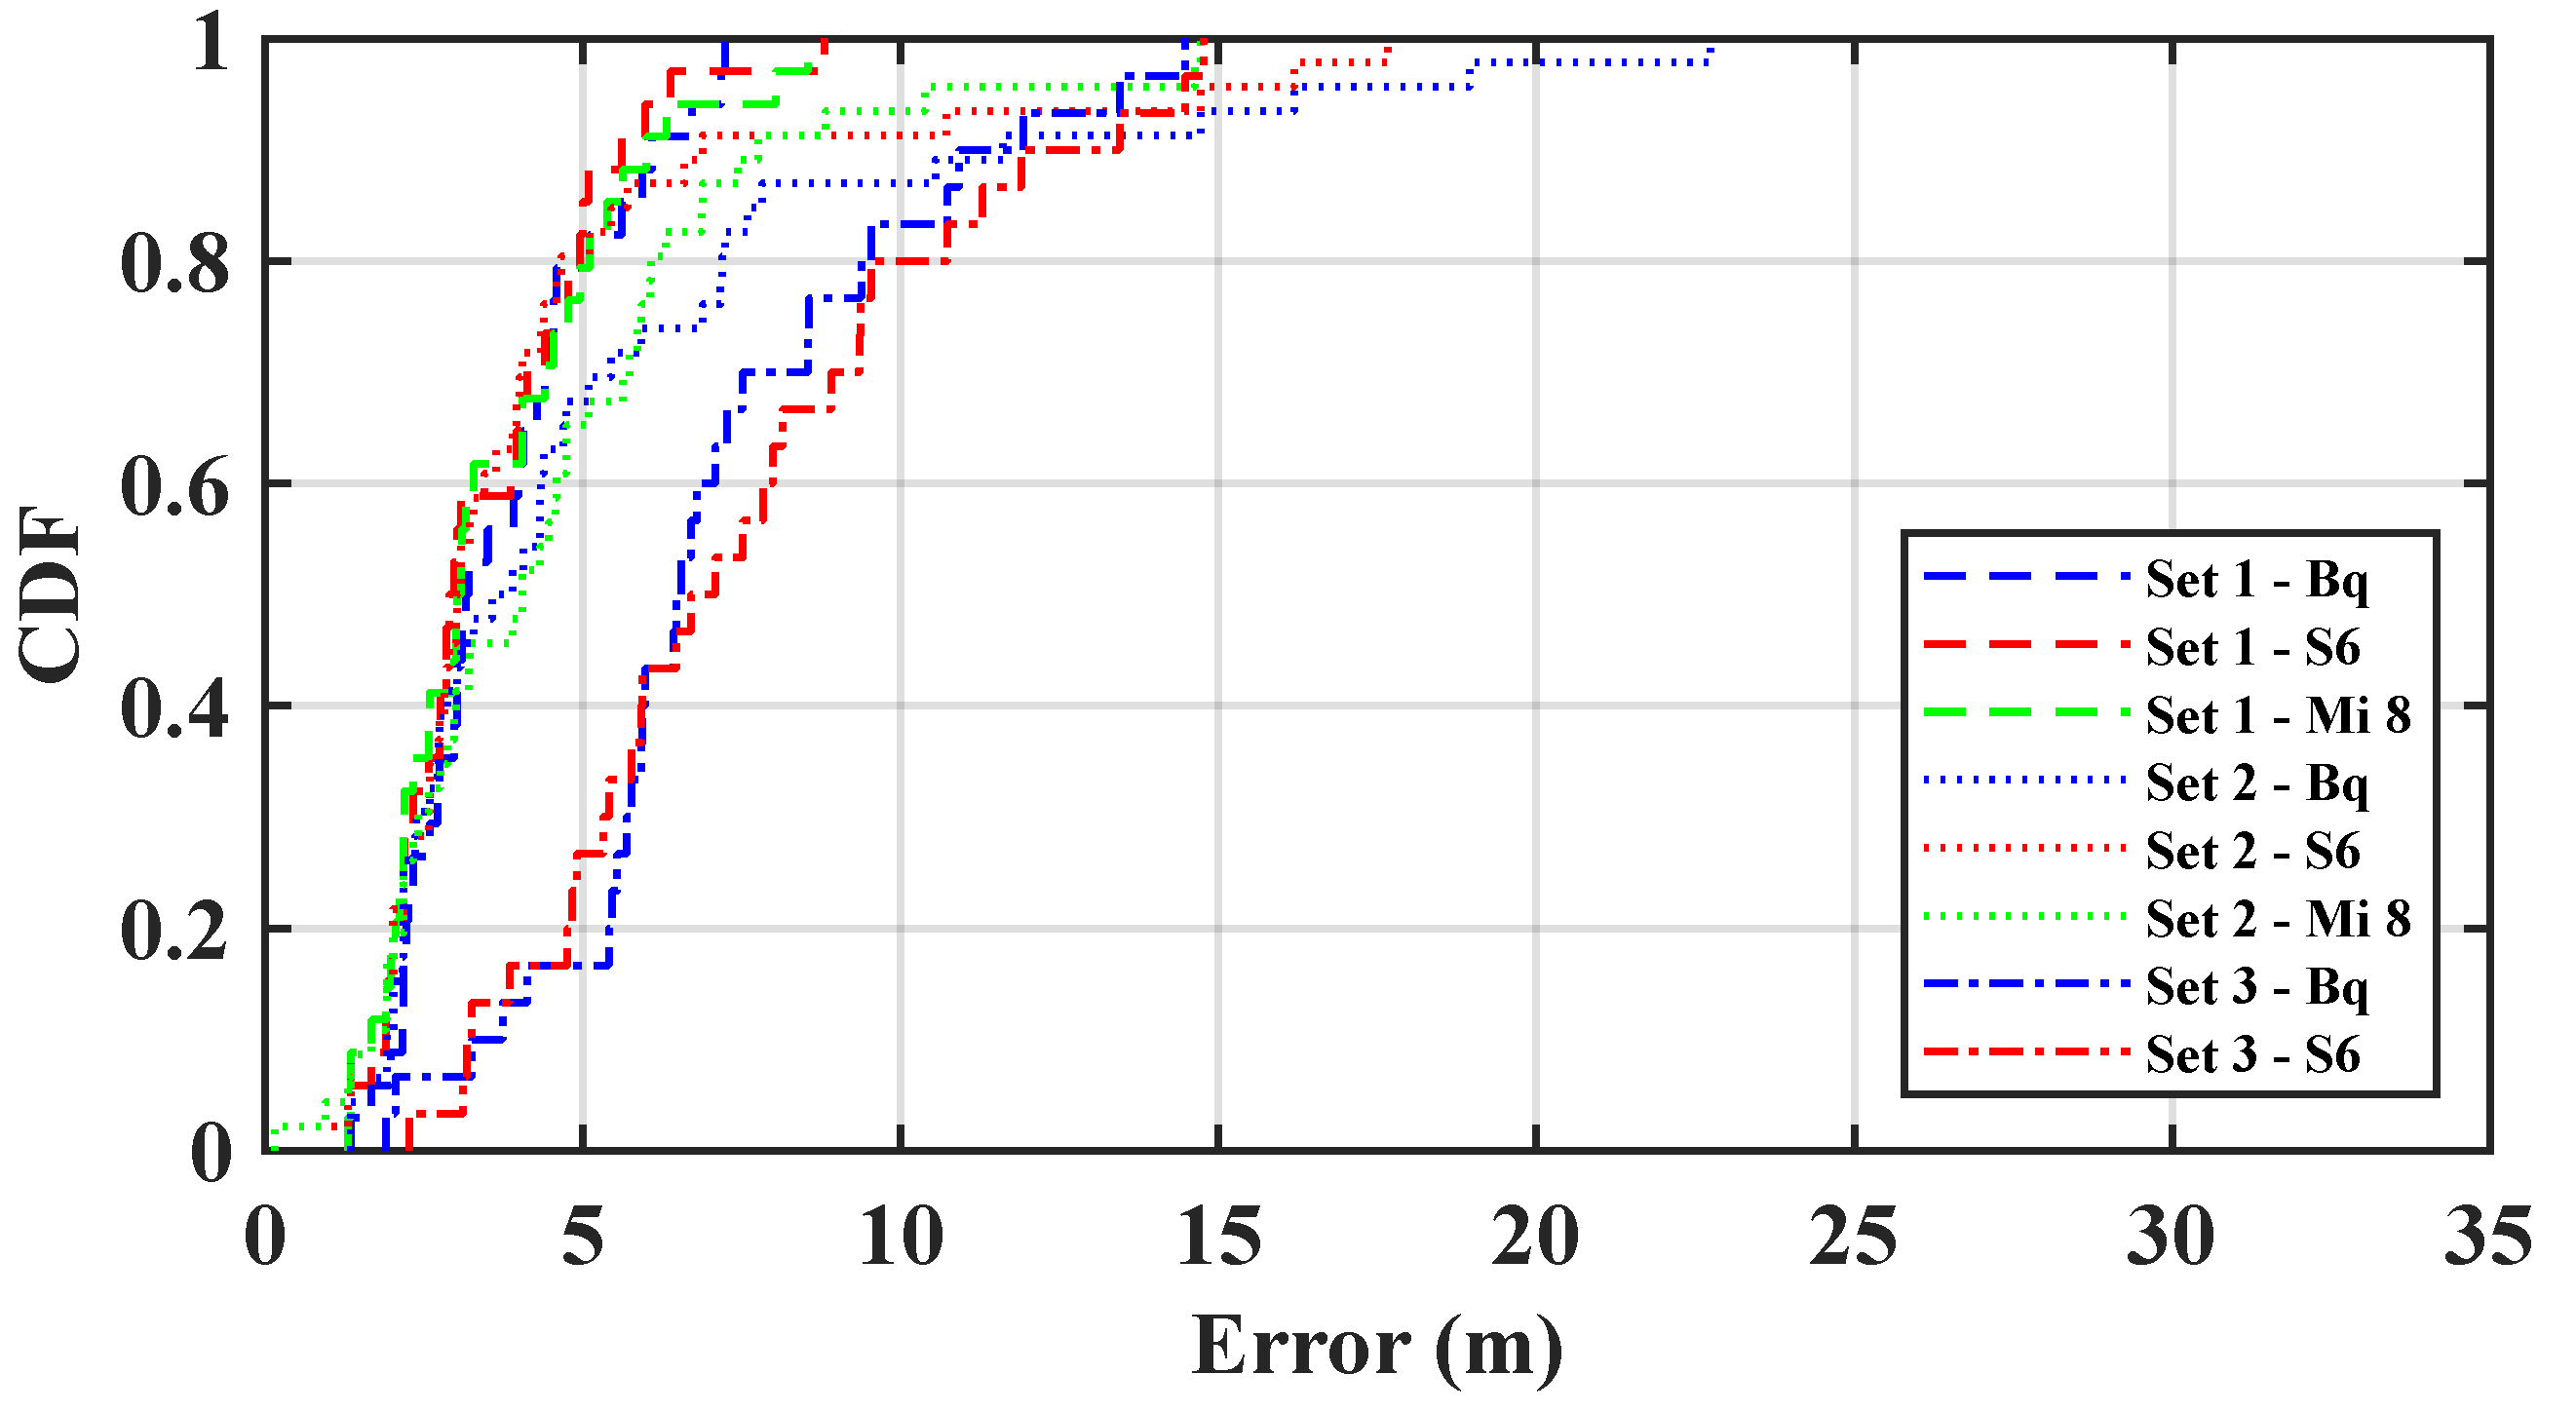
The experiment has been repeated using the same algorithm but considering only one slot per beacon. This reduces just to 30 the number of signals that contribute to the positioning. In this case, the first slot, the one with the highest power is selected from each beacon. Results are shown in Figure 8 and Table 5. it can be seen than using more slots does not reduce the error. Using the code attached to this database the same experiment can be repeated for slots with different emission powers. Besides, different positioning algorithms can be implemented using the supporting materials. Finally, the same experiment is repeated but using the average of all signals coming from the same beacon. In this average missing values contribute with the special value assigned to these situations, which is three units lower than the minimum RSSI detected. These results are shown in Figure 9 and Table 6.
6. Discussion and Conclusions
This paper presents a new BLE RSSI database for the research community. To establish its format, other works with databases based on the same technology have been studied. Two kind of works have been found in this review: those in which the database is the main subject, and those that provide the experimental data as supplementary material. The databases are scattered in different types of repositories, but the persistence and immobility of the data are not guaranteed in most of them. In some cases, platforms such as Zenodo are used, which assure the continuity of the data without changes. The information presented in each database is often incomplete, key elements for the use of databases such as beacons locations or environment information are sometimes ignored. In other works, some relevant information is not explicitly provided. The database must be loaded to determine the missing information, thus, the researchers must use its own resources to load and work with the database. All works explored in this review present experiments in indoor scenarios.
The database presented in this paper differs from the previous ones in that it uses more than one transmission slot for each BLE beacon. A total of six slots per beacon have been used, four following the Eddystone protocol and two following the iBeacon one. All the beacons have the same transmission configuration, where the transmission frequency is the same but the transmission power is different for each slot (from +4 to −30 dBm). Besides, this work incorporates an indoor-outdoor scenario and a complete model of the environment. This model can be used to study signal propagation in the environment and the contribution of each point in the fingerprinting algorithm. The database is divided into three subsets with different characteristics. Along with the database, a set of Matlab files are provided to load, filter, and work with the database. The data is presented using raw RSSI values, with the coordinates and time of each measurement.
The use of different emission slots for each beacon can be used in a fingerprinting system. In this work simple Nearest Neighbours algorithm (NN) has been implemented using different combinations: all the slots as independent beacons, only the slot with the highest transmission power, and the average of all slots from the same beacon, despite having different transmission powers for each slot. Results show that, for the nearest neighbor algorithm, using all the slots or just one per beacon gives similar results for accuracy, floor, and Tag ID recognition. Results using the average value increase accuracy 10 %, thus showing that the extra information provided by additional slots slots can be used to improve fingerprinting localization.
For the study and development of indoor positioning methods with this database, a baseline has been introduced. This baseline uses the NN algorithm with different combinations, showing that using the average value of all the slots within a beacon increase positioning accuracy. This baseline will provide a starting point to compare new methods for other researchers. Future works will focus on two directions. In the first one, we will work on how to combine information from different slots to improve positioning results. In the second one, we will contribute on the standardization of the evaluation procedure with new databases in order to create a framework, like in machine learning, that can be used to compare different environments and contexts.
Supplementary Materials
The following are available online at https://0-www-mdpi-com.brum.beds.ac.uk/2306-5729/5/3/67/s1.
Author Contributions
F.J.A. (Fernando J. Aranda) has been in charge of the conceptualization, methodology and manuscript writing. F.P. collected data in the two environments. F.J.Á. (Fernando J. Álvarez) and J.T.-S. guided the research work, reviewed the contents and approved the paper. All authors have read and agreed to the published version of the manuscript.
Funding
This work was supported in part by the Spanish Ministry of Economy and Competitiveness through projects MICROCEBUS (RTI2018-095168-B-C54), REPNIN+ (TEC2017-90808-REDT) and INSIGNIA (Programa Torres-Quevedo, PTQ2018-009981) and in part by the Regional Government of Extremadura and the European Regional Development Fund through project GR18038.
Conflicts of Interest
The authors declare no conflict of interest. The funders had no role in the design of the study; in the collection, analyses, or interpretation of data; in the writing of the manuscript, or in the decision to publish the results.
References
- Chon, J.; Cha, H. LifeMap: A Smartphone-Based Context Provider for Location-Based Services. IEEE Pervasive Comput. 2011, 10, 58–67. [Google Scholar] [CrossRef]
- Zhu, N.; Marais, J.; Bétaille, D.; Berbineau, M. GNSS Position Integrity in Urban Environments: A Review of Literature. IEEE Trans. Intell. Transp. Syst. 2018, 19, 2762–2778. [Google Scholar] [CrossRef] [Green Version]
- Lejba, P.; Nawrocki, J.; Lemanski, D.; Nogas, P.; Dunst, P. Precise Point Positioning technique for short and long baselines time transfer. In Proceedings of the Joint European Frequency and Time Forum International Frequency Control Symposium (EFTF/IFC), Prague, Czech Republic, 21–25 July 2013; pp. 815–818. [Google Scholar]
- Puricer, P.; Kovar, P. Technical Limitations of GNSS Receivers in Indoor Positioning. In Proceedings of the 17th International Conference Radioelektronika, Brno, Czech Republic, 24–25 April 2007; pp. 1–5. [Google Scholar]
- Roberts, T. We Spend 90% of Our Time Indoors. Says Who? 2016. Available online: https://www.buildinggreen.com/blog/we-spend-90-our-time-indoors-says-who (accessed on 9 July 2020).
- Ureña, J.; Hernández, A.; García, J.J.; Villadangos, J.M.; Carmen Pérez, M.; Gualda, D.; Álvarez, F.J.; Aguilera, T. Acoustic Local Positioning With Encoded Emission Beacons. Proc. IEEE 2018, 106, 1042–1062. [Google Scholar] [CrossRef]
- Latif, S.; Tariq, R.; Haq, W.; Hashmi, U. INDOOR POSITIONING SYSTEM using ultrasonics. Proceedings of 9th International Bhurban Conference on Applied Sciences Technology (IBCAST), Islamabad, Pakistan, 9–12 January 2012; pp. 440–444. [Google Scholar]
- Zhuang, Y.; Hua, L.; Qi, L.; Yang, J.; Cao, P.; Cao, Y.; Wu, Y.; Thompson, J.; Haas, H. A Survey of Positioning Systems Using Visible LED Lights. IEEE Commun. Surv. Tutor. 2018, 20, 1963–1988. [Google Scholar] [CrossRef] [Green Version]
- Mainetti, L.; Patrono, L.; Sergi, I. A survey on indoor positioning systems. In Proceedings of the 22nd International Conference on Software, Telecommunications and Computer Networks (SoftCOM), Split, Croatia, 17–19 September 2014; pp. 111–120. [Google Scholar]
- Cheng, Y. Using ZigBee and Room-Based Location Technology to Constructing an Indoor Location-Based Service Platform. Proceedings of tha Fifth International Conference on Intelligent Information Hiding and Multimedia Signal Processing, Kyoto, Japan, 12–14 September 2009; pp. 803–806. [Google Scholar]
- He, S.; Chan, S.G. Wi-Fi Fingerprint-Based Indoor Positioning: Recent Advances and Comparisons. IEEE Commun. Surv. Tutor. 2016, 18, 466–490. [Google Scholar] [CrossRef]
- Alletto, S.; Cucchiara, R.; Del Fiore, G.; Mainetti, L.; Mighali, V.; Patrono, L.; Serra, G. An Indoor Location-Aware System for an IoT-Based Smart Museum. IEEE Internet Things J. 2016, 3, 244–253. [Google Scholar] [CrossRef]
- Jiménez Ruiz, A.R.; Seco Granja, F. Comparing Ubisense, BeSpoon, and DecaWave UWB Location Systems: Indoor Performance Analysis. IEEE Trans. Instrum. Meas. 2017, 66, 2106–2117. [Google Scholar] [CrossRef]
- Use of Bluetooth Beacon Technology in Smart Airport. Available online: https://www.amarinfotech.com/use-of-bluetooth-beacon-technology-in-smart-airport.html (accessed on 9 July 2020).
- Sadowski, S.; Spachos, P. RSSI-Based Indoor Localization With the Internet of Things. IEEE Access 2018, 6, 30149–30161. [Google Scholar] [CrossRef]
- Torres-Sospedra, J.; Montoliu, R.; Trilles, S.; Belmonte, O.; Huerta, J. Comprehensive analysis of distance and similarity measures for Wi-Fi fingerprinting indoor positioning systems. Expert Syst. Appl. 2015, 42, 9263–9278. [Google Scholar] [CrossRef]
- Android Pie’s Throttling of WiFi Scanning is Crippling Some Network Tools. 2019. Available online: https://www.xda-developers.com/android-pie-throttling-wi-fi-scans-crippling-apps (accessed on 9 July 2020).
- Spachos, P.; Plataniotis, K.N. BLE Beacons for Indoor Positioning at an Interactive IoT-Based Smart Museum. IEEE Syst. J. 2020, 1–11. [Google Scholar] [CrossRef] [Green Version]
- Gutíerrez, J.D.; Aranda, F.J.; Aguilera, T.; Álvarez, F.J. LIMUS: Exploration of Technological Prototypes for Location-Based Services in Museums. In Proceedings of the International Conference on Indoor Positioning and Indoor Navigation, Pisa, Italy, 30 September–3 November 2019. [Google Scholar]
- Jiménez, A.R.; Seco, F. Finding objects using UWB or BLE localization technology: A museum-like use case. In Proceedings of the International Conference on Indoor Positioning and Indoor Navigation (IPIN), Sapporo, Japan, 18–21 September 2017; pp. 1–8. [Google Scholar]
- Laoudias, C.; Piché, R.; Panayiotou, C.G. Device signal strength self-calibration using histograms. In Proceedings of the International Conference on Indoor Positioning and Indoor Navigation (IPIN), Sydney, Australia, 13–15 November 2012; pp. 1–8. [Google Scholar]
- Mendoza-Silva, G.; Richter, P.; Torres-Sospedra, J.; Lohan, E.; Huerta, J. Long-Term WiFi Fingerprinting Dataset for Research on Robust Indoor Positioning. Data 2018, 3, 3. [Google Scholar] [CrossRef] [Green Version]
- Mendoza-Silva, G.; Matey-Sanz, M.; Torres-Sospedra, J.; Huerta, J. BLE RSS Measurements Dataset for Research on Accurate Indoor Positioning. Data 2019, 4, 12. [Google Scholar] [CrossRef] [Green Version]
- Mendoza-Silva, G.M.; Torres-Sospedra, J.; Huerta, J.; Matey Sanz, M. BLE RSS Meaurements Database and Supporting Materials. Zenodo Repository. 2018. Available online: https://zenodo.org/record/1066041 (accessed on 9 July 2020). [CrossRef]
- Tóth, Z.; Tamás, J. Miskolc IIS hybrid IPS: Dataset for hybrid indoor positioning. In Proceedings of the 26th International Conference Radioelektronika (RADIOELEKTRONIKA), Kosice, Slovakia, 19–20 April 2016; pp. 408–412. [Google Scholar]
- Tóth, Z. ILONA: Indoor Localization and Navigation System. J. Locat. Based Serv. 2016, 10, 285–302. [Google Scholar] [CrossRef]
- Iqbal, Z.; Luo, D.; Henry, P.; Kazemifar, S.; Rozario, T.; Yan, Y.; Westover, K.; Lu, W.; Nguyen, D.; Long, T.; et al. Accurate real time localization tracking in a clinical environment using Bluetooth Low Energy and deep learning. PLoS ONE 2018, 13, e0205392. [Google Scholar] [CrossRef] [PubMed] [Green Version]
- zoball. zoball/BLE-Tracking-with-Deep-Learning. 2020. Available online: https://github.com/zoball/BLE-Tracking-with-Deep-Learning (accessed on 9 July 2020).
- Byrne, D.; Kozlowski, M. Residential Wearable RSSI and Accelerometer Measurements with Detailed Annotations. Sci. Data 2019. [Google Scholar] [CrossRef] [PubMed]
- Residential Wearable RSSI and Accelerometer Measurements with Detailed Annotations 2018. Available online: https://figshare.com/articles/Residential_Wearable_RSSI_and_Accelerometer_Measurements_with_Detailed_Annotations/6051794 (accessed on 9 July 2020). [CrossRef]
- Sikeridis, D.; Papapanagiotou, I.; Devetsikiotis, M. BLEBeacon: A Real-Subject Trial Dataset from Mobile Bluetooth Low Energy Beacons. arXiv 2018, arXiv:1802.08782. [Google Scholar]
- Sikeridis, D.; Papapanagiotou, I.; Devetsikiotis, M. CRAWDAD Dataset Unm/Blebeacon (v.2019-03-12). CRAWDAD Wireless Network Data Archive. 2019. Available online: https://crawdad.org/unm/blebeacon/ (accessed on 9 July 2020).
- Sadowski, S.; Spachos, P. P. Spachos/RSSI-Dataset. 2020. Available online: https://github.com/pspachos/RSSI-Dataset (accessed on 9 July 2020).
- Mohammadi, M.; Al-Fuqaha, A.; Guizani, M.; Oh, J. Semisupervised Deep Reinforcement Learning in Support of IoT and Smart City Services. IEEE Internet Things J. 2018, 5, 624–635. [Google Scholar] [CrossRef] [Green Version]
- Mohammadi, M.; Al-Fuqaha, A. BLE RSSI Dataset for Indoor localization and Navigation Data Set. UCI Machine Learning Repository 2018. Available online: https://archive.ics.uci.edu/ml/datasets/BLE+RSSI+Dataset+for+Indoor+localization+and+Navigation (accessed on 9 July 2020).
- Baronti, P.; Barsocchi, P.; Chessa, S.; Mavilia, F.; Palumbo, F. Indoor Bluetooth Low Energy Dataset for Localization, Tracking, Occupancy, and Social Interaction. Sensors 2018, 18, 4462. [Google Scholar] [CrossRef] [Green Version]
- Baronti, P.; Barsocchi, P.; Chessa, S.; Mavilia, F.; Palumbo, F. Indoor Bluetooth Low Energy Datasetfor Localization, Tracking, Occupancy, and Social Interaction. 2018. Available online: http://wnlab.isti.cnr.it/_media/dataset.zip (accessed on 9 July 2020).
- Series 10 Beacon. Available online: https://store.gimbal.com/collections/beacons/products/s10 (accessed on 9 July 2020).
- RadBeacon Dot (Configurable). Available online: https://store.radiusnetworks.com/products/radbeacon-dot (accessed on 9 July 2020).
- BLED112 - Silicon Labs. Available online: https://www.silabs.com/wireless/bluetooth/bluegiga-low-energy-legacy-modules/device.bled112 (accessed on 9 July 2020).
- iBKS Plus · Accent Systems. Available online: https://accent-systems.com/product/ibks-plus/ (accessed on 24 July 2020).
- nRF51822 - Nordic Semiconductor. Available online: https://www.nordicsemi.com/en/Products/Low%20power%20short-range%20wireless/nRF51822 (accessed on 24 July 2020).
- Aranda, F.J.; Parralejo, F.; Álvarez, F.J.; Torres-Sospedra, J. Multi-Slot BLE Raw Database for Accurate Positioning in Mixed Indoor/Outdoor Environments. 2020. Available online: https://zenodo.org/record/3927588 (accessed on 29 July 2020).
- Kushki, A.; Plataniotis, K.N.; Venetsanopoulos, A.N. Kernel-Based Positioning in Wireless Local Area Networks. IEEE Trans. Mob. Comput. 2007, 6, 689–705. [Google Scholar] [CrossRef] [Green Version]
- Zhao, F.; Huang, T.; Wang, D. A Probabilistic Approach for WiFi Fingerprint Localization in Severely Dynamic Indoor Environments. IEEE Access 2019, 7, 116348–116357. [Google Scholar] [CrossRef]
- Altini, M.; Brunelli, D.; Farella, E.; Benini, L. Bluetooth indoor localization with multiple neural networks. In Proceedings of the IEEE 5th International Symposium on Wireless Pervasive Computing, Modena, Italy, 5–7 May 2010; pp. 295–300. [Google Scholar] [CrossRef]
- Kasantikul, K.; Xiu, C.; Yang, D.; Yang, M. An enhanced technique for indoor navigation system based on WIFI-RSSI. In Proceedings of the Seventh International Conference on Ubiquitous and Future Networks, Sapporo, Japan, 7–10 July 2015; pp. 513–518. [Google Scholar] [CrossRef]
- Pan, J.J.; Kwok, J.T.; Yang, Q.; Chen, Y. Multidimensional Vector Regression for Accurate and Low-Cost Location Estimation in Pervasive Computing. IEEE Trans. Knowl. Data Eng. 2006, 18, 1181–1193. [Google Scholar] [CrossRef] [Green Version]
- Wu, C.-L.; Fu, L.-C.; Lian, F.-L. WLAN location determination in e-home via support vector classification. In Proceedings of the IEEE International Conference on Networking, Sensing and Control, Taipei, Taiwan, 21–23 March 2004; Volume 2, pp. 1026–1031. [Google Scholar] [CrossRef]
- Honkavirta, V.; Perala, T.; Ali-Loytty, S.; Piche, R. A comparative survey of WLAN location fingerprinting methods. In Proceedings of the 6th Workshop on Positioning, Navigation and Communication, Hannover, Germany, 19 March 2009; pp. 243–251. [Google Scholar] [CrossRef] [Green Version]
- Yim, J. Introducing a decision tree-based indoor positioning technique. Expert Syst. Appl. 2008, 34, 1296–1302. [Google Scholar] [CrossRef]
- Badawy, O.M.; Hasan, M.A.B. Decision Tree Approach to Estimate User Location in WLAN Based on Location Fingerprinting. In Proceedings of the National Radio Science Conference, Cairo, Egipt, 13–15 March 2007; pp. 1–10. [Google Scholar] [CrossRef]
- Cha, S.H. Comprehensive Survey on Distance/Similarity Measures between Probability Density Functions. Int. J. Math. Model. Methods Appl. Sci. 2007, 1, 300–307. [Google Scholar]
Figure 1.
Plot of the experimental environment used in the first two deployments. (a) 3D vision of the building with beacons position. 2D representation of the (b) ground floor, (c) first floor and (d) Second floor. In the last three figures green asterisks represent the beacons position and blue points are the sample points.


Figure 2.
Plot of the experimental environment used in the third deployment. (a) 3D vision of the building with beacons position. 2D representation of the (b) ground floor, (c) first floor and (d) second floor. In the last three figures green asterisks represent the beacons position and blue points are the sample points.


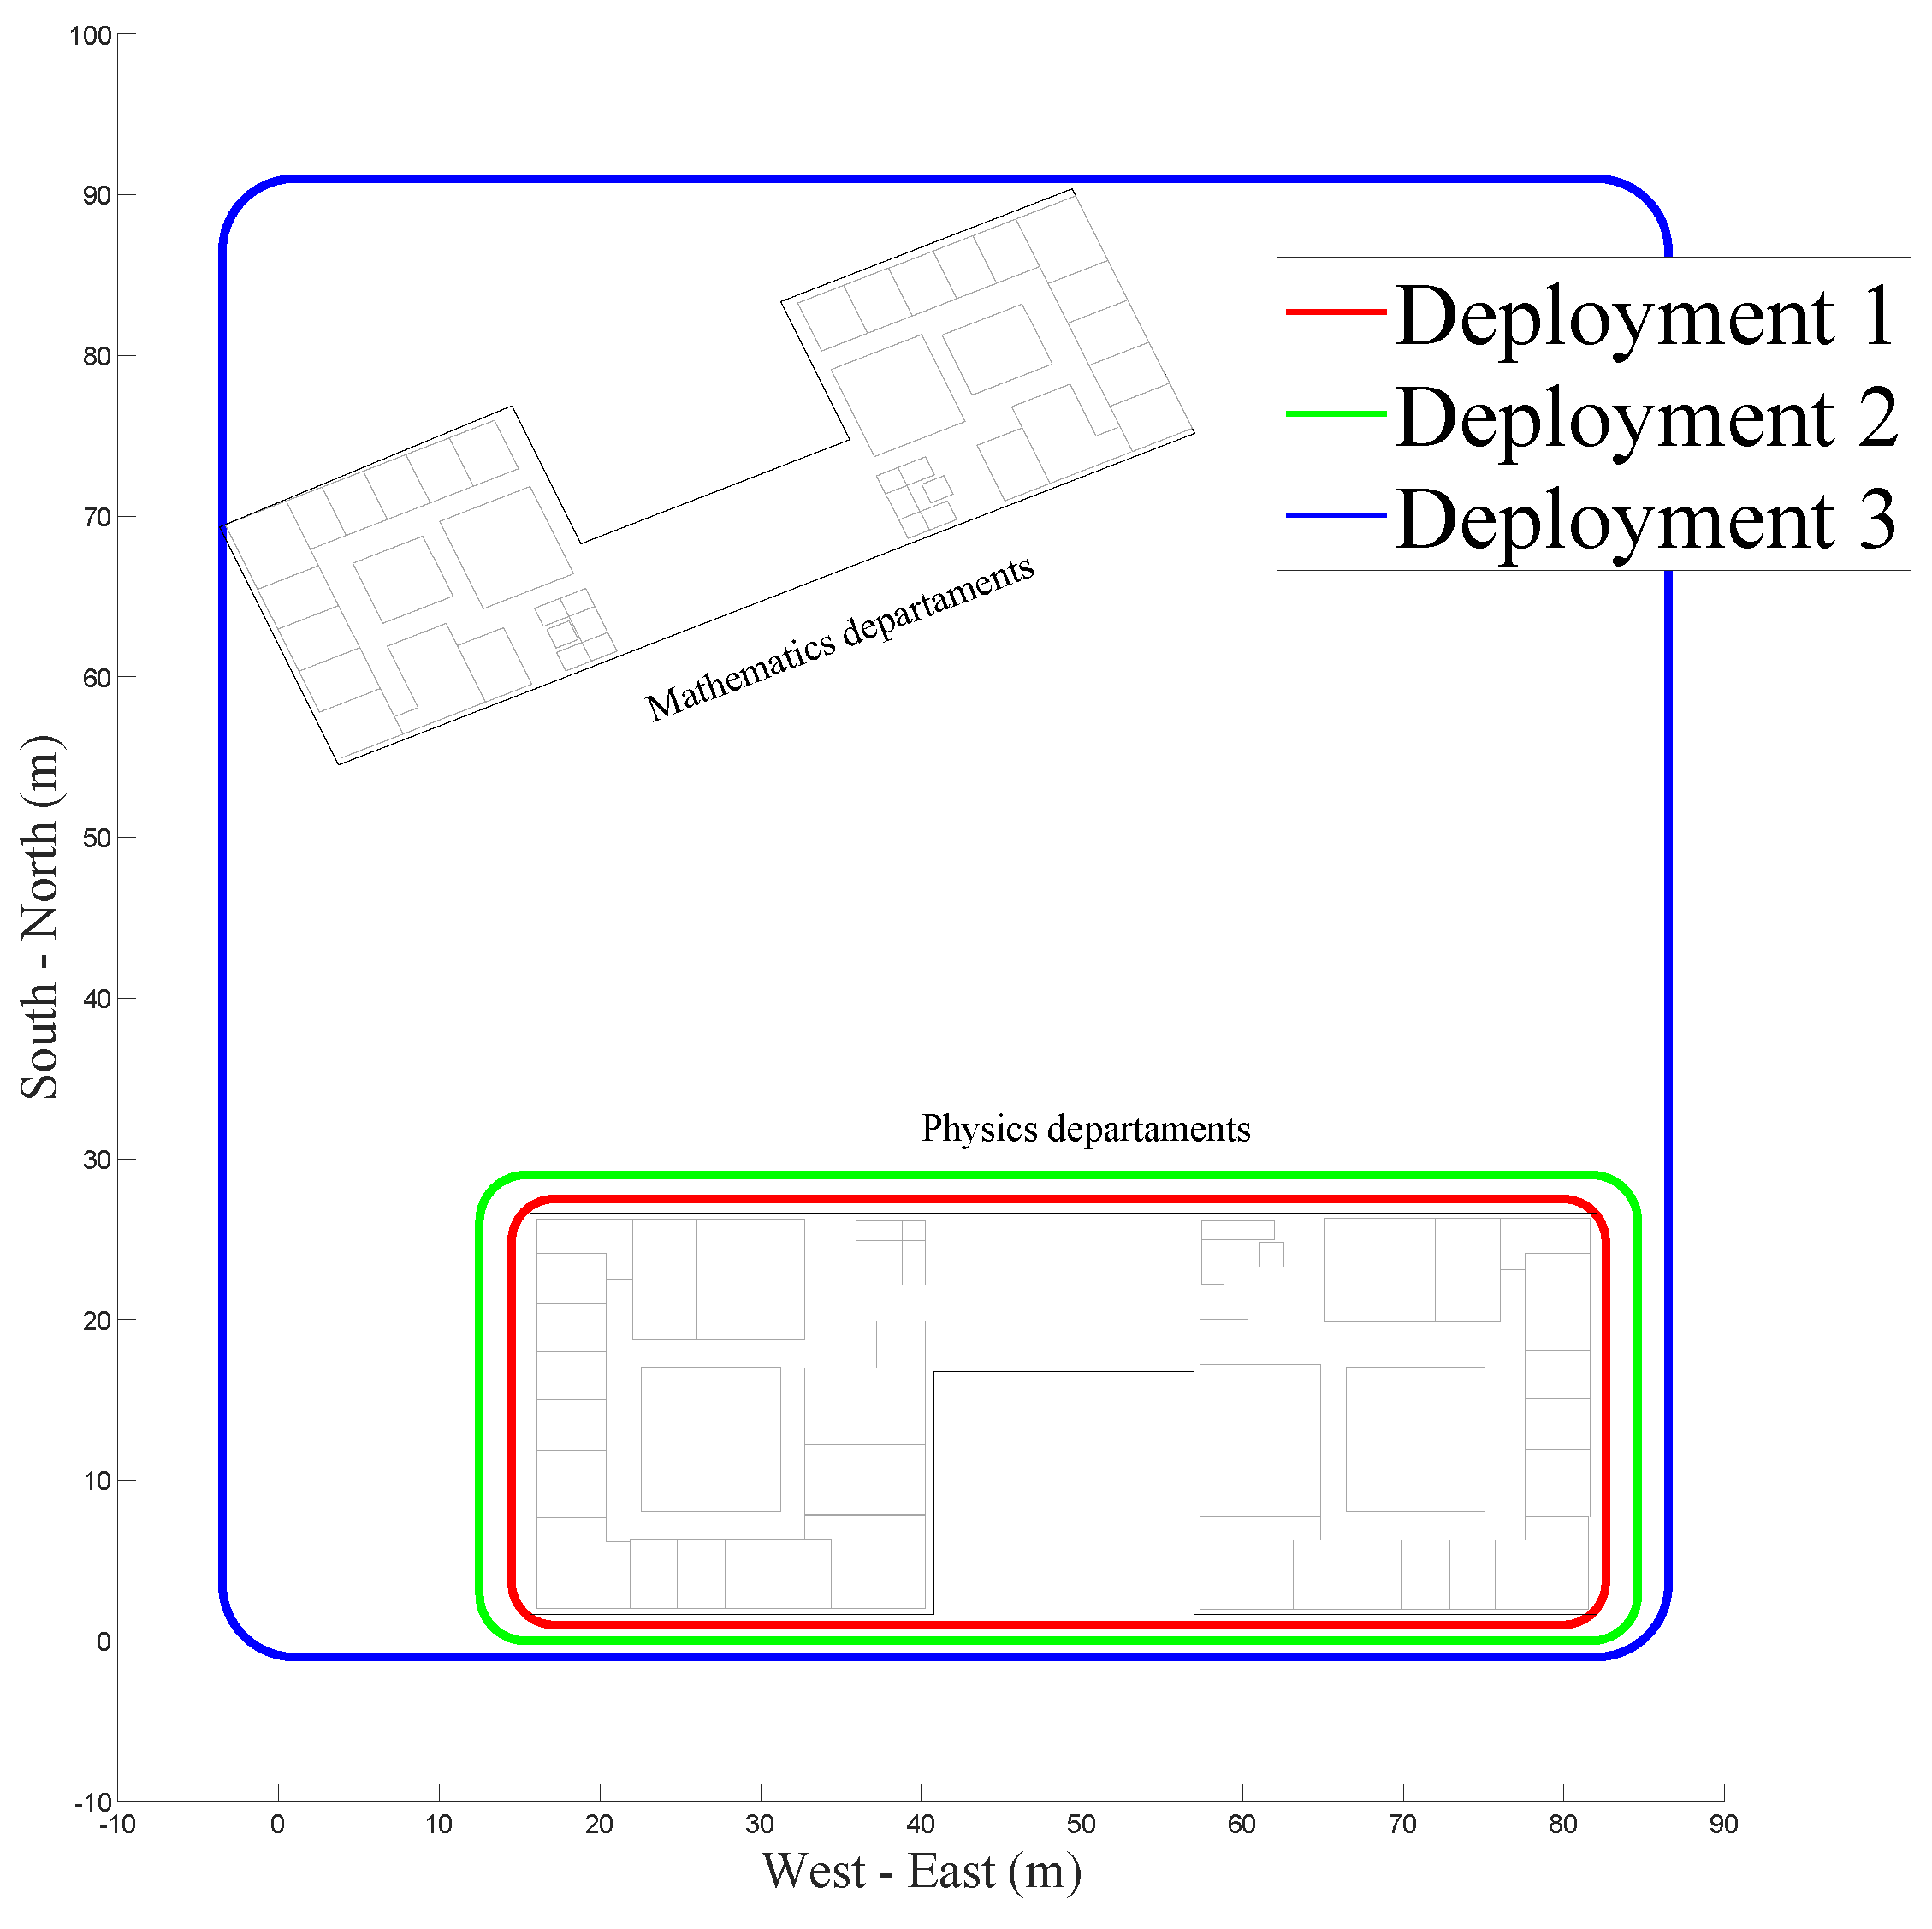
Figure 3.
Region of each deployment.

Figure 4.
Beacons position examples in indoor environment.

Figure 5.
Beacons position examples in outdoor environment.

Figure 6.
CSV files in each data set.

Figure 7.
Cumulative Distribution Function (CDF) of the 1-NN algorithm using each slot as a independent beacon (180 signals).
Figure 7.
Cumulative Distribution Function (CDF) of the 1-NN algorithm using each slot as a independent beacon (180 signals).

Figure 8.
CDF of the 1-NN algorithm using just the first slot of each beacon.

Figure 9.
CDF of the 1-NN algorithm using the average value of all the slots.


Table 1.
Features of the selected Bluetooth Low Energy (BLE) databases.
| Ref. | Source | Rawness | Format | Position | BLE Beacon | Collection Procedure | Operational Environment | Beacon Conf. | ||||||||
|---|---|---|---|---|---|---|---|---|---|---|---|---|---|---|---|---|
| Meas. | Loc. | Samples | #RP | #Beacons | #Receivers | Floors | Area | Freq. | dBm | Slots | ||||||
| [23] | [24] | fingerprint | csv | local x-y and floor | IBKS 105 | Static | Active | 58 | 22 | 3 Smartphones | 1 | 151 | 5 | −20 | 1 | |
| Static | Active | 34 | 24 | Samsung Galaxy A5 | 3 | 171 | 5 | −220 | 1 | |||||||
| Static | Active | 34 | 24 | Samsung Galaxy A5 | 3 | 171 | 5 | −212 | 1 | |||||||
| Static | Active | 34 | 24 | Samsung Galaxy A5 | 3 | 171 | 5 | +4 | 1 | |||||||
| [25,26] | – | fingerprint | mySQL | local x-y and floor | – | Static | Active | 22 | 10 | Samsung Galaxy Young | 3 | 4275 | – | – | – | |
| [27] | [28] | fingerprint | png image | Room ID | RadBeacon Dot | Both | Passive | 21 | 10 | 21 x Rasp. Pi 3 | 3 | – | 10 | +3 | 1 | |
| [29] | [30] | raw RSSI | csv | local x-y and tag ID | Custom wearable | Both | Passive | 29 | 1 | 8 x Rasp. Pi 3 | 1 | 36 | 5 | – | 1 | |
| Both | Passive | 82 | 1 | 11 x Rasp. Pi 3 | 2 | 100 | 5 | – | 1 | |||||||
| Both | Passive | 57 | 1 | 11 x Rasp. Pi 3 | 2 | 90 | 5 | – | 1 | |||||||
| Both | Passive | 51 | 1 | 11 x Rasp. Pi 3 | 2 | 96 | 5 | – | 1 | |||||||
| [31] | [32] | raw RSSI | csv | – | Gimbal 10 Series | Motion | Passive | – | 46 | 32 x Rasp. Pi 3 | 3 | 5832 | 1 | +0 | 1 | |
| [15] | [33] | fingerprint | txt | local x-y | Gimbal 10 Series | Static | Active | 3 | 3 | Rasp. Pi 3 | 1 | 0.5 | – | – | 1 | |
| Static | Active | 3 | 3 | Rasp. Pi 3 | 1 | 2 | – | – | 1 | |||||||
| [34] | [35] | fingerprint | csv | Cell ID | iBeacon | Static | Active | 378 | 13 | smartphone | 1 | 3342 | – | – | 1 | |
| [36] | [37] | raw RSSI | csv | local x-y | Rasp. Pi 3 | Both | Active | 277 | 8 | Honor 8 Huawei | 1 | 185 | 10 | −18 | 1 | |
| Both | Active | 277 | 8 | Honor 8 Huawei | 1 | 185 | 10 | −26 | 1 | |||||||
| Both | Active | 277 | 8 | Honor 8 Huawei | 1 | 185 | 10 | +3 | 1 | |||||||
| RadBeacon Dot | Both | Passive | 277 | 1 | 4 x Rasp. Pi 3 | 1 | 185 | 10 | −218 | 1 | ||||||
| Both | Passive | 277 | 1 | 4 x Rasp. Pi 3 | 1 | 185 | 10 | −6 | 1 | |||||||
| Both | Passive | 277 | 1 | 4 x Rasp. Pi 3 | 1 | 185 | 10 | +3 | 1 | |||||||
Table 2.
Transmission power configuration for each slot.
| Slots | Eddystone 1 | Eddystone 2 | Eddystone 3 | Eddystone 4 | iBeacon 1 | iBeacon 2 |
|---|---|---|---|---|---|---|
| TX. Power (dBm) | +4 | 0 | −4 | −8 | −16 | −30 |
Table 3.
General description of each deployment.
| Deployment 1 | Deployment 2 | Deployment 3 | |
|---|---|---|---|
| Number of beacons | 180 | 180 | 180 |
| Number of RP | 173 | 230 | 150 |
| Smartphones | 3 | 3 | 2 |
| Involved subjects | 2 | 2 | 2 |
| Number of samples | |||
| total area (m2) | |||
| accesible area (m2) | |||
| non-accesible area (m2) |
Table 4.
Mean, percentile 50, 95, floor recognition rate and Tag ID rate of the distribution error over the test sample for the One Nearest Neighbor (NN) positioning algorithm with all the slots as independent beacons.
Table 4.
Mean, percentile 50, 95, floor recognition rate and Tag ID rate of the distribution error over the test sample for the One Nearest Neighbor (NN) positioning algorithm with all the slots as independent beacons.
| Deployment | Mean (m) | P50th (m) | P95th (m) | Floor (%) | Label ID (%) |
|---|---|---|---|---|---|
| Set 1 - BQ | 3.86 | 3.06 | 10.75 | 0.82 | 0.88 |
| Set 1 - S6 | 4.05 | 2.99 | 9.01 | 0.85 | 0.88 |
| Set 1 - MI 8 | 3.57 | 3.04 | 7.72 | 0.97 | 0.97 |
| Set 2 - BQ | 6.98 | 4.48 | 23.09 | 0.89 | 0.91 |
| Set 2 - S6 | 5.26 | 3.91 | 15.01 | 0.91 | 0.89 |
| Set 2 - MI 8 | 4.01 | 3.54 | 8.89 | 0.97 | 0.97 |
| Set 3 - BQ | 6.94 | 6.44 | 13.44 | 0.73 | 0.93 |
| Set 3 - S6 | 7.18 | 6.50 | 14.47 | 0.7 | 0.96 |
| Average | 5.23 | 4.24 | 12.80 | 0.85 | 0.92 |
Table 5.
Mean, percentile 50, 95, floor recognition rate and Tag ID rate of the distribution error over the test sample for the NN positioning algorithm using the first slot of each beacon.
Table 5.
Mean, percentile 50, 95, floor recognition rate and Tag ID rate of the distribution error over the test sample for the NN positioning algorithm using the first slot of each beacon.
| Deployment | Mean (m) | P50th (m) | P95th (m) | Floor (%) | Label ID (%) |
|---|---|---|---|---|---|
| Set 1 - BQ | 4.08 | 3.62 | 9.08 | 0.82 | 0.88 |
| Set 1 - S6 | 3.68 | 3.01 | 7.62 | 0.85 | 0.88 |
| Set 1 - MI 8 | 3.93 | 3.12 | 8.38 | 0.91 | 0.91 |
| Set 2 - BQ | 5.44 | 4.19 | 14.98 | 0.82 | 0.84 |
| Set 2 - S6 | 5.06 | 3.75 | 15.01 | 0.93 | 0.91 |
| Set 2 - MI 8 | 5.29 | 4.03 | 15.01 | 0.95 | 0.95 |
| Set 3 - BQ | 8.79 | 6.50 | 11.92 | 0.86 | 0.93 |
| Set 3 - S6 | 8.71 | 7.02 | 17.75 | 0.8 | 0.9 |
| Average | 5.62 | 4.41 | 12.47 | 0.87 | 0.90 |
Table 6.
Mean, percentile 50, 95, floor recognition rate and Tag ID rate of the distribution error over the test sample for the NN positioning algorithm with the average value of each beacon.
Table 6.
Mean, percentile 50, 95, floor recognition rate and Tag ID rate of the distribution error over the test sample for the NN positioning algorithm with the average value of each beacon.
| Deployment | Mean (m) | P50th (m) | P95th (m) | Floor (%) | Label ID (%) |
|---|---|---|---|---|---|
| Set 1 - BQ | 3.71 | 3.17 | 7.07 | 0.79 | 0.85 |
| Set 1 - S6 | 3.48 | 2.93 | 6.29 | 0.94 | 0.97 |
| Set 1 - MI 8 | 3.55 | 3.04 | 7.69 | 0.94 | 0.97 |
| Set 2 - BQ | 5.30 | 3.72 | 16.74 | 0.95 | 0.98 |
| Set 2 - S6 | 4.18 | 3.04 | 15.01 | 0.93 | 0.95 |
| Set 2 - MI 8 | 4.53 | 4.03 | 11.22 | 0.91 | 0.91 |
| Set 3 - BQ | 7.09 | 6.50 | 13.44 | 0.76 | 0.93 |
| Set 3 - S6 | 7.46 | 6.88 | 14.47 | 0.70 | 0.93 |
| Average | 4.91 | 4.17 | 11.49 | 0.86 | 0.93 |
© 2020 by the authors. Licensee MDPI, Basel, Switzerland. This article is an open access article distributed under the terms and conditions of the Creative Commons Attribution (CC BY) license (http://creativecommons.org/licenses/by/4.0/).
Share and Cite
MDPI and ACS Style
Aranda, F.J.; Parralejo, F.; Álvarez, F.J.; Torres-Sospedra, J. Multi-Slot BLE Raw Database for Accurate Positioning in Mixed Indoor/Outdoor Environments. Data 2020, 5, 67. https://0-doi-org.brum.beds.ac.uk/10.3390/data5030067
AMA Style
Aranda FJ, Parralejo F, Álvarez FJ, Torres-Sospedra J. Multi-Slot BLE Raw Database for Accurate Positioning in Mixed Indoor/Outdoor Environments. Data. 2020; 5(3):67. https://0-doi-org.brum.beds.ac.uk/10.3390/data5030067
Chicago/Turabian StyleAranda, Fernando J., Felipe Parralejo, Fernando J. Álvarez, and Joaquín Torres-Sospedra. 2020. "Multi-Slot BLE Raw Database for Accurate Positioning in Mixed Indoor/Outdoor Environments" Data 5, no. 3: 67. https://0-doi-org.brum.beds.ac.uk/10.3390/data5030067