Article

Food as Medicine: FOODRx for Patients with Diabetes and Cardiovascular Disease in Central Minnesota—A PILOT STUDY

by
Mónica García-Pérez
1,2,*,
Alexandra De Kesel Lofthus
3,
David Tilstra
3,
Kevin Switzer
3 and
Kristen Williamson
3
1
Economics Department, St. Cloud State University, St. Cloud, MI 56301, USA
2
Senior Visiting Faculty, S.B. Cook Center on Social Equity, Duke University, Durham, NC 27701, USA
3
CentraCare Health System, 411 West Chapel Hill St. #300, Durham, NC 27705, USA
*
Author to whom correspondence should be addressed.
Submission received: 4 August 2023 / Revised: 29 December 2023 / Accepted: 17 February 2024 / Published: 8 March 2024

Abstract

:
The number of food-insecure individuals with diabetes is on the rise. FOODRx is a supplemental healthy food intervention program that gave disease-appropriate food boxes to food-insecure patients with diabetes at their care clinic and included nutrition and recipe materials in the patient’s preferred language (English, Spanish, or Somali). Implemented over a twelve-month period, we analyze FOODRx participants’ pre and post clinical measures, health care usage, and program/clinic satisfaction, and found that participation was linked to post improvements in fasting glucose and HgbA1c levels, reductions in ER visits and healthcare costs, and a decline in patients choosing between medication and food. Glucose levels decreased from 214 to 187 mg/dL and HgbA1c levels decreased from 9.6% to 9.1%. Average ER visits dropped from 1.21 to 1 visit and the reductions in healthcare costs were reflected in a decrease of an average of USD 250,000 in insurance claims. Patients were less likely to experience food insecurity, as measured in number of meals skipped and levels of hunger. Finally, the program improved patient satisfaction with the cultural responsiveness of the information shared with them.

1. Introduction

According to the American Diabetes Association, 9% of the American population is diabetic and “1.4 million individuals are diagnosed with diabetes every year [1]”. If this trend continues, 1 in 3 adults will be diabetic by 2050 in the United States (US) [1]. Diabetic patients are hospitalized for strokes and heart attacks at twice the rate of patients without diabetes. Nearly 65% of diabetic individuals die from heart disease and stroke [2,3]. Simultaneously, food-insecure adults—individuals 18 years old or more who lack access to enough food for an active and healthy life [4]—are 1.7 times more likely to have diabetes and 1.4 times more likely to have a cardiovascular disease [5].
Care management and condition complications are major contributors to the direct and indirect costs of diabetes for patients and medical systems. Further, diabetic patients’ medical costs may rise to a point where limited financial resources force them to decide between paying their medical bills and meeting their daily basic food needs. This is termed the “medicine and food trade-off [6]”.
These difficult budgeting decisions further complicate symptoms by making diabetes-appropriate products such as fruits, vegetables, whole grains, and lean proteins financially out of reach [6,7,8,9]. Patients’ choose between the appropriate food and medication and monitoring supplies for their conditions [7,10]. Therefore, inadequate and inconsistent access to disease-appropriate food is likely an important factor in the association between food insecurity and poor disease management control among adults with diabetes [10,11,12,13,14].
Healthcare providers who are unaware of patients’ lack of access to adequate food are unable to address the issue [15]. The patients’ lack of self-management would be misunderstood as nonadherence and medically addressed. Meanwhile, healthcare systems and insurance payers (including Medicaid—the state/federal program for low-income people or for people on public assistance) bear a large proportion of the growing operational costs when food-insecure patients are diabetic or suffer cardiovascular disease. These include costs related to managing the disease, treatment, and services related to diabetes complications. The emerging literature has demonstrated the relevance of healthy food among food-insecure diabetic individuals in improving their self-care management and health outcomes [16,17].
We add to previous evidence by conducting a feasibility trial utilizing a pre–post program designed over a twelve-month period among diabetic and cardiovascular disease patients at a Family Health Center clinic in the city of St. Cloud, state of Minnesota in the US. We studied the effect of a supplemental healthy food intervention, combined with clinical specialty care and disease management education, on health outcomes, self-care management (dietary intake, diabetes distress, self-efficacy, and medication adherence), healthcare utilization, and healthcare costs. The program, called FOODRx, introduced the concept of food as a prescription and as preventive care through a partnership between a healthcare system and a food bank. CentraCare Health (CCH), the largest healthcare system in Central Minnesota in the US, and Second Harvest Heartland (SHH), the largest food bank in the state of Minnesota in the US, collaborated to deliver and study this innovative program.
Although other programs have addressed the need for disease-appropriate food for diabetic individuals and those with lipid metabolism disorders in non-traditional and clinical settings separately, to our knowledge, this was the first program formally attempting an inter-institutional approach to more efficiently identify and deliver treatment to the target population [6,7,8,9,10,11,12,13,14,15,16,17,18].
The inspiration for FOODRx came from an earlier pilot food bank intervention targeted to diabetic individuals in food pantries and partnering clinics [19]. FOODRx differed from and expanded on these programs in several ways. First, the program brought the concept of food as medicine directly into healthcare settings and integrated it into the patients’ existing care. This was made possible because of the strong partnership and collaboration between the clinic and food bank. Second, FOODRx targeted diagnosed diabetic patients and those with lipid metabolism disorders, which more efficiently directed resources to those in need. Third, the program addressed patients’ cultural preferences by incorporating languages and recipes that mirrored the clinic’s patient population into the food boxes. Fourth, given the high cost of diabetes care management for providers and patients, due to the high care usage of diabetic patients, the program also incorporated analysis at the level of the patients’ healthcare service utilization and usage costs to understand potential impacts on cost.
In Minnesota, 63.5 per 1000 Minnesotans are diabetic, and more than 200,000 residents have been diagnosed with congestive heart failure or ischemic heart disease [20]. The prevalence of diabetes is significant in the areas outside the Twin Cities, especially in Central Minnesota [21]. This becomes more significant when considering that this area has seen a rapid change in demographics due to an increase in Somali community members since 2010. Among this community, the prevalence rate of diabetes is high (12.1% according to the Center for Disease Control (CDC) [21]).
CentraCare Health is the largest healthcare provider in Central Minnesota and serves as the primary care provider for approximately 70% of the population in the region [20,21]. Second Harvest Heartland is the largest food bank in the state and one of the largest in the U.S. Each yea, over half a million people receive food support through SHH’s network of nearly 1000 food shelves, pantries, and other partner programs, serving 59 counties in Minnesota and western Wisconsin.
To evaluate the impact of FOODRx, we follow 28 patients and estimate the pre-program (average measures 12 months before program started), begin-program (initial measures taken at the beginning of the program), and post-program (final measures taken at the end of the program) changes in laboratory tests, healthcare usage, and costs. We additionally compare subjective changes in the patients’ perceptions regarding food security, medicine and food trade-off, self-management care, and general program satisfaction.
This research provides evidence of the effectiveness of a food intervention program to target food-insecure diabetic patients and those with lipid metabolism disorders to reduce related complications, thereby reducing the cost of care. To our knowledge, it also offers the first effectiveness analysis of a program that incorporated the partnership of two non-traditional partners (healthcare provider and a food bank) in a traditional healthcare environment (clinic) [18,22,23]. In addition, by incorporating an analysis of pre–post survey questions, our research was able to show improvements in self-care, disease management skills, and decreased food insecurity among the patients using the program. Finally, this research provides some explorative insights on the impact of a food and health intervention on an under-studied group such as the Somali population in MN.

2. Program Overview: Materials and Methods

2.1. Materials

SHH provided the food box interventions for the FOODRx program. Monthly boxes were given to participants during the 12 months of the program at their care clinic and consisted of (1) disease-appropriate food, (2) written informational materials, (3) recipes tailored to the nutritional and cultural needs of the patients, and (4) a USD 10 gift certificate to buy fresh produce at a local grocery store. Extended information of the program materials is available in the appendix (Table A1, Table A2, Table A3 and Table A4).
The boxes were combined with active specialty diabetic and cardiovascular care management classes and clinical specialty diabetic and cardiovascular care for adult diabetes patients and those with lipid metabolism disorders from food-insecure households at CentraCare’s Family Health Center clinic (see more in Section 2.4). All medical and hands-on nutritional care was provided by CCH. The program started in September 2016 and ended in October 2017. Because the program tried to smoothly incorporate participants by connecting their registration to their regular visits, the implementation of the program was carried out over September and October of 2016. Most patients started in September. The termination of the program also followed this two-month rolling period. The program and study were approved by the CentraCare internal Independent Review Board on 21 July 2016 (CC-20180702).

2.2. Food Box

The participants were able to select from four culturally and disease-appropriate FOODRx boxes: traditional American, Somali, Hispanic, and Heart Disease. Patients diagnosed with a lipid metabolism disorder were encouraged to select the Heart Disease FOODRx box. The monthly boxes included culturally appropriate shelf-stable food items and disease-appropriate recipes and education to correspond with the box type selected. The recipes and educational materials were created by a Registered Dietitian at SHH and were reviewed by the clinic staff. The recipes and education for the Somali and Hispanic boxes were in Somali/English and Spanish/English, respectively, to further encourage their utilization. The boxes were distributed by Second Harvest Heartland staff at the clinic. Four out of the twelve box pick-ups were paired with a meeting with a Registered Dietitian or Certified Diabetes Educator. When possible, the rest of the box pick-ups were scheduled at patients’ regular visits.

2.3. Clinic Selection

The organizations selected one clinic for the pilot program. The Family Health Center in St. Cloud, Minnesota, was selected because of its likelihood to serve individuals fitting the eligibility criteria for the study. The geographic location of the clinic, service coverage, and structure also provided enough space for the execution of the program. Because this clinic is connected to the larger health system CCH, and the system’s large service coverage, we were able to follow patients at any level of care within the system to largely account for their healthcare utilization activity during the time of the study (from regular doctor visits to general hospital and ER visits).

2.4. Participant Selection

Figure 1 shows the flow chart of the program’s participant selection. Using CCH system records, patients were identified, screened, and enrolled during a two-month recruiting period (September and October 2016) based on the following four stages: (1) potential participants’ identification, (2) food security screening, (3) eligible participants enrollment, and (4) final participants.

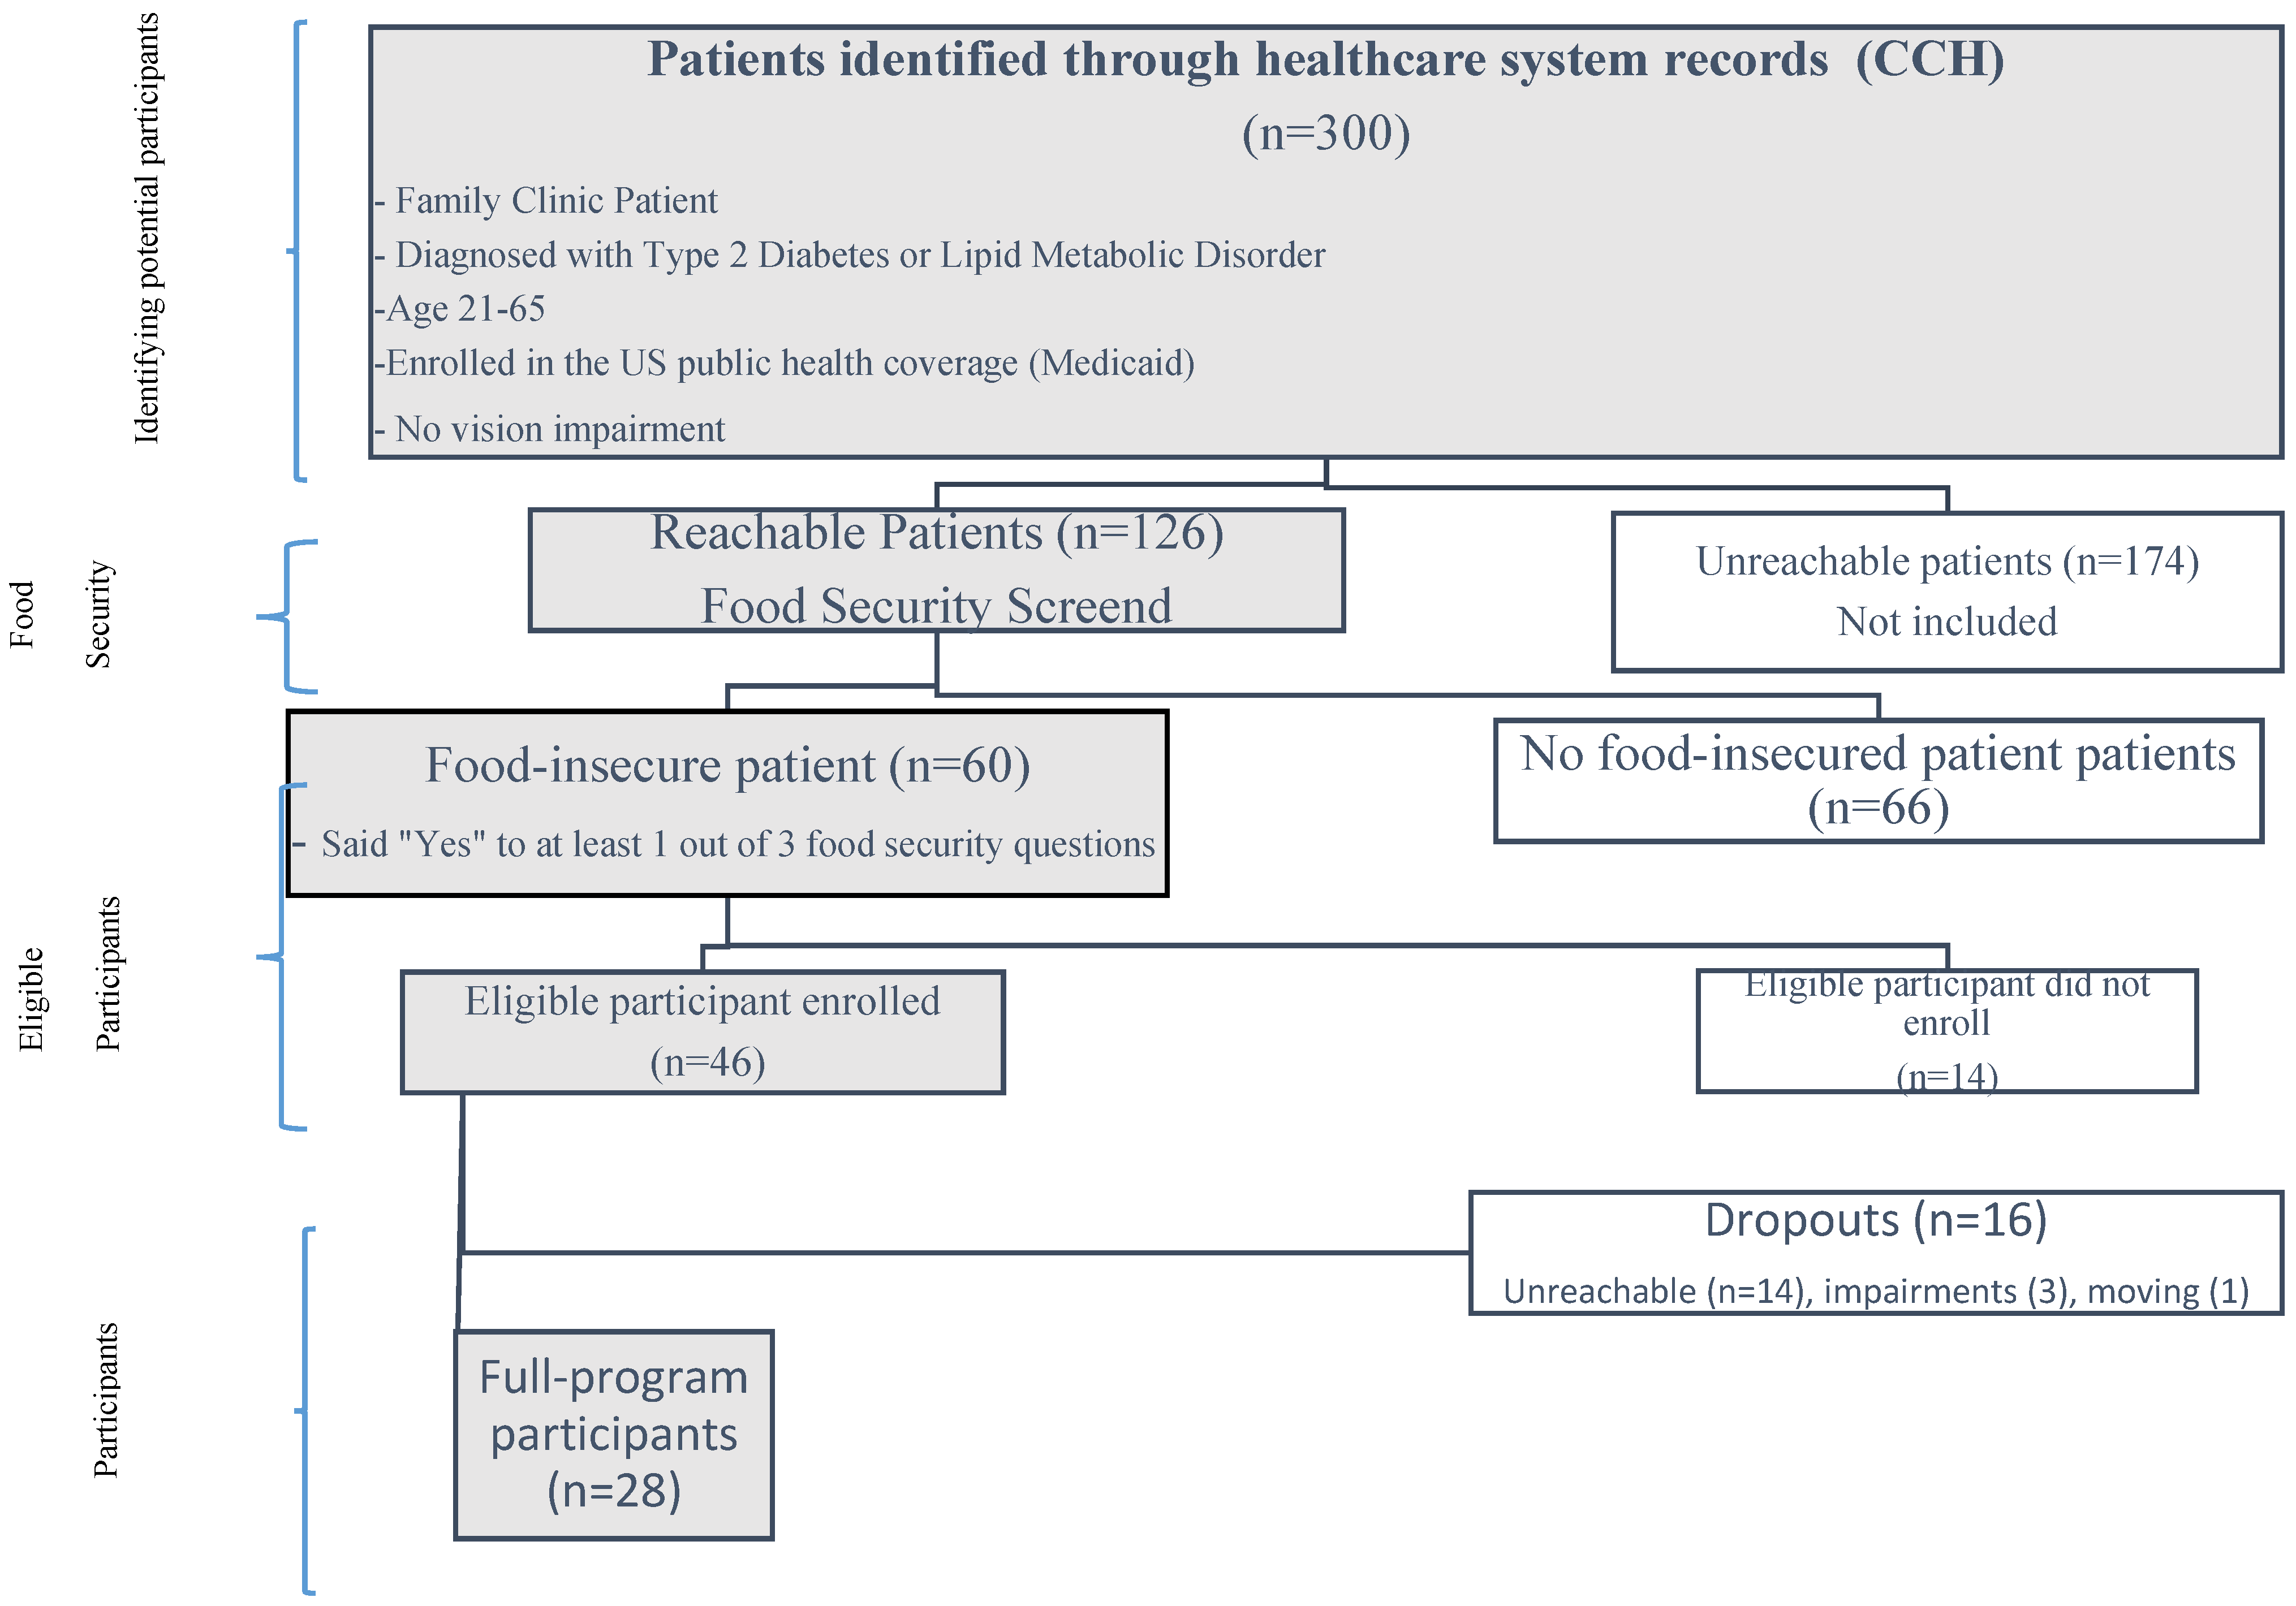
2.4.1. Potential Participants Identification

The identification process of potential participants began in September 2016 using the exclusion and inclusion criteria.
a. 
Exclusion Criteria:
The potential participant should not have a cognitive impairment, a psychiatric hospitalization history, or a chemical dependency, nor should there be an inability or unwillingness of the individual or legal guardian/representative to give written informed consent. Patients who were in advanced stages of vision impairment were not eligible to participate.
b. 
Inclusion Criteria:
The potential participant must be a current patient at the Family Health Center, currently diagnosed with either Type 2 Diabetes or a lipid metabolism disorder, age 21 to 65, have current health insurance enrollment in Minnesota Assistance (also known as Medicaid or public health insurance for low-income families), and able to understand the study procedures and comply with them for the entire length of the study. Recruitment was slower than anticipated due to disconnected phone lines and an inability to reach many patients. After using the exclusion and inclusion criteria, 300 patients were identified as potential participants. Out of this group, 126 patients were reachable via phone or in person, and 174 patients were unreachable.

2.4.2. Food Insecurity

The reachable patients were screened for food insecurity. Food security is achieved when a person, at all times, has physical and economic access to sufficient, safe, and nutritious food to meet his/her dietary needs and food preferences for an active and healthy life. It is determined by food availability, access, utilization, stability of supply, and is linked to livelihood security. To identify food insecurity, we follow the U.S. Adult Food Security Survey Module and NHANES survey questionnaires on food security [24]. In this analysis, individuals must answer positively to 1 out of 3 screening questions in order to be identified as food insecure [25]. Accordingly, the participants were classified as: (a) food-insecure patients (n = 60) or (b) food-secure patients (n = 66).

2.4.3. Eligible Participants Enrollment

Enrollment lasted 2 months, through the month of October. Out of the 60 eligible participants, 46 patients initially enrolled (42 with diabetes and 4 with both a lipid metabolism disorder and diabetes) and 14 did not enroll. Enrollment was via phone and doctor visits to obtain a written consent form.

2.4.4. Final Participants
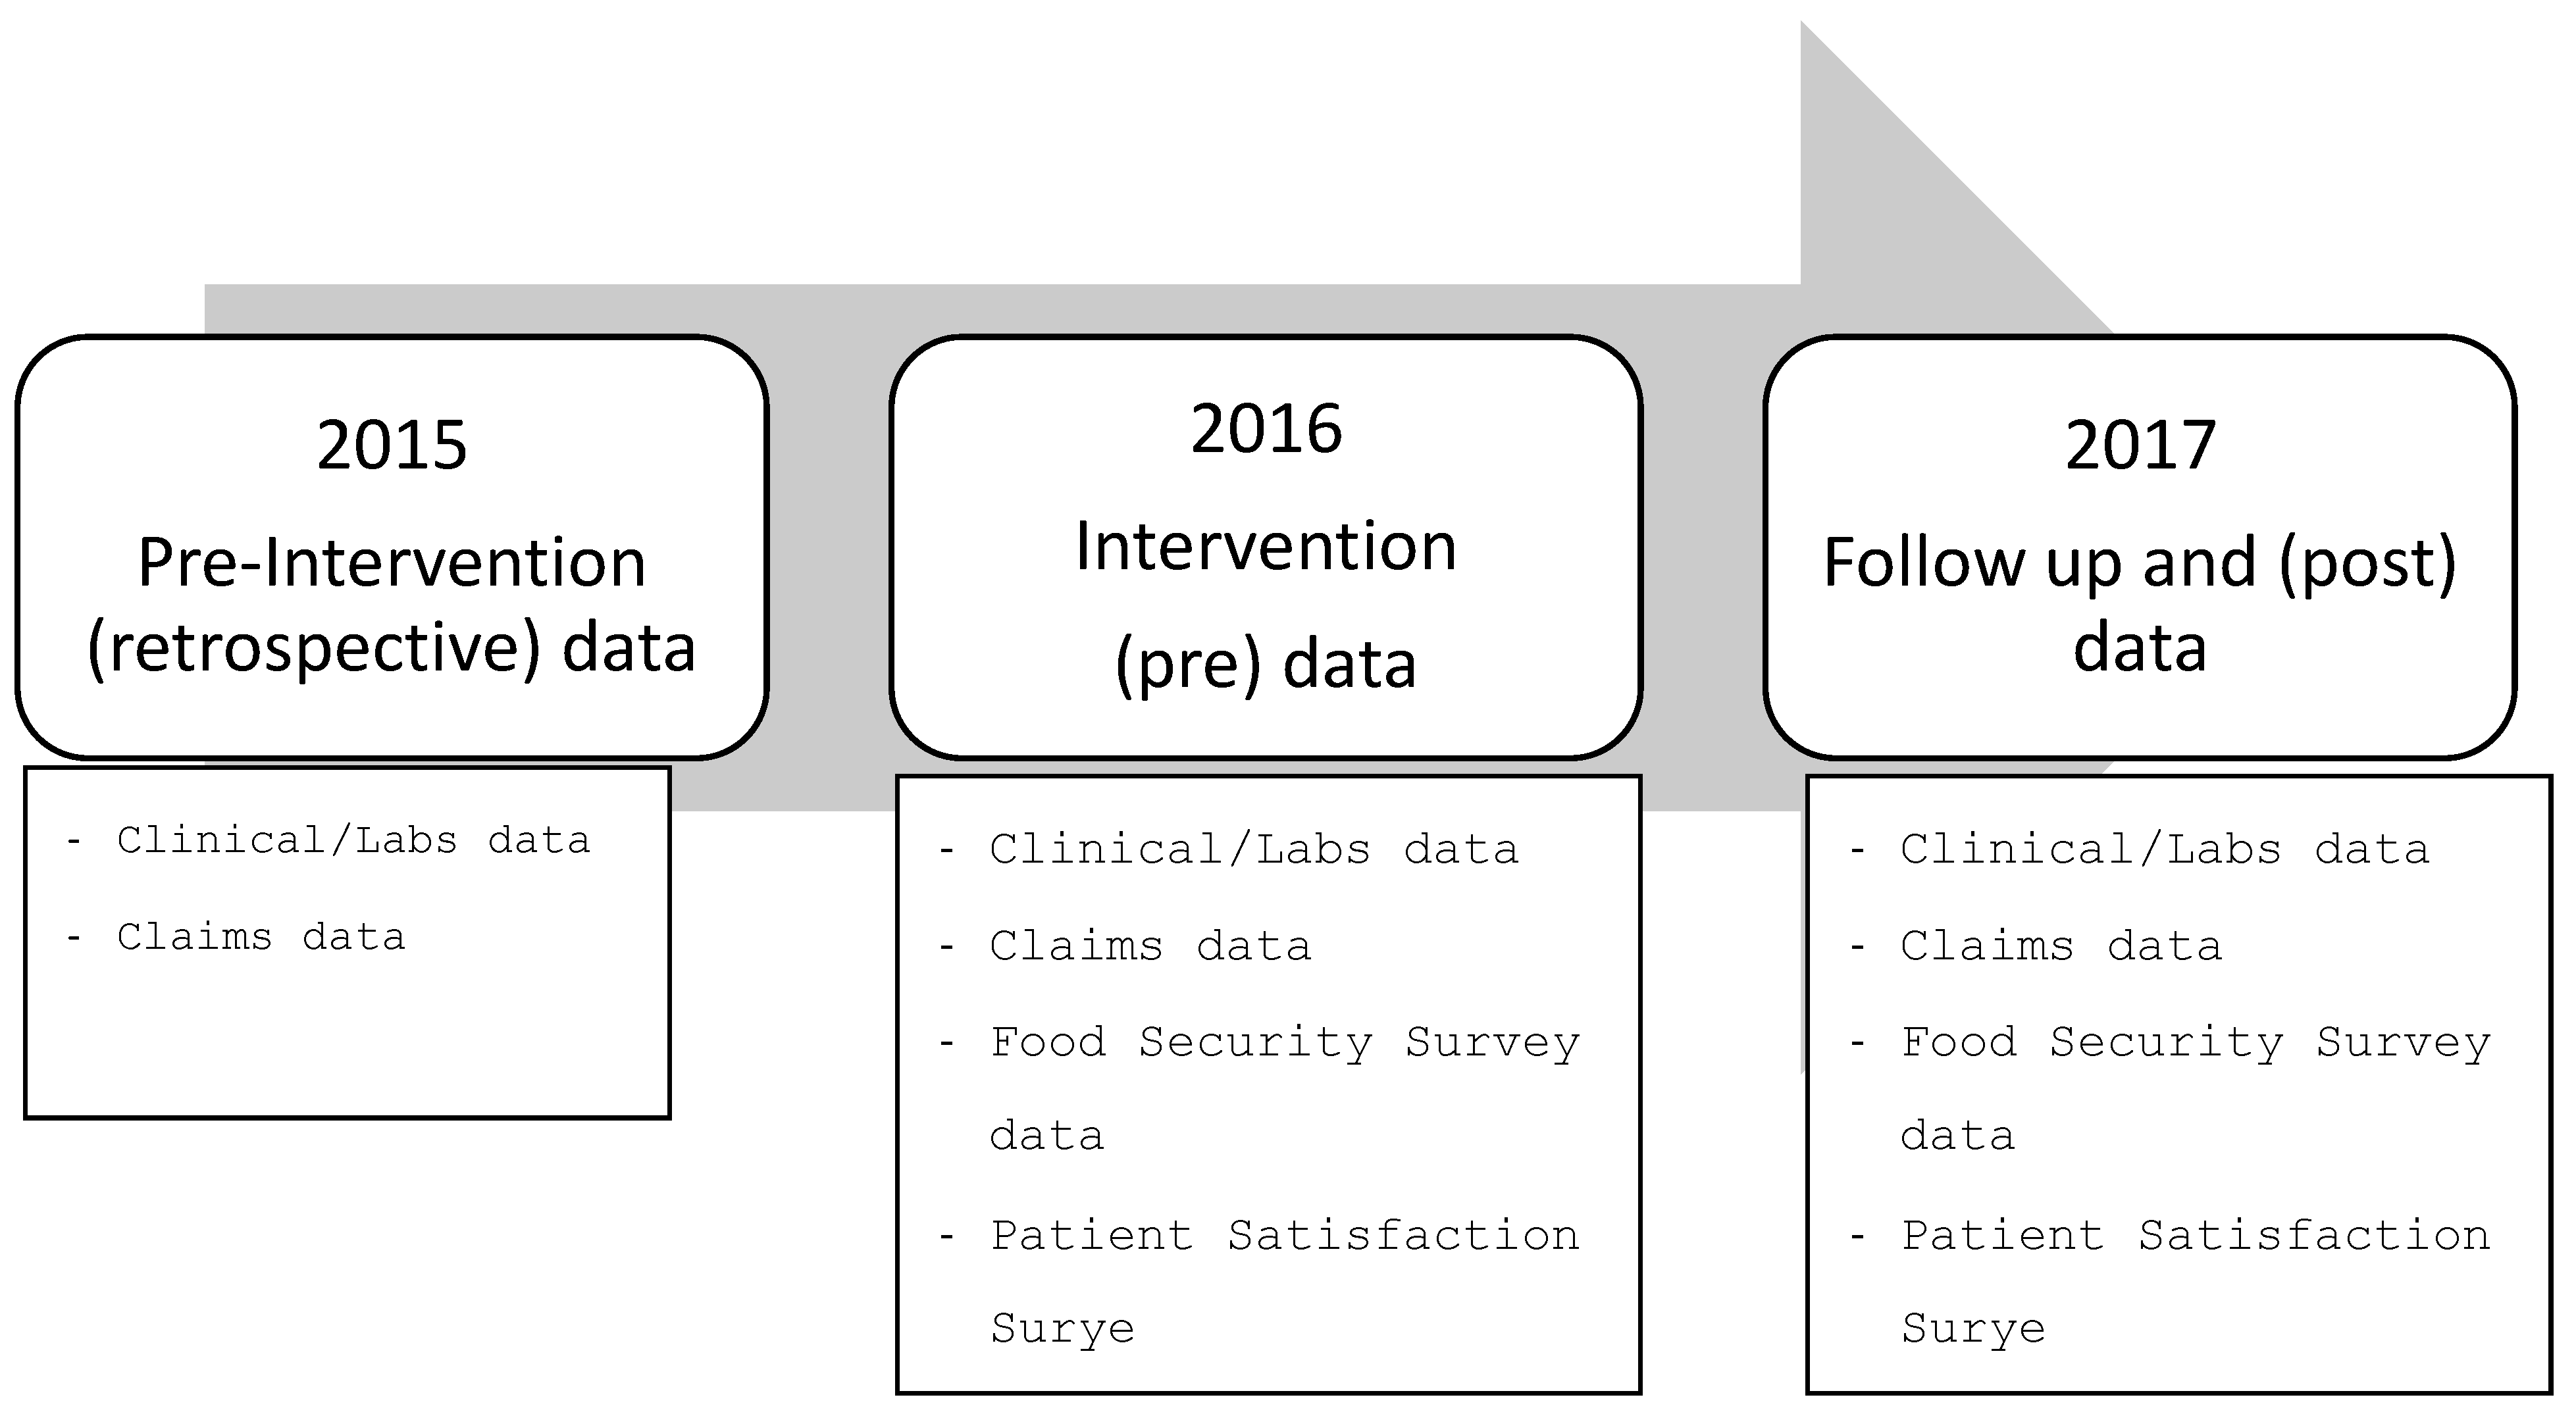
Of these 46 initial participants, 28 continued in the program until the end (full-program participants), a 61% retention rate. Meanwhile, 16 patients dropped out. The reasons for withdrawing from the program were: (1) unable to contact (12 of our initial participants were disenrolled from the study due to disconnected phone lines and an inability to reach them), (2) comorbidities and other chronic illness (3 participants who dropped out of the study did so because of other conditions that made adherence to the study protocol impossible), and (3) changing clinics (one participant was disenrolled from the study due to changing what health center they used for their diabetes care). These dropouts happened largely in the first two months of the study.
At the outset of the program, the participants had an initial visit with their provider to consent to the study, take the pre-survey, laboratory tests, and select and receive their first box. At the end of the program, the patients picked up their final boxes, had labs drawn, and took a post-intervention evaluation survey. Additional support resources were offered to those interested. In most cases, the laboratory tests were matched with the patients’ regular medical checkups to decrease the patients’ burden of multiple doctor visits.

2.5. Study Data

This study uses three sources of data to evaluate the impact of the program: (1) clinical/labs administrative data, (2) patient survey data, and (3) claims data (for all claims regardless of the payor). Figure 2 shows a flowchart of the data collection and its timing. Clinical/labs and claims data were collected at every stage of the program and retrospectively. Patient survey data were only collected at the beginning and end of the program. Claims databases collect information on interactions with the health system that generates a paying claim, such as: doctors’ appointments, medical interventions, medication provided in the healthcare system, insurance information, and other patient–provider communications. For purposes of confidentiality and privacy, all information was transmitted in compliance with Health Insurance Portability and Accountability act of 1996 (HIPAA) requirements to SHH’s patient data warehouse and access was limited to the researchers depending on their need to know. Only the researchers in this document had access to all sources. For comparison reasons, the study also uses information from the 12 months preceding the start of the program (retrospective data). Therefore, the data cover the period from September 2015 until October 2017.

2.5.1. Clinic/Labs Administrative Data

CCH provided data on patients’ characteristics, (sex, age, marital status, language, religion, tobacco consumption, and aspirin use) laboratory and health indicator measures (Fasting Glucose (mg/dL), Hemoglobin A1c Levels—HgbA1c (%), Low-Density Lipoprotein (LDL) Cholesterol Levels (mg/dL), Blood Pressure (mmHg), Body Mass Index (BMI—weight in kilograms divided by height in meters squared), all patient’s encounters with the health system (ER visits, inpatient, outpatient, and recurrent visits), and the final accepted claims connected to those encounters. We identified the participants’ disease-related medical measures and medical care usage costs from the participants’ actual medical care usage 12 months before the program started and their usage during the program.

2.5.2. Claims Administrative Data

Claims data are very useful for following individuals’ use of health services in a relatively consistent format. They consist of billing codes that healthcare providers submit to payers. Hence, most patient encounters and medical costs are traceable. Given the complexity of these data, only accepted and unique claims for each Hospital ID per patient were included. When more than one claim was connected to a Hospital ID and patient, it was checked if it was an administrative issue by looking at the timeframe of the encounter and the submitted claim.
Direct costs were estimated using insurance claims information that accounted for the amount claimed to insurance companies for all the possible hospital encounters each patient had with CCH during the period of analysis. We also estimated what we call indirect costs—or non-hospital encounters, like office visits. The indirect costs per patient were estimated for office visits using the actual number of visits reported in the clinical and claims data and the estimated average commercial costs of similar-length visits (30 min short visits, more than 45 min long visits) [25].

2.5.3. Survey Instruments

Pre and post surveys were administered to the patients. The surveys asked a total of 30 questions on food security, dietary intake, diabetes distress, self-care management, medication adherence, patient satisfaction, and retention variables. A full list of the questions in the questionnaires, with corresponding sources, is in the online Appendix A [19,25,26,27,28,29,30].

2.6. Target Outcomes

2.6.1. Primary Target Outcomes

The food intervention was evaluated in terms of the following primary areas: (1) healthcare outcomes post-study using the following measures: HgbA1c (%), Fasting Glucose (mg/dL), LDL (mg/dL), VLDL (mg/dL), HDL (mg/dL), Cholesterol (mg/dL), Triglycerides (mg/dL), Blood Pressure (mmHg), and BMI, (2) material hardships, as measured by the participants’ surveys (measures of food insecurity (yes to one of the food insecurity questions), medication nonadherence (%), diabetes distress (%), self-efficacy, and medication affordability), and (3) mental health, as measured using depression questions in the participant survey [19,27,28,29,30].

2.6.2. Secondary Target Outcomes

To account for the return-on-investment evaluation and patient satisfaction, the study also considers: (1) healthcare utilization and costs, including inpatient services, outpatient services, office visits, and “No Show” visits using patient-level claims data in the health system, and (2) changes in patient satisfaction scores.

2.7. Impact Analysis Methodology

Using the data of 28 participants, we follow a tailored pre–post evaluation of the program based on observational changes. To account for the lack of randomness in the application of treatment (i.e., the provision of food boxes), when possible, we consider three time periods: “Before”, “Start”, and “Post”. For the “Before” period, we use information 12 months before the start of the program. The “Start” measure considers the values at the beginning of the program, when participants registered. The “Post” period is the follow-up measure at the end of the program.
The “Before” period is used to eliminate any bias in measuring the individuals’ behavioral responses. Measurement of behavior is a regular challenge in health intervention programs, because participants may feel compelled to change their behavior right before the start of such programs. Time-sensitive measures such as the ones evaluated in this research could be biased by these behavioral changes if we only look at the measures right at the start of the intervention [31]. By using the “Before” period when the program was not in place, the individuals could have not been able to adjust their behavior due to possible future participation in the health intervention program. Individual behavioral pre-participation changes are regular problems in health intervention programs, because interventions can take time to be implemented [32]. Participants may feel compelled to change their behavior right before the start of such programs. Time-sensitive measures such as the ones evaluated in this research could be biased by these behavioral changes if we only look at the measures right at the start of the intervention [33]. Therefore, the comparative analysis in this report uses the Before, Pre, and Post periods to evaluate the impact of the intervention.
For healthcare utilization and costs, we use the “Before” and “During” periods for evaluation. The “Before” period allows us to compare between equal time periods before FOODRx started and the period that reflects the duration of the program. For the evaluation of individuals’ food security status, self-care management, and service satisfaction, we use a pre–post survey.
We use non-parametric alternatives to the usual measures in large samples. Non-parametric alternatives to large sample tests are the Sign test and Wilcoxon’s matched pairs test. When the variables of interest are dichotomous in nature (i.e., “yes” or “no”), then McNemar’s Chi-square test is used. Meanwhile, Cochran Q is particularly useful for measuring changes in frequencies (proportions) across time. The study sample size limits the application of multivariable methods to account for correlations and other confounding elements. Nevertheless, due to the uniqueness of the partnership and the data, we are able to know most of the measures of 18 of the patients who dropped out of the program after the first two months. All dropped out right after the first two months of the program. This way, we can also observe the degree of selectivity among the participants and non-participants, and compare patients who were equally eligible for the program at the beginning of the intervention. All the data analyses were executed using Excel (2023) for Microsoft 365 and Stata 16.1.

3. Results

The final sample in this study included 28 individuals who were diagnosed with diabetes and/or a lipid metabolism disorder and were identified as food insecure. As shown in Table 1, 71% of the participants were women, with a median age of 54, 39% were White and 39% were Black, 36% were Muslim, 36% identified themselves as Somali, 54% were non-married, and only 7% were current smokers. For contrast, we show the characteristics of the dropouts. This group was younger than the final participant group (median age 45), had a balanced gender representation, and was more likely to be Black (50%), Christian/Catholic (56%), and prefer the written language to be English (72%).

3.1. Laboratory and Other Health Measures

The results indicate there were significant improvements in fasting glucose and HgbA1c. Comparing the period before the program against the post-program measures (Table 2), there were improvements in the average fasting glucose and HgbA1c, at a 5 percent significance level. In the Post period, at least 25 percent of the sample had HgbA1c lower than or equal to 7.5 percent.
The reductions in these levels also lowered the participants’ median level in Before and Post. However, the measures taken at the beginning of the program (Pre measures) were not significantly different from the Post measures, because the Pre measures were specifically scheduled during the first two months of the beginning of the program, allowing for some potential participant behavioral changes before taking the laboratory tests. Meanwhile, the Post measures were taken during the individuals’ regular check-ups near the end of the program (final two months). The Before measures were taken before the program was even in place, during the 12 months preceding the beginning of the program, so we would not expect behavioral changes among the participants.
Notice that individuals who dropped out of the program, although starting at lower glucose and hemoglobin levels before and pre-program, showed increases in these measures in the period that accounts for post-program. Although this group is not a traditional control group, we can see another comparable group that did not show the reductions we see in the program’s participants. However, it may also show that those dropping out of the program were less likely to adhere to disease care programs. They were, on average, younger and had HgbA1c levels below 9%. Yet, they ended up reaching very poor HgbA1c levels on average at the end of the program. Table 2 also shows that changes in the other measures were not statistically significant. The participants maintained their lipids levels, BMI measures, and blood pressure measures.

3.2. Health Services Utilization and Costs

Table 3 shows the estimation of health services utilization and costs. Our analysis explores the healthcare usage and costs of the participants before and during the program. The results show positive impacts on both utilization and costs among the FOODRx program participants. In total, the participants had fewer hospital encounters with the healthcare system during the duration of the program, especially those related to ER visits. The average number of ER visits per patient visiting the ER went from 2.48 visits during the 12 months before the program started to 2.15 during the 12 months of the FOODRx program. This change was statistically significant at the 10 percent level. If all 46 participants are considered regardless of ER usage, the reduction is more dramatic, from 1.21 to 1 visit on average and statistically significant at the 5 percent level. For outpatient visits, there was an increase in visits per user, but the number of total encounters stayed the same.
In part due to the reduction in costly utilization visits, we saw a decrease in the cost of care for participating patients. We found a forty-four percent reduction in claims going from USD 597,240 to USD 355,620. This represents an average per claim change from USD 3020 to USD 2550 (15.5% reduction). More significantly, ER-related claims went down from USD 65,000 to USD 49,000. This translates into a per user average change from USD 4980 to USD 3750. However, due to sample size and variation, this change was not significant at the traditional statistical significance level. Contributing to this was the number of claims submitted, which went down by 57 claims.

3.3. Food Security, Self-Care Management, and Patient Satisfaction

The program had a significant impact on individuals’ food security by decreasing the practice of cutting or skipping meals due to lack of money and reducing the proportion of patients who did not eat when hungry because they did not have money to buy food. These were direct impacts from providing regular food boxes to these patients. In terms of indirect effects, the program reduced the likelihood of trading off food versus medicine in both directions. More patients reported never having to put off buying one for the other after the end of the program. There were also more patients who did not run out of disease-appropriate food because of money following the program, but the results are not statistically significant at traditional levels.
There were several measures of patient satisfaction that increased as a result of participating in the FOODRx program. On average, we saw a significant increase in referrals to registered dietitians. Patient satisfaction with educational activities also increased significantly. Cultural specificity was also a strong satisfaction indicator and key to maintaining the participation rate during the program.
Table 4 shows the results of the proportion of patients for questions that had categorical options and the average rankings for patient-satisfaction-related questions. Only one of the participants did not respond to the post-program survey.

4. Discussion

This study evaluates the feasibility and effectiveness of a health intervention program targeted to patients diagnosed with diabetes and/or a lipid metabolism disorder and focused on food consumption and self-care management in a clinical setting but with a non-traditional partnership. Previous food bank pilots have highlighted the need for this kind of partnership to improve the way communities manage low-income members’ health issues [17,22,32]. Food banks know how to reach vulnerable populations, while healthcare systems serve and care for diagnosed patients and targeted populations. The complementary nature of these two systems’ expertise helps to address the issue of food insecurity and other social and economic determinants of health among low-income populations, while connecting the clinical care and treatment necessary among patients with chronic diseases.
Our work shows that both the patients and clinic experienced positive outcomes as a result of the intervention. However, like in other food and medicine programs, we found that, on the patients’ side, HgbA1c levels decreased, but among patients that had higher levels, fasting glucose levels did not change [18,22,34]. Our work adds to the discussion on changes in patients’ relationship with their clinic. We found that patient satisfaction increased. Patients also saw beneficial reductions in several measures of food insecurity and increased satisfaction in educational resources [18,19,34,35]. Meanwhile, as recent research has focused on payors’ perspectives, we also found that the healthcare system experienced a reduction in usage and costs related to the costliest services among diabetic patients (ER visits) [36]. We do not have information about pharmacy costs in our analysis, so we are unable to compare with a full insurance company perspective.
Similar to previous programs, this intervention creates a model for partnerships between food banks and healthcare partners to target specific vulnerable populations diagnosed with diet-related chronic diseases. Unlike these previous programs, we made the meeting center a clinic [6,17,18,22,24,34].
The Food Is Medicine Movement [18] calls for the creation and embrace of partnerships similar to the one presented in this study. Although there seems to be interest in solving health issues among low-income patients, the feasibility of these partnerships depends on creative thinking, risk taking, and new collaborations. Policymakers should find ways to encourage these partnerships as models for health promotion, public health, and population health issues.

5. Limitations

There are important limitations in our research worth highlighting. First, the program lacks a random design and a strategy for identifying a treatment and control group [22]. There is also lack of current research on average national and statewide trends for diabetic patients on these measures by population, against which we may compare. Because enrollment was restricted to one clinic, this limited the demographics and the number of potential participants. Future programs can be expanded to different clinics serving a broader population.
Second, although the retention rate was high compared to similar interventions (61% retention rate vs. 45–58% in other studies), the sample size was small. Therefore, this limits the degree to which the study can use more sophisticated techniques to evaluate the program impact. Third, as in previous food pilot programs, FOODRx offered a combination of resources in addition to food boxes (i.e., monthly gift cards and educational activities). The simultaneous implementation of the initiatives limits the capacity to disentangle individual impacts.
Fourth, because food box pick-ups were recorded as visits, some of the increase in the number of clinical short visits was the result of food box pick-ups. This increase in usage impacted our financial analysis due to the increase in short office visits. We are unable to separately identify these changes. To encourage retention, the clinic would match pick-ups as close as possible to regular visits, and when not possible, these were recorded as short office visits, but no extra code was provided to identify them as FOODRx-related.
Further, our statistically significant changes do not translate into large changes in individuals’ health. Despite the statistically significant reduction in A1C and cholesterol levels, the participants reflected medically unhealthy levels that required higher reductions to make a sounding impact on individual risk levels.
In the implementation stage, our program required participants to retrieve their boxes at the clinic. Several patients reported transportation being one of the main issues for no shows no box pick-ups. Some other food interventions have directly addressed this issue by using a food delivery option. However, those programs did not assess the participants’ patient experience during the progress of their program [36]. More work is needed to understand if our required regular visits were the reason for increasing the participants’ clinic comfortability levels, rather than the food boxes. A follow up after the intervention period could provide some clues on whether the participants maintained in check with their regular doctor visits and diabetes management.

Author Contributions

Conceptualization, M.G.-P., A.D.K.L. and D.T.; methodology, M.G.-P. and D.T.; software, M.G.-P. and K.S.; validation, K.S., K.W. and A.D.K.L.; formal analysis, M.G.-P.; investigation, M.G.-P.; resources, A.D.K.L.; data curation, M.G.-P.; writing—original draft preparation, M.G.-P.; writing—review and editing, M.G.-P., A.D.K.L., D.T. and K.W.; supervision, D.T. and K.S.; project administration, A.D.K.L. and K.S.; funding acquisition, A.D.K.L. All authors have read and agreed to the published version of the manuscript.

Funding

This project was funded by Bank of America Neighborhood Builders [22036077]; Medtronic Foundation [FY16-00327]; George Family Foundation [21639]; Humana [1649800]; Minnesota Department of Human Services-Health Care Administration, U.S. Department of Health & Human Services Centers for Medicare & Medicaid Services [H55-32476]; Margaret A Cargill Philanthropies [G-3382]; and Initiative Foundation [IF16-5455].

Institutional Review Board Statement

The study was conducted in accordance with the Declaration of Helsinki, and approved by the Institutional Review Board (or Ethics Committee) of CentraCare Internal Review Board—IRB approval on 21 July 2016. (CC-20180702).

Informed Consent Statement

Informed consent was obtained from all subjects involved in the study.

Data Availability Statement

The data presented in this study are available on request from the corresponding author. The data are not publicly available due to privacy and confidentiality restrictions.

Acknowledgments

Mahado Ali, Brenda Carriveau, Jessica George, Sahur Hussein, Emily Kaiser for the collaboration in implementing the program by contacting the participants and helping with implementing the program’s surveys.

Conflicts of Interest

M.G.-P. was hired as a consultant by CentraCare Health System. D.T. and K.S. were employed by the CentraCare Health System. A.D.K.L. was employed by Second Harvest Heartland. The authors declare no conflict of interest.

Abbreviations

ADAAmerican Diabetes Association
CCHCentraCare Health
SHHSecond Harvest Heartland
CDCCenter for Disease Control
MNMinnesota
USA/USUnited States of America
AHRQAgency for Healthcare Research and Quality
HIPAAHealth Insurance Portability and Accountability act
HgbA1cHemoglobin A1c Levels
LDLLow-Density Lipoprotein
BMIBody Max Index
ER visitsEmergency room visits

Appendix A. Online Appendix

Table A1. Data source: labs/clinical.
CategoryValuesOptimal Level or VariationsSource
HbA1cLaboratory<7/0%Laboratory
Fasting GlucoseLaboratory>126 mg/dlLaboratory
LDL/HDLLaboratory<100/45 mg/dLLaboratory
Blood PressureDoctor visit/lab<130/80 mm HgDoctor visit/lab
TriglyceridesLaboratory<150 mg/dLLaboratory
Heart Failure eventInpatient/outpatient admin. Data. 1: Yes, 2: NoCategoricalClinical/admin. data
HeightDoctor visitContinuousClinical/admin. data
WeightDoctor visitContinuousClinical/admin. data
Date of Birth (age)DD/MM/YYYYContinuousClinical/admin. data
SexMale; FemaleCategoricalClinical/admin. data
Race/EthnicityWhite/Black/Hispanic/OtherCategoricalClinical/admin. data
Language Written PreferenceEnglish/Somali/Spanish/Arabic/OtherCategoricalClinical/admin. data
Marital StatusMarried/Non-MarriedCategoricalClinical/admin. data
Insurance StatusOpen-endedDepends on systemClinical/admin. data
Diabetes diagnosticYes or NoParticipants are already diabetic patientsClinical/admin. data
CVD diagnosticYes or NoCategoricalClinical/admin. data
Other Chronic diseases?Yes or NoCategoricalClinical/admin. data
Tobacco UseYes, No, Never usedCategoricalClinical/admin. data
Aspirin UseYes, No, Not ApplicableCategoricalClinical/admin. data
Table A2. Data source: insurance claims data.
VariablesMeasureComments and Source
Inpatient Services
         Hospital inpatient days and costsDays and claimed insurance costClaims insurance data
Outpatient Services
         Office Visitsnumber of visits, length, and estimated costsClaims insurance data and Minnesota Community Measurement
         ER visits number of visits, length, and estimated costsClaims insurance data and Minnesota Community Measurement
         Hospital Outpatient Days and claimed insurance costClaims insurance data
Table A3. Estimated price of office Visits (commercial cost).
Average Commercial CostAverage
Office visit, Established Patient, 5 minUSD 45
Office visit, Established Patient, 10 minUSD 87
Office visit, Established Patient, 15 minUSD 146
Short Office Visit Average Cost USD $93
Office visit, Established Patient, 25 minUSD 232
Office visit, Established Patient, 40 minUSD 313
Long Office Visit Average Cost USD $273
Office visit, New Patient, 10 minUSD 92
Office visit, New Patient, 20 minUSD 161
Office visit, New Patient, 30 minUSD 240
Short Office Visit Average Cost, New Patient USD $164
Office visit, New Patient, 45 minUSD 365
Office visit, New Patient, 60 minUSD 457
Long Office Visit Average Cost, New Patient $411
Source: Average commercial costs come from Minnesota Community Measurement’s Cost and Utilization Report (2016–2017) https://mncmsecure.org/website/MNHealthScores%20Snapshots/2019%20MY/Appendix%20Tables/ACP_Office%20Visit%202019MY%20Results.pdf [accessed on 16 February 2024]. To estimate the change in office visits costs, we use the number of visits to the doctor by each patient and the average commercial procedure cost estimated by the healthcare system. We also use information on the average Medicaid procedure cost. For the average procedure cost per office visit, we separate the visits between short versus long office visits and established versus new patients. This allows us to obtain a closer estimate of the actual cost per doctor’s visit.
Table A4. Survey instruments and sources.
QuestionAnswerSource
The first statement is, “The food that (I/we) bought just didn’t last, and (I/we) didn’t have money to get more”. Was that often, sometimes, or never true for (you/your household) in the last 12 months? 1: Often true[24]
2: Sometimes true
3: Never true
4: DON’T KNOW
“(I/we) couldn’t afford to eat balanced meals”. Was that often, sometimes, or never true for (you/your household) in the last 12 months? [SURVEYOR: Show card #2 and circle number client points to below; if client asks what a “balanced meal” means, respond: “you can define balanced meal in whatever way you think is best”]1: Often true[24]
2: Sometimes true
3: Never true
4: DON’T KNOW
In the last 12 months, since last (name of current month), did (you/you or other adults in your household) ever cut the size of your meals or skip meals because there wasn’t enough money for food?1: Yes; 2:No; 3:DK[24]
How often did this happen—almost every month, some months but not every month, or in only 1 or 2 months? 1: Almost every month[24]
2: Some months but not every month
3: Only 1 or 2 months
4: DON’T KNOW
In the last 12 months, did you ever eat less than you felt you should because there wasn’t enough money for food?1: Yes; 2:No; 3:DK[24]
In the last 12 months, were you every hungry but didn’t eat because there wasn’t enough money for food?1: Yes; 2:No; 3:DK[24]
In the last four weeks how often did you eat any fresh fruit, canned fruit, or fruit in smoothies? Don’t count juices.1: Less than once per WEEK; 2: About 1 time per WEEK; 3: 2–3 times per WEEK; 4: 4–6 times per WEEK; 5:Once per DAY 6: 2 or more times per DAY[26]
In the last four weeks how often did you eat green salad (such as lettuce or spinach salad)?1: Less than once per WEEK; 2: About 1 time per WEEK; 3: 2–3 times per WEEK; 4: 4–6 times per WEEK; 5:Once per DAY 6: 2 or more times per DAY[26]
In the last four weeks how often did you eat vegetable soup or stew with vegetables?1: Less than once per WEEK; 2: About 1 time per WEEK; 3: 2–3 times per WEEK; 4: 4–6 times per WEEK; 5:Once per DAY 6: 2 or more times per DAY[26]
During the past month, have you often been bothered by feeling down, depressed, or hopeless?1: Yes; 2:No; 3: Don’t Know[27]
Sometimes people run out of the food they need to take care of their diabetes and don’t have enough money or resources to get more. In the last 30 days, how often did you run out of the food you needed to take care of your diabetes? Would you say…1: Never[17]
2: Rarely
3: Sometimes
4: Often
Do you ever forget to take your medicine? 1: Yes; 2: No; 3: Don’t Know[28]
Are you careless and/or confused at times about taking your medicine? 1: Yes; 2: No; 3: Don’t Know[28]
When you feel better do you sometimes stop taking your medicine? 1: Yes; 2: No; 3: Don’t Know[28]
Sometimes if you feel worse when you take the medicine, do you1: Yes; 2: No; 3: Don’t Know[28]
stop taking it?
In the last 12 months, how often did you take less medicine than you were supposed to because you could not afford to buy more?1: Never, 2: Rarely, 3: Sometimes, 4: Often[17]
In the last 12 months, how often did you put off buying food so that you would have money to buy your medicines? 1: Never, 2: Rarely, 3: Sometimes, 4: Often [17]
In the last 12 months, how often did you put off buying for medicines so that you would have money to buy food? 1: Never, 2: Rarely, 3: Sometimes, 4: Often[17]
Exercising regularly?1: So Difficult that you couldn’t do it at all[29]
2: Very Difficult, you hardly ever do it
3: Difficult, but you could do it some of the time
4: Not difficult, you could do it most of the time
5: Not difficult, you got it exactly right
6: [Don’t read] Doesn’t Apply, you don’t do it, or members of your diabetes team did not recommend it
Following your recommended eating plan? 1: So Difficult that you couldn’t do it at all[29]
2: Very Difficult, you hardly ever do it
3: Difficult, but you could do it some of the time
4: Not difficult, you could do it most of the time
5: Not difficult, you got it exactly right
6: [Don’t read] Doesn’t Apply, you don’t do it, or members of your diabetes team did not recommend it
Checking your blood sugar? 1: So Difficult that you couldn’t do it at all[29]
2: Very Difficult, you hardly ever do it
3: Difficult, but you could do it some of the time
4: Not difficult, you could do it most of the time
5: Not difficult, you got it exactly right
6: [Don’t read] Doesn’t Apply, you don’t do it, or members of your diabetes team did not recommend it
Checking your feet for wounds and sores? 1: So Difficult that you couldn’t do it at all[29].
2: Very Difficult, you hardly ever do it
3: Difficult, but you could do it some of the time
4: Not difficult, you could do it most of the time
5: Not difficult, you got it exactly right
6: [Don’t read] Doesn’t Apply, you don’t do it, or members of your diabetes team did not recommend it
Overall rating of doctor visitsScale [30] and Authors creation
0 to 10 (0 worse to 10 Excellent)
Have you been referred to a nutritionist by your doctor before?1: Yes,[30] and Authors creation
2: No,
3: Not Applicable
Have you been referred to an educational program by your doctor before?1: Yes,[30] and Authors creation
2: No,
3: Not Applicable
How many times have you attended a diabetes educational workshop in the last 12 months?Numerical Open ended. [30] and Authors creation
Rate educational programs ability to give information as wanted to manage your conditionScale [30] and Authors creation
0 to 10 (0 worse to 10 Excellent)
Rate educational programs ability to care responsive to cultural needsScale [30] and Authors creation
0 to 10 (0 worse to 10 Excellent)
Overall rating of nutrition counseling Scale [30] and Authors creation
0 to 10 (0 worse to 10 Excellent)
Overall rating educational activitiesScale [30] and Authors creation
0 to 10 (0 worse to 10 Excellent)

References

  1. American Diabetes Association. Fast Facts: Data and Statistics about Diabetes; American Diabetes Association: Arlington, VA, USA, 2015; Available online: https://professional.diabetes.org/sites/default/files/media/diabetes_fast_facts22322.pdf (accessed on 26 December 2023).
  2. NDEP Campaign Highlights the Link between Diabetes and Cardiovascular Disease. Available online: https://www.nih.gov/news-events/news-releases/ndep-campaign-highlights-link-between-diabetes-cardiovascular-disease (accessed on 26 December 2023).
  3. American Diabetes Association. Economic Costs of Diabetes in the U.S. in 2012. Diabetes Care 2013, 36, 1033–1046. [Google Scholar] [CrossRef]
  4. Osborn, B.; Morey, B.N.; Billimek, J.; Ro, A. Food Insecurity and Type 2 Diabetes among Latinos: Examining Neighborhood Cohesion as a Protective Factor. J. Racial Ethn. Health Disparities 2023, 10, 2061–2070. [Google Scholar] [CrossRef]
  5. The Boston Consulting Group. Improving Hunger and Health Outcomes in Minnesota: Poor Health Status & Chronic Diseases More Prevalent in Food-Insecure Populations; Hunger-Free Minnesota: Minneapolis, MN, USA, 2013. [Google Scholar]
  6. Gao, Y.; Yang, A.; Zurbau, A.; Gucciardi, E. The Effect of Food Is Medicine Interventions on Diabetes-Related Health Outcomes Among Low-Income and Food-Insecure Individuals: A Systematic Review and Meta-Analysis. Can. J. Diabetes 2023, 47, 143–152. [Google Scholar] [CrossRef]
  7. Rao, M.; Afshin, A.; Singh, G.; Mozaffarian, D. Do Healthier Foods and Diet Patterns Cost More than Less Healthy Options? A Systematic Review and Meta-Analysis. BMJ Open 2013, 3, e004277. [Google Scholar] [CrossRef]
  8. Gundersen, C.; Seligman, H.K. Food Insecurity and Health Outcomes. Econ. Voice 2017, 14, 1. [Google Scholar] [CrossRef]
  9. Mykerezi, E.K. Minnesota Cost/Benefit Hunger Impact Study; Hunger-Free Minnesota: St. Paul, MN, USA, 2010. [Google Scholar]
  10. Seligman, H.K.; Jacobs, E.A.; López, A.; Tschann, J.; Fernandez, A. Food Insecurity and Glycemic Control among Low-Income Patients with Type 2 Diabetes. Diabetes Care 2012, 35, 233–238. [Google Scholar] [CrossRef]
  11. Lyles, C.R.; Wolf, M.S.; Schillinger, D.; Davis, T.C.; Dewalt, D.; Dahlke, A.R.; Curtis, L.; Seligman, H.K. Food Insecurity in Relation to Changes in Hemoglobin A1c, Self-Efficacy, and Fruit/Vegetable Intake during a Diabetes Educational Intervention. Diabetes Care 2013, 36, 1448–1453. [Google Scholar] [CrossRef] [PubMed]
  12. Ford, E.S. Food Security and Cardiovascular Disease Risk among Adults in the United States: Findings from the National Health and Nutrition Examination Survey, 2003–2008. Prev. Chronic Dis. 2013, 10, E202. [Google Scholar] [CrossRef] [PubMed]
  13. Berkowitz, S.A.; Meigs, J.B.; DeWalt, D.; Seligman, H.K.; Barnard, L.S.; Bright, O.J.; Schow, M.; Atlas, S.J.; Wexler, D.J. Material Need Insecurities, Control of Diabetes Mellitus, and Use of Health Care Resources: Results of the Measuring Economic Insecurity in Diabetes Study. JAMA Intern. Med. 2015, 175, 257–265. [Google Scholar] [CrossRef] [PubMed]
  14. Seligman, H.K.; Schillinger, D. Hunger and Socioeconomic Disparities in Chronic Disease. N. Engl. J. Med. 2010, 363, 6–9. [Google Scholar] [CrossRef] [PubMed]
  15. Zhuo, X.; Zhang, P.; Hoerger, T.J. Lifetime Direct Medical Costs of Treating Type 2 Diabetes and Diabetic Complications. Am. J. Prev. Med. 2013, 45, 253–261. [Google Scholar] [CrossRef] [PubMed]
  16. Hanson, K.L.; Connor L., M. Food Insecurity and Dietary Quality in US adults and Children: A Systematic Review. Am. J. Clin. Nutr. 2014, 100, 684–692. [Google Scholar] [CrossRef] [PubMed]
  17. Seligman, H.K.; Lyles, C.; Marshall, M.B.; Prendergast, K.; Smith, M.C.; Headings, A.; Bradshaw, G.; Rosenmoss, S.; Waxman, E. A Pilot Food Bank Intervention Featuring Diabetes-Appropriate Food Improved Glycemic Control among Clients in Three States. Health Aff. 2015, 34, 1956–1963. [Google Scholar] [CrossRef] [PubMed]
  18. Bleich, S.N.; Dupuis, R.; Seligman, H.K. Food Is Medicine Movement—Key Actions Inside and Outside the Government. JAMA Health Forum 2023, 4, e233149. [Google Scholar] [CrossRef]
  19. Berkowitz, S.A.; Orr, C.J. Three Lessons About Diabetes and the Social Determinants of Health. Diabetes Care 2023, 46, 1587–1589. [Google Scholar] [CrossRef]
  20. Chronic Conditions in Minnesota: New Estimates of Prevalence, Cost and Geographic Variation for Insured Minnesotans. 2012. Available online: https://www.apcdcouncil.org/resource/chronic-conditions-minnesota-new-estimates-prevalence-cost-geographic-variation-insured-minnesotans (accessed on 26 December 2023).
  21. Center of Disease Control. Somali Refugee Health Profile. Available online: https://www.cdc.gov/immigrantrefugeehealth/profiles/somali/index.html#diabetes (accessed on 26 December 2023).
  22. Seligman, H.K.; Smith, M.; Rosenmoss, S.; Marshall, M.B.; Waxman, E. Comprehensive Diabetes Self-Management Support from Food Banks: A Randomized Controlled Trial. Am. J. Public Health 2018, 108, 1227–1234. [Google Scholar] [CrossRef]
  23. Wylie-Rosett, J.; DiMeglio, L.A. Strategies to Reduce Food Insecurity for People With Diabetes: A Call to Action. Diabetes Care 2023, 46, 245–248. [Google Scholar] [CrossRef]
  24. NHANES 2017–2018 Questionnaire Data Overview. U.S. Adult Food Security Survey Module: Three-State Design, with Screeners. Available online: https://wwwn.cdc.gov/nchs/nhanes/continuousnhanes/overviewquex.aspx?BeginYear=2017 (accessed on 26 December 2023).
  25. Minnesota Community Measurement Report on Cost and Utilization (2016–2017). Available online: https://mncmsecure.org/website/MNHealthScores%20Snapshots/2019%20MY/Appendix%20Tables/ACP_Office%20Visit%202019MY%20Results.pdf (accessed on 10 December 2023).
  26. Wakimoto, P.; Block, G.; Mandel, S.; Medina, N. Development and Reliability of Brief Dietary Assessment Tools for Hispanics. Prev. Chronic Dis. 2006, 3, A95. [Google Scholar]
  27. Kroenke, K.; Spitzer, R.L.; Williams, J.B. The PHQ-9: Validity of a brief depression severity measure. J. Gen. Intern. Med. 2001, 16, 606–613. [Google Scholar] [CrossRef] [PubMed]
  28. Morisky, D.E.; Green, L.W.; Levine, D.M. Concurrent and Predictive Validity of a Self-Reported Measure of Medication Adherence. Med. Care 1986, 24, 67–74. [Google Scholar] [CrossRef]
  29. Heisler, M.; Bouknight, R.R.; Hayward, R.A.; Smith, D.M.; Kerr, E.A. The Relative Importance of Physician Communication, Participatory Decision Making, and Patient Understanding in Diabetes Self-Management. J. Gen. Intern. Med. 2002, 17, 243–252. [Google Scholar] [CrossRef] [PubMed]
  30. Agency for Healthcare Research and Quality. ECHO Survey Measures. Available online: https://www.ahrq.gov/cahps/surveys-guidance/echo/about/survey-measures.html (accessed on 26 December 2023).
  31. Law, K.K.; Coyle, D.H.; Neal, B.; Huang, L.; Barrett, E.M.; Arnott, C.; Chow, C.K.; Di Tanna, G.L.; Lung, T.; Mozaffarian, D.; et al. Protocol for a Randomized Controlled Trial of Medically Tailored Meals Compared to Usual Care among Individuals with Type 2 Diabetes in Australia. Contemp. Clin. Trials 2023, 132, 107307. [Google Scholar] [CrossRef] [PubMed]
  32. Levi, R.; Bleich, S.N.; Seligman, H.K. Food Insecurity and Diabetes: Overview of Intersections and Potential Dual Solutions. Diabetes Care 2023, 46, 1599–1608. [Google Scholar] [CrossRef]
  33. Stroud, B.; Sastre, L. Impact and Acceptability of the Fresh Start Produce Rx Program on Food Literacy, Nutrition and Health. J. Nutr. Educ. Behav. 2023, 55, 79. [Google Scholar] [CrossRef]
  34. Walker, R.; Thorgerson, A.; Mosley-Johnson, E.; Egede, L. IDF2022-0221 The Burden of Food Insecurity on Quality of Life in Adults with Diabetes. Diabetes Res. Clin. Pract. 2023, 197 (Suppl. 1), 110507. [Google Scholar] [CrossRef]
  35. Lumpkin, J.R.; Taylor, L.H.; Hattori, A.; Jedele, J.M. Impact of Food Delivery and Health Coaching on Outcomes and Costs of Care: A Payer’s Perspective. NEJM Catal. Innov. Care Deliv. 2023, 4, 1–20. [Google Scholar] [CrossRef]
  36. U.S. Adult Food Security Survey Module: Three-Stage Design, with Screeners Economic Research Service, USDA July 2012. Available online: https://www.ers.usda.gov/media/8279/ad2012.pdf (accessed on 26 December 2023).
Figure 1. Program recruitment flow chart.
Diabetology 05 00009 g001
Figure 2. Data timing, note: clinical, labs, and claims data were only collected for those individuals who enrolled in the program. Given the large service coverage of the healthcare system, retrospective data are available for all those who enrolled in the program.
Diabetology 05 00009 g002
Table 1. Characteristics of final participants and dropouts.
CharacteristicParticipants (N = 28)Dropouts (N = 18)
Age
    Average5344
    Median5445
    Maximum6665
Female (%)7150
Race/Ethnicity (%)
    White3933
    Black3950
    Other1811
Religion (%)
    Muslim3628
    Christian/Catholic2956
    Other140
    None or No response1417
Language Written (%)
    English5472
    Somali3622
    Other70
    No Response46
Marital Status (%)
    Non-Married5456
Current Smoker (%)728
Unemployed (%)50-
Gift Card usage (average)8-
Source: Authors’ own calculations using merged data from clinical administrative, survey, and gift card usage data. Notes: Percentages do not sum up to 100 because of non-responses. Dropouts were patients who were eligible and dropped out of the program in the first two months of the implementation of the program.
Table 2. Laboratory and health measures among participants and dropouts.
Final ParticipantDropout
NBeforePrePostNBeforePrePost
Glucose levels
Glucose D28214201187 (*)16170177178
HbA1C (%)28 16
    Average 9.69.29.1 (**) 8.17.99.3 (**)
    >9% 715454 (**) 253144 (**)
    Experienced reduction 7161 2040
    Average change −0.2−0.1 0.20.3
Lipids Measures (mg/dL)
    Cholesterol1815316216112192162140
    LDL1885908812978673
    VLDL1830323212383229
    HDL1838404112403837
    Triglycerides18154159160
BMI2836.1335.9336.641833.5833.7332.95
Blood Pressure(mmHg)
    Diastolic2872727218787778
    Systolic2812011912018123121127
Source: Authors’ own calculations using merged data from clinical administrative data. Notes: Level reduction compares the proportion of individuals showing hemoglobin reductions comparing the period versus the post period. Average reduction is the average of the proportion reduction at the individual level. * p < 0.10 and ** p < 0.05 when comparing Before and Post.
Table 3. Healthcare usage and costs Before and During the program among participants.
BeforeDuringTest
HEALTHCARE USAGE
Hospital Encounters
Number of
    ER visits 3428
    Outpatient visits6868
    Inpatient visits65
Average
    ER Visit per participant1.211.00**
    ER Visit per ER user2.482.15*
Outpatient visit per participant2.432.43
    Outpatient visit per user3.574*
Office Visits
Number of
      Short visits (30 or less minutes)271468
      Long visits (30+ minutes)7551
Average
    Short visits per user8.9616.6***
    Long visits per participant2.681.82
    Long visits per user32.55
Medical COSTS
  Health Insurance Claims
    Number of Claims198141
    Claims (USD thousand)597.24355.62
         Average Claims (USD thousand)3.022.55
    ER-related Claims (USD thousand)64.7748.73*
         Average per user (USD thousand)4.983.75
    Outpatient-related Claims (USD thousand)67.3360.28
         Average per user (USD thousand)4.214.02
Source: Authors’ calculations using clinical administrative data and insurance claims data. Note: Per user average computes the average per patient who has used the service in the particular period. Per patient average compute the average based on all 28 participants. Statistically significance levels *** p < 0.01, ** p < 0.05, and * p < 0.10.
Table 4. Survey instruments’ results Pre and Post program.
PrePostTest
(N = 27)(N = 27)
Food Security
Food did not last (Often/Sometimes)8563
Cannot afford balanced food (Often/Sometimes)8563
Cut size/skipped meals b/c no money (Yes)5215**
Eat least than should b/c no money (Yes)5919
Hungry but didn’t eat b/c no money (Yes)447***
Overall Diet, Self-care and Medication Adherence
Vegetables and veggie stew (at least once per week)3381
Ran out of disease-appropriate food b/c of money (Never)2659
Put off buying food b/c buying medicine (Never)6796***
Put off buying medicine b/c buying food (Never)6393**
Patient Satisfaction
Overall Doctor Visits (average)4.34.4
Nutritionist referral (Yes)7493***
Educational program responds to cultural needs (average)2.13.4**
Overall rating educational activities (average)2.64.1***
Source: Authors’ calculations and pre-post surveys administered at the beginning and at the end of the program. Note: Each measure shows in parenthesis the category or unit of the response. Rating measures were shown in averages, while the other categories show the proportion of people who responded the way the category identifies. Statistically significance levels *** p < 0.01, ** p < 0.05.
Disclaimer/Publisher’s Note: The statements, opinions and data contained in all publications are solely those of the individual author(s) and contributor(s) and not of MDPI and/or the editor(s). MDPI and/or the editor(s) disclaim responsibility for any injury to people or property resulting from any ideas, methods, instructions or products referred to in the content.

