Nitrogen-Doped Titanium Dioxide Nanoparticles Modified by an Electron Beam for Improving Human Breast Cancer Detection by Raman Spectroscopy: A Preliminary Study


Abstract
:
1. Introduction
2. Materials and Methods
2.1. Chemical and Sample Preparation
2.2. Raman Measurements
2.3. UV-Vis Absorption Measurements
3. Results
4. Discussion
5. Conclusions
Funding
Acknowledgments
Conflicts of Interest
References
- Radhakrishna:, S.; Agarwal, S.; Parikh, P.M.; Kaur, K.; Panwar, S.; Sharma, S.; Dey, A.; Saxena, K.K.; Chandra, M.; Sud, S. Role of magnetic resonance imaging in breast cancer management. South Asian J. Cancer 2018, 7, 69–71. [Google Scholar] [CrossRef]
- Su, K.-Y.; Lee, W.-L. Fourier Transform Infrared Spectroscopy as a Cancer Screening and Diagnostic Tool: A Review and Prospects. Cancers 2020, 12, 115. [Google Scholar] [CrossRef] [Green Version]
- Backhaus, J.; Mueller, R.; Formanski, N.; Szlama, N.; Meerpohl, H.-G.; Eidt, M.; Bugert, P. Diagnosis of breast cancer with infrared spectroscopy from serum samples. Vib. Spectrosc. 2010, 52, 173–177. [Google Scholar] [CrossRef]
- Elmi, F.; Movaghar, A.F.; Elmi, M.M.; Alinezhad, H.; Nikbakhsh, N. Application of FT-IR spectroscopy on breast cancer serum analysis. Spectrochim. Acta Part A Mol. Biomol. Spectrosc. 2017, 187, 87–91. [Google Scholar] [CrossRef] [PubMed]
- Lyng, F.M.; Traynor, D.; Nguyen, T.N.Q.; Meade, A.D.; Rakib, F.; Al-Saady, R.; Goormaghtigh, E.; Al-Saad, K.; Ali, M.H. Discrimination of breast cancer from benign tumours using Raman spectroscopy. PLoS ONE 2019, 14, e0212376. [Google Scholar] [CrossRef]
- Sabtu, S.N.; Sani, S.F.A.; Bradley, D.A.; Looi, L.M.; Osman, Z. A review of the applications of Raman spectroscopy for breast cancer tissue diagnostic and their histopathological classification of epithelial to mesenchymal transition. J. Raman Spectrosc. 2020, 51, 380–389. [Google Scholar] [CrossRef]
- Haka, A.S.; Shafer-Peltier, K.E.; Fitzmaurice, M.; Crowe, J.; Dasari, R.R.; Feld, M.S. Diagnosing breast cancer by using Raman spectroscopy. Proc. Natl. Acad. Sci. USA 2005, 102, 12371–12376. [Google Scholar] [CrossRef] [PubMed] [Green Version]
- Haka, A.S.; Volynskaya, Z.; Gardecki, J.A.; Nazemi, J.; Shenk, R.; Wang, N.; Dasari, R.R.; Fitzmaurice, M.; Feld, M.S. Diagnosing breast cancer using Raman spectroscopy: Prospective analysis. J. Biomed. Opt. 2009, 14, 054023. [Google Scholar] [CrossRef] [PubMed] [Green Version]
- Lazaro-Pacheco, D.; Shaaban, A.M.; Rehman, S.; Rehman, I. Raman spectroscopy of breast cancer. Appl. Spectrosc. Rev. 2020, 55, 439–475. [Google Scholar] [CrossRef]
- Abramczyk, H.; Surmacki, J.; Kopeć, M.; Olejnik, A.K.; Kaufman-Szymczyk, A.; Fabianowska-Majewska, K. Epigenetic changes in cancer by Raman imaging, fluorescence imaging, AFM and scanning near-field optical microscopy (SNOM). Acetylation in normal and human cancer breast cells MCF10A, MCF7 and MDA-MB-231. Analyst 2016, 141, 5646–5658. [Google Scholar] [CrossRef]
- Abramczyk, H.; Brozek-Pluska, B.; Surmacki, J.; Jablonska-Gajewicz, J.; Kordek, R. Raman “optical biopsy” of human breast cancer. Prog. Biophys. Mol. Biol. 2012, 108, 74–81. [Google Scholar] [CrossRef] [PubMed]
- Surmacki, J.; Musial, J.; Kordek, R.; Abramczyk, H. Raman imaging at biological interfaces: Applications in breast cancer diagnosis. Mol. Cancer 2013, 12, 48. [Google Scholar] [CrossRef] [Green Version]
- Abramczyk, H.; Imiela, A.; Brożek-Płuska, B.; Kopeć, M.; Surmacki, J.; Śliwińska, A. Aberrant Protein Phosphorylation in Cancer by Using Raman Biomarkers. Cancers 2019, 11, 2017. [Google Scholar] [CrossRef] [PubMed] [Green Version]
- Matousek, P.; Stone, N. Prospects for the diagnosis of breast cancer by noninvasive probing of calcifications using transmission Raman spectroscopy. J. Biomed. Opt. 2007, 12, 024008. [Google Scholar] [CrossRef] [PubMed]
- Gao, P.; Han, B.; Du, Y.; Zhao, G.; Yu, Z.; Xu, W.; Zheng, C.; Fan, Z. The Clinical Application of Raman Spectroscopy for Breast Cancer Detection. Available online: https://www.hindawi.com/journals/jspec/2017/5383948/ (accessed on 3 August 2020).
- Demirel, G.; Usta, H.; Yilmaz, M.; Celik, M.; Alidagi, H.A.; Buyukserin, F. Surface-enhanced Raman spectroscopy (SERS): An adventure from plasmonic metals to organic semiconductors as SERS platforms. J. Mater. Chem. C 2018, 6, 5314–5335. [Google Scholar] [CrossRef]
- Kim, J.; Jang, Y.; Kim, N.-J.; Kim, H.; Yi, G.-C.; Shin, Y.; Kim, M.H.; Yoon, S. Study of Chemical Enhancement Mechanism in Non-plasmonic Surface Enhanced Raman Spectroscopy (SERS). Front. Chem. 2019, 7, 582. [Google Scholar] [CrossRef] [Green Version]
- Pilot, R.; Signorini, R.; Durante, C.; Orian, L.; Bhamidipati, M.; Fabris, L. A Review on Surface-Enhanced Raman Scattering. Biosensors 2019, 9, 57. [Google Scholar] [CrossRef] [Green Version]
- Halvorson, R.A.; Vikesland, P.J. Surface-Enhanced Raman Spectroscopy (SERS) for Environmental Analyses. Environ. Sci. Technol. 2010, 44, 7749–7755. [Google Scholar] [CrossRef]
- McNay, G.; Eustace, D.; Smith, W.E.; Faulds, K.; Graham, D. Surface-Enhanced Raman Scattering (SERS) and Surface-Enhanced Resonance Raman Scattering (SERRS): A Review of Applications. Appl. Spectrosc. 2011, 65, 825–837. [Google Scholar] [CrossRef]
- Brozek-Pluska, B.; Kopec, M.; Surmacki, J. Surface-Enhanced Raman Spectroscopy Analysis of Human Breast Cancer via Silver Nanoparticles: An Examination of Fabrication Methods. Available online: https://www.hindawi.com/journals/jspec/2018/4893274/ (accessed on 3 August 2020).
- Asher, S.A. UV Resonance Raman Spectroscopy for Analytical, Physical, and Biophysical Chemistry. Anal. Chem. 1993, 65, 59A–66A. [Google Scholar] [CrossRef]
- Surmacki, J.; Wroński, P.; Szadkowska-Nicze, M.; Abramczyk, H. Raman spectroscopy of visible-light photocatalyst–Nitrogen-doped titanium dioxide generated by irradiation with electron beam. Chem. Phys. Lett. 2013, 566, 54–59. [Google Scholar] [CrossRef]
- Ur Rehman, I.; Movasaghi, Z.; Rehman, S. Vibrational Spectroscopy for Tissue Analysis; CRC Press: Boca Raton, FL, USA, 2013; ISBN 9781439836088. [Google Scholar]
- De Gelder, J.; De Gussem, K.; Vandenabeele, P.; Moens, L. Reference database of Raman spectra of biological molecules. J. Raman Spectrosc. 2007, 38, 1133–1147. [Google Scholar] [CrossRef]
- Surmacki, J.M.; Woodhams, B.J.; Haslehurst, A.; Ponder, B.A.J.; Bohndiek, S.E. Raman micro-spectroscopy for accurate identification of primary human bronchial epithelial cells. Sci. Rep. 2018, 8, 12604. [Google Scholar] [CrossRef]
- Yamada, Y.; Kanemitsu, Y. Determination of electron and hole lifetimes of rutile and anatase TiO2 single crystals. Appl. Phys. Lett. 2012, 101, 133907. [Google Scholar] [CrossRef] [Green Version]
- Gao, F.G.; Bard, A.J.; Kispert, L.D. Photocurrent generated on a carotenoid-sensitized TiO2 nanocrystalline mesoporous electrode. J. Photochem. Photobiol. A Chem. 2000, 130, 49–56. [Google Scholar] [CrossRef]
- Polyakov, N.E.; Leshina, T.V.; Meteleva, E.S.; Dushkin, A.V.; Konovalova, T.A.; Kispert, L.D. Enhancement of the photocatalytic activity of TiO2 nanoparticles by water-soluble complexes of carotenoids. J. Phys. Chem. B 2010, 114, 14200–14204. [Google Scholar] [CrossRef]
- Aswini, R.; Murugesan, S.; Kannan, K. Bio-engineered TiO2 nanoparticles using Ledebouria revoluta extract: Larvicidal, histopathological, antibacterial and anticancer activity. Int. J. Environ. Anal. Chem. 2020, 1–11. [Google Scholar] [CrossRef]
- Fu, L.; Hamzeh, M.; Dodard, S.; Zhao, Y.H.; Sunahara, G.I. Effects of TiO2 nanoparticles on ROS production and growth inhibition using freshwater green algae pre-exposed to UV irradiation. Environ. Toxicol. Pharm. 2015, 39, 1074–1080. [Google Scholar] [CrossRef] [PubMed]
- Fujiwara, R.; Luo, Y.; Sasaki, T.; Fujii, K.; Ohmori, H.; Kuniyasu, H. Cancer Therapeutic Effects of Titanium Dioxide Nanoparticles Are Associated with Oxidative Stress and Cytokine Induction. Pathobiology 2015, 82, 243–251. [Google Scholar] [CrossRef]


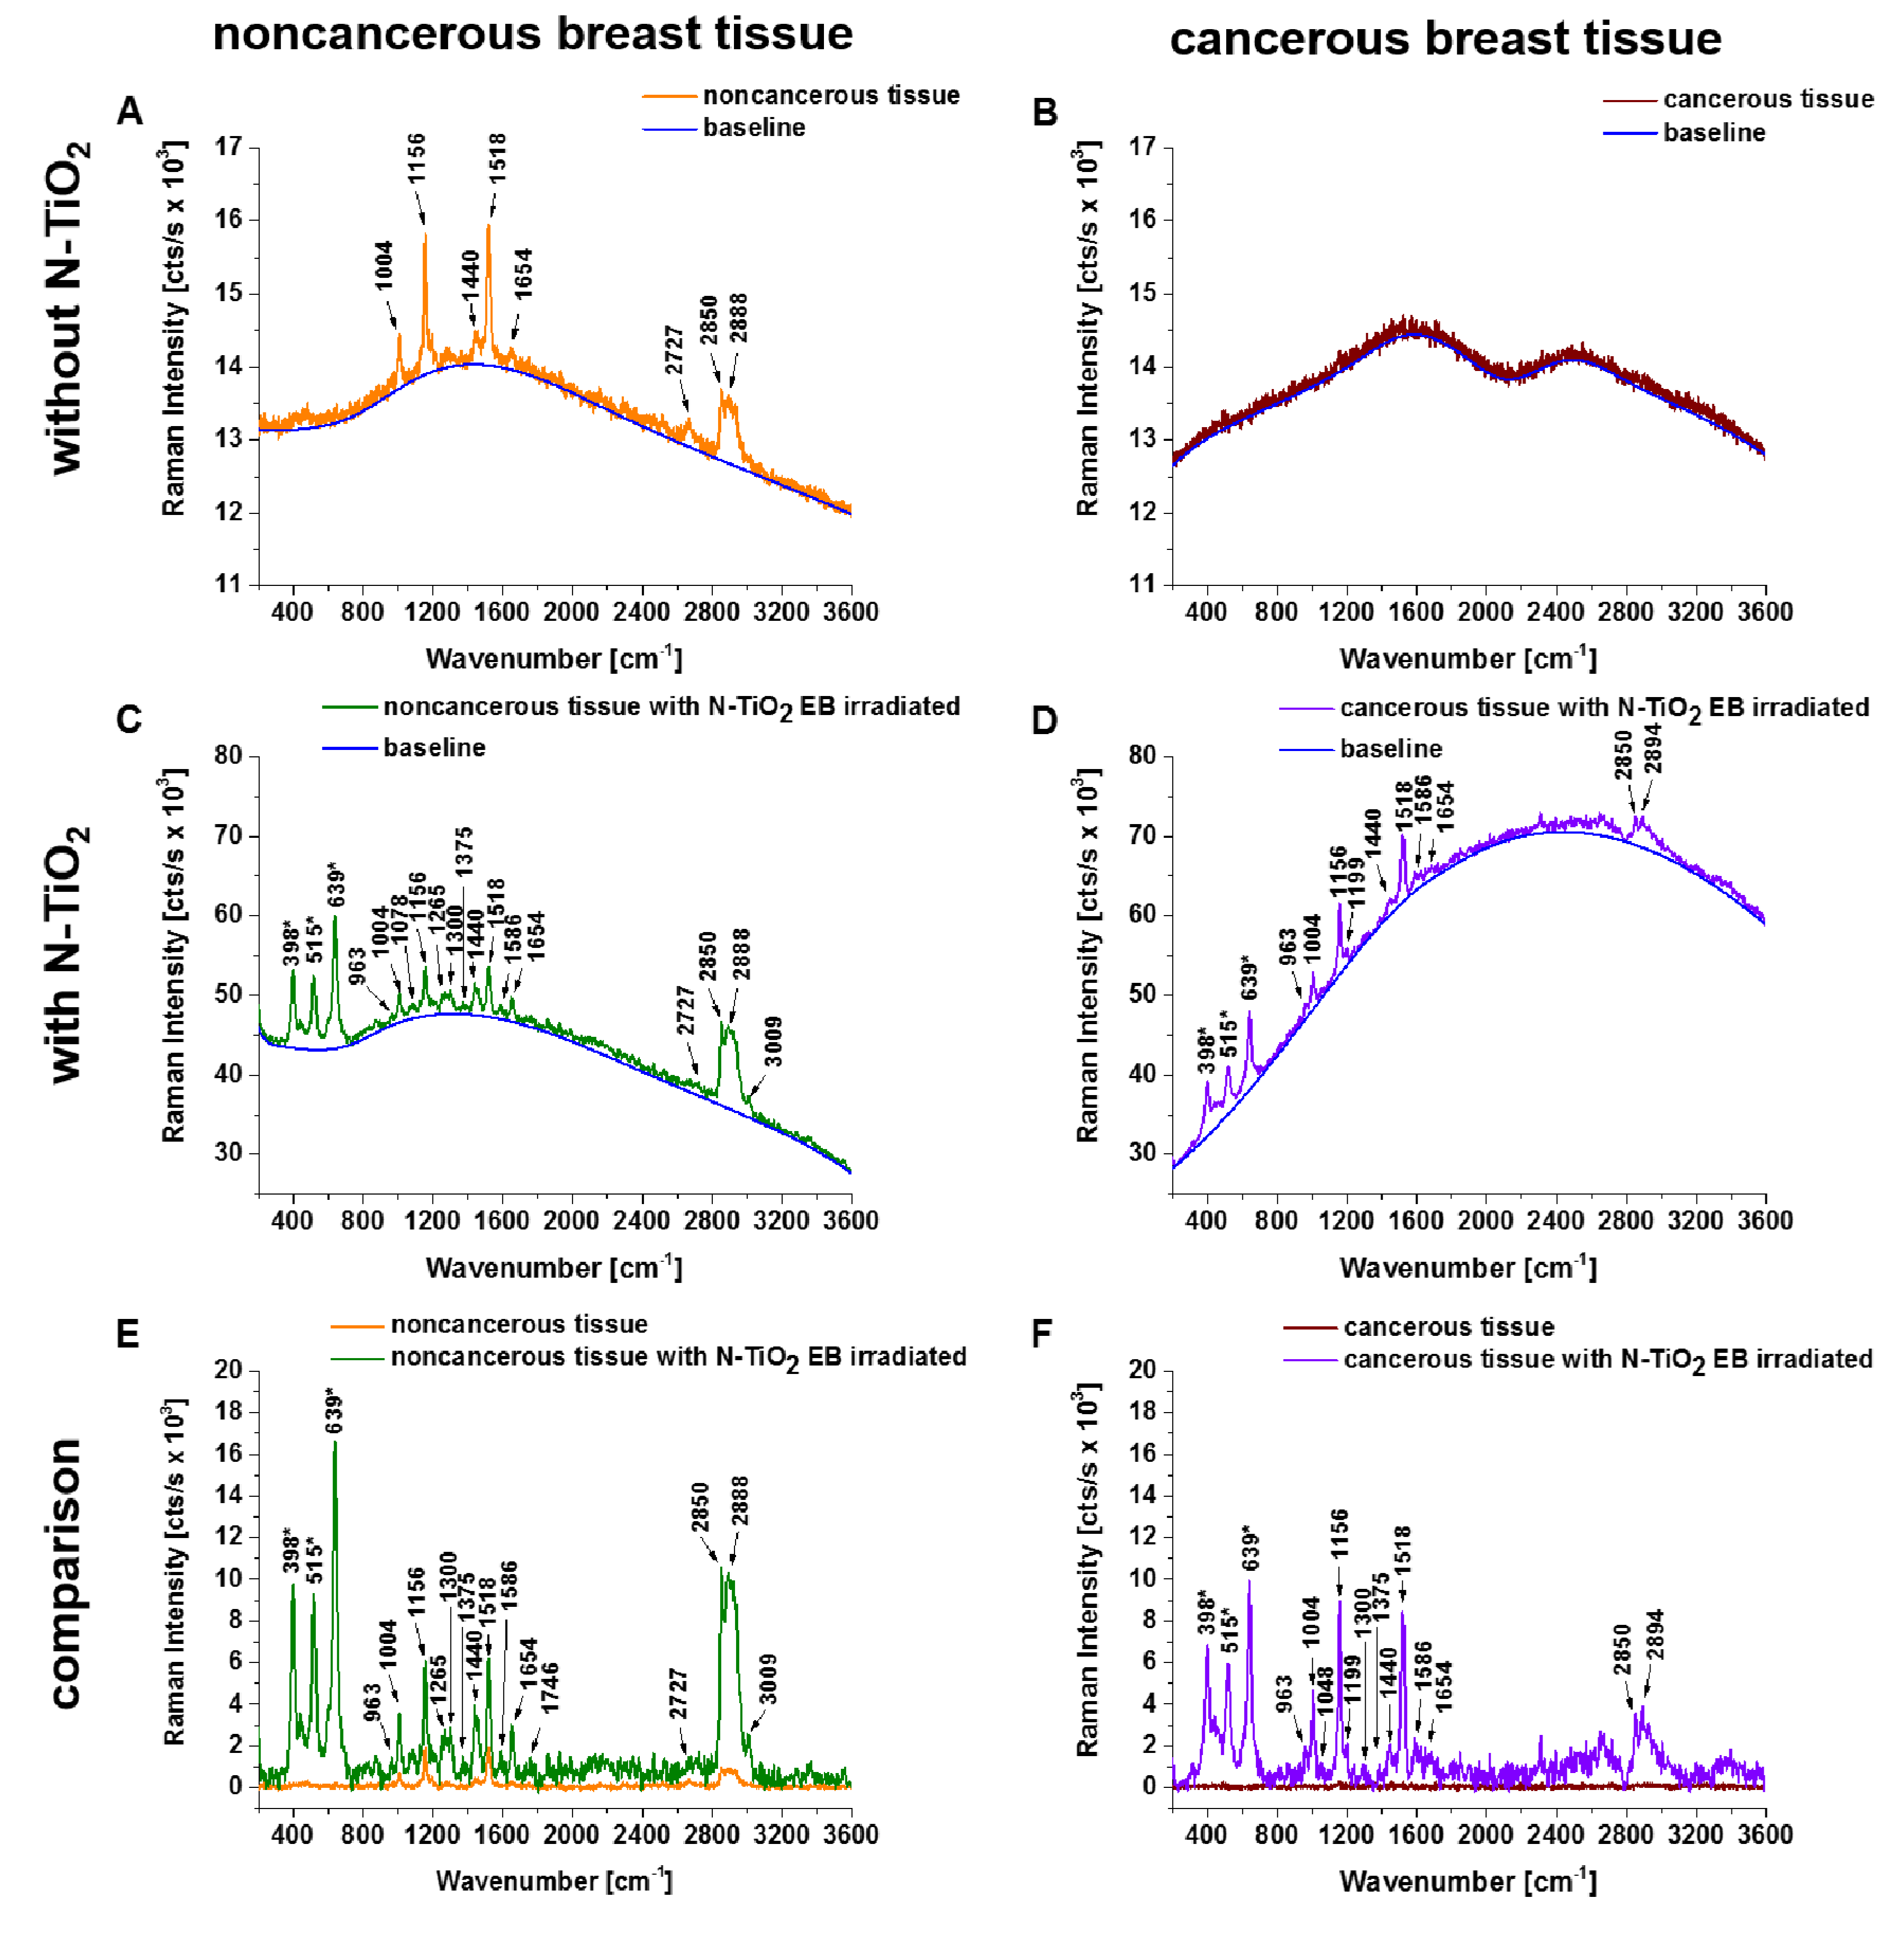
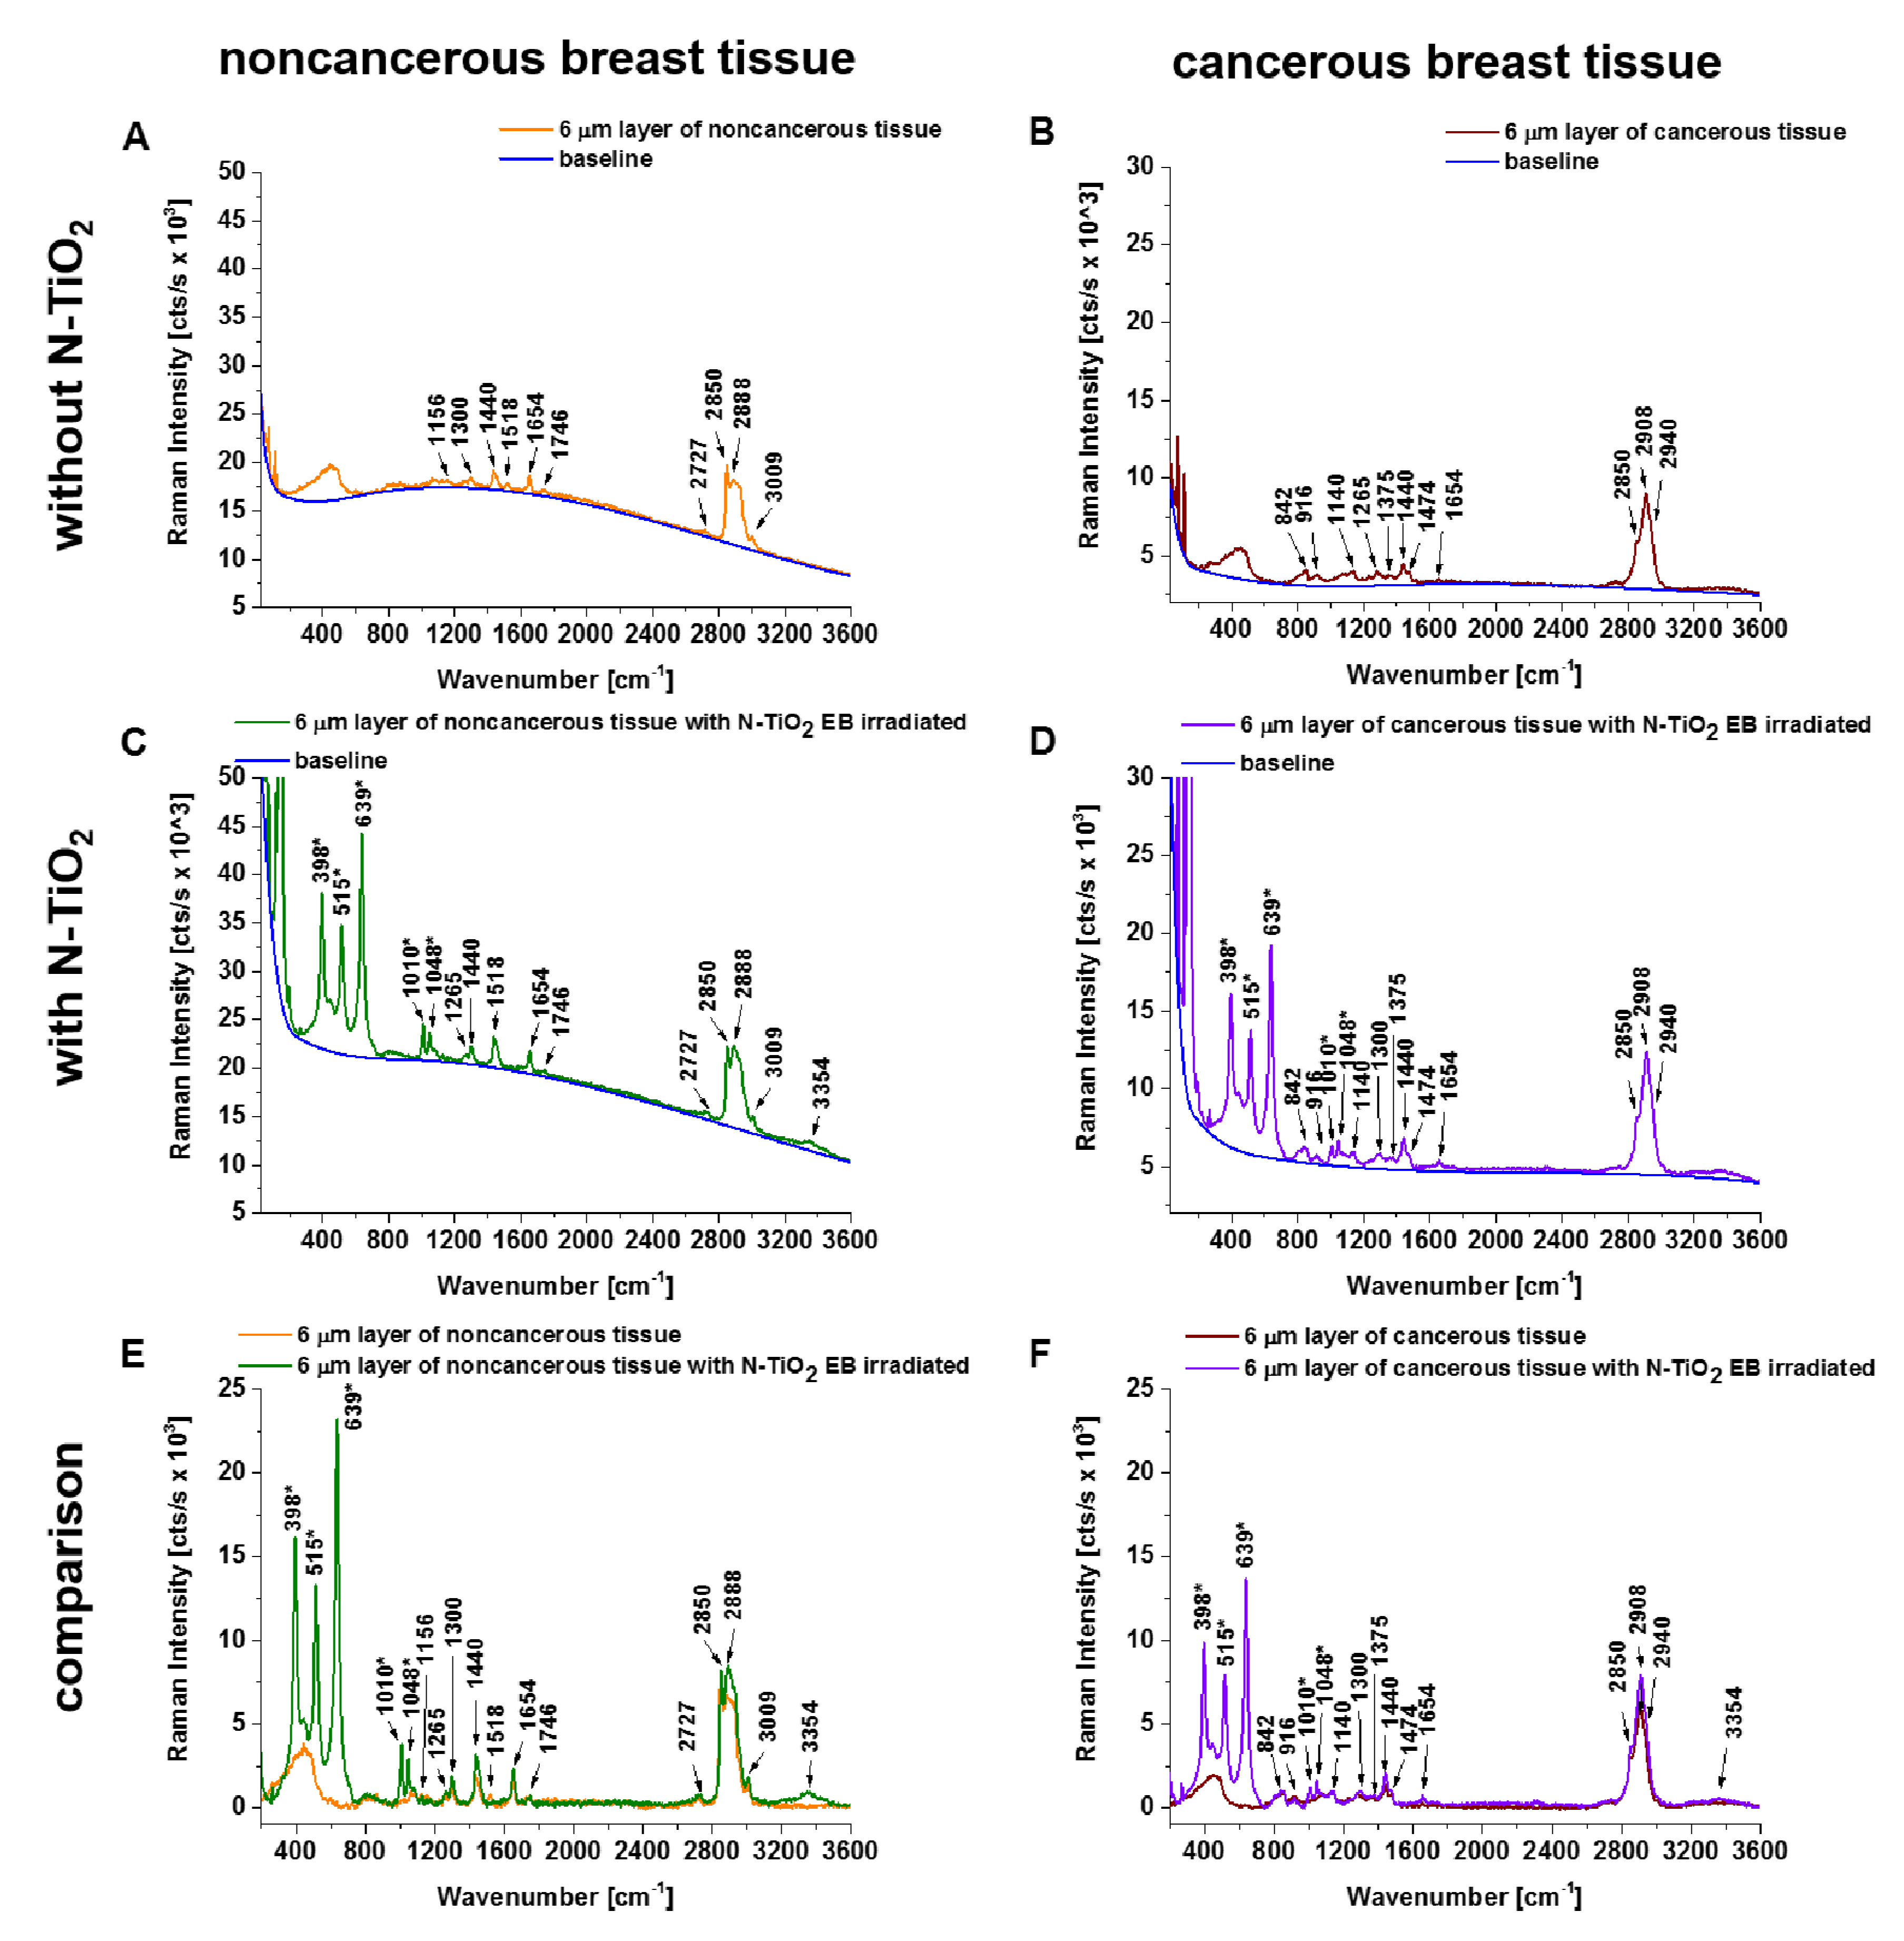
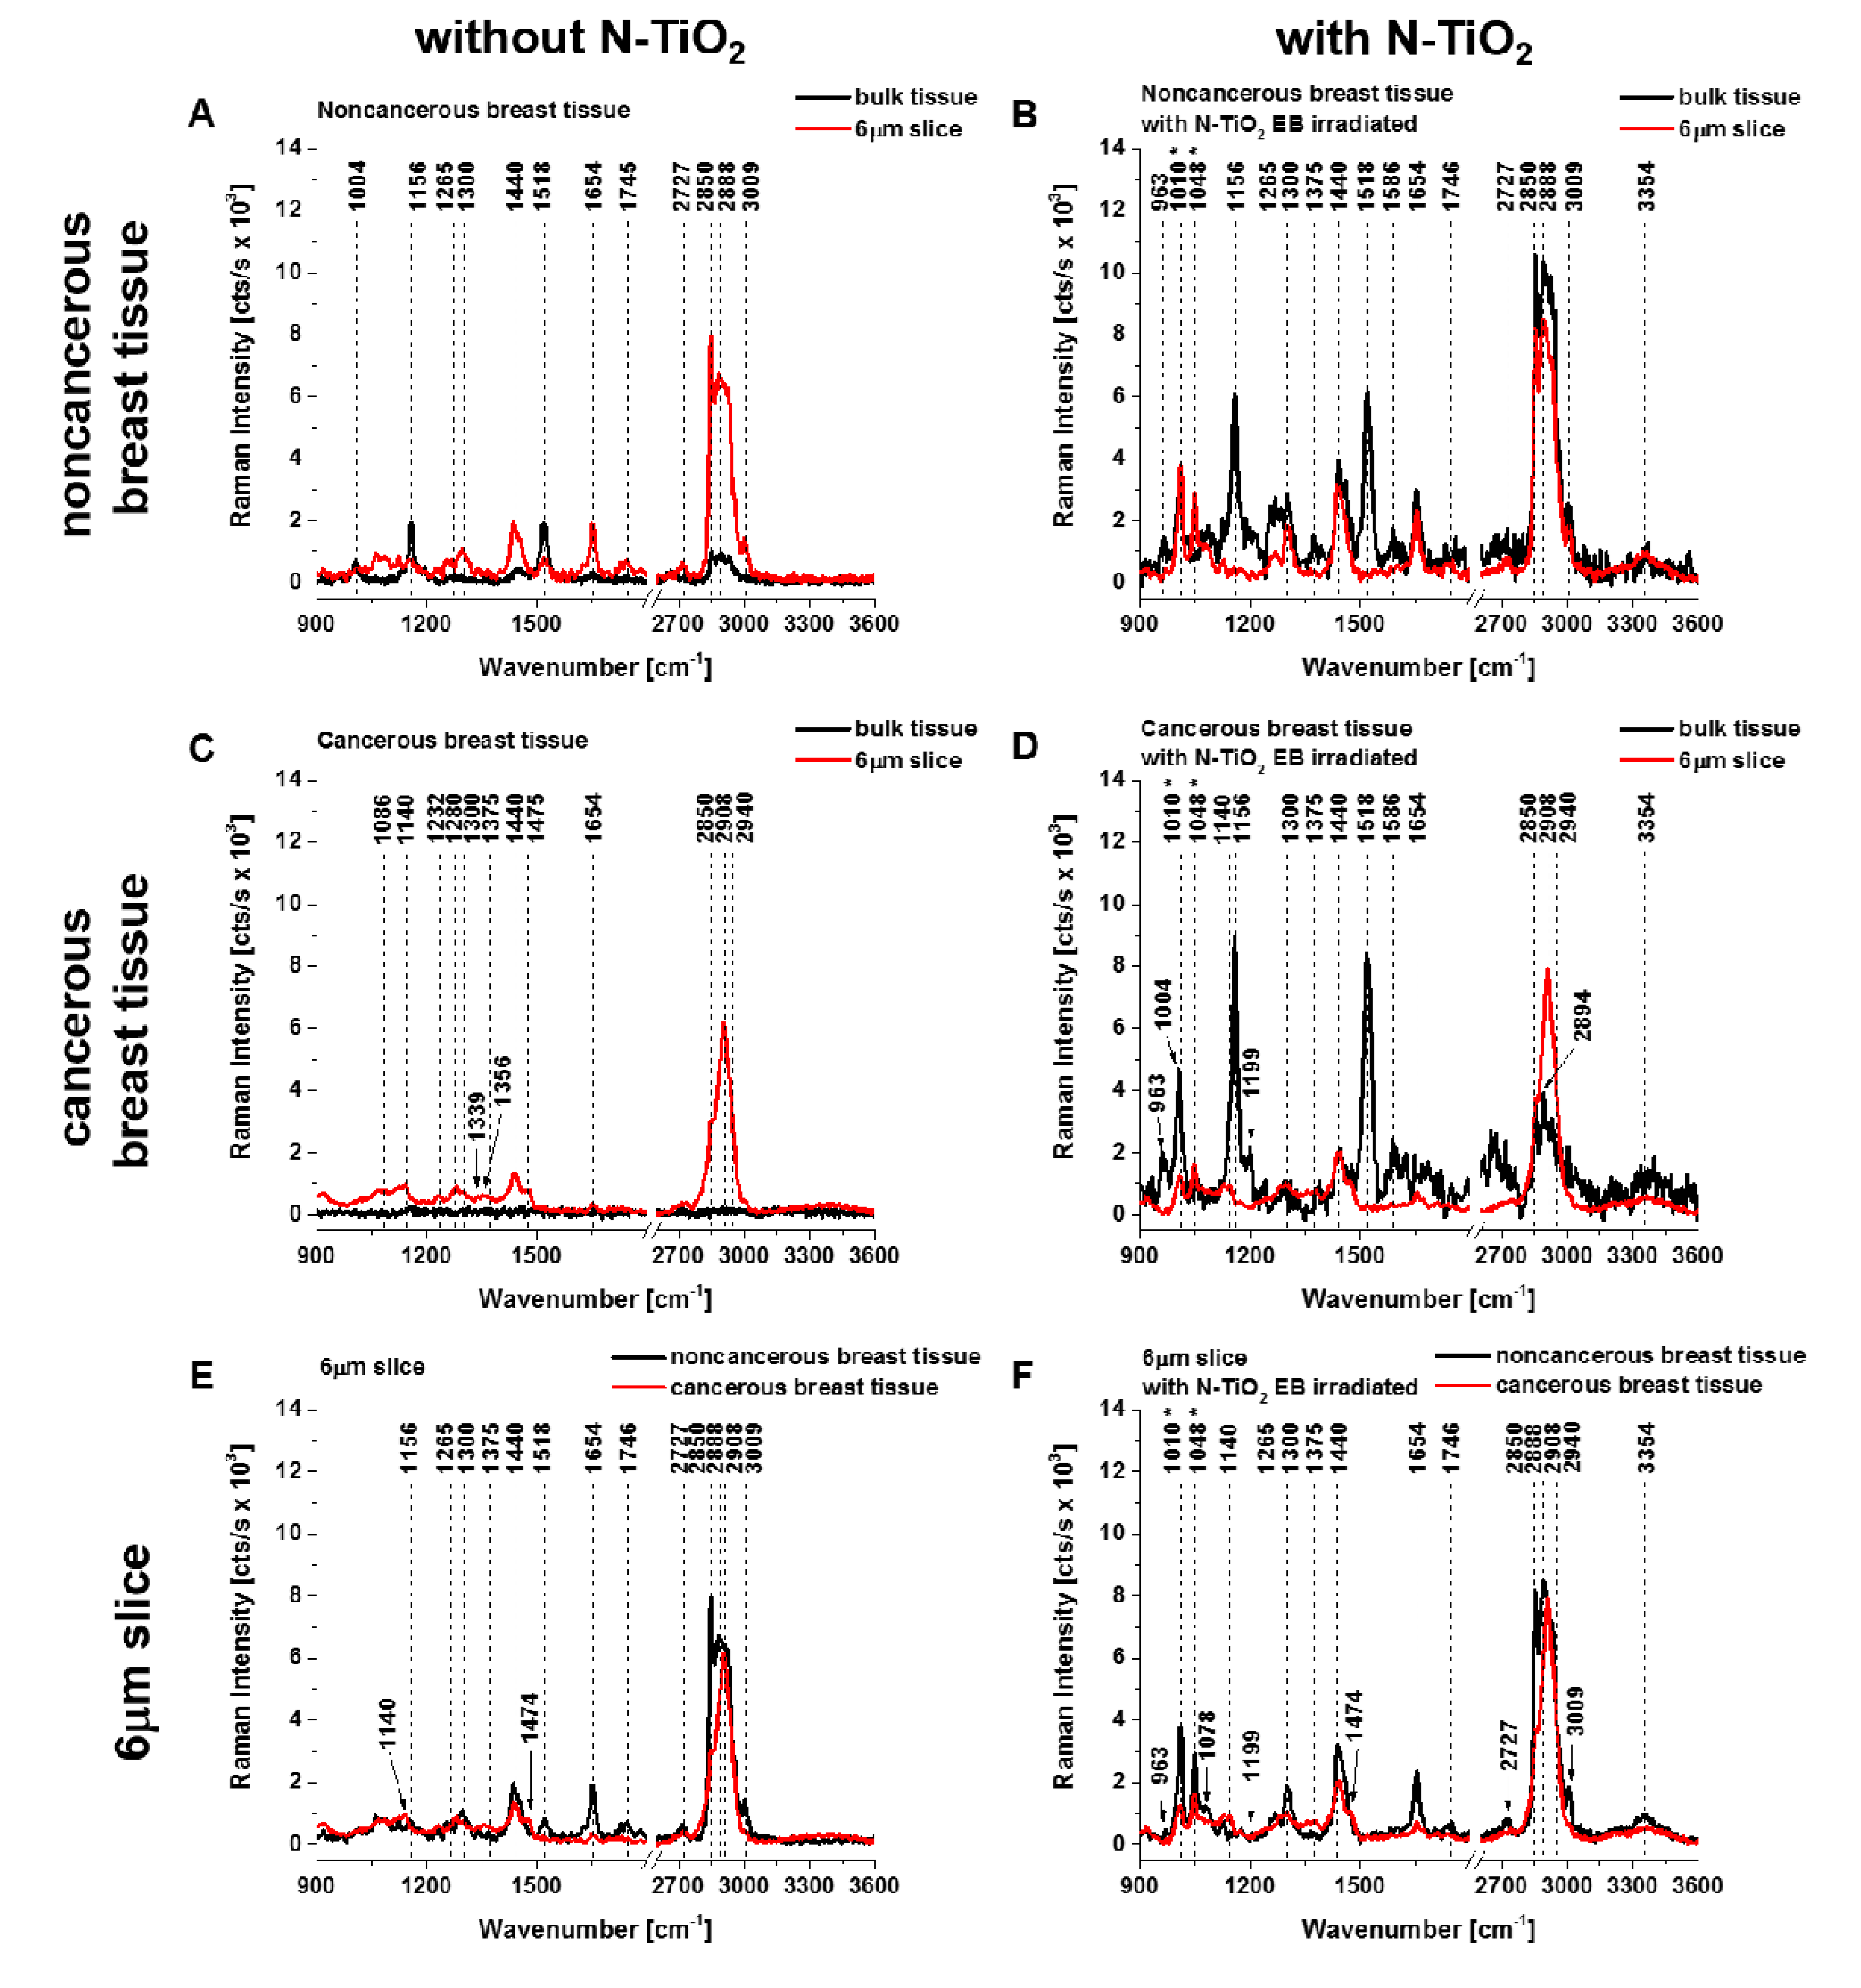
| Frequency (cm−1) | Assignment | Noncancerous Tissue | Cancerous Tissue | ||||||
|---|---|---|---|---|---|---|---|---|---|
| Bulk Tissue | 6 µm Slice | Bulk Tissue | 6 µm Slice | ||||||
| w/o | with NPs | w/o | with NPs | w/o | with NPs | w/o | with NPs | ||
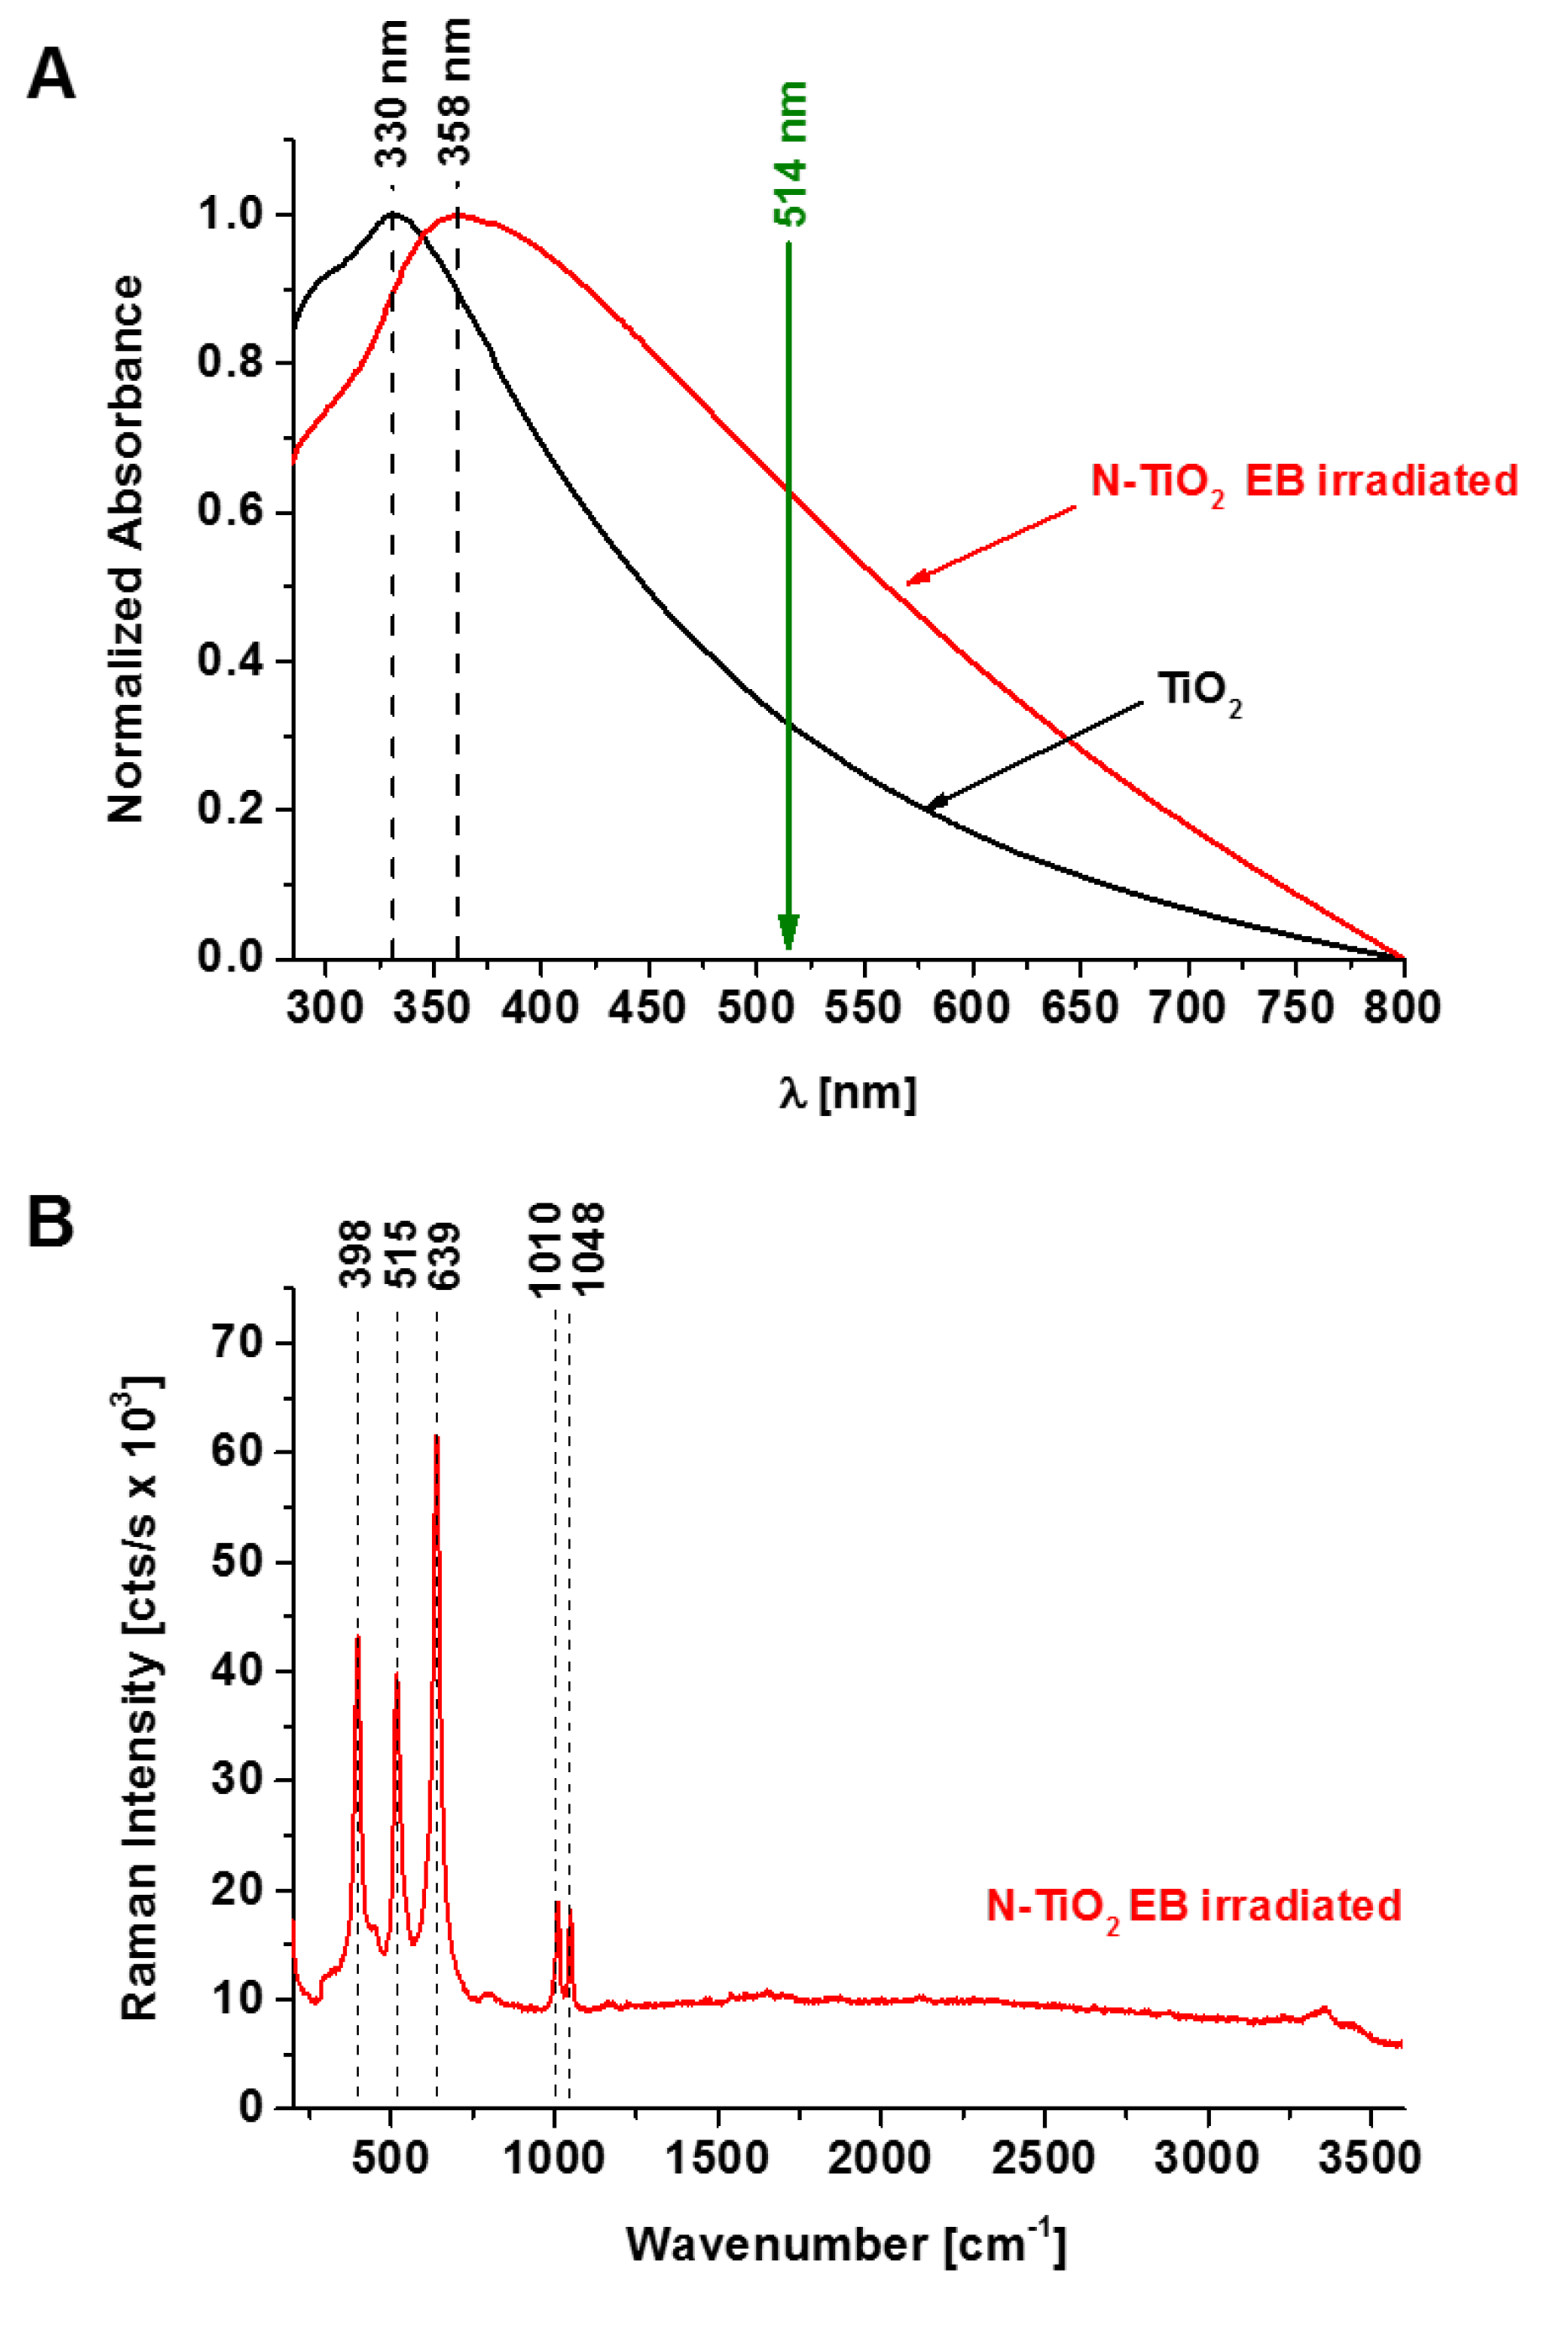
| 398 | N-TiO2 EB | - | + | - | + | - | + | - | + |
| 515 | N-TiO2 EB | - | + | - | + | - | + | - | + |
| 639 | N-TiO2 EB | - | + | - | + | - | + | - | + |
| 842 | Tryptophan, proteins | - | + | + | + | - | + | + | + |
| 916 | Proline, hydroxyproline, glycogen, lactic acid | - | - | + | + | - | + | + | + |
| 963 | C-O deoxyribose, C-C DNA | - | + | - | + | - | + | + | + |
| 1004 | Phenylalanine, proteins, and carotenoids, CH3 rocking coupled with C-C stretching | + | + | + | + | - | + | + | + |
| 1010 | N-TiO2 EB | - | + | - | + | - | + | - | + |
| 1048 | N-TiO2 EB | - | + | - | + | - | + | - | + |
| 1078 | Phospholipids, stretching (C-C) or stretching (C-O) | - | + | + | + | - | - | - | - |
| 1140 | Adenine (ring breathing modes of the DNA/RNA bases) | - | - | - | - | - | - | + | + |
| 1156 | Carotenoids, C-C stretching | + | + | + | - | - | + | - | - |
| 1199 | Nucleic acids and phosphates (P=O) | - | + | - | - | - | + | + | + |
| 1265 | Phospholipids, PO2− antisymmetric stretching, =C-H in plane deformation, Amide III (of proteins in -helix conformation) | + | + | + | + | - | + | - | - |
| 1300 | Lipids, phospholipids, H-C= deformation | - | + | + | + | - | + | + | + |
| 1375 | Proteins, C C-H bending mixed with C-N stretching and N-H in plane bending, adenine (ring breathing modes of the DNA/RNA bases) | - | + | - | - | - | + | - | + |
| 1440 | Lipids, CH2 and CH3 deformation vibrations | + | + | + | + | - | + | + | + |
| 1474 | DNA, ring breathing mode | - | + | - | + | - | + | + | + |
| 1518 | Carotenoids, C=C stretching | + | + | + | - | - | + | - | - |
| 1586 | Tryptophan, NADH, cytochrome C, C-C stretching, C-H bending | - | + | - | - | - | + | + | + |
| 1654 | Lipids and proteins (amide I), C=C stretching | + | + | + | + | - | + | + | + |
| 1746 | Lipids, C=O stretching | + | + | + | + | - | - | - | - |
| 2727 | Carotenoids, overtone | + | + | + | + | - | - | - | - |
| 2850 | Lipids, fatty acids, saturated bonds of lipids, symmetric stretching of CH2 | + | + | + | + | - | + | + | + |
| 2888 | Lipids, fatty acids, (CH2)C-H antisymmetric stretching | + | + | + | + | - | - | - | - |
| 2894, 2908 | Symmetric stretching of CH3 | - | - | - | - | - | + | + | + |
| 2940 | Proteins, asymmetric stretching of CH3, C-H stretching | - | - | - | - | - | - | + | + |
| 3009 | Fatty acids, unsaturated bonds of lipids, H -C=C stretching | + | + | + | + | - | - | - | - |
| 3354 | Water, DNA, proteins, O-N, O-H stretching | - | - | - | + | - | - | - | + |
© 2020 by the author. Licensee MDPI, Basel, Switzerland. This article is an open access article distributed under the terms and conditions of the Creative Commons Attribution (CC BY) license (http://creativecommons.org/licenses/by/4.0/).
Share and Cite
Surmacki, J. Nitrogen-Doped Titanium Dioxide Nanoparticles Modified by an Electron Beam for Improving Human Breast Cancer Detection by Raman Spectroscopy: A Preliminary Study. Diagnostics 2020, 10, 757. https://0-doi-org.brum.beds.ac.uk/10.3390/diagnostics10100757
Surmacki J. Nitrogen-Doped Titanium Dioxide Nanoparticles Modified by an Electron Beam for Improving Human Breast Cancer Detection by Raman Spectroscopy: A Preliminary Study. Diagnostics. 2020; 10(10):757. https://0-doi-org.brum.beds.ac.uk/10.3390/diagnostics10100757
Chicago/Turabian StyleSurmacki, Jakub. 2020. "Nitrogen-Doped Titanium Dioxide Nanoparticles Modified by an Electron Beam for Improving Human Breast Cancer Detection by Raman Spectroscopy: A Preliminary Study" Diagnostics 10, no. 10: 757. https://0-doi-org.brum.beds.ac.uk/10.3390/diagnostics10100757