
The Influence of Work Environment Factors on the Ocular Surface in a One-Year Follow-Up Prospective Clinical Study

 ,
,  and
and
Abstract
:1. Introduction
2. Materials and Methods
2.1. Study Population
2.2. Examinations
2.3. Statistical Analysis
3. Results
3.1. Participant Characteristics
3.2. Selected Parameters of the Eye Surface at Baseline on the First Day of the Examination
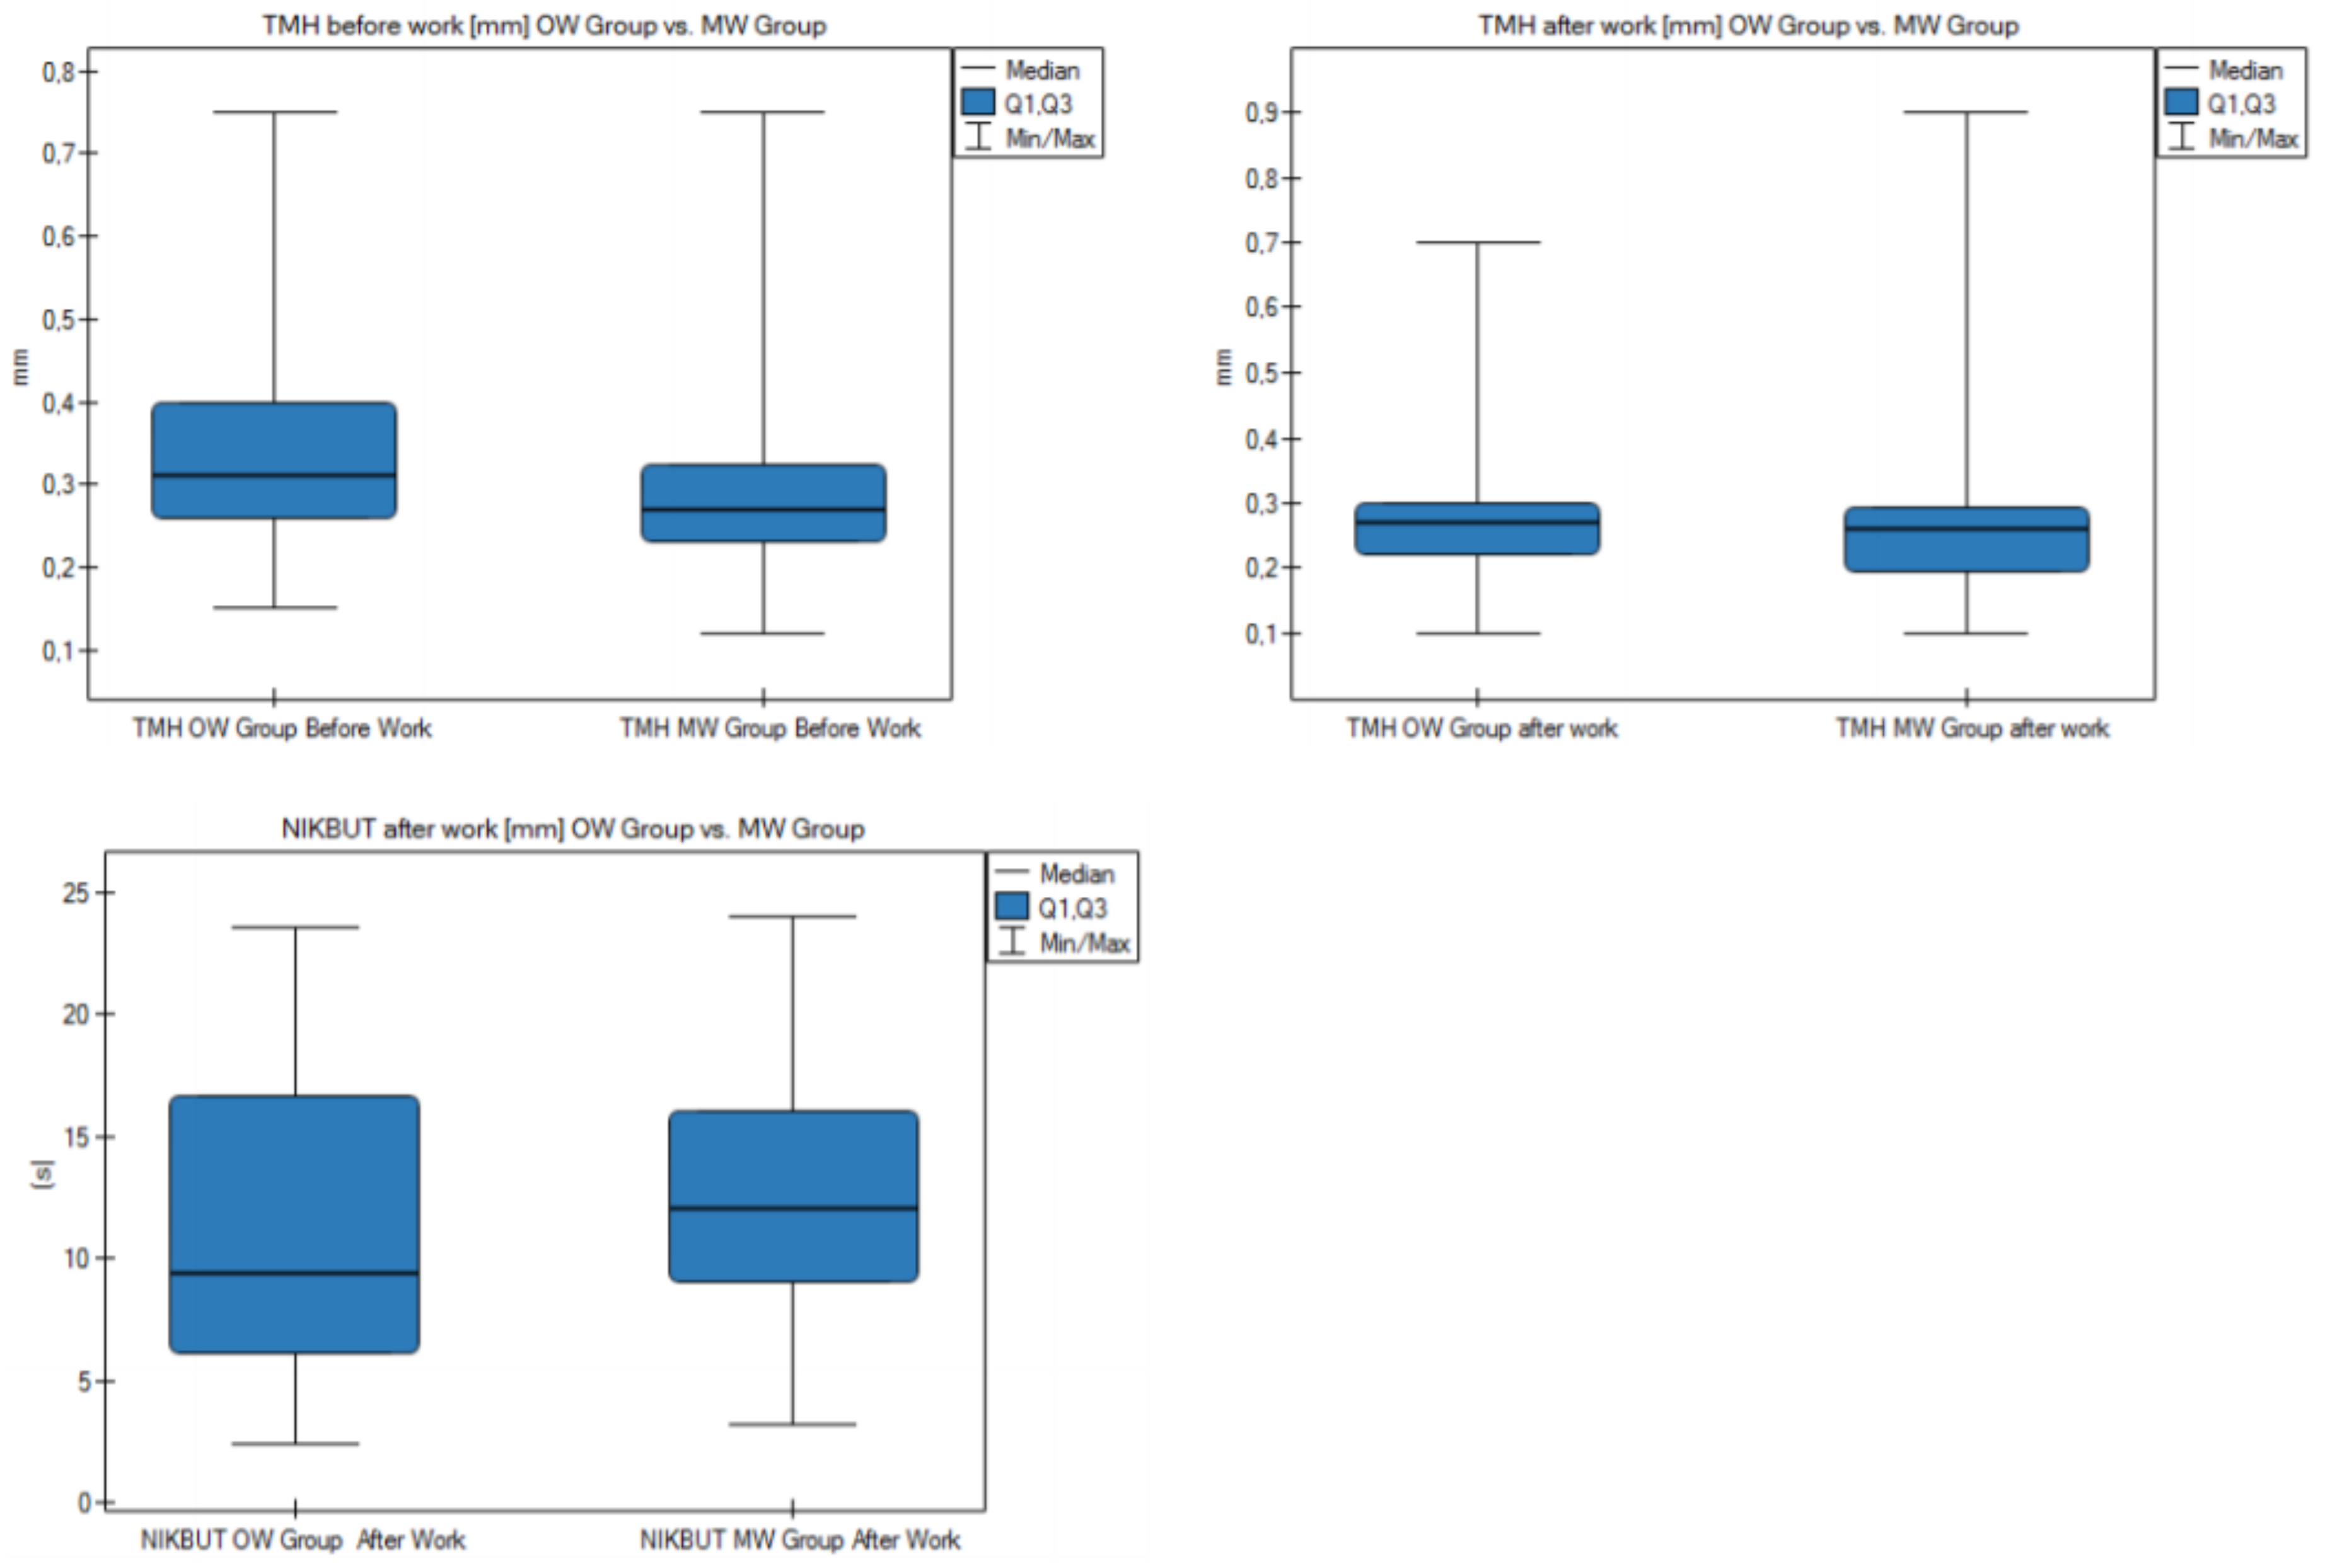
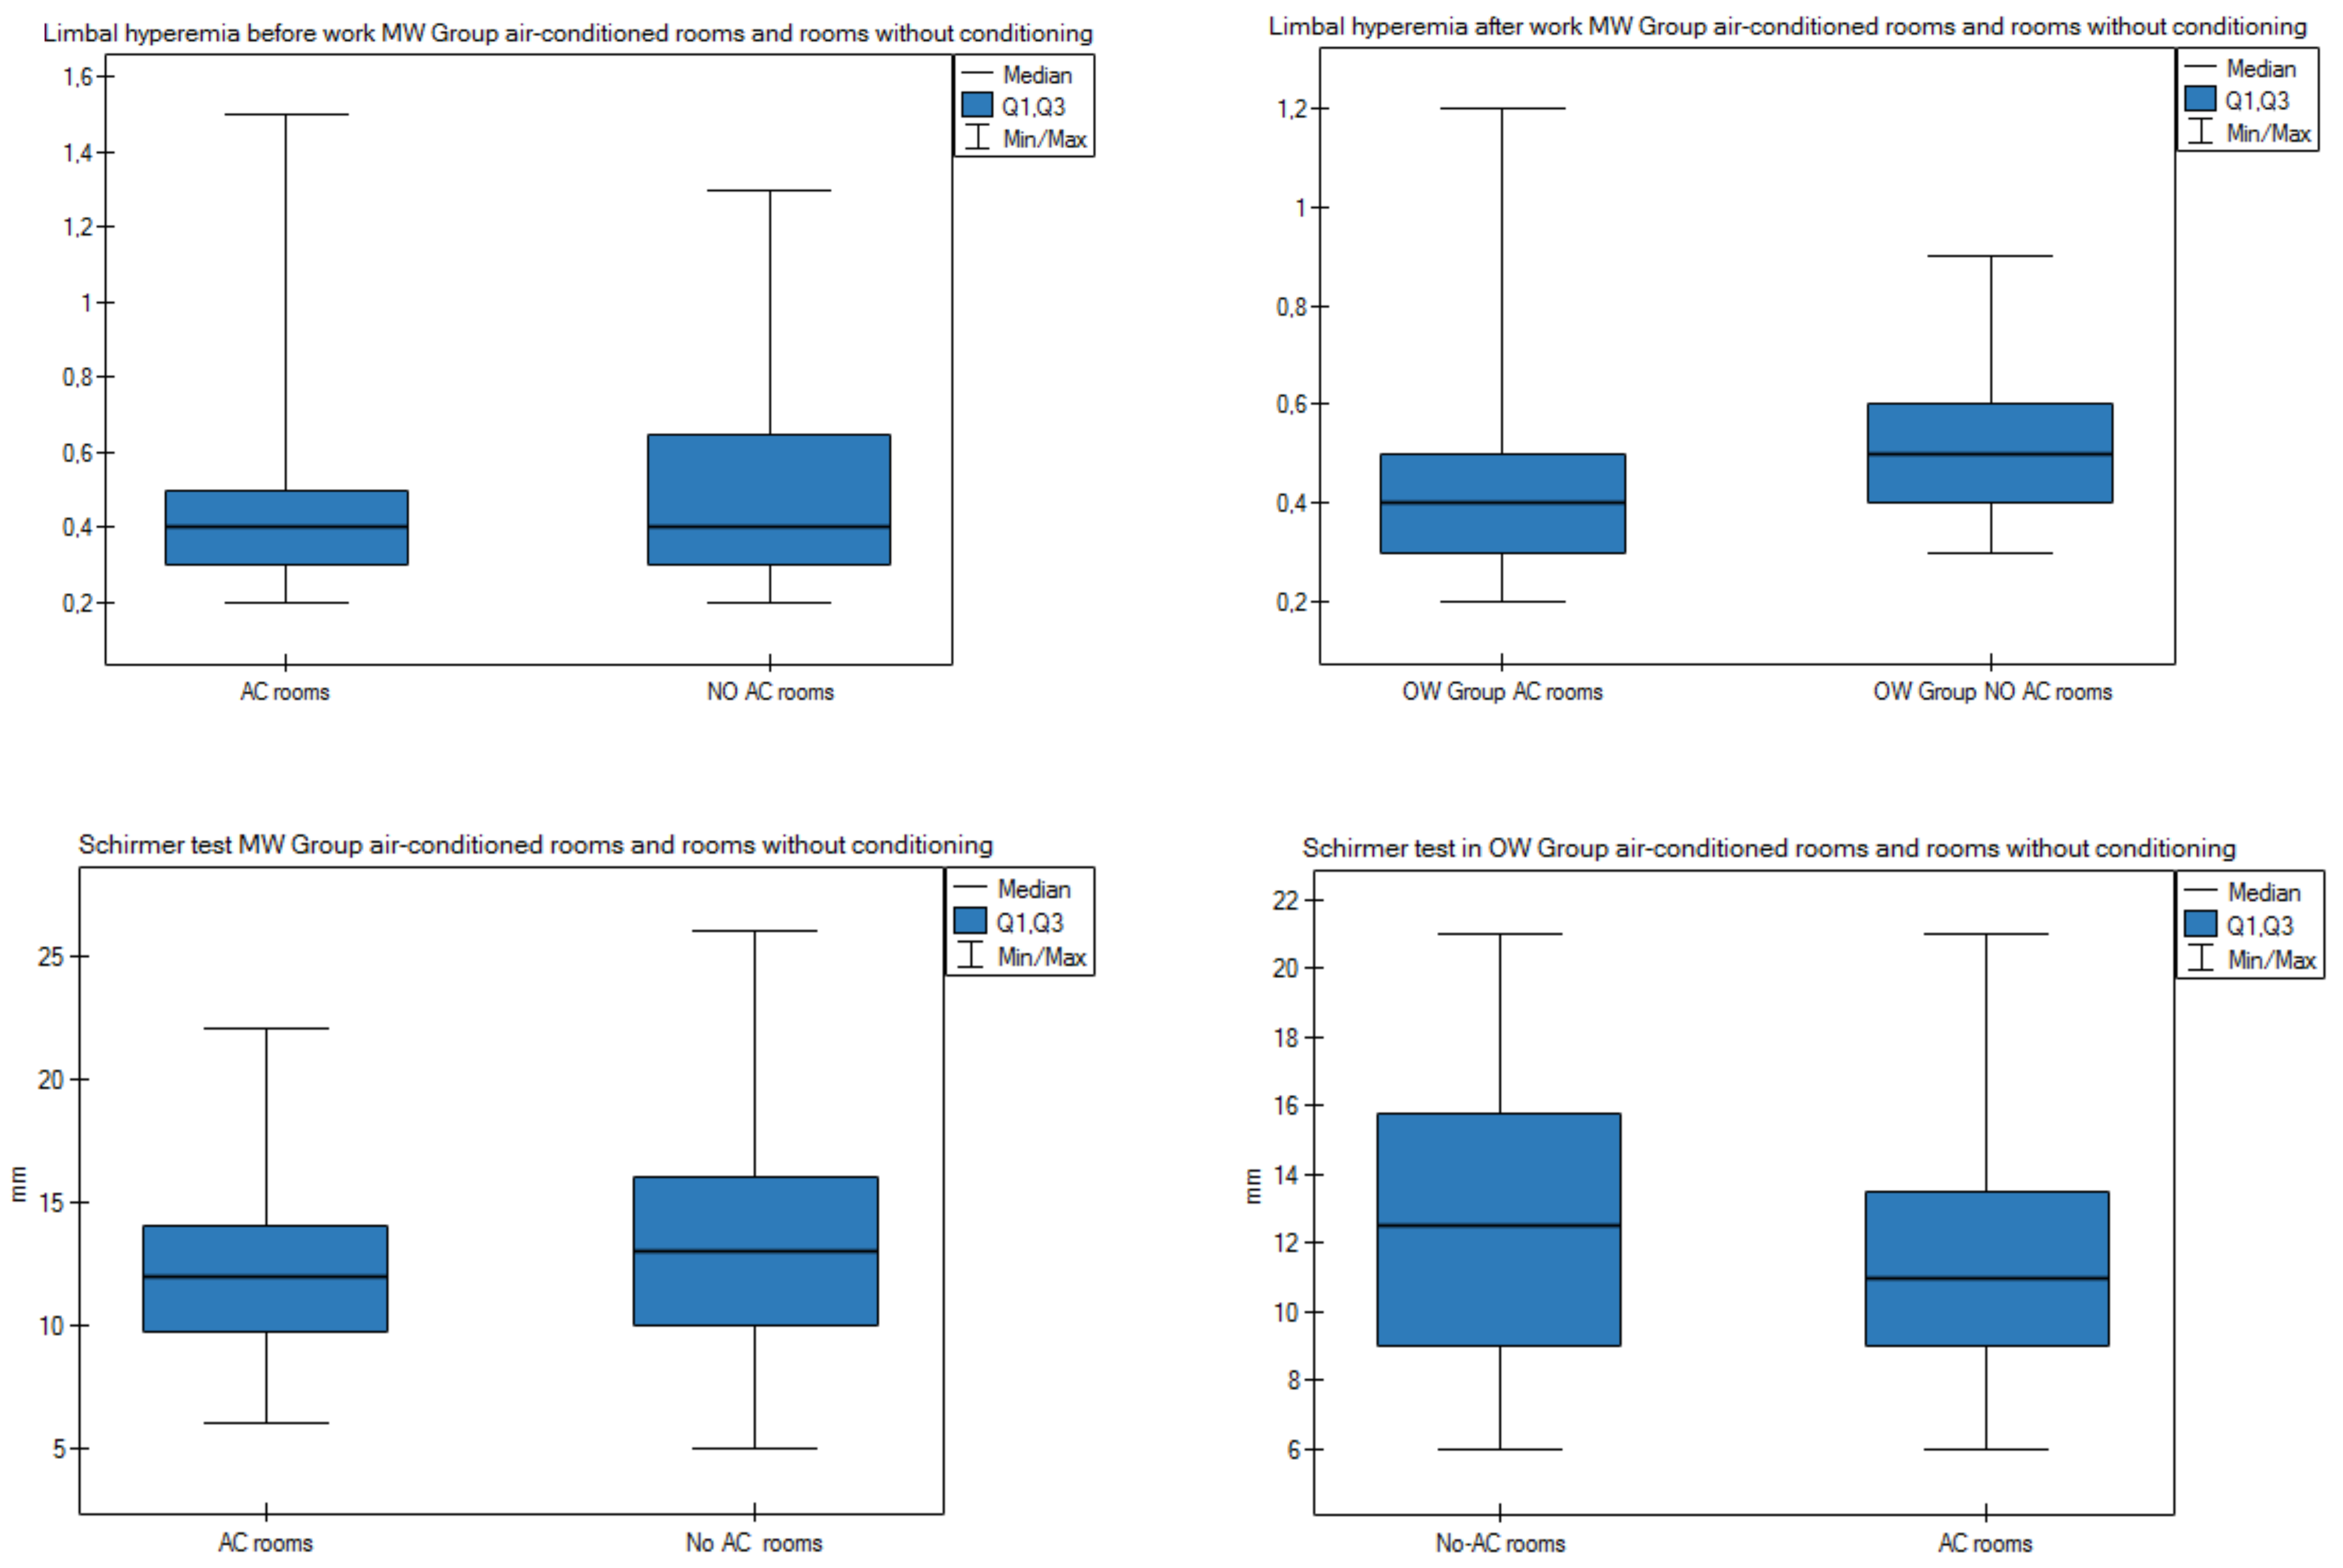
3.3. Effect of Air Conditioning on the Ocular Surface
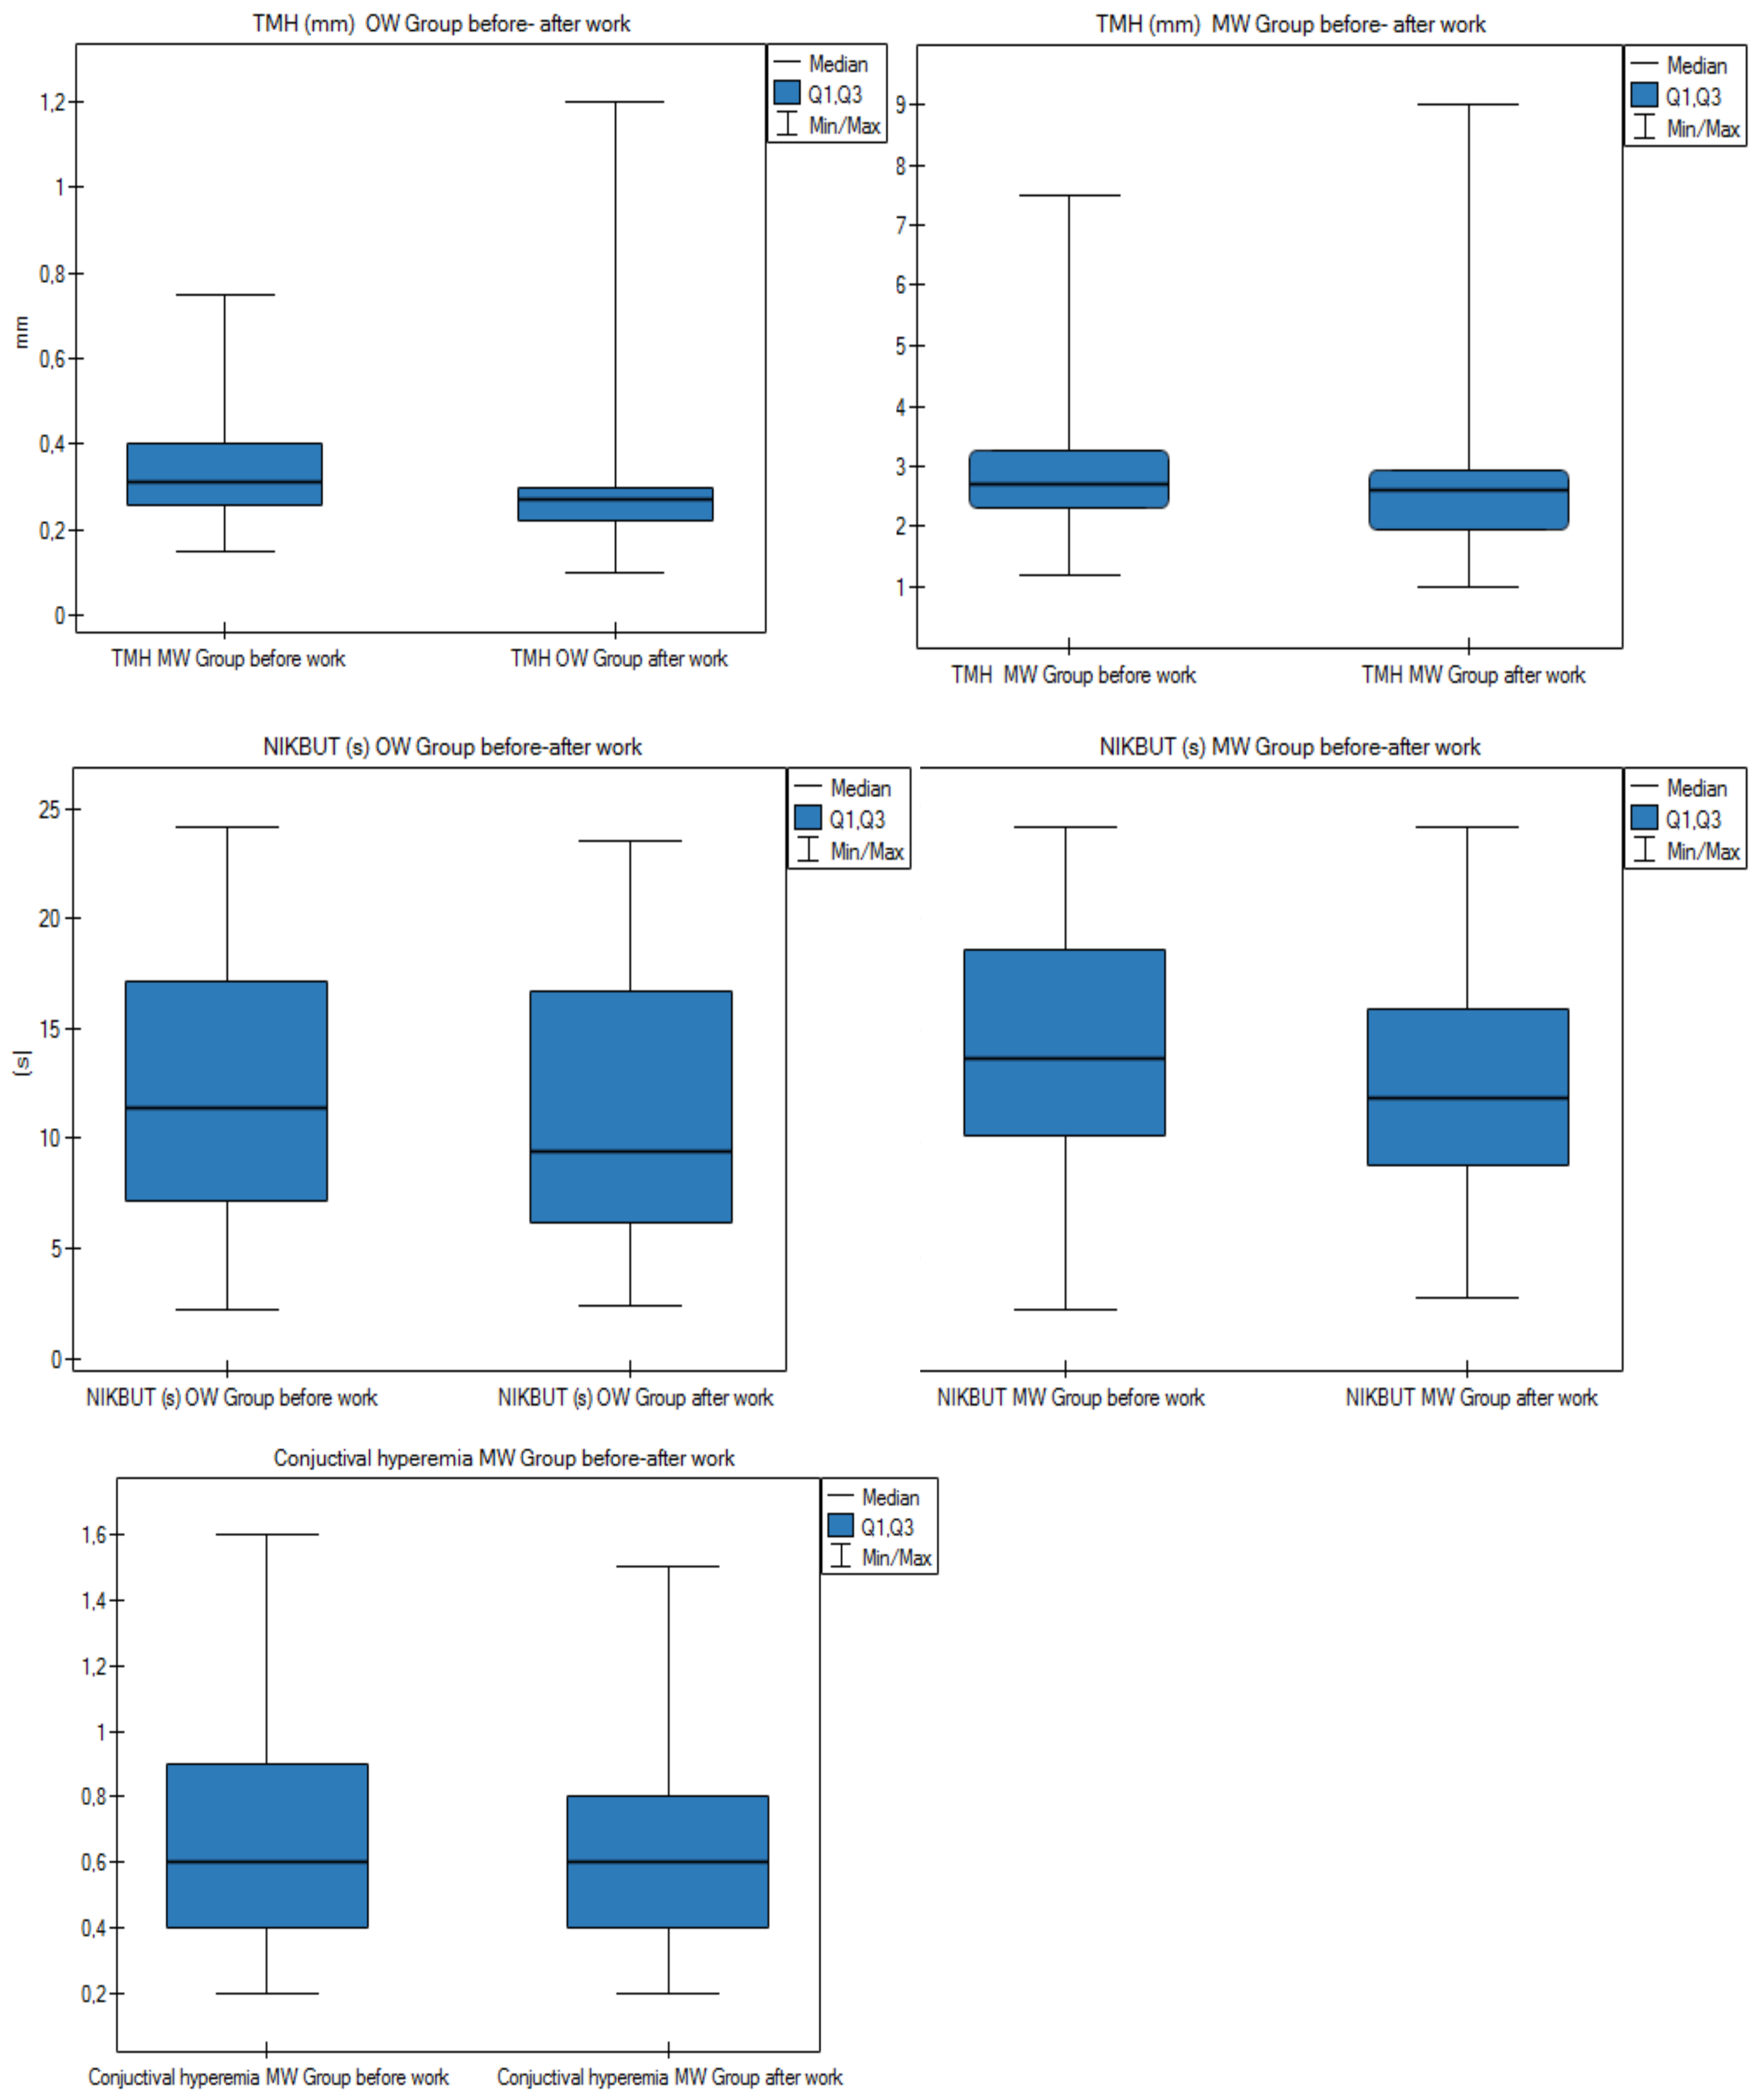
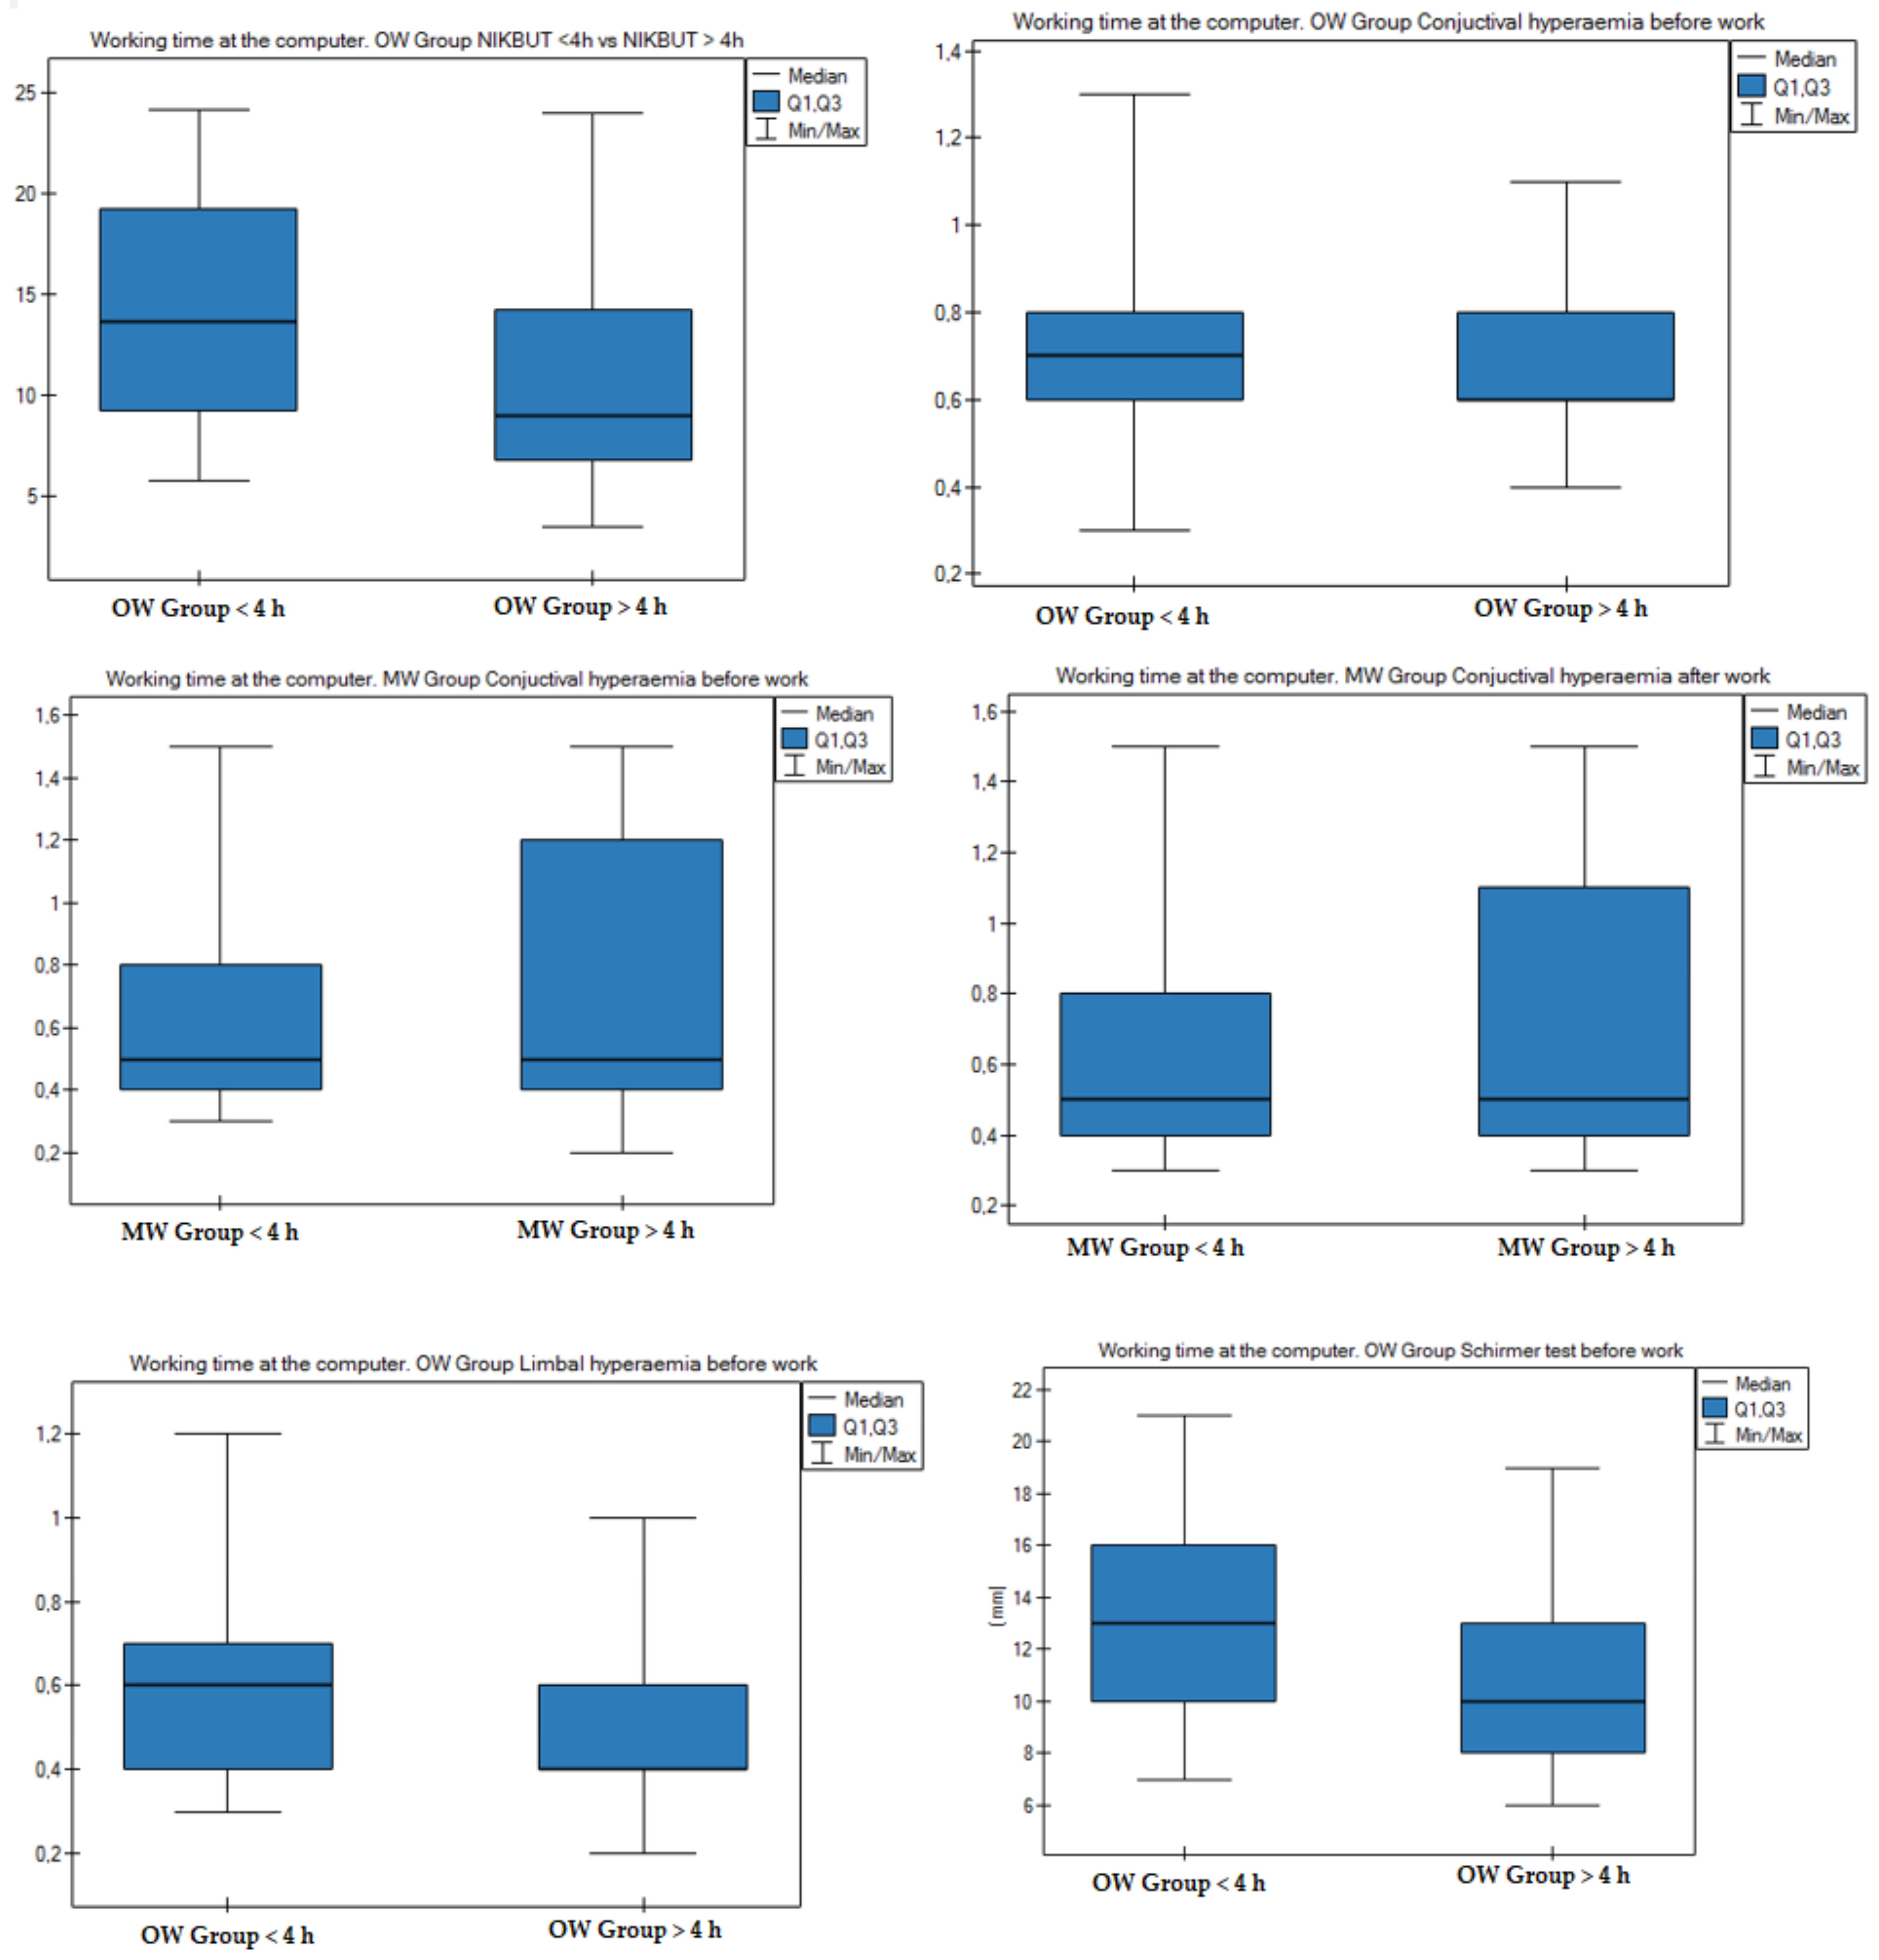
3.4. Effect of Working Time at a Computer on the Ocular Surface
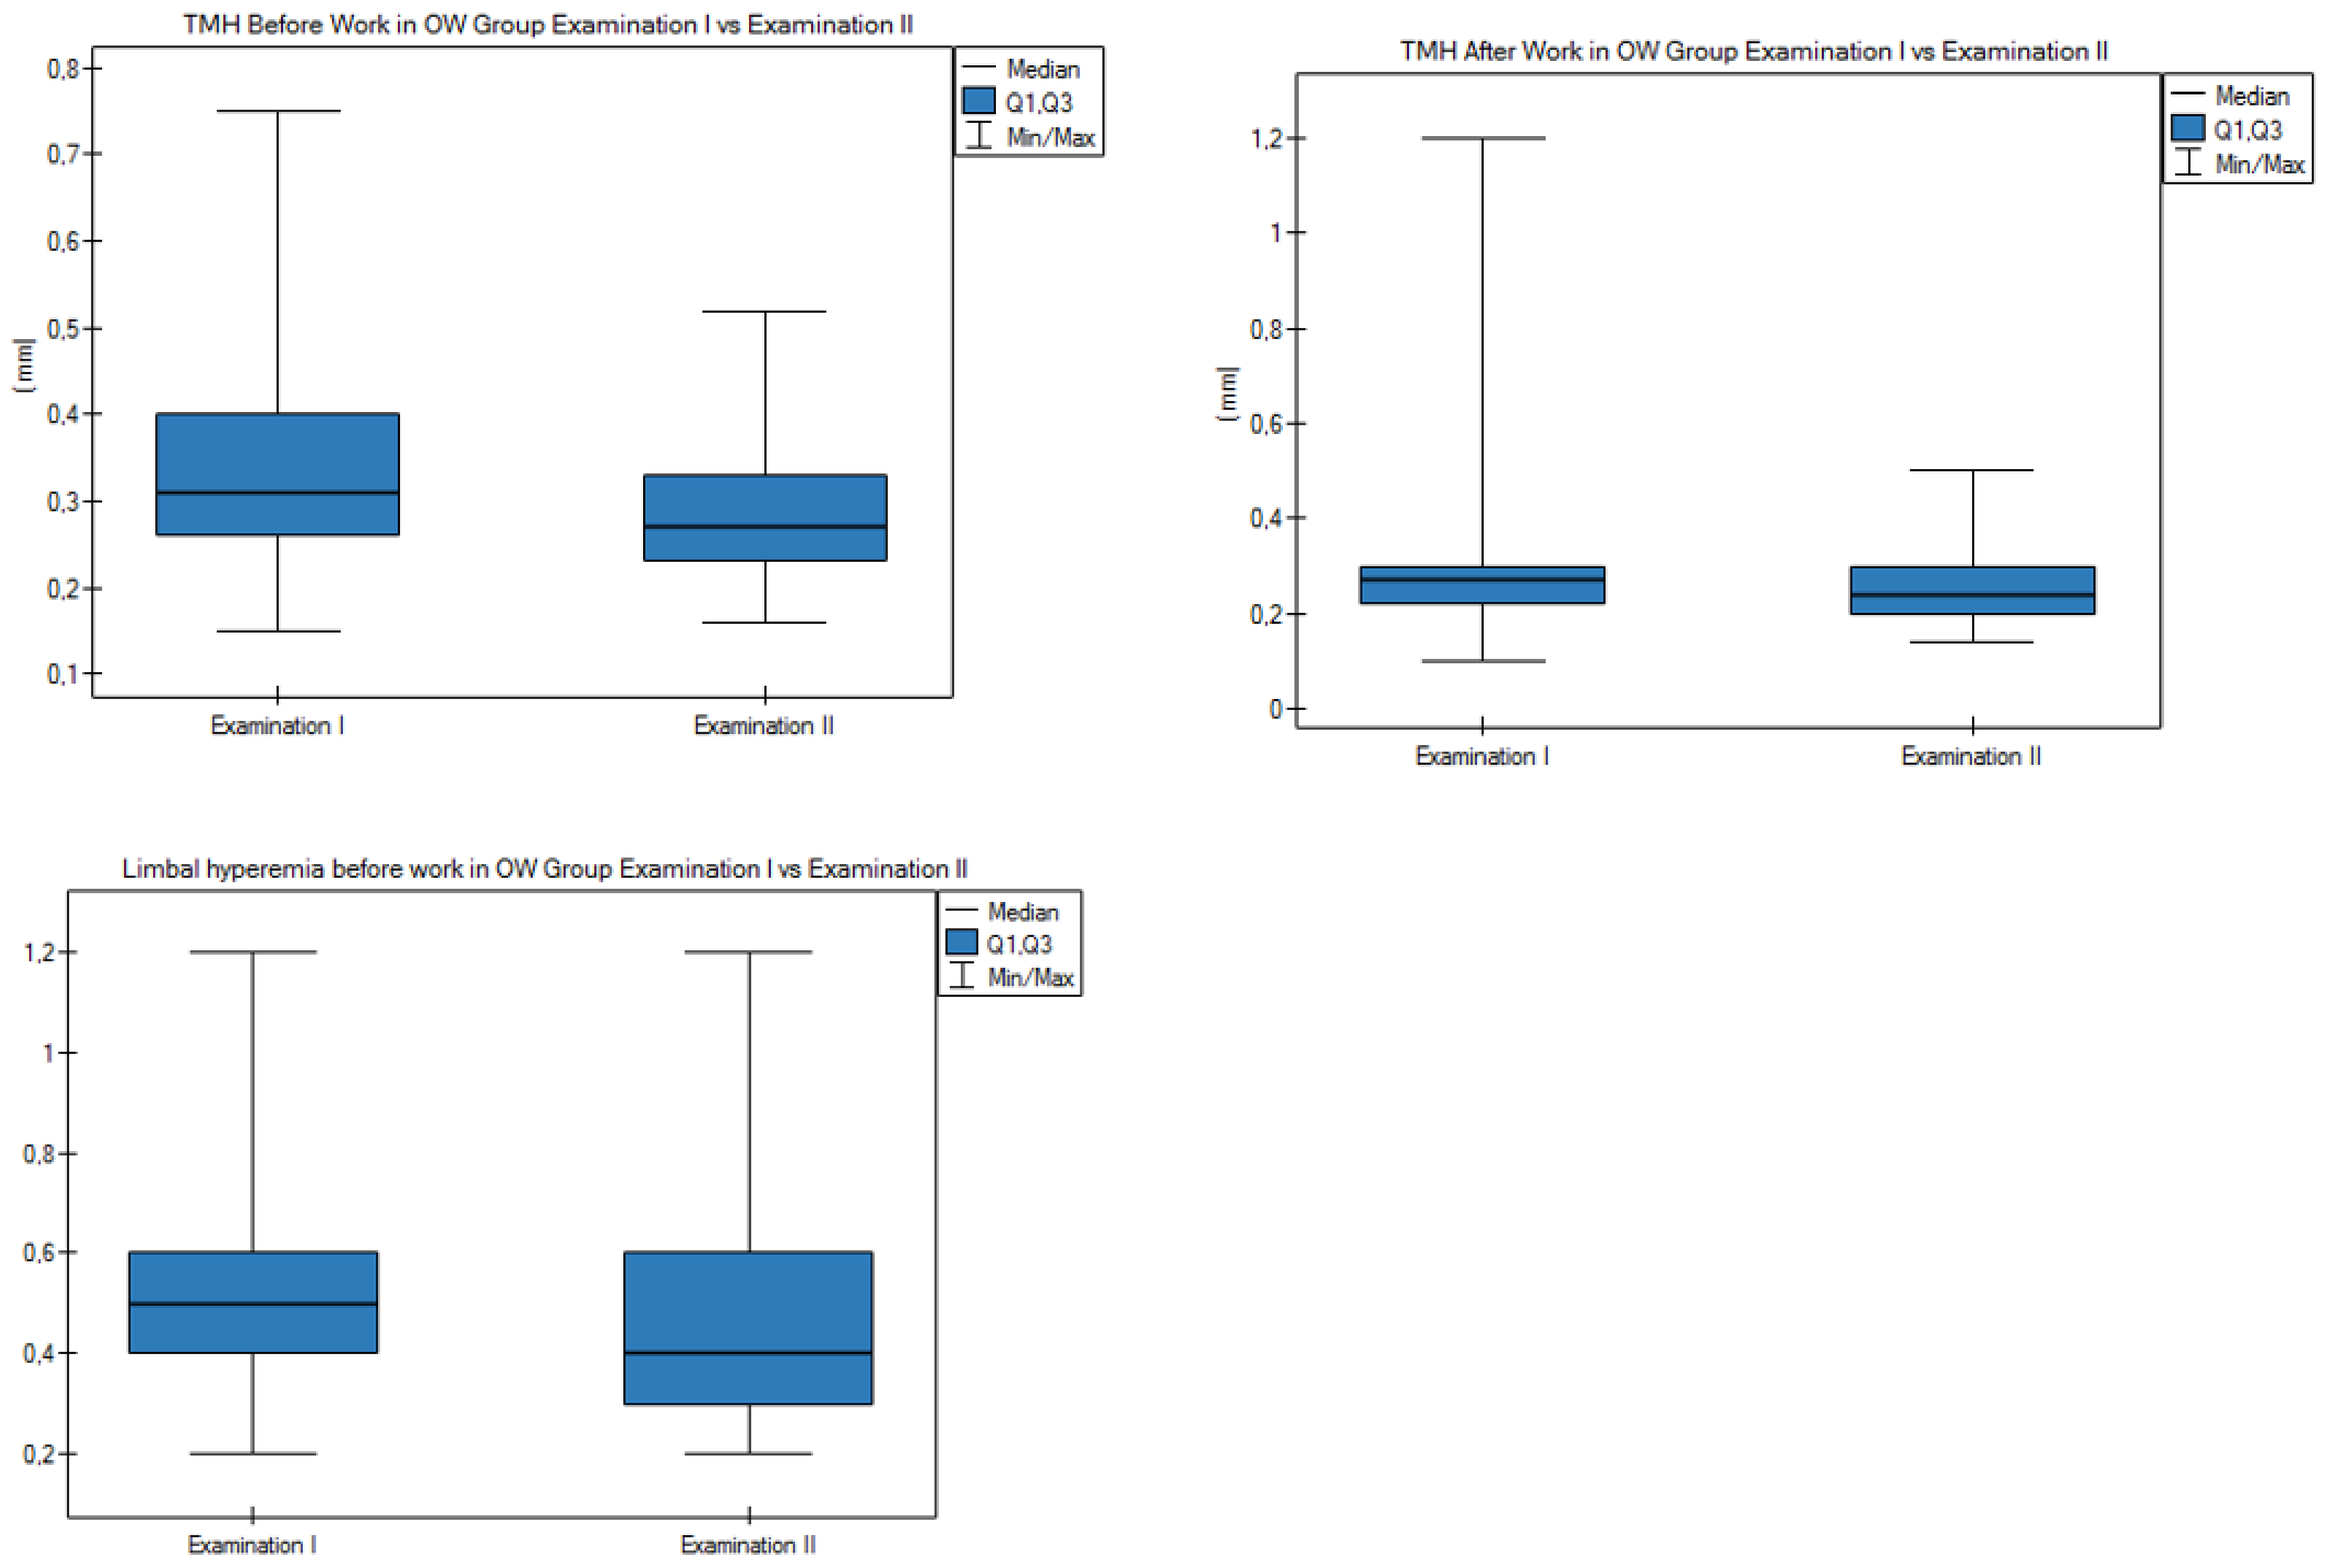
3.5. Results after 1-Year Follow-Up
4. Discussion
5. Conclusions
Supplementary Materials
Author Contributions
Funding
Institutional Review Board Statement
Informed Consent Statement
Data Availability Statement
Conflicts of Interest
Abbreviations
| TFOS | Tear Film and Ocular Surface Society |
| ADDE | Aqueous deficient dry eye |
| AC | Air conditioning |
| CI | Confidence interval |
| DED | Dry eye disease |
| DEWS | Dry eye workshop |
| EDE | Evaporative dry eye |
| LASIK | Laser-assisted in situ keratomileusis |
| MGD | Meibomian gland dysfunction |
| MW | Medical workers |
| NIKBUT | Non-invasive keratographic break-up time |
| Non-AC | Non-air-conditioned |
| ORs | Odds ratios |
| OSDI | Ocular Surface Disease Index |
| OW | Office workers |
| RH | Relative humidity |
| SANDE | The Symptom Assessment in Dry Eye |
| SD | Standard deviation |
| TMH | Tear meniscus height |
| VDT | Video display terminals |
References
- Craig, J.P.; Nichols, K.K.; Akpek, E.K.; Caffery, B.; Dua, H.S.; Joo, C.K.; Liu, Z.; Nelson, J.D.; Nichols, J.J.; Tsubota, K.; et al. TFOS DEWS II Definition and Classification Report. Ocul. Surf. 2017, 15, 276–283. [Google Scholar] [CrossRef]
- Laihia, J.; Jarvinen, R.; Wylegala, E.; Kaarniranta, K. Disease aetiology-based design of multifunctional microemulsion eye drops for moderate or severe dry eye: A randomized, quadruple-masked and active-controlled clinical trial. Acta Ophthalmol. 2020, 98, 244–254. [Google Scholar] [CrossRef] [PubMed] [Green Version]
- Han, S.B.; Hyon, J.Y.; Woo, S.J.; Lee, J.J.; Kim, T.H.; Kim, K.W. Prevalence of dry eye disease in an elderly Korean population. Arch. Ophthalmol. 2011, 129, 633–638. [Google Scholar] [CrossRef] [PubMed] [Green Version]
- Vehof, J.; Kozareva, D.; Hysi, P.G.; Hammond, C.J. Prevalence and risk factors of dry eye disease in a British female cohort. Br. J. Ophthalmol. 2014, 98, 1712–1717. [Google Scholar] [CrossRef]
- McCarty, C.A.; Bansal, A.K.; Livingston, P.M.; Stanislavsky, Y.L.; Taylor, H.R. The epidemiology of dry eye in Melbourne, Australia. Ophthalmology 1998, 105, 1114–1119. [Google Scholar] [CrossRef]
- Um, S.B.; Kim, N.H.; Lee, H.K.; Song, J.S.; Kim, H.C. Spatial epidemiology of dry eye disease: Findings from South Korea. Int. J. Health Geogr. 2014, 13, 31. [Google Scholar] [CrossRef] [Green Version]
- Stapleton, F.; Alves, M.; Bunya, V.Y.; Jalbert, I.; Lekhanont, K.; Malet, F.; Na, K.S.; Schaumberg, D.; Uchino, M.; Vehof, J.; et al. TFOS DEWS II Epidemiology Report. Ocul. Surf. 2017, 15, 334–365. [Google Scholar] [CrossRef] [PubMed]
- Malet, F.; Le Goff, M.; Colin, J.; Schweitzer, C.; Delyfer, M.N.; Korobelnik, J.F.; Rougier, M.B.; Radeau, T.; Dartigues, J.F.; Delcourt, C. Dry eye disease in French elderly subjects: The Alienor Study. Acta Ophthalmol. 2014, 92, e429–e436. [Google Scholar] [CrossRef] [PubMed]
- Maruyama, K.; Yokoi, N.; Takamata, A.; Kinoshita, S. Effect of environmental conditions on tear dynamics in soft contact lens wearers. Investig. Ophthalmol. Vis. Sci. 2004, 45, 2563–2568. [Google Scholar] [CrossRef]
- Azuma, M.; Yabuta, C.; Fraunfelder, F.W.; Shearer, T.R. Dry eye in LASIK patients. BMC Res. Notes 2014, 7, 420. [Google Scholar] [CrossRef] [PubMed] [Green Version]
- Astakhov, Y.S.; Astakhov, S.Y.; Lisochkina, A.B. Assessment of dry eye signs and symptoms and ocular tolerance of a preservative-free lacrimal substitute (Hylabak(R)) versus a preserved lacrimal substitute (Systane(R)) used for 3 months in patients after LASIK. Clin. Ophthalmol. 2013, 7, 2289–2297. [Google Scholar] [CrossRef] [PubMed] [Green Version]
- Porcar, E.; Pons, A.M.; Lorente, A. Visual and ocular effects from the use of flat-panel displays. Int. J. Ophthalmol. 2016, 9, 881–885. [Google Scholar] [CrossRef] [PubMed]
- Sayin, N.; Kara, N.; Pekel, G.; Altinkaynak, H. Effects of chronic smoking on central corneal thickness, endothelial cell, and dry eye parameters. Cutan. Ocul. Toxicol. 2014, 33, 201–205. [Google Scholar] [CrossRef]
- Kastelan, S.; Lukenda, A.; Salopek-Rabatic, J.; Pavan, J.; Gotovac, M. Dry eye symptoms and signs in long-term contact lens wearers. Coll. Antropol. 2013, 37 (Suppl. 1), 199–203. [Google Scholar]
- Hallak, J.A.; Tibrewal, S.; Jain, S. Depressive Symptoms in Patients with Dry Eye Disease: A Case-Control Study Using the Beck Depression Inventory. Cornea 2015, 34, 1545–1550. [Google Scholar] [CrossRef] [PubMed] [Green Version]
- Labbe, A.; Wang, Y.X.; Jie, Y.; Baudouin, C.; Jonas, J.B.; Xu, L. Dry eye disease, dry eye symptoms and depression: The Beijing Eye Study. Br. J. Ophthalmol. 2013, 97, 1399–1403. [Google Scholar] [CrossRef] [PubMed]
- Welch, D.; Ousler, G.W., 3rd; Nally, L.A.; Abelson, M.B.; Wilcox, K.A. Ocular drying associated with oral antihistamines (loratadine) in the normal population-an evaluation of exaggerated dose effect. Adv. Exp. Med. Biol. 2002, 506, 1051–1055. [Google Scholar] [CrossRef] [PubMed]
- Ohtsuki, M.; Yokoi, N.; Mori, K.; Matsumoto, Y.; Adachi, W.; Ishibashi, K.; Sato, M.; Kinoshita, S. Adverse effects of beta-blocker eye drops on the ocular surface. Nippon Ganka Gakkai Zasshi 2001, 105, 149–154. [Google Scholar]
- Moss, S.E.; Klein, R.; Klein, B.E. Prevalence of and risk factors for dry eye syndrome. Arch. Ophthalmol. 2000, 118, 1264–1268. [Google Scholar] [CrossRef] [PubMed] [Green Version]
- Miljanovic, B.; Trivedi, K.A.; Dana, M.R.; Gilbard, J.P.; Buring, J.E.; Schaumberg, D.A. Relation between dietary n-3 and n-6 fatty acids and clinically diagnosed dry eye syndrome in women. Am. J. Clin. Nutr. 2005, 82, 887–893. [Google Scholar] [CrossRef] [Green Version]
- Uchino, M.; Schaumberg, D.A.; Dogru, M.; Uchino, Y.; Fukagawa, K.; Shimmura, S.; Satoh, T.; Takebayashi, T.; Tsubota, K. Prevalence of dry eye disease among Japanese visual display terminal users. Ophthalmology 2008, 115, 1982–1988. [Google Scholar] [CrossRef]
- Rentka, A.; Nagy, A.; Harsfalvi, J.; Szucs, G.; Szekanecz, Z.; Gesztelyi, R.; Szodoray, P.; Kemeny-Beke, A. Association between objective signs and subjective symptoms of dry eye disease in patients with systemic sclerosis. Rheumatol. Int. 2017, 37, 1835–1845. [Google Scholar] [CrossRef]
- Song, H.; Zhang, M.; Hu, X.; Li, K.; Jiang, X.; Liu, Y.; Lv, H.; Li, X. Correlation Analysis of Ocular Symptoms and Signs in Patients with Dry Eye. J. Ophthalmol. 2017, 2017, 1247138. [Google Scholar] [CrossRef] [PubMed] [Green Version]
- Nichols, K.K.; Nichols, J.J.; Mitchell, G.L. The lack of association between signs and symptoms in patients with dry eye disease. Cornea 2004, 23, 762–770. [Google Scholar] [CrossRef]
- Wolffsohn, J.S.; Arita, R.; Chalmers, R.; Djalilian, A.; Dogru, M.; Dumbleton, K.; Gupta, P.K.; Karpecki, P.; Lazreg, S.; Pult, H.; et al. TFOS DEWS II Diagnostic Methodology report. Ocul. Surf. 2017, 15, 539–574. [Google Scholar] [CrossRef] [PubMed]
- Lim, J.; Wang, M.T.M.; Craig, J.P. Evaluating the diagnostic ability of two automated non-invasive tear film stability measurement techniques. Cont. Lens Anterior Eye 2020, in press. [Google Scholar] [CrossRef]
- Bron, A.J.; de Paiva, C.S.; Chauhan, S.K.; Bonini, S.; Gabison, E.E.; Jain, S.; Knop, E.; Markoulli, M.; Ogawa, Y.; Perez, V.; et al. TFOS DEWS II pathophysiology report. Ocul. Surf. 2017, 15, 438–510. [Google Scholar] [CrossRef]
- Kuo, M.T.; Fang, P.C.; Kuo, S.F.; Chen, A.; Huang, Y.T. Tear Proteomics Study of Dry Eye Disease: Which Eye Do You Adopt as the Representative Eye for the Study? Int. J. Mol. Sci. 2021, 22, 422. [Google Scholar] [CrossRef] [PubMed]
- Geerling, G.; Tauber, J.; Baudouin, C.; Goto, E.; Matsumoto, Y.; O’Brien, T.; Rolando, M.; Tsubota, K.; Nichols, K.K. The international workshop on meibomian gland dysfunction: Report of the subcommittee on management and treatment of meibomian gland dysfunction. Investig. Ophthalmol. Vis. Sci. 2011, 52, 2050–2064. [Google Scholar] [CrossRef] [Green Version]
- Berg, E.J.; Ying, G.S.; Maguire, M.G.; Sheffield, P.E.; Szczotka-Flynn, L.B.; Asbell, P.A.; Shen, J.F.; Group, D.S.R. Climatic and Environmental Correlates of Dry Eye Disease Severity: A Report From the Dry Eye Assessment and Management (DREAM) Study. Transl. Vis. Sci. Technol. 2020, 9, 25. [Google Scholar] [CrossRef] [PubMed]
- Vora, G.K.; Gupta, P.K. Intense pulsed light therapy for the treatment of evaporative dry eye disease. Curr. Opin. Ophthalmol. 2015, 26, 314–318. [Google Scholar] [CrossRef] [PubMed]
- Bron, A.J.; Tiffany, J.M. The contribution of meibomian disease to dry eye. Ocul. Surf. 2004, 2, 149–165. [Google Scholar] [CrossRef]
- Sullivan, D.A.; Rocha, E.M.; Aragona, P.; Clayton, J.A.; Ding, J.; Golebiowski, B.; Hampel, U.; McDermott, A.M.; Schaumberg, D.A.; Srinivasan, S.; et al. TFOS DEWS II Sex, Gender, and Hormones Report. Ocul. Surf. 2017, 15, 284–333. [Google Scholar] [CrossRef]
- Wolkoff, P. External eye symptoms in indoor environments. Indoor Air 2017, 27, 246–260. [Google Scholar] [CrossRef] [PubMed]
- Wolkoff, P. “Healthy” eye in office-like environments. Environ. Int. 2008, 34, 1204–1214. [Google Scholar] [CrossRef]
- Smedbold, H.T.; Ahlen, C.; Norback, D.; Hilt, B. Sign of eye irritation in female hospital workers and the indoor environment. Indoor Air 2001, 11, 223–231. [Google Scholar] [CrossRef]
- Herrero-Vanrell, R.; Peral, A. International Dry Eye Workshop (DEWS). Update of the disease. Arch. Soc. Esp. Oftalmol. 2007, 82, 733–734. [Google Scholar] [CrossRef] [PubMed] [Green Version]
- Castellanos-Gonzalez, J.A.; Torres-Martinez, V.; Martinez-Ruiz, A.; Fuentes-Orozco, C.; Rendon-Felix, J.; Irusteta-Jimenez, L.; Marquez-Valdez, A.R.; Cortes-Lares, J.A.; Gonzalez-Ojeda, A. Prevalence of dry eye syndrome in residents of surgical specialties. BMC Ophthalmol. 2016, 16, 108. [Google Scholar] [CrossRef] [PubMed] [Green Version]
- Lopez-Miguel, A.; Teson, M.; Martin-Montanez, V.; Enriquez-de-Salamanca, A.; Stern, M.E.; Calonge, M.; Gonzalez-Garcia, M.J. Dry eye exacerbation in patients exposed to desiccating stress under controlled environmental conditions. Am. J. Ophthalmol. 2014, 157, 788–798. [Google Scholar] [CrossRef]
- Albietz, J.M. Prevalence of dry eye subtypes in clinical optometry practice. Optom. Vis. Sci. 2000, 77, 357–363. [Google Scholar] [CrossRef] [PubMed]
- Norn, M. Pollution keratoconjunctivitis. A review. Acta Ophthalmol. 1992, 70, 269–273. [Google Scholar] [CrossRef] [PubMed]
- Farrand, K.F.; Fridman, M.; Stillman, I.O.; Schaumberg, D.A. Prevalence of Diagnosed Dry Eye Disease in the United States Among Adults Aged 18 Years and Older. Am. J. Ophthalmol. 2017, 182, 90–98. [Google Scholar] [CrossRef] [PubMed] [Green Version]
- Viso, E.; Rodriguez-Ares, M.T.; Gude, F. Prevalence of and associated factors for dry eye in a Spanish adult population (the Salnes Eye Study). Ophthalmic Epidemiol. 2009, 16, 15–21. [Google Scholar] [CrossRef] [PubMed]
- Hua, R.; Yao, K.; Hu, Y.; Chen, L. Discrepancy between subjectively reported symptoms and objectively measured clinical findings in dry eye: A population based analysis. BMJ Open 2014, 4, e005296. [Google Scholar] [CrossRef]


| Variables | OW Group (n = 75) | MW Group (n = 75) | OW + MW Groups (n = 150) | p * | |||||||
|---|---|---|---|---|---|---|---|---|---|---|---|
| n | % | n | % | n | % | ||||||
| Sex | F | 67 | 89.33% | 63 | 84.00% | 130 | 86.67% | 0.471 | |||
| M | 8 | 10.67% | 12 | 16.00% | 20 | 13.33% | |||||
| Variables | OW Group (N = 75) | MW Group (n = 75) | OW + MW Groups (n = 150) | p ** | |||||||
| Mean (SD) | Median (quartiles) | Mean (SD) | Median (quartiles) | Mean (SD) | Median (quartiles) | ||||||
| Age (years) | 47.0 (8.4) | 47.0 (40.0–54.0) | 47.1 (12.8) | 49.0 (38.5–56.5) | 47.1 (10.8) | 48.0 (40.0–55.0) | 0.555 | ||||
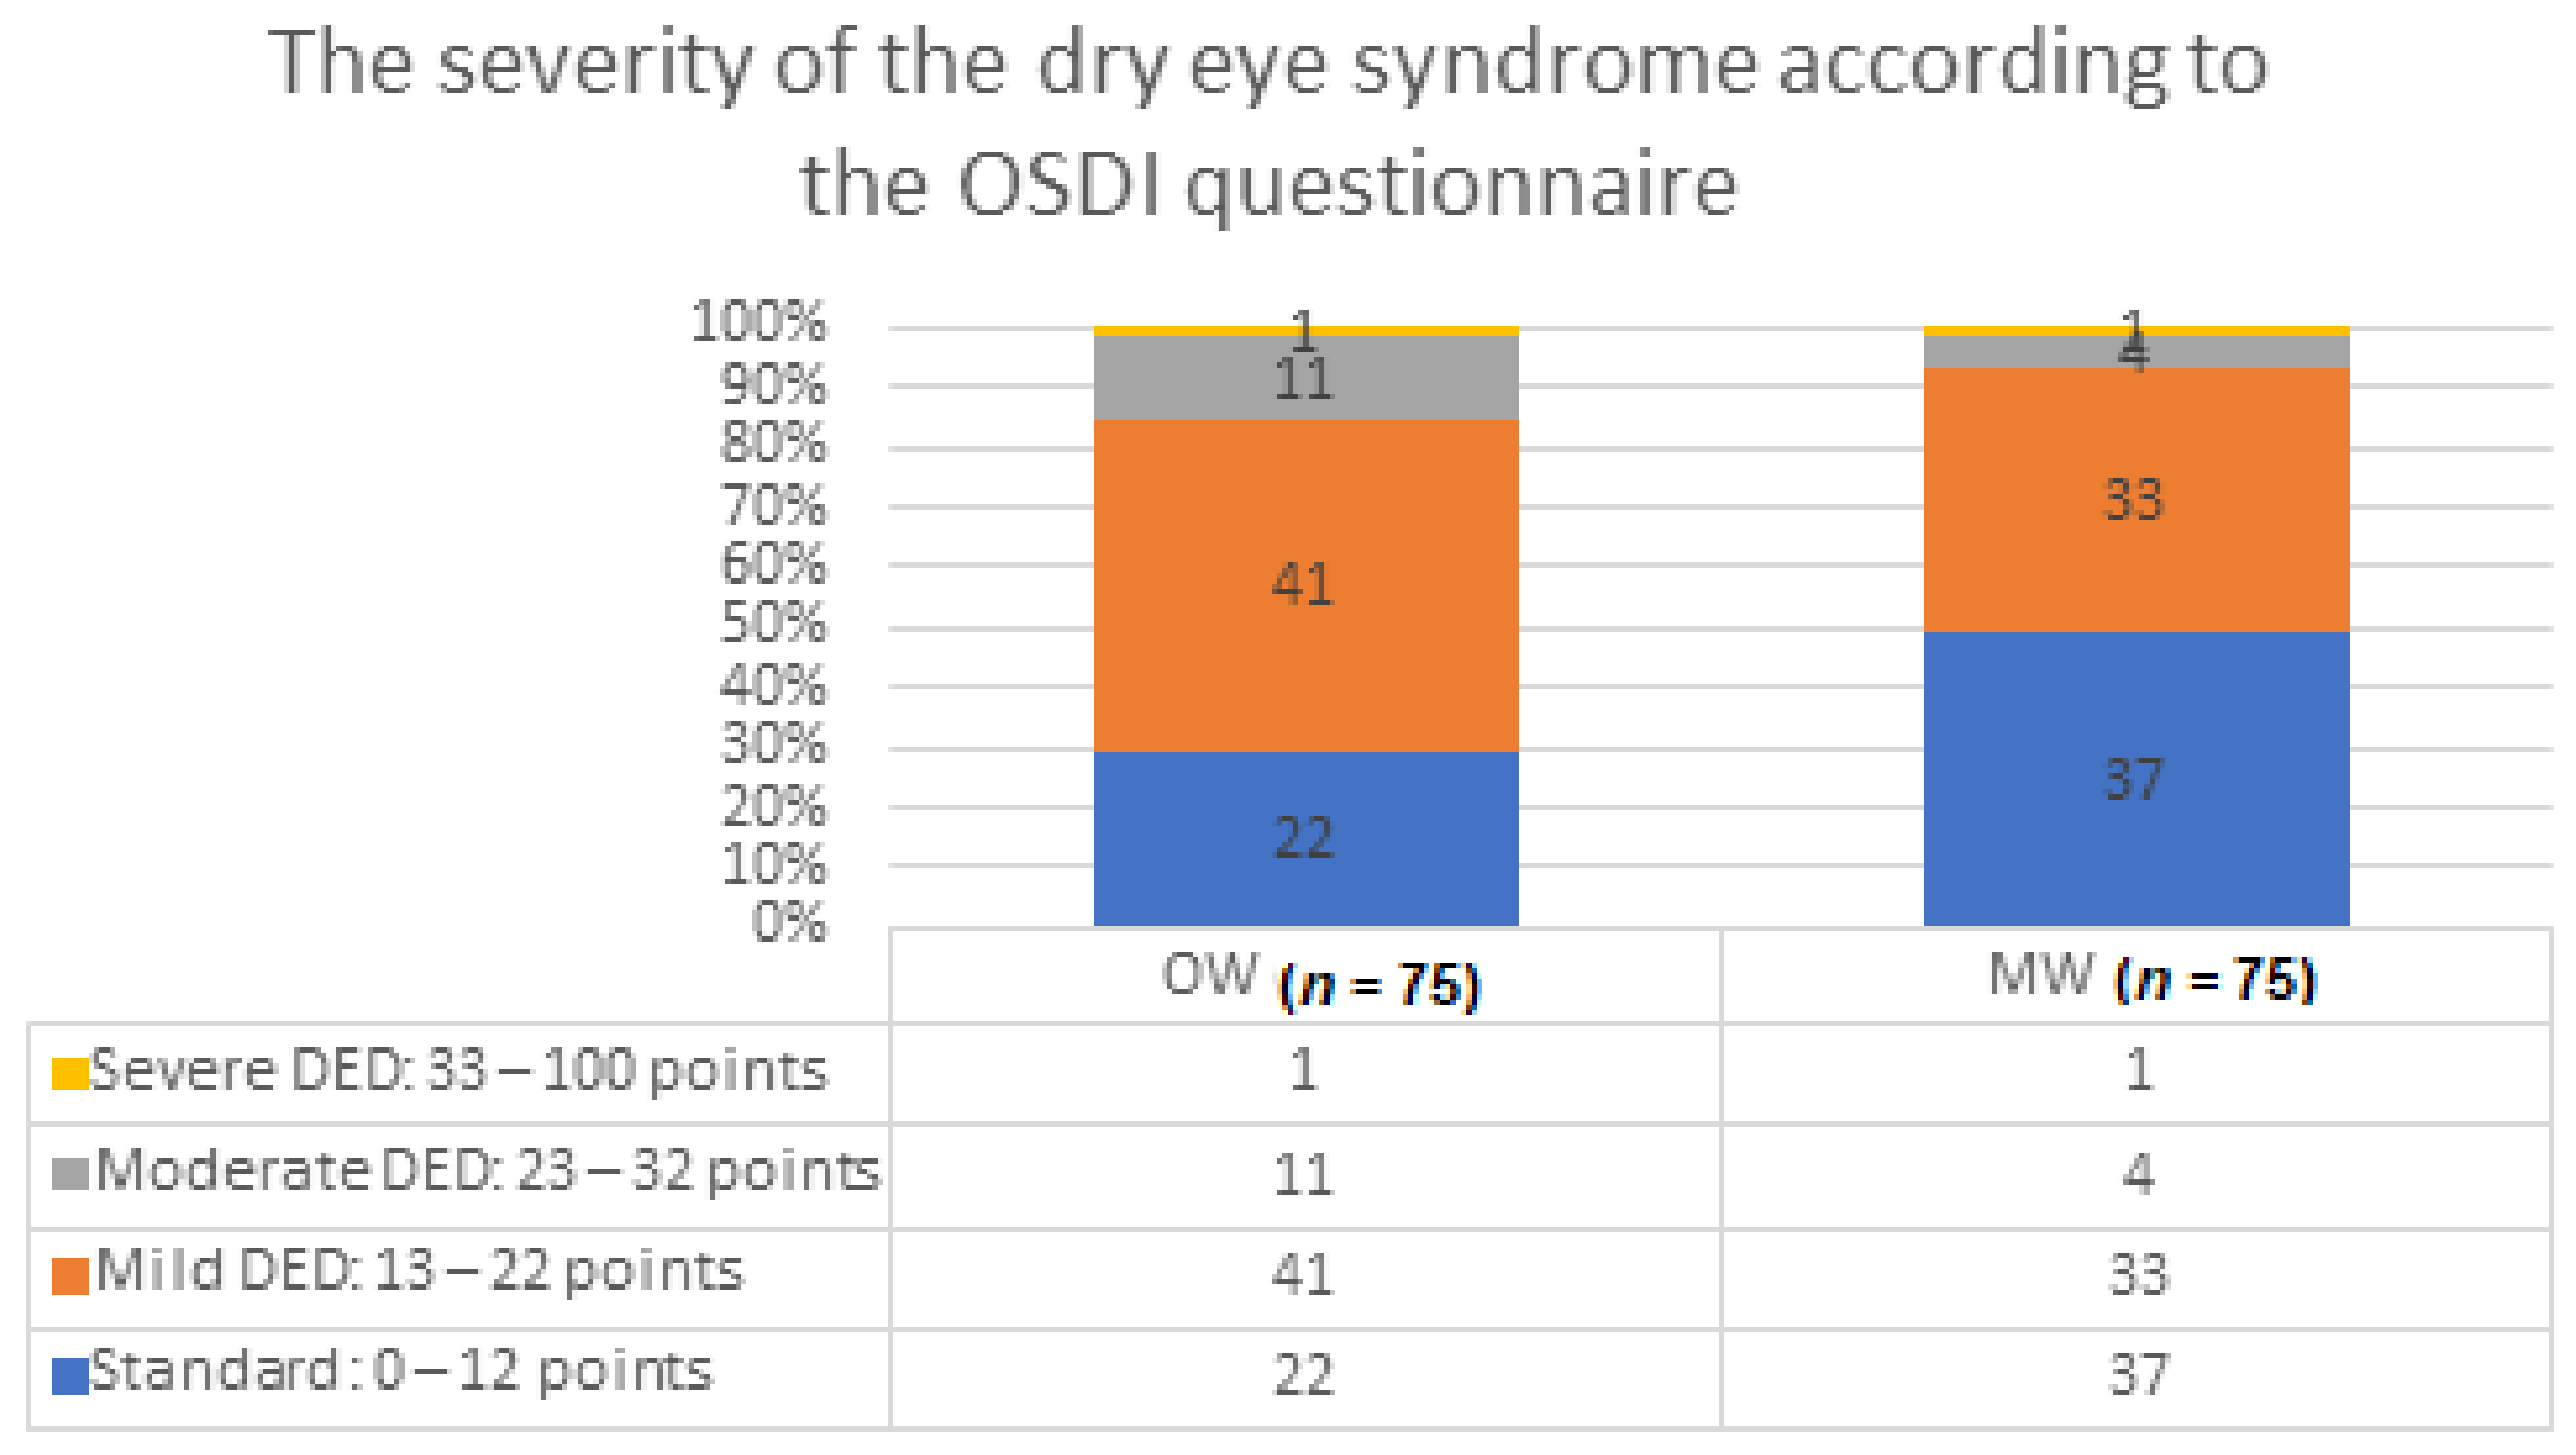
| OSDI (score) | 15.2 (6.3) | 15 (12.0–18.0) | 11.8 (7.3) | 13 (7.5–1.5) | 13.5 (7.0) | 14 (9.0–17.0) | 0.002 | ||||
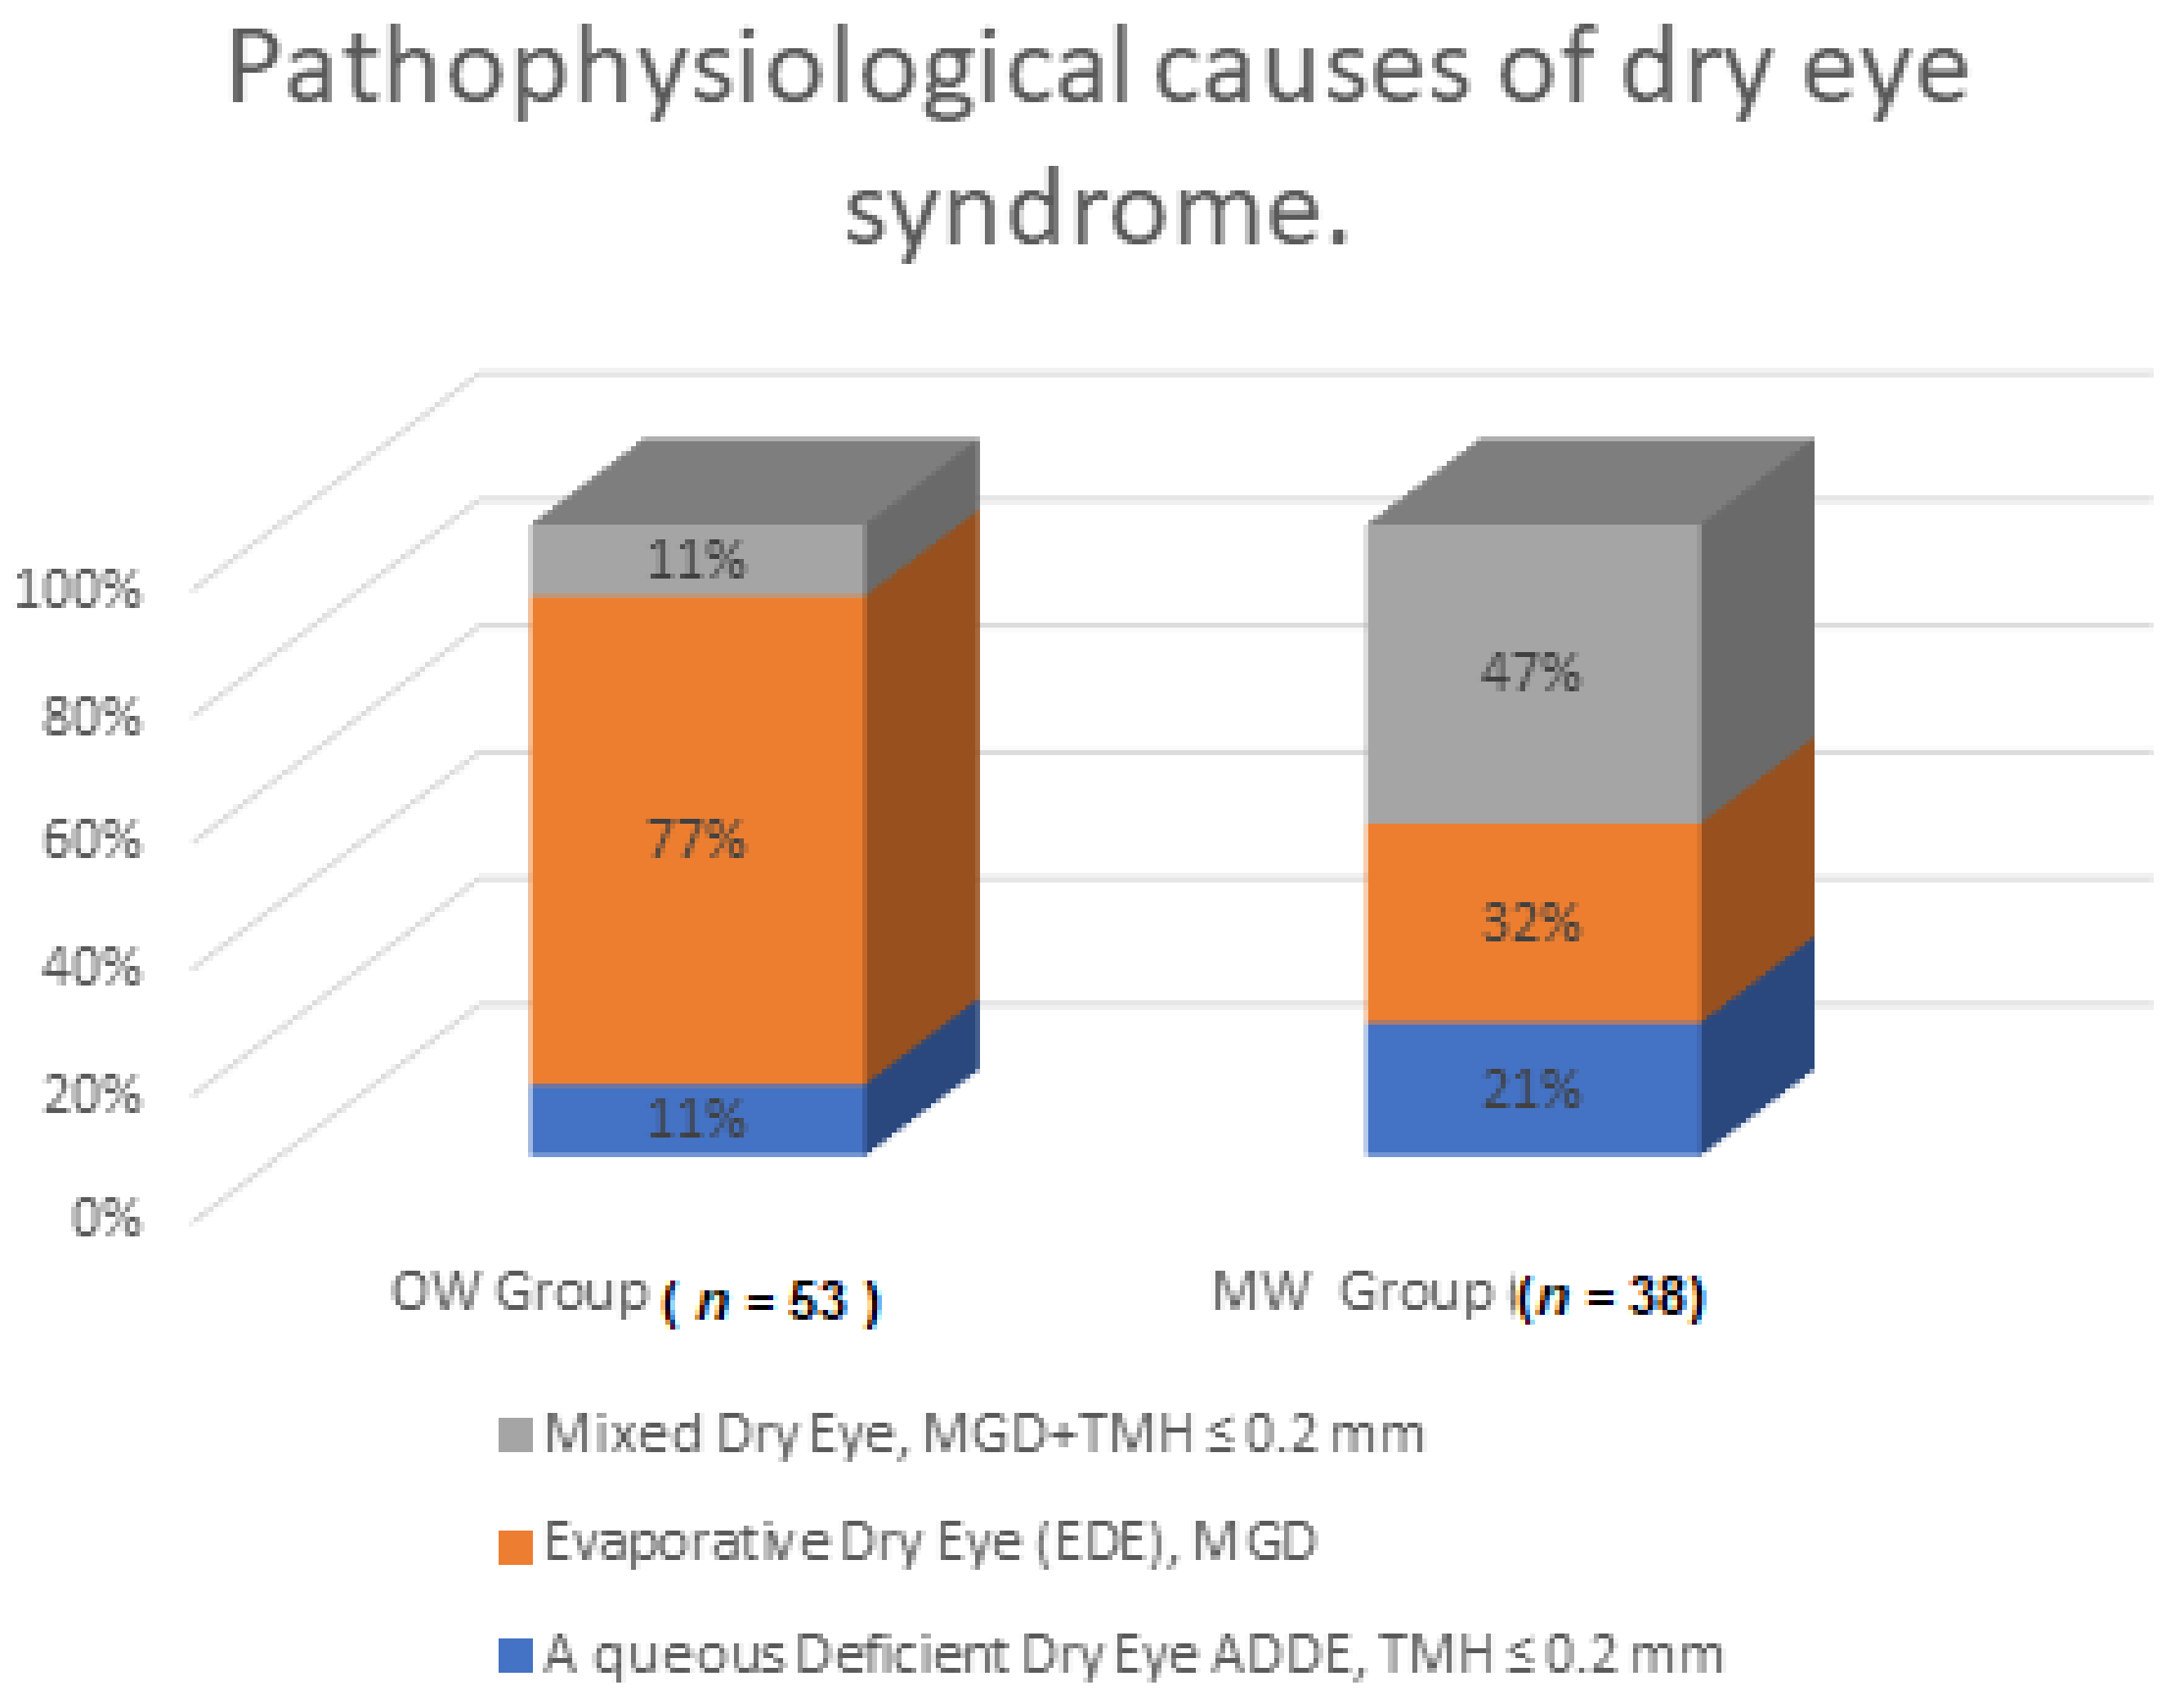
| Pathophysiological Causes | OW Group (n = 53) | MW Group (n = 38) | p * | ||
|---|---|---|---|---|---|
| n | % | n | % | ||
| Aqueous deficient dry eye (ADDE), TMH ≤ 0.2 mm | 6 | 11.32 | 8 | 21.05 | 0.001 |
| Evaporative dry eye (EDE), MGD | 41 | 77.36 | 12 | 31.58 | |
| Mixed dry eye, MGD + TMH ≤ 0.2 mm | 6 | 11.32 | 18 | 47.37 | |
| Variables | Mean (SD) | Median (Quartiles) |
|---|---|---|
| Air temperature (°C) | 23.19 (1.47) | 23 (22–24) |
| Relative air humidity (%) | 32.88 (6.93) | 31 (28–37.75) |
| Illumination (lux) | 566.88 (314.58) | 467 (370.25–600) |
| TMH (≤0.2 mm) Before Work | TMH (≤0.2 mm) After Work | NIKBUT (<10 s) Before Work | NIKBUT (<10 s) After Work | Schirmer Test (<10 mm) | ||||||
|---|---|---|---|---|---|---|---|---|---|---|
| Variables | OR (95%CI) | p * | OR (95%CI) | p * | OR (95%CI) | p * | OR (95%CI) | p * | OR (95%CI) | p * |
| Air temperature (°C) | 1.512 (1.1–2) | 0 | 2.037 (1.6–2,6) | <0.001 | 0.856 (0.73–1.01) | 0.06 | 0.889 (0.8–1) | 0.1 | 1.451 (1.209–1.17) | <0.001 |
| Relative air humidity (%) | 0.911 (0.09–1) | 0 | 0.957 (0.9–1) | 0.04 | 1.024 (0.99–1.06) | 0.18 | 0.975 (0.9–1) | 0.1 | 0.972 (0.937–1) | 0.135 |
| Lighting intensity (lux) | 1.123 (1.000–1.200) | 0 | 1.064 (1–1.2) | 0.12 | 0.928 (0.85–1.02) | 0.11 | 0.877 (0.8–1) | 0 | 1.315 (1.181–1.5) | <0.001 |
| TMH (≤0.2 mm) Before Work | TMH (≤0.2 mm) After Work | NIKBUT (<10 s) Before Work | NIKBUT (<10 s) After Work | ||||||
|---|---|---|---|---|---|---|---|---|---|
| Variable | OR (95%CI) | p | OR (95%CI) | p | OR (95%CI) | p | OR (95%CI) | p | |
| Air temperature (°C) | 1.024 (1.01–1.04) | 0.03 | 1.107 (1.073–1.142) | <0.001 | 0.964 (0.928–1.001) | 0.057 | 0.977 (0.939–1.015) | 0.234 | |
| Relative air humidity (%) | 0.995 (0.99–0.99) | 0.05 | 0.995 (0.989–1.002 | 0.192 | 1.004 (0.996–1.012) | 0.357 | 0.992 (0.984–1.001) | 0.067 | |
| Lighting intensity (lux) | 1.008 (0.99–1.02) | 0.23 | 0.997 (0.989–1.016 | 0.744 | 1.003 (0.981–1.026) | 0.806 | 0.987 0.965–1.010) | 0.273 | |
| Age | 1.002 (0.99–1) | 0.32 | 0.998 (0.992–1.004) | 0.583 | 1.004 (0.997–1.011) | 0.295 | 1.008 (1.000–1.015) | 0.037 | |
| Working in an air-conditioned room | No | Reference | – | Reference | – | Reference | – | Reference | – |
| Yes | 1.011 (0.92–1.1) | 0.8 | 1.076 (0.952–1.216) | 0.242 | 0.965 (0.833–1.119) | 0.638 | |||
| Time working at a computer | <4 h | Reference | – | Reference | – | Reference | – | Reference | – |
| >4 h | 1.024 (0.95–1.09) | 0.5 | 0.982 (0.891–1.083) | 0.716 | 1.092 (0.971–1.229) | 0.144 | 1.06 (0.940–1.196) | 0.344 | |
| Sex | F | Reference | – | Reference | – | Reference | – | Reference | – |
| M | 1.014 (0.88–1.16) | 0.84 | 1.168 (0.962–1.419) | 0.118 | 0.738 (0.583–0.933) | 0.012 | 0.807 (0.645–1.026) | 0.082 | |
| Lighting | Natural | Reference | – | Reference | – | Reference | – | Reference | – |
| Artificial | 0.992 (0.91–1.07) | 0.86 | 0.953 (0.845–1.075) | 0.432 | 1.034 (0.894–1.196) | 0.652 | 0.974 (0.839–1.130) | 0.726 | |
| MGD | OSDI | DRY EYE | Schirmer Test (<10 mm) | ||||||
|---|---|---|---|---|---|---|---|---|---|
| Variable | OR (95%CI) | p | OR (95%CI) | p | OR | p | OR (95%CI) | p | |
| Air temperature (°C) | 1.003 (0.972–1.034) | 0.865 | 1.001 (0.968–1.035) | 0.943 | 0.992 (0.954–1.033) | 0.706 | 1.038 (1.005–1.071) | 0.024 | |
| Relative air humidity (%) | 0.99954 (0.993–1.006) | 0.892 | 0.998 (0.991–1.005) | 0.537 | 1.001 (0.993–1.01) | 0.75 | 1.000 (0.993–1.007) | 0.949 | |
| Lighting intensity (lux) | 1.00013 (0.982–1.018) | 0.988 | 1.016 (0.996–1.036) | 0.116 | 1.002 (0.979–1.026) | 0.837 | 1.032 (1.013–1.051) | 0.001 | |
| Age | 1.00628 (1.000–1.012) | 0.035 | 1.013 (1.007–1.02) | <0.001 | 1.00782 (1.0028–101542) | 0.043 | 1.008 (1.002–1.014) | 0.013 | |
| Working in an air-conditioned room | No | Reference | – | Reference | – | Reference | – | Reference | – |
| Yes | 0.932 (0.827–1.05) | 0.246 | 1.255 (1.103–1.428) | 0.001 | 1.119 (0.959–1.307) | 0.155 | 1.097 (0.969–1.242) | 0.144 | |
| Time working at a computer | <4 h | Reference | – | Reference | – | Reference | – | Reference | – |
| >4 h | 1.181 (1.074–1.299) | 0.001 | 1.058 (0.954–1.173) | 0.285 | 1.103 (0.975–1.249) | 0.121 | 1.186 (1.074–1.130) | 0.001 | |
| Sex | F | Reference | – | Reference | – | Reference | – | Reference | – |
| M | 1.014 (0.838–1.227) | 0.886 | 1.193 (0.971–1.466) | 0.094 | 0.865 (0.676–1.107) | 0.25 | 1.169 (0.960–1.425) | 0.121 | |
| Lighting | Natural | Reference | – | Reference | – | Reference | – | Reference | – |
| Artificial | 1.112 (0.989–1.251) | 0.078 | 1.052 (0.926–1.195) | 0.437 | 0.967 (0.830–1.126) | 0.663 | 1.215 (1.076–1.373) | 0.002 | |
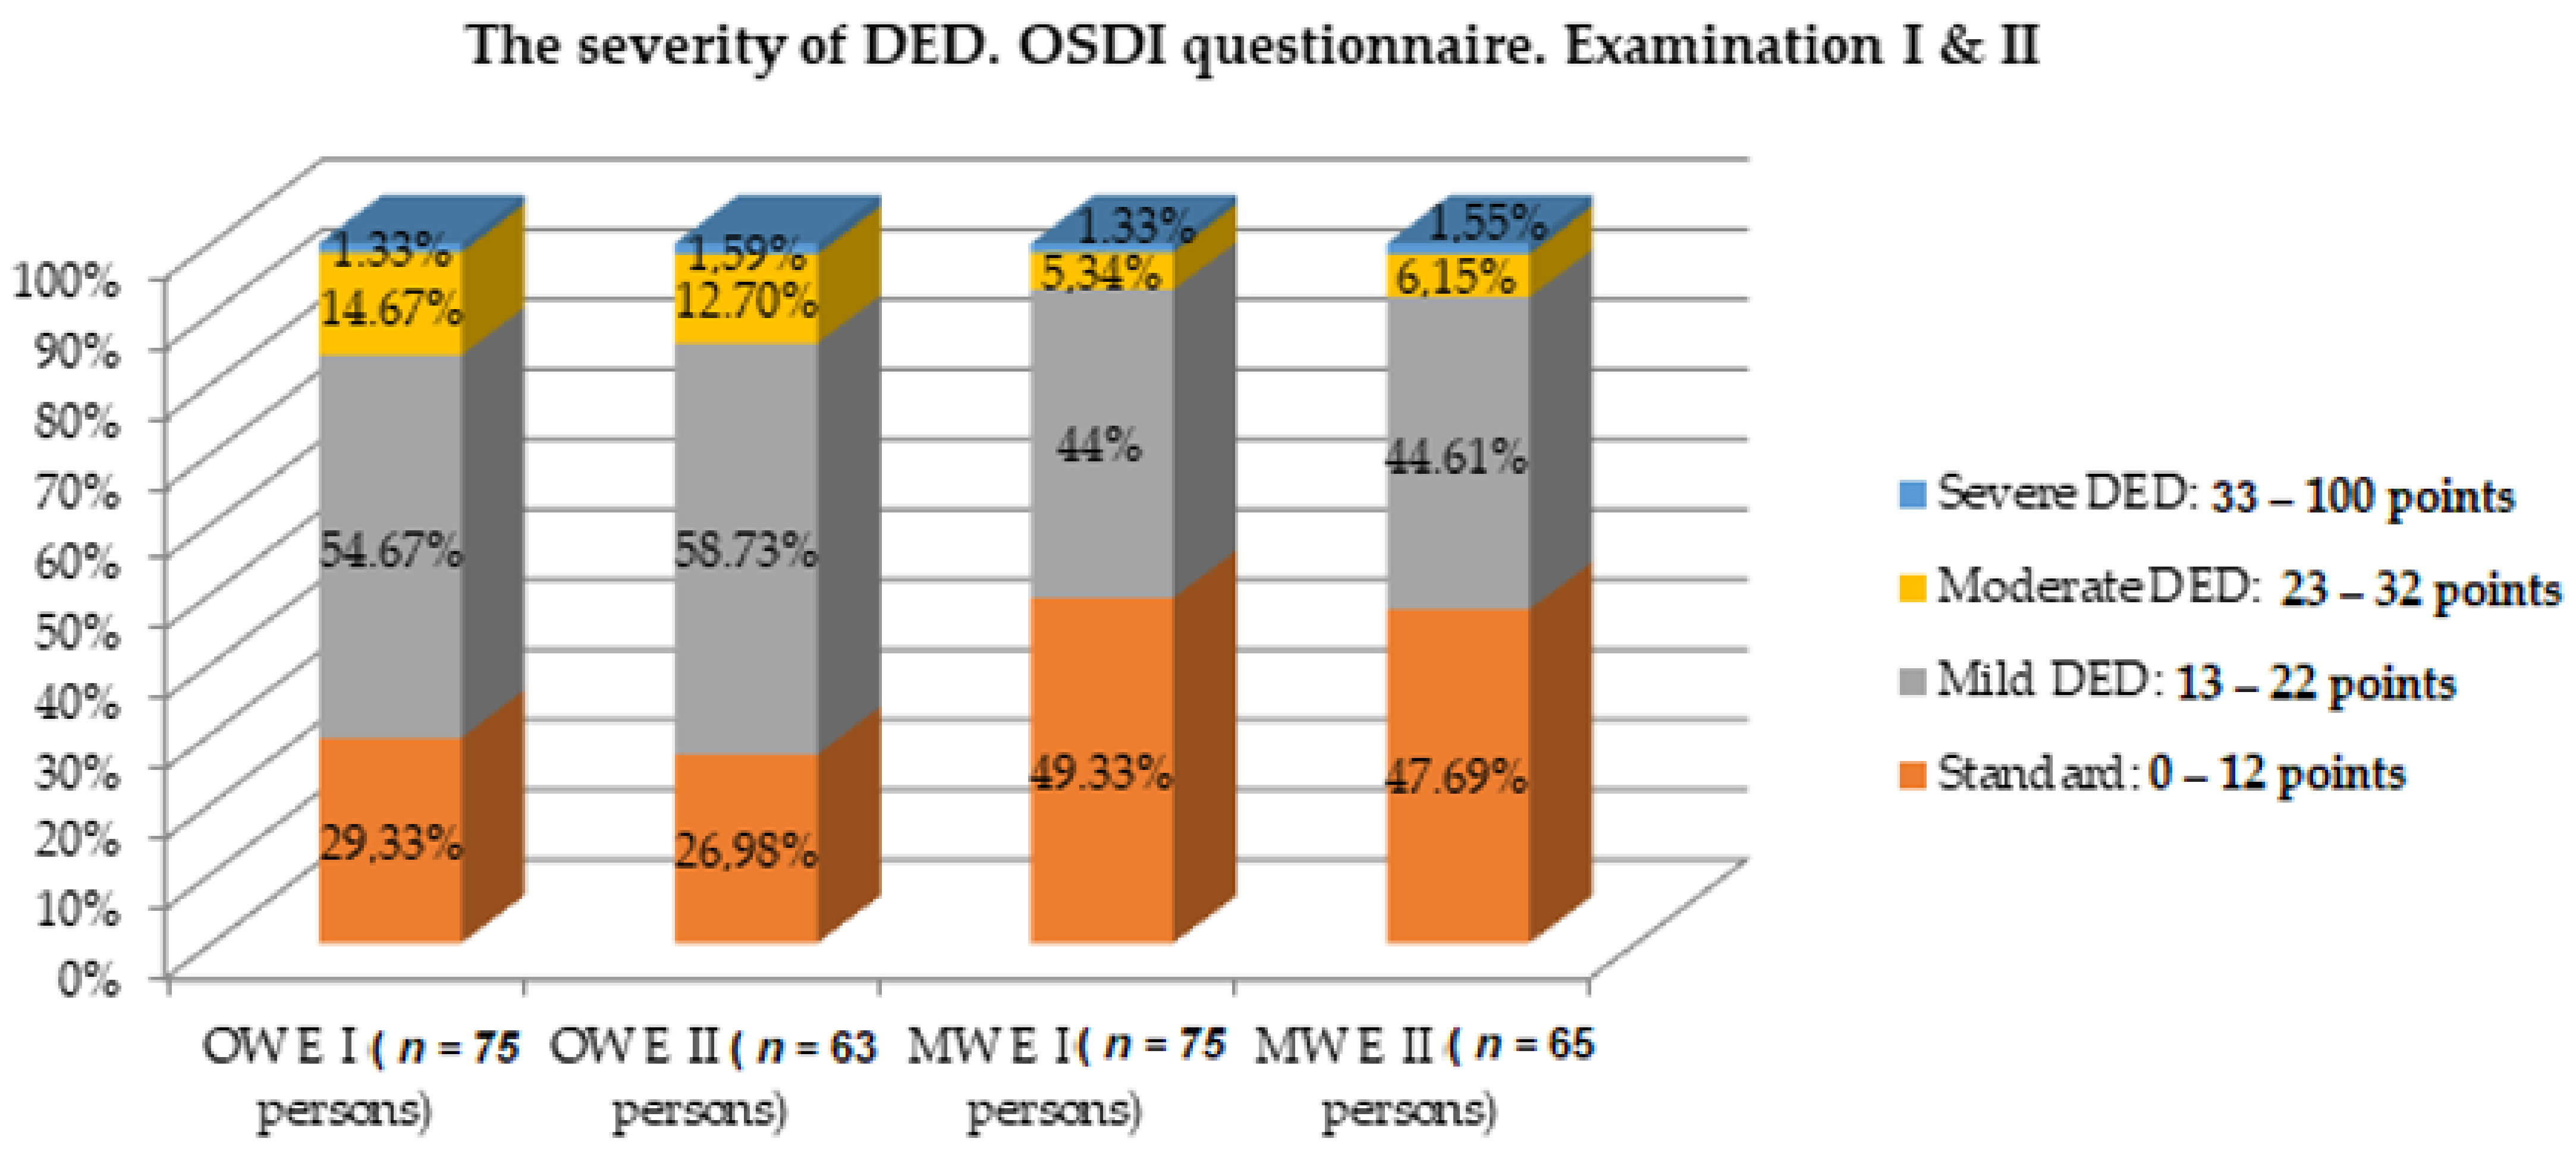
| The Severity of DED OSDI Questionnaire | OW Group | MW Group | ||||||||
|---|---|---|---|---|---|---|---|---|---|---|
| E I (n = 75) | E II (n = 63) | p * | E I (n = 75) | E II (n = 65) | p * | |||||
| N | % | n | % | n | % | n | % | |||
| Standard: 0–12 points | 22 | 29.33 | 17 | 26.98 | 0.948 | 37 | 49.33 | 31 | 47.69 | 0.783 |
| Mild DED: 13–22 points | 41 | 54.67 | 37 | 58.73 | 33 | 44 | 29 | 44.61 | ||
| Moderate DED: 23–32 points | 11 | 14.67 | 8 | 12.7 | 4 | 5.34 | 4 | 6.15 | ||
| Severe DED: 33–100 points | 1 | 1.33 | 1 | 1.59 | 1 | 1.33 | 1 | 1.55 | ||
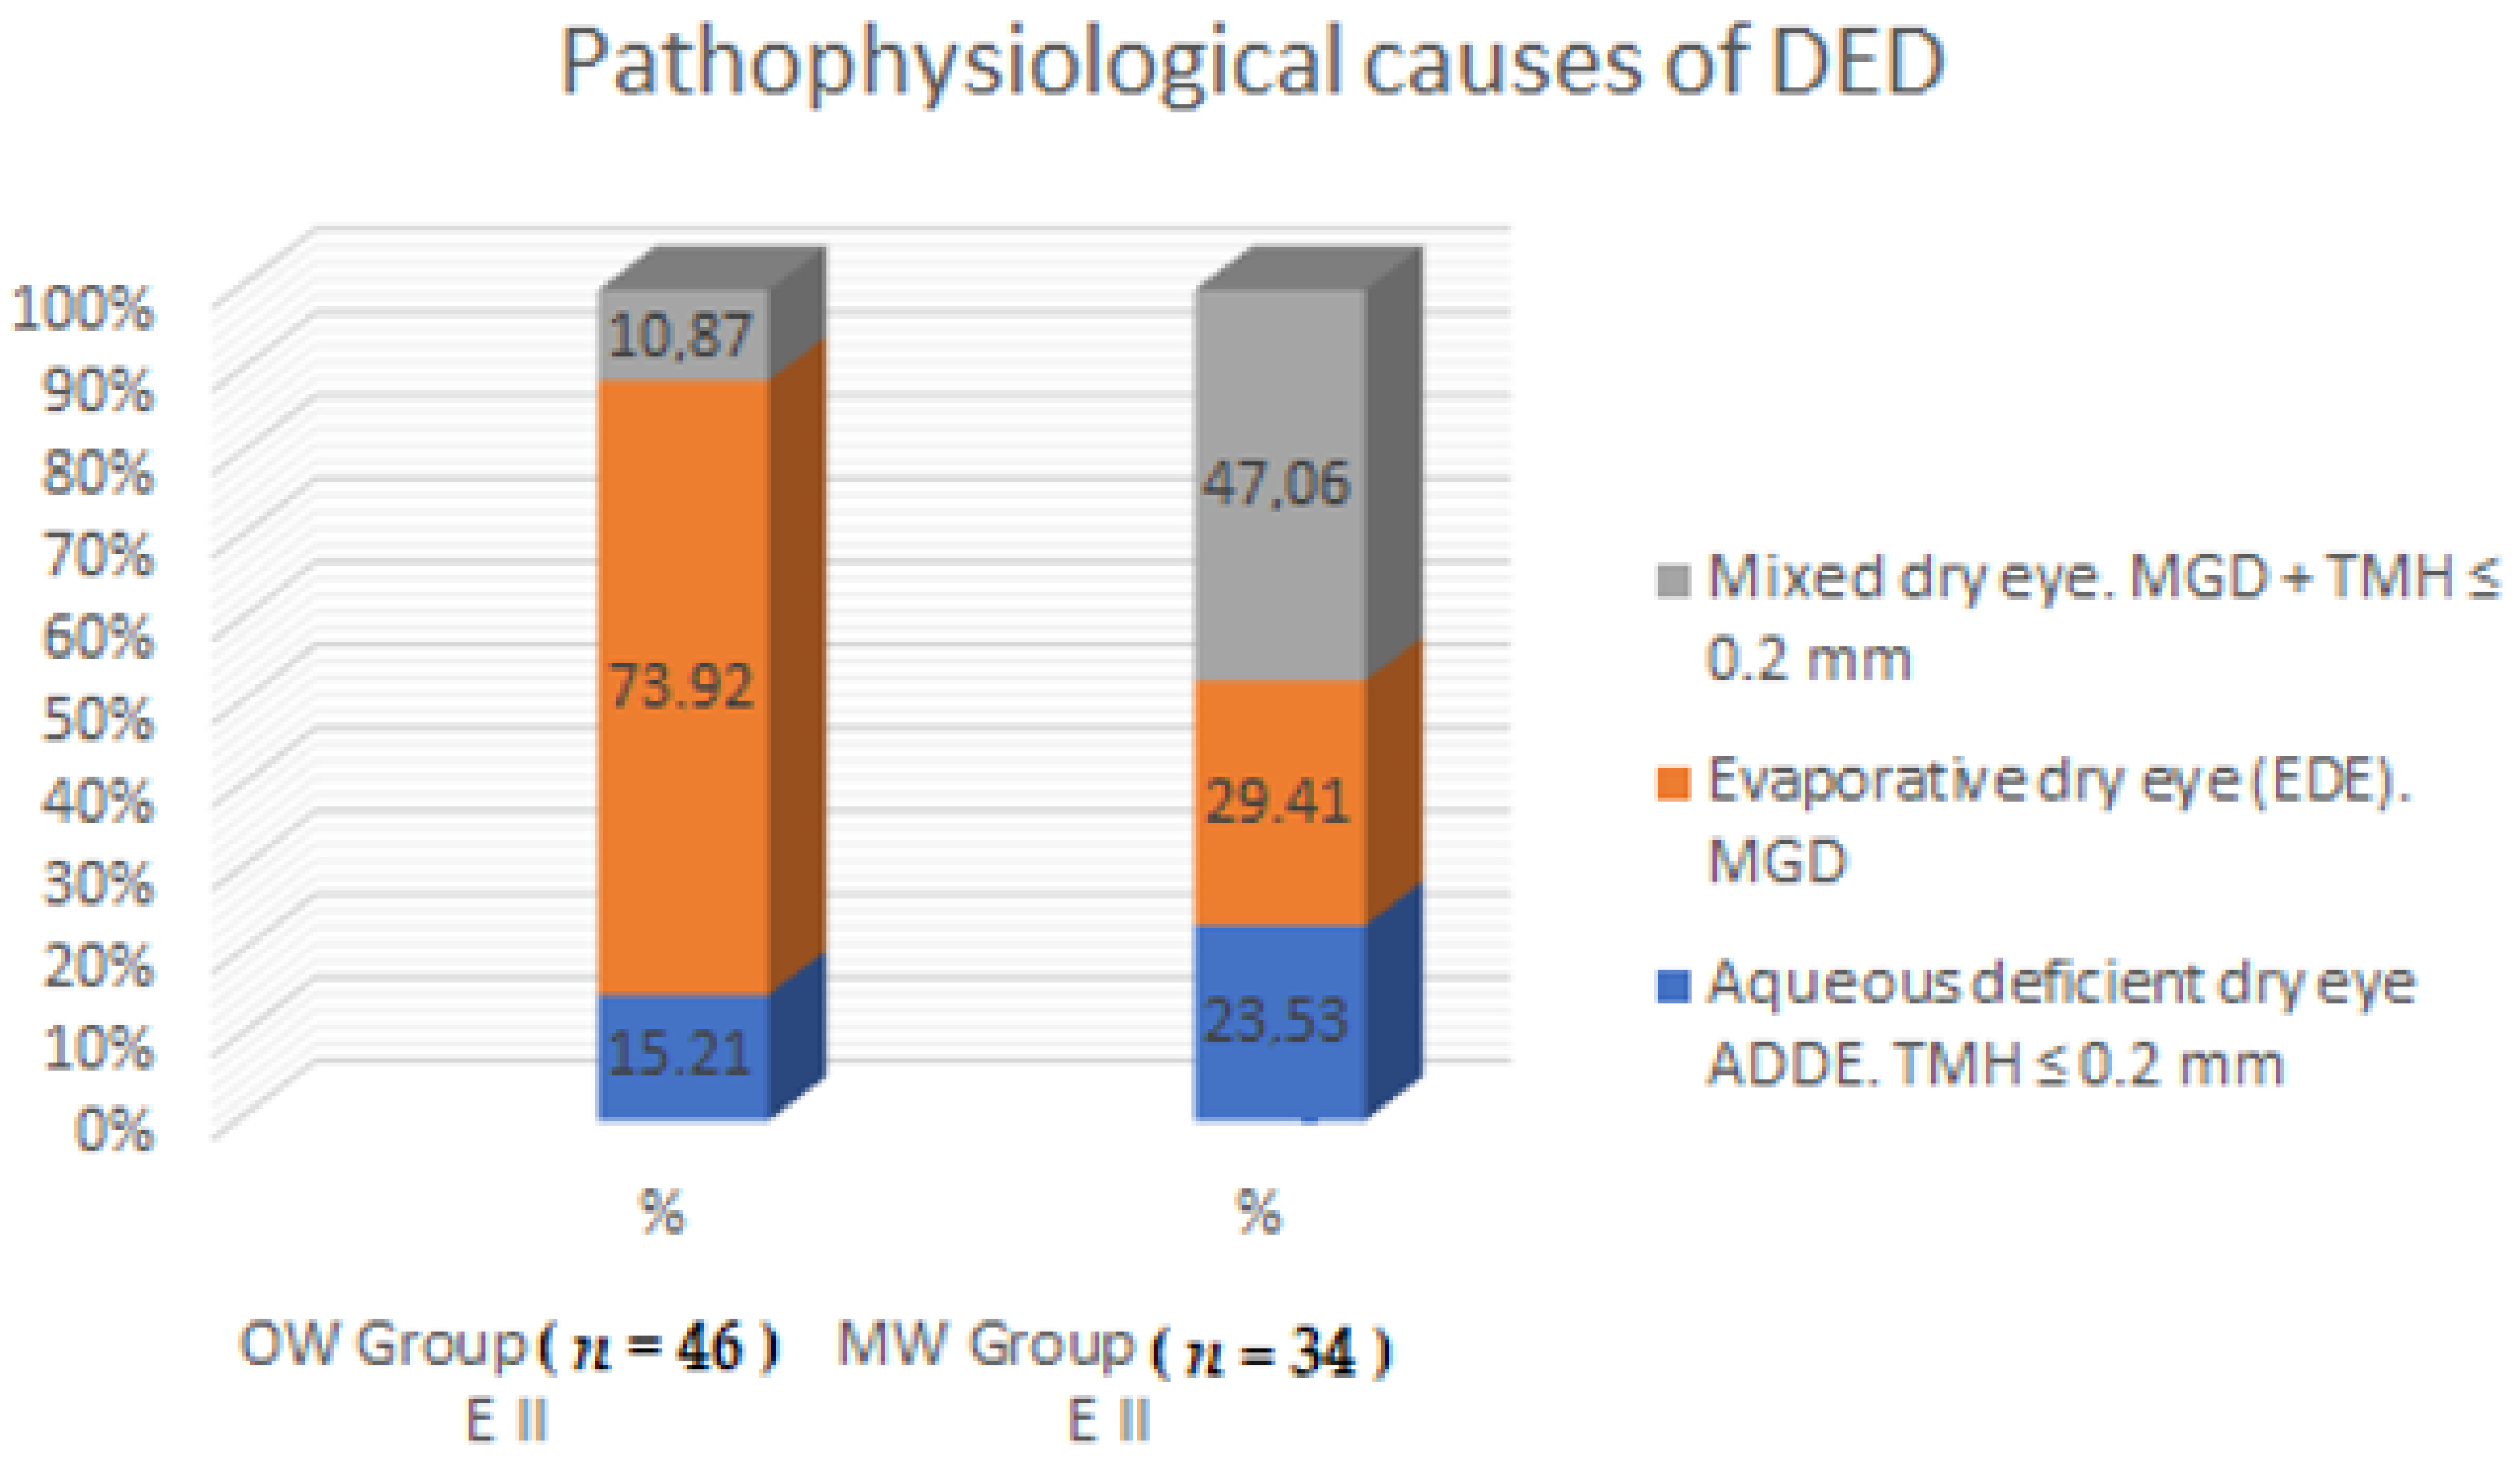
| Pathophysiological Causes of DED | OW Group (n = 46); E II | MW Group (n = 34); E II | p * | ||
|---|---|---|---|---|---|
| N | % | n | % | ||
| Aqueous deficient dry eye (ADDE), TMH ≤ 0.2 mm | 7 | 15.21 | 8 | 23.53 | 0.001 |
| Evaporative dry eye (EDE), MGD | 34 | 73.92 | 10 | 29.41 | |
| Mixed dry eye, MGD + TMH ≤ 0.2 mm | 5 | 10.87 | 16 | 47.06 | |
Publisher’s Note: MDPI stays neutral with regard to jurisdictional claims in published maps and institutional affiliations. |
© 2021 by the authors. Licensee MDPI, Basel, Switzerland. This article is an open access article distributed under the terms and conditions of the Creative Commons Attribution (CC BY) license (http://creativecommons.org/licenses/by/4.0/).
Share and Cite
Chlasta-Twardzik, E.; Górecka-Nitoń, A.; Nowińska, A.; Wylęgała, E. The Influence of Work Environment Factors on the Ocular Surface in a One-Year Follow-Up Prospective Clinical Study. Diagnostics 2021, 11, 392. https://0-doi-org.brum.beds.ac.uk/10.3390/diagnostics11030392
Chlasta-Twardzik E, Górecka-Nitoń A, Nowińska A, Wylęgała E. The Influence of Work Environment Factors on the Ocular Surface in a One-Year Follow-Up Prospective Clinical Study. Diagnostics. 2021; 11(3):392. https://0-doi-org.brum.beds.ac.uk/10.3390/diagnostics11030392
Chicago/Turabian StyleChlasta-Twardzik, Edyta, Aleksandra Górecka-Nitoń, Anna Nowińska, and Edward Wylęgała. 2021. "The Influence of Work Environment Factors on the Ocular Surface in a One-Year Follow-Up Prospective Clinical Study" Diagnostics 11, no. 3: 392. https://0-doi-org.brum.beds.ac.uk/10.3390/diagnostics11030392