Article

Survival Rates of Patients with Non-Small Cell Lung Cancer Depending on Lymph Node Metastasis: A Focus on Saliva

by
Lyudmila V. Bel’skaya
1,*,
Elena A. Sarf
1 and
Victor K. Kosenok
2
1
Biochemistry Research Laboratory, Omsk State Pedagogical University, 644099 Omsk, Russia
2
Department of Oncology, Omsk State Medical University, 644099 Omsk, Russia
*
Author to whom correspondence should be addressed.
Submission received: 9 March 2021 / Revised: 26 April 2021 / Accepted: 19 May 2021 / Published: 20 May 2021

Abstract

:
The aim of this study was to compare overall survival (OS) rates at different pN stages of NSCLC depending on tumor characteristics and to assess the applicability of saliva biochemical markers as prognostic signs. The study included 239 patients with NSCLC (pN0-120, pN1-51, pN2-68). Saliva was analyzed for 34 biochemical indicators before the start of treatment. For pN0, the tumor size does not have a prognostic effect, but the histological type should be taken into account. For pN1 and pN2, long-term results are significantly worse in squamous cell cancer with a large tumor size. A larger volume of surgical treatment reduces the differences between OS. The statistically significant factors of an unfavorable prognosis at pN0 are the lactate dehydrogenase activity <1294 U/L and the level of diene conjugates >3.97 c.u. (HR = 3.48, 95% CI 1.21–9.85, p = 0.01541); at pN1, the content of imidazole compounds >0.296 mmol/L (HR = 6.75, 95% CI 1.28–34.57, p = 0.00822); at pN2 levels of protein <0.583 g/L and Schiff bases >0.602 c.u., as well as protein >0.583 g/L and Schiff bases <0.602 c.u. (HR = 2.07, 95% CI 1.47–8.93, p = 0.04351). Using salivary biochemical indicators, it is possible to carry out stratification into prognostic groups depending on the lymph node metastasis.

1. Introduction

Approximately 85% of lung cancers are non-small cell lung cancer (NSCLC). The most important parameters that determine treatment and survival in this group are the stage of the disease and metastases in the lymph nodes [1,2]. The degree of lymphogenous metastasis of NSCLC not only affects the prognosis of patients, but also largely determines the optimal treatment tactics [1]. Therefore, at stage pN0–1 the first and main stage of treatment is surgery, at pN3-chemotherapy and radiotherapy. The tactics of treating patients with pN2 have not yet been fully determined and are the subject of active discussion in the literature [3,4]. Recent practice guidelines consider chemotherapy and radiation therapy to treat patients with pN2, and do not recommend isolated or primary surgery [5]. Some supporters of reducing the volume of surgery consider it possible to apply individual schemes of lymph node dissection, focusing on the frequency of metastasis, the size and location of the tumor, the form of growth, and topography of the lymph nodes [6,7]. However, in patients with an early clinical stage of NSCLC, metastases in the lymph nodes are sometimes found during histopathological examination [8]. At the same time, even within one stage pN, the survival rate varies greatly depending on the size, histological type, degree of differentiation of the tumor and several other factors [9].
We have previously shown that several biochemical indicators of saliva can act as prognostic signs in NSCLC [10]. The aim of this study was to compare overall survival rates at different pN stages of NSCLC, depending on the characteristics of the tumor, and to assess the applicability of saliva biochemical indicators as prognostic signs.

2. Materials and Methods

2.1. Patient Population

The work is based on the results of examination and treatment of 320 patients (64 women, 256 men) admitted to the thoracic department of the Clinical Oncological Dispensary in Omsk in the period 2014–2017. Patients were enrolled after informed consent and the study was performed following the approval from the ethical committee of the Omsk Regional Clinical Oncological Dispensary (21 July 2016, Protocol No. 15) and in accordance with Helsinki principles.
Radical operations were performed in 191 patients (59.7%), including in the volume of lobectomy/bilobectomy (n = 163), pneumonectomy (n = 28). The combined treatment was required for 100 patients (31.3%). The indication for combined treatment, despite the radical nature of the operation, was the presence of metastases in the intrathoracic lymph nodes (N1, N2). As the second stage of treatment, external beam therapy was used up to a total focal dose of 46 Gy. Radiation treatment in an independent version was carried out in 43 patients (13.4%), 39 patients (12.2%) received chemotherapy, 19 patients (5.9%) received combined (radiation + chemotherapy). Based on the diagnostic results, special methods of treatment are not indicated in 28 patients (8.8%).
After histological verification, NSCLC was confirmed in all patients (133-squamous cell lung cancer, 187-adenocarcinoma). Additionally, we took into account the morphological forms of tumor growth: central (97 patients), peripheral (216 patients) and mediastinal (7 patients). Distant metastases were identified in 81 patients, so they were excluded from the study. The remaining 239 patients, depending on the lymph node metastases, were distributed as follows: pN0-120 (50.2%), pN1-51 (21.3%), pN2-68 (28.5%) patients. There were no gender and age differences between the groups of patients according to the status of lymph node metastases. The average age of the patients was 61.0 ± 1.34, 60.1 ± 2.04, and 59.1 ± 1.94 years for pN0, pN1, and pN2, respectively.

2.2. Saliva Analysis

Saliva samples were collected at baseline, right before the start of treatment. Collection of saliva samples was carried out on an empty stomach after rinsing the mouth with water in the interval of 8–10 am by spitting into sterile polypropylene tubes, the salivation rate (mL/ min) was calculated. Saliva samples were centrifuged (10,000× g for 10 min) (CLb-16, Moscow, Russia), after which biochemical analysis was immediately performed without storage and freezing using the StatFax 3300 semi-automatic biochemical analyzer [11]. In all saliva samples, 34 biochemical parameters were determined, including pH, electrolyte levels, parameters of protein and lipid metabolism, and activity of metabolic and antioxidant enzymes as described previously [10].

2.3. Statistical Analysis

The total follow-up time was 6 years; the median follow-up time was 42 months. The patient’s overall survival (OS) was assessed from the date of hospitalization to the date of the last observation (censored) or the date of death of the patient (complete). OS was assessed using the Kaplan–Meier method with the presentation of survival curves and the calculation of the significance of differences by Log-rank (Statistica 10.0, StatSoft, Tulsa, OK, USA). Correction for uneven distribution according to the main initial criteria (gender, age, histological type, localization, tumor stage, treatment method) was performed using Cox regression. The description of the sample was made by calculating the median (Me) and interquartile range in the form of the 25th and 75th percentiles [LQ; UQ]. Differences were considered statistically significant at p < 0.05.
A univariate Cox proportional hazards regression analysis was initially variables carried out to investigate the relationships between salivary parameters and survival data. Finally, variables with p < 0.10 were chosen to formulate multivariate Cox proportional hazards regression models and determine the independent prognostic factors for OS. Hazard ratio (HR) was obtained with 95% confidence interval (CI). When evaluating the parameters of the regression model, those parameters for which the error was at least twice its standard error (t > 2.0) were considered statistically significant at the level of p < 0.05.

3. Results

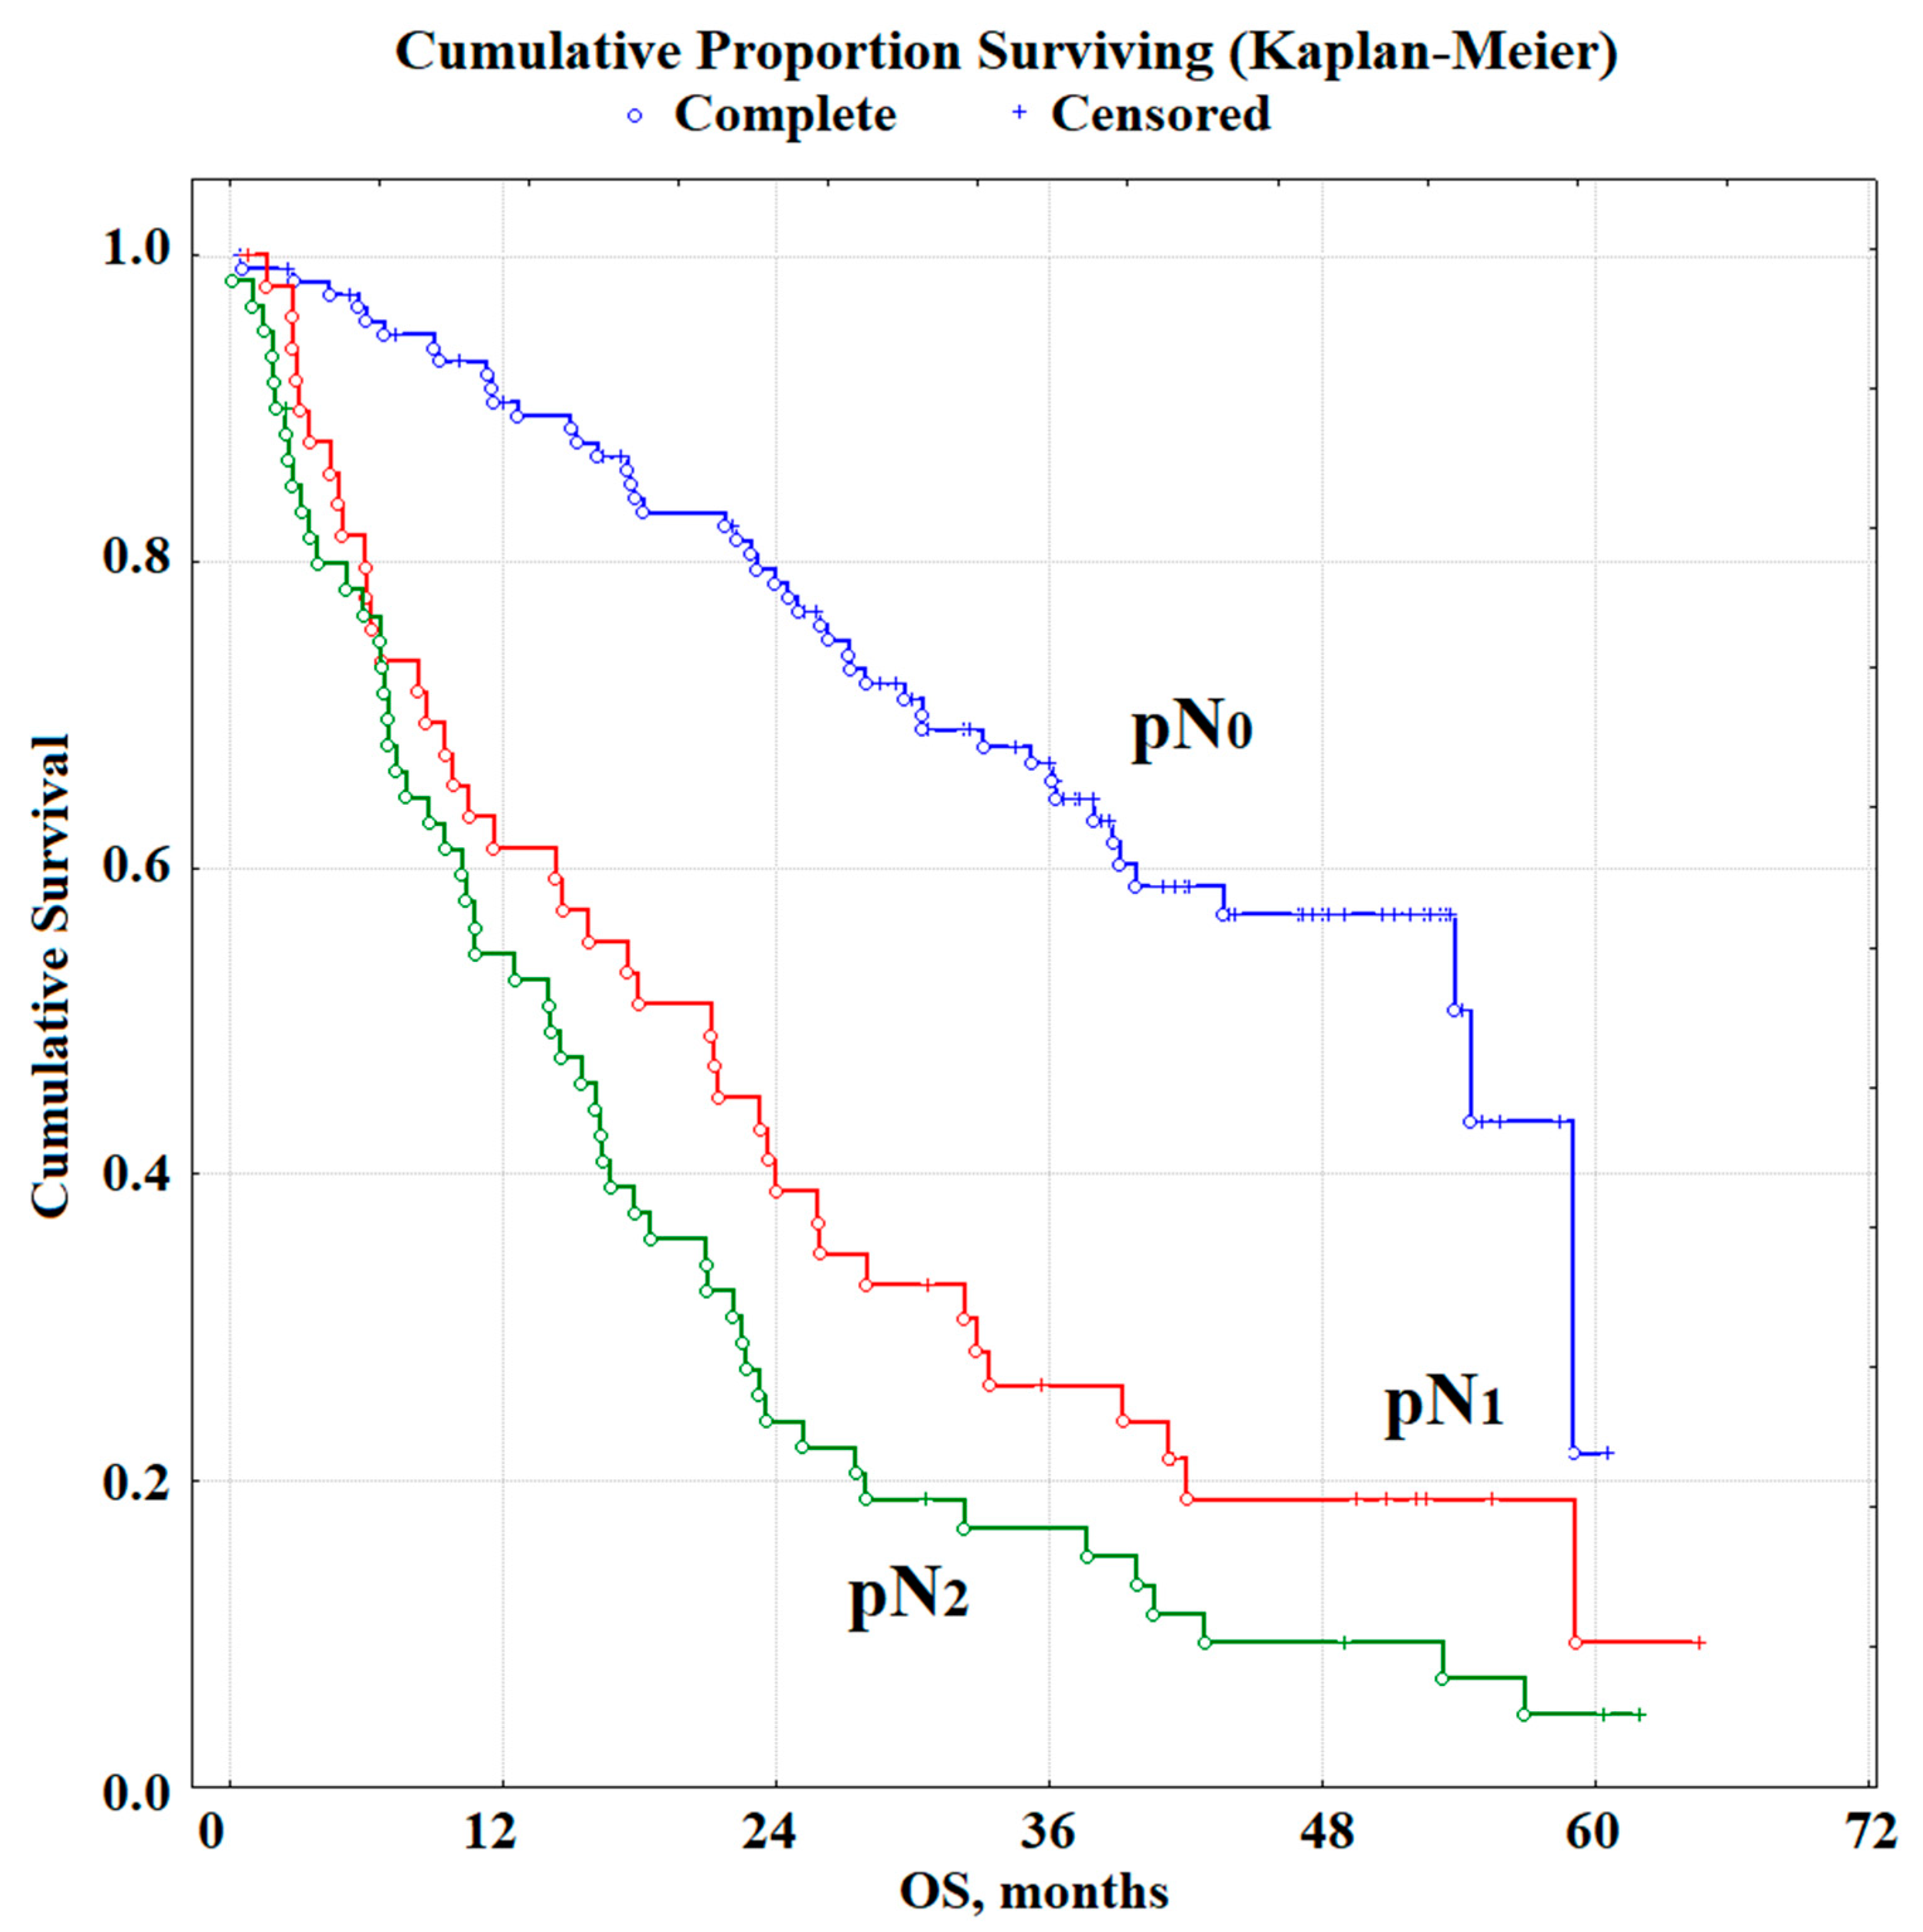
3.1. Overall Survival Rates Depending on the Stage of the Disease, Histological Type, and Morphological Growth Forms of NSCLC

Median OS in the NSCLC group was 24.9 months. For patients without lymphogenous metastasis, the median OS was 36.1 months, with pN1 metastases, this value decreased to 18.2 months, and with pN2 to 14.3 months (Figure 1). The relative risk increases for stages pN0 vs. pN1 (HR = 5.85, 95% CI 2.71–12.31) and pN0 vs pN2 (HR = 10.55, 95% CI 4.73–22.80, p < 0.00001).
At the next stage of the study, subgroups were identified taking into account the characteristics of the tumor. Thus, with an increase in tumor size, OS naturally decrease, but the differences are statistically insignificant (Table 1). For pN2, the differences between the pT3 and pT4 stages are the smallest. When compared for one tumor size, for small tumors (T2) the relative risk increases statistically significantly between pN0 and pN1, while further changes are insignificant: HR = 7.22, 95% CI 2.63–19.24 (pN0 vs. pN1) and HR = 6.64, 95% CI 2.68–16.02 (pN0 vs. pN2). For T3, comparing pN0 vs. pN1, there is a 4-fold increase in risk (HR = 4.33, 95% CI 1.29–14.25), while comparing pN0 vs. pN2, there is a 12-fold increase in relative risk (HR = 11.82, 95% CI 2.23–10.48, p < 0.00001). For stage T4 with lesion of pN1, the minimum OS were revealed.
Taking into account the histological type of NSCLC, it was shown that regardless of the presence / absence and degree of lymph node involvement, the survival rates for squamous cell carcinoma are worse than for adenocarcinoma (Table 1). It should be noted that adenocarcinoma is more often detected at the pN0 stage (57.3 vs. 41.7%), while squamous cell carcinoma predominates at the pN1 and pN2 stages (16.8 vs. 26.9% and 25.9 vs. 31.5%, respectively). In general, patients with adenocarcinoma of the lung, even with lesions of the lymph nodes, have a more favorable prognosis than patients with squamous cell carcinoma (Table 1). For squamous cell lung cancer, the survival rate sharply decreases already at pN1, and then practically does not change. Apparently, it is for squamous cell lung cancer that metastatic lesions of the ipsilateral pulmonary, bronchopulmonary and/or lymph nodes of the lung root are a factor in the unfavorable prognosis of the disease.
In addition, we noted that regardless of the degree of damage to the lymph nodes, OS in central cancer is lower than in peripheral cancer (Table 1). This difference is most pronounced for pN1. Multiple lymph node lesions are characteristic of the mediastinal form of lung cancer; therefore, this subgroup is isolated only for pN2 and is characterized by a minimum OS (Table 1).
Depending on the differentiation of lung cancer, for pN0 the OS is significantly reduced only for undifferentiated cancer (Table 1), while for pN1 and pN2 it is already for the average degree of differentiation. For highly differentiated lung cancer, OS for pN0 and pN1 practically do not differ, while for pN2 they sharply decrease. Thus, the presence of even a single metastasis in the lymph nodes is an unfavorable prognosis factor in moderate and poorly differentiated lung tumors (Table 1). For highly differentiated lung cancer, the relative risk increases for pN0 vs. pN1 (HR = 3.83, 95% CI 0.77–18.85) and pN0 vs. pN2 (HR = 9.20, 95% CI 0.91–90.23), slightly increases for average differentiation for pN0 vs. pN1 (HR = 1.90, 95% CI 0.37–9.72) and increases statistically significantly for pN0 vs. pN2 (HR = 7.14, 95% CI 1.35–36.83). For poorly differentiated lung tumors, the risk increases for pN0 vs. pN1 (HR = 8.50, 95% CI 1.50–46.81) and pN0 vs. pN2 (HR = 12.28, 95% CI 3.23–45.10), for undifferentiated cancer we observe a similar trend: for pN0 vs. pN1 HR = 8.94 (95% CI 1.56–49.84) and pN0 vs. pN2 HR = 10.29 (95% CI 2.28–45.07, p < 0.00001).

3.2. The Predictive Value of the Type of Treatment

For pN0, radical surgical and combined treatment is used; in the second case, OS is statistically significantly worse (Table 2). It is interesting to note that with lobectomy, including extended lobectomy, OS decreases with the transition from pN0 to pN1, but remains at the same level for pN2 (Table 2). For pneumonectomy, OS changes are not significant regardless of the degree of lymph node involvement (Table 2).

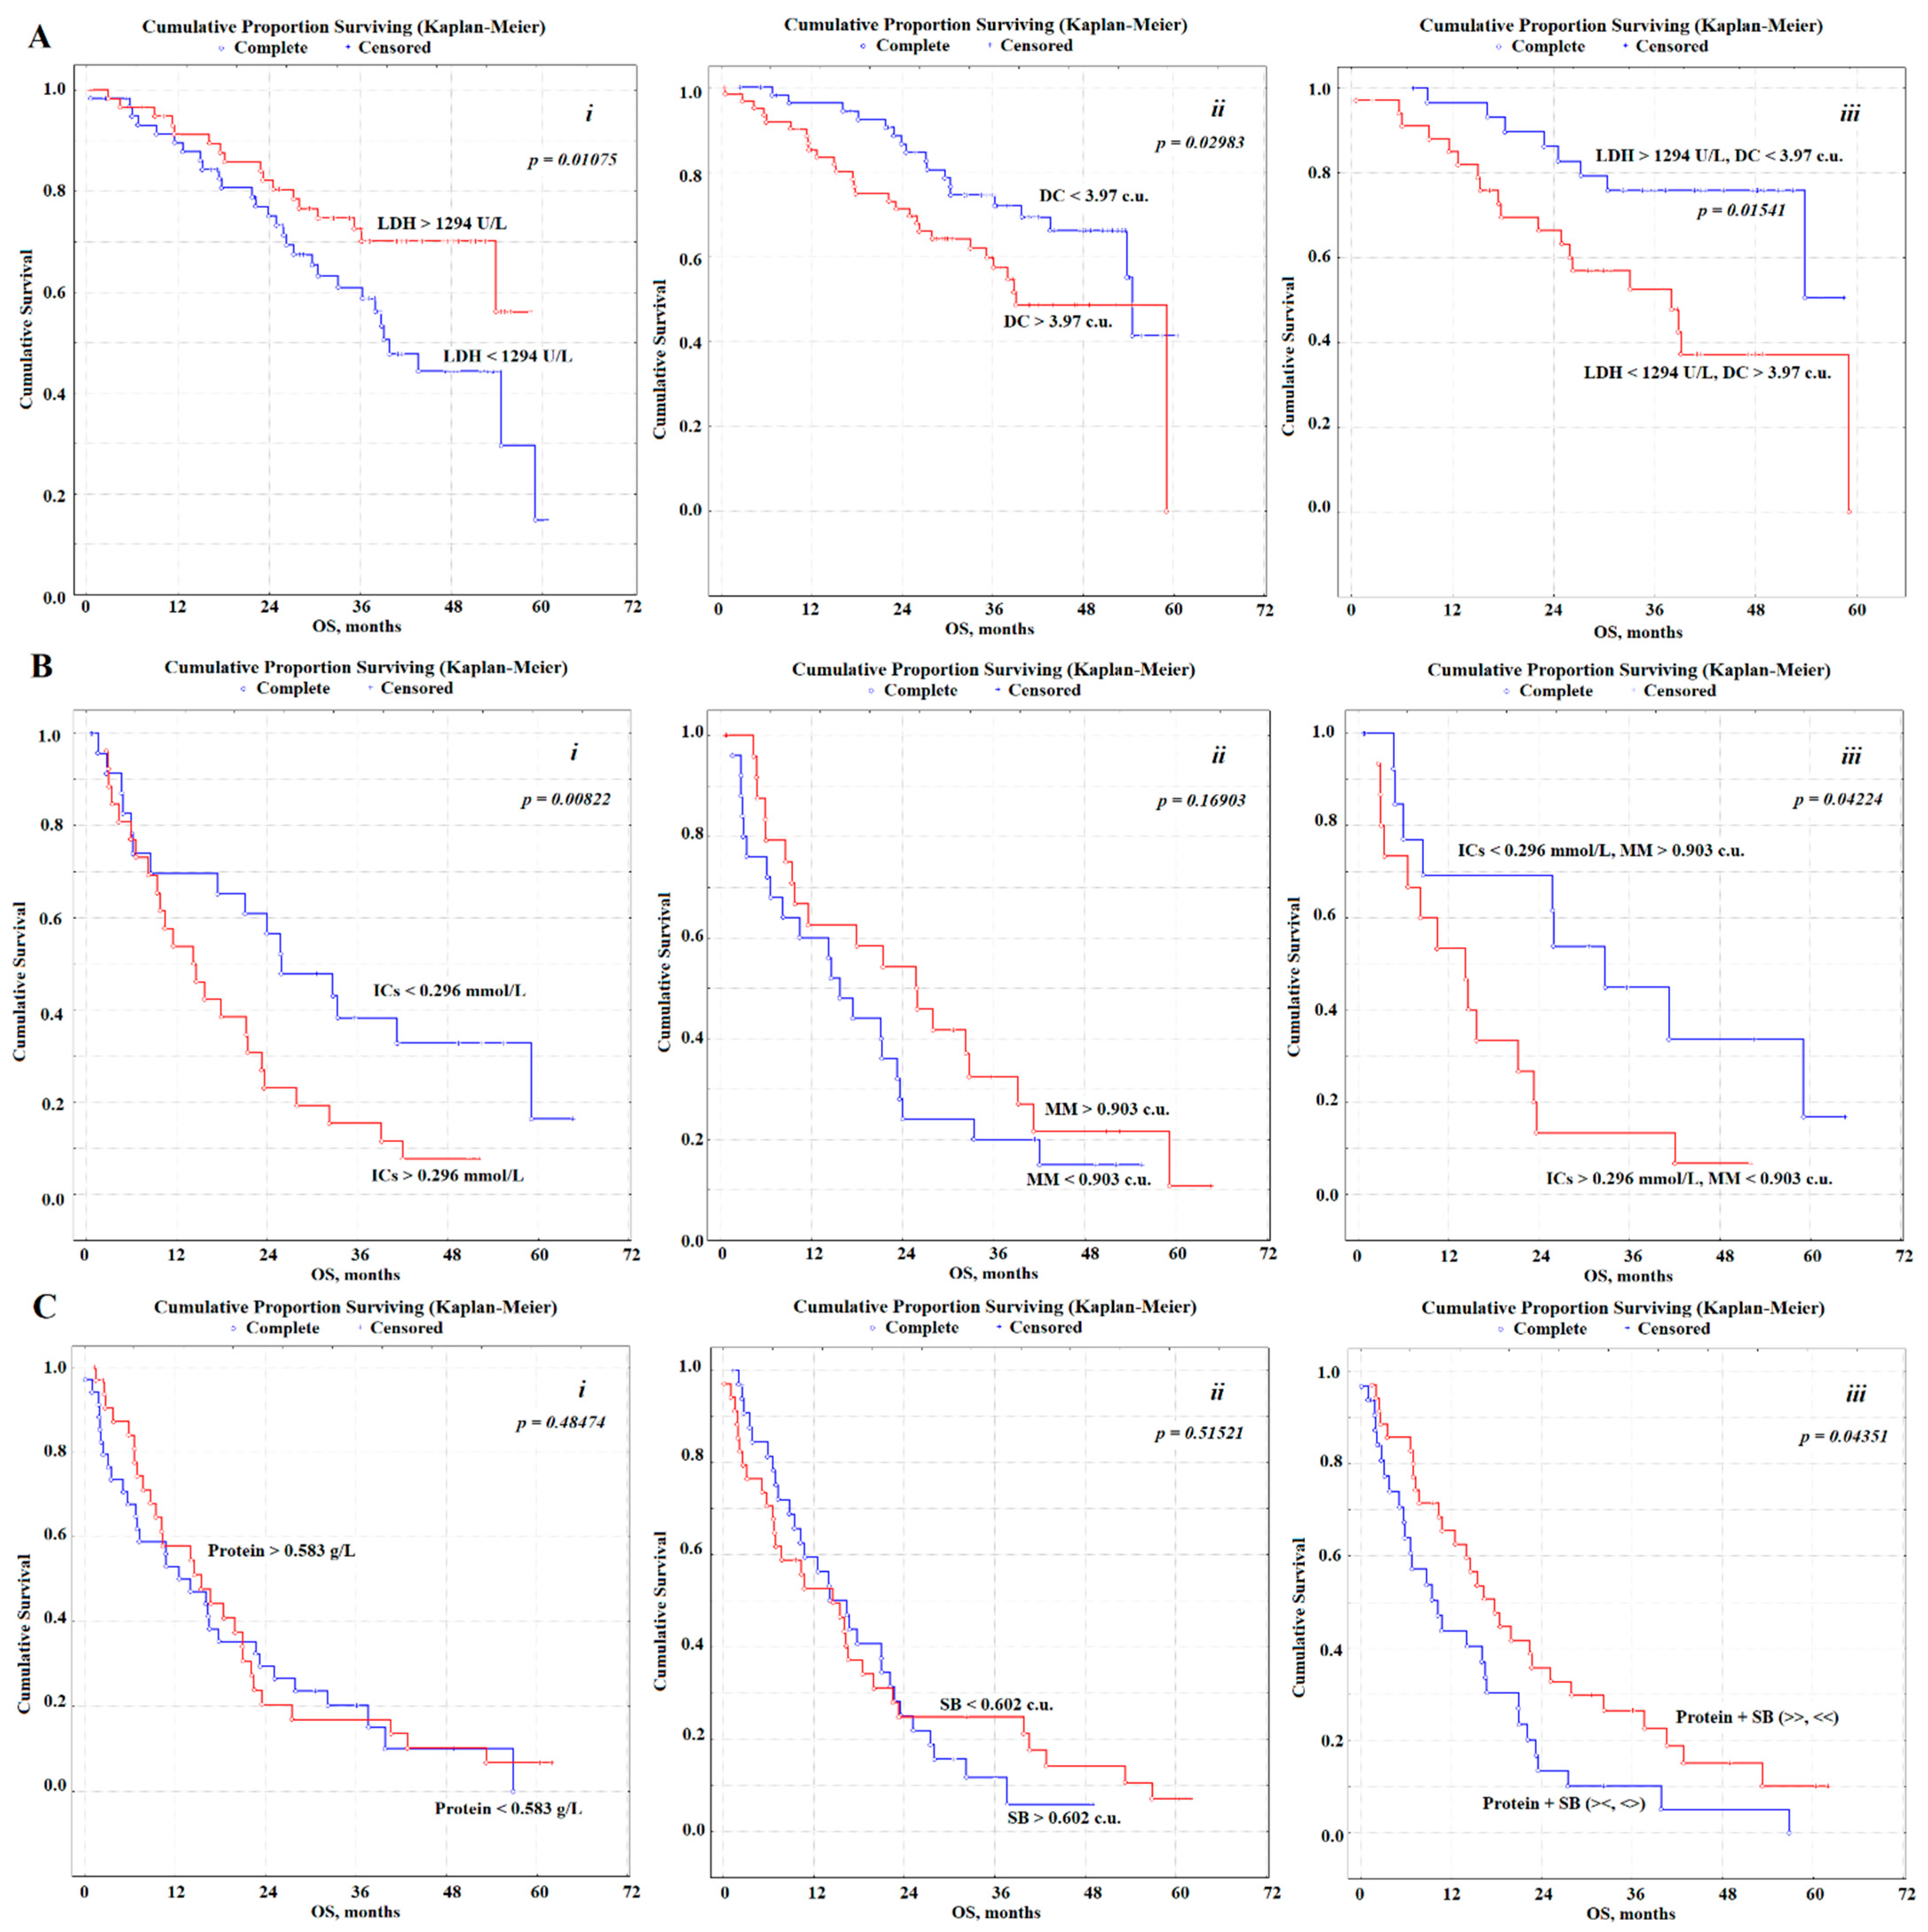
3.3. Predictive Value of Saliva Biochemical Indicators

By constructing a Cox regression model, we selected indicators that have a potential prognostic value in NSCLC at various pN stages (Figure 2). For pN0, such indicators include the activity of lactate dehydrogenase (LDH) and the level of diene conjugates (DC), for pN1—the level of imidazole compounds (ICs) and medium molecular weight toxins (MM), for pN2—the content of total protein and Schiff bases (SB) (Table 3).
When assessing the prognostic value of saliva biochemical indicators, the values of the median and interquartile range were used for the corresponding indicators in this group. At pN0, the LDH activity was 1294.0 [635.6; 1900.0] U/L, DC level was 3.97 [3.76; 4.19] c.u. Values of indicators LDH > 1294 U/L and DC < 3.97 c.u. are independent prognostically favorable signs (Table 3). For patients with salivary LDH activity before the start of treatment, more than 1294 U/L 1-, 3-, and 5-year OS were 91.4, 70.2 and 56.0%, less than 1294 U/L-89.7, 60.8 and 14.8% respectively. If the DC level is less than 3.97 c.u. OS was significantly higher than at a content of more than 3.97 c.u. (96.3, 74.5 and 41.4% vs. 85.2, 57.5 and 0%). With a favorable prognosis (LDH > 1294 U/L, DC < 3.97 c.u.) 1-, 3-, and 5-years OS was 96.5, 75.9, and 50.6%, whereas with an unfavorable (LDH < 1294 U/L, DC > 3.97 c.u.) OS was 84.8, 52.4 and 0%, respectively.
It should be noted that with an LDH activity of more than 1900 U/L, the relative risk was 3.8 times lower than with an activity of less than 636 U/L. The resulting value is statistically significant and can be used as an independent option (Table 3).
In the case of pN1, the content of imidazole compounds was ICs 0.296 [0.182; 0.455] mmol/L, middle molecular toxins MM-0.903 [0.832; 0.989] c.u. An independent prognostic sign is only the content of imidazole compounds (Table 3). For pN1, for patients with ICs content in saliva before the start of treatment less than 0.296 mmol/L 1-, 3-, and 5-year OS were 69.6, 38.1, and 16.7%, more than 0.296 mmol/L-53.8, 15.4, and 7.7%, respectively. If the MM level is less than 0.903 c.u. OS was slightly lower than at an MM content of more than 0.903 c.u. (60.0, 20.0 and 15.0% vs. 62.5, 32.4 and 10.8%). With a favorable prognosis (MM > 0.903 c.u., ICs < 0.296 mmol/L) for 1-, 3-, and 5-years, OS was 69.2, 44.9, and 16.7%, while with an unfavorable one, 53.3, 13.5, and 6.7%, respectively.
For pN2, the prognostic signs are protein content-0.583 [0.304; 1.044] g/L and the level of Schiff bases SB-0.602 [0.526; 0.669] c.u. Both indicators are not independent prognostic signs, therefore, combinations with unfavorable (Protein < 0.583 g/L and SB > 0.602 c.u.; Protein > 0.583 g/L and SB < 0.602 c.u.) and favorable prognosis (Protein > 0.583 g/L and SB > 0.602 c.u.; Protein < 0.583 g/L and SB < 0.602 c.u.) were considered (Table 3). For patients with a favorable prognosis, OS values were 65.5, 26.5, and 10.1%, with unfavorable ones-43.7, 10.1 and 0% for 1-, 3-, and 5-year survival rates, respectively.
We have presented the characteristics of cohorts depending on the differences in the biochemical composition of saliva with different status of lymph node involvement (Tables S1–S3). It was shown that in addition to the difference in the biochemical composition of saliva, there are no other statistically significant differences between subgroups, including age, gender, pT, histological type, growth form, type of treatment, smoking, and relapse status). The only identified difference is the lower recurrence rate in the group of patients with a favorable prognosis for the biochemical composition of saliva for pN0 (Table S1).

3.4. Multivariate Survival Analysis Using the Cox Regression Model

Multivariate analysis, including the stage of the disease (pT), histological structure, growth form, type of treatment, as well as the studied biochemical indicators for each pN group, showed that in all cases the biochemical parameters of saliva are independent factors in predicting the overall survival of patients with lung cancer (Table 4).

4. Discussion

Traditional tumor characteristics such as differentiation, tumor invasion, lymph node metastasis, and TNM (Tumor, Nodes, and Metastasis) stage classification are not the only aspects that determine the prognosis of the disease [12,13,14]. For prognostic purposes, the use of several groups of biomarkers is described. Therefore, the most significant is the study of genetic, epigenetic, proteomic, metabolic markers, as well as the profile of synthesis and the level of microRNA [15,16,17,18]. These markers are detected in tumor tissue, serum and blood plasma, and exhaled air [19,20].
In the literature, there are sporadic data on the study of the composition of saliva in lung cancer, including for prognostic purposes [21,22,23,24]. We have shown for the first time the fundamental possibility of using saliva biochemical indicators for predicting the course of lung cancer [10,25]. Of the indicators that were selected in regression analysis, only LDH was previously mentioned in the literature as a prognostic sign for blood plasma in lung cancer [26,27,28,29,30]. In this regard, comparison with literature data is not possible. It should also be noted that in previous studies we have shown that for most biochemical markers of saliva correlations with the composition of blood plasma are weak or absent altogether, therefore the values of biochemical markers of saliva should be considered to be independent and set their own criteria for norm and pathology [31].
The use of biochemical indicators of saliva allows obtaining prognostic data comparable to those for the characteristics of the tumor. In particular, in the absence of lymph node metastasis, tumor size is not a significant prognostic sign. However, the histological type of NSCLC is prognostically important; poor prognosis is associated with squamous cell lung cancer and undifferentiated cancer [32]. The statistically significant factors of unfavorable prognosis are LDH activity less than 1294 U/L and a DC level of more than 3.97 c.u. (Table 4).
With pN1, unfavorable prognosis factors include large tumor size (pT4), squamous histological type, central growth, as well as low differentiation or undifferentiated cancer (Table 1). An additional biochemical indicator in this case is the level of ICs. The concentration of ICs greater than 0.296 mmol/L is a statistically significant independent factor of poor prognosis (HR = 6.75, 95% CI 1.28–34.57, p = 0.00822). Multivariate analysis showed that the ICs level is the only independent prognostic factor for the group of patients with pN1 (Table 4).
At pN2, a poor prognosis is associated with squamous cell carcinoma, mediastinal tumor growth, and any differentiation other than highly differentiated tumors. According to our data, the size of the primary tumor does not statistically significantly affect the prognosis, which may be the result of an insufficient sample size. In the literature, age and pT stage are considered prognostically important [33]. Of the biochemical indicators, only the combination of indicators “Protein + SB” can be attributed to independent prognostic signs (Table 3 and Table 4). An unfavorable prognosis is typical for groups of patients with a protein content of less than 0.583 g/L and an SB of more than 0.602 c.u., as well as a protein level of more than 0.583 g/L and an SB of less than 0.602 c.u. (HR = 2.07, 95% CI 1.47–8.93, p = 0.04351).
In all cases, the type of treatment is a significant prognostic factor, which is quite natural. It is interesting to note that with an increase in the volume of surgery, the differences in OS medians decrease (Table 2). Thus, in the case of pneumonectomy, the median OS is 18.5, 17.8, and 17.1 months for stages pN0, pN1, and pN2, respectively.
An interesting result of our study is that with different degrees of damage to the lymph nodes, different biochemical parameters of saliva are used as prognostically important parameters. It can be assumed that this is due to the depth of the metabolic changes occurring in lung cancer. Therefore, in the absence of damage to the lymph nodes, the prognosis is determined by the activity of LDH as the main metabolic enzyme, the activity of which changes in many types of cancer, including lung cancer. The level of diene conjugates, which characterize the content of primary lipid peroxidation products, is also prognostically important. At pN1, the predictive factors include the total content of protein toxins and imidazole compounds, while at pN2 toxic Schiff bases, which are the end products of lipid peroxidation, are prognostically important. However, this hypothesis requires additional verification in the course of further research.
The limitations of the study are related to the fact that it was not assessed whether the lesions of the pN1 and pN2 lymph nodes are single or multiple [34]. The limitations should also include the small sample size, which reduces the statistical significance of the data obtained and limits the possibility of dividing into subgroups. Further studies are warranted to confirm our observation.

5. Conclusions

In the absence of metastases in regional lymph nodes, the size of the primary tumor has no significant prognostic effect; however, the histological type of tumor should be taken into account. For stages pN1 and pN2, long-term results are significantly worse with a large tumor size, and the presence of histology of squamous cell lung cancer critically decreases the median OS in these groups. The degree of tumor differentiation at pN0 has practically no effect on OS, whereas for all types of tumors, except for highly differentiated ones, the median OS sharply decreases at pN1 and pN2. A larger volume of surgical treatment reduces the differences between OS in the study groups. It has been shown for the first time that using biochemical indicators of saliva, additional stratification into prognostic groups can be carried out, depending on the presence / absence and the prevalence of regional metastasis.

Supplementary Materials

The following are available online at https://0-www-mdpi-com.brum.beds.ac.uk/article/10.3390/diagnostics11050912/s1, Table S1: Characteristics of cohorts depending on the differences in the chemical composition of saliva in pN0, Table S2: Characteristics of cohorts depending on the differences in the chemical composition of saliva in pN1, Table S3: Characteristics of cohorts depending on the differences in the chemical composition of saliva in pN2.

Author Contributions

Conceptualization, L.V.B. and V.K.K.; methodology, L.V.B.; validation, L.V.B. and E.A.S.; formal analysis, L.V.B.; investigation, E.A.S.; resources, V.K.K.; data curation, L.V.B.; writing—original draft preparation, L.V.B. and E.A.S.; writing—review and editing, V.K.K.; visualization, L.V.B.; supervision, L.V.B.; project administration, V.K.K. All authors have read and agreed to the published version of the manuscript.

Funding

This research received no external funding.

Institutional Review Board Statement

The study was conducted according to the guidelines of the Declaration of Helsinki, and approved by the Ethics Committee of Omsk Regional Clinical Oncological Dispensary (21 July 2016, protocol No. 15).

Informed Consent Statement

Informed consent was obtained from all subjects involved in the study.

Data Availability Statement

The data presented in this study are available on request from the corresponding author. The data are not publicly available due to they are required for the preparation of a PhD thesis.

Conflicts of Interest

The authors declare no conflict of interest.

References

  1. Goldstraw, P.; Chansky, K.; Crowley, J.; Rami-Porta, R.; Asamura, H.; Eberhardt, W.E.; Nicholson, A.G.; Groome, P.; Mitchell, A.; Bolejack, V. The IASLC Lung Cancer Staging Project: Proposals for Revision of the TNM Stage Groupings in the Forthcoming (Eighth) Edition of the TNM Classification for Lung Cancer. J. Thorac. Oncol. 2016, 11, 39–51. [Google Scholar] [CrossRef] [Green Version]
  2. Akcam, T.I.; Kaya, S.O.; Akcay, O.; Samancılar, O.; Ceylan, K.C.; Sevınc, S.; Unsal, S. Is there a survival difference between single station and multi-station N2 disease in operated non-small cell lung cancer patients? Cancer Treat. Commun. 2015, 4, 165–168. [Google Scholar] [CrossRef]
  3. Ferguson, M.K. Optimal management when unsuspected N2 nodal disease is identifi ed during thoracotomy for lung cancer: Cost-effectiveness analysis. J. Thorac. Cardiovasc. Surg. 2003, 126, 1935–1942. [Google Scholar] [CrossRef] [PubMed] [Green Version]
  4. Yokomise, H.; Gotoh, M.; Okamoto, T.; Yamamoto, Y.; Ishikawa, S.; Nakashima, T.; Masuya, D.; Liu, D.; Huang, C.L. Induction chemoradiotherapy (carboplatin-taxane and concurrent 50 Gy radiation) for bulky cN2, N3 non-small cell lung cancer. J. Thorac. Cardiovasc. Surg. 2007, 133, 1179–1185. [Google Scholar] [CrossRef] [Green Version]
  5. Robinson, L.; Ruckdeschel, J.; Wagner, H., Jr.; Stevens, C.W. Treatment of Non-small Cell Lung Cancer-Stage III A (ACCP evidence-based clinical practice guidelines). Chest 2007, 132, 243S–265S. [Google Scholar] [CrossRef] [PubMed]
  6. Ishiguro, F.; Matsuo, K.; Fukui, T.; Mori, S.; Hatooka, S.; Mitsudomi, T. Effect of selective lymph node dissection based on patterns of lobespecific lymph node metastases on patient outcome in patients with resectable non-small cell lung cancer: A large-scale retrospective cohort study applying a propensity score. J. Thorac. Cardiovasc. Surg. 2010, 139, 1001–1006. [Google Scholar] [CrossRef] [PubMed] [Green Version]
  7. Maniwa, T.; Okumura, T.; Isaka, M.; Nakagawa, K.; Ohde, Y.; Kondo, H. Recurrence of mediastinal node cancer after lobe-specific systematic nodal dissection for non-small-cell lung cancer. Eur. J. Cardiothorac. Surg. 2013, 44, 59–64. [Google Scholar] [CrossRef] [PubMed] [Green Version]
  8. Tsutani, Y.; Miyata, Y.; Nakayama, H.; Okumura, S.; Adachi, S.; Yoshimura, M.; Okada, M. Prediction of pathological node-negative clinical stage IA lung adenocarcinoma for optimal candidates undergoing sublobar resection. J. Thorac. Cardiovasc. Surg. 2012, 14, 1365–1371. [Google Scholar] [CrossRef] [PubMed] [Green Version]
  9. Chen, J.-X.; Lu, T.-Y.; Lin, Y.-S.; Fang, H.-Y.; Shih, P.-K. Prognostic effect of incongruous lymph node status in early-stage non-small cell lung cancer. Eur. J. Surg. Oncol. 2020. [Google Scholar] [CrossRef] [PubMed]
  10. Bel’skaya, L.V.; Sarf, E.A.; Kosenok, V.K.; Gundyrev, I.A. Biochemical Markers of Saliva in Lung Cancer: Diagnostic and Prognostic Perspectives. Diagnostics 2020, 10, 186. [Google Scholar] [CrossRef] [Green Version]
  11. Bel’skaya, L.V.; Kosenok, V.K.; Sarf, E.A. Chronophysiological features of the normal mineral composition of human saliva. Arch. Oral Biol. 2017, 82, 286–292. [Google Scholar] [CrossRef] [PubMed]
  12. Okiror, L.; Harling, L.; Toufektzian, L.; King, J.; Routledge, T.; Harrison-Phipps, K.; Pilling, J.; Veres, L.; Lal, R.; Bille, A. Prognostic factors including lymphovascular invasion on survival for resected non-small cell lung cancer. J. Thorac. Cardiovasc. Surg. 2018, 156, 785–793. [Google Scholar] [CrossRef] [PubMed]
  13. Molinier, O.; Goupil, F.; Debieuvre, D.; Auliac, J.-B.; Jeandeau, S.; Lacroix, S.; Martin, F.; Grivaux, M. Five-year survival and prognostic factors according to histology in 6,101 Non-Small-Cell Lung Cancer patients. Respir. Med. Res. 2020, 77, 46–54. [Google Scholar] [CrossRef] [PubMed]
  14. Grosu, H.B.; Manzanera, A.; Shivakumar, S.; Sun, S.; Gonzalez, G.N.; Ost, D.E. Survival disparities following surgery among patients with different histological types of non-small cell lung cancer. Lung Cancer 2020, 140, 55–58. [Google Scholar] [CrossRef] [PubMed]
  15. Soliman, S.E.; Alhanafy, A.M.; Habib, M.S.E.; Hagag, M.; Ibrahem, R.A.L. Serum circulating cell free DNA as potential diagnostic and prognostic biomarker in non-small cell lung cancer. Biochem. Biophys. Rep. 2018, 15, 45–51. [Google Scholar] [CrossRef]
  16. Sandfeld-Paulsen, B.; Aggerholm-Pedersen, N.; Bæk, R.; Jakobsen, K.R.; Meldgaard, P.; Folkersen, B.H.; Rasmussen, T.R.; Varming, K.; Jørgensen, M.M.; Sorensen, B.S. Exosomal proteins as prognostic biomarkers in non-small cell lung cancer. Mol. Oncol. 2016, 10, 1595–1602. [Google Scholar] [CrossRef] [Green Version]
  17. Pérez-Ramírez, C.; Cańadas-Garre, M.; Alnatsha, A.; Molina, M.Á.; Robles, A.I.; Villar, E.; Delgado, J.R.; Faus-Dáder, M.J.; Calleja-Hernández, M.Á. Interleukins as new prognostic genetic biomarkers in non-small cell lung cancer. Surg. Oncol. 2017, 26, 278–285. [Google Scholar] [CrossRef] [Green Version]
  18. Targowski, T.; Jahnz-Rozyk, K.; Owczarek, W.; Raczka, A.; Janda, P.; Szkoda, T.; Płusa, T. Telomerase activity and serum levels of p53 protein as prognostic factors of survival in patients with advanced non-small cell lung cancer. Respir. Med. 2010, 104, 1356–1361. [Google Scholar] [CrossRef] [Green Version]
  19. Cedrés, S.; Nuñez, I.; Longo, M.; Martinez, P.; Checa, E.; Torrejón, D.; Felip, E. Serum Tumor Markers CEA, CYFRA21-1, and CA-125 Are Associated with Worse Prognosis in Advanced Non–Small-Cell Lung Cancer (NSCLC). Clin. Lung Cancer 2011, 12, 172–179. [Google Scholar] [CrossRef]
  20. Prelaj, A.; Rebuzzi, S.E.; Pizzutilo, P.; Bilancia, M.; Montrone, M.; Pesola, F.; Longo, V.; Del Bene, G.; Lapadula, V.; Cassano, F.; et al. EPSILoN: A Prognostic Score Using Clinical and Blood Biomarkers in Advanced Non–Small-cell Lung Cancer Treated with Immunotherapy. Clin. Lung Cancer 2020, 21, 365–377. [Google Scholar] [CrossRef]
  21. Zhang, L.; Xiao, H.; Zhou, H.; Santiago, S.; Lee, J.M.; Garon, E.B.; Yang, J.; Brinkmann, O.; Yan, X.; Akin, D.; et al. Development of transcriptomic biomarker signature in human saliva to detect lung cancer. Cell. Mol. Life Sci. 2012, 69, 3341–3350. [Google Scholar] [CrossRef] [Green Version]
  22. Kisluk, J.; Ciborowski, M.; Niemira, M.; Kretowski, A.; Niklinski, J. Proteomics biomarkers for non-small cell lung cancer. J. Pharm. Biomed. Anal. 2014, 101, 40–49. [Google Scholar] [CrossRef] [PubMed]
  23. Sun, Y.; Liu, S.; Qiao, Z.; Shang, Z.; Xia, Z.; Niu, X.; Qian, L.; Zhang, Y.; Fan, L.; Cao, C.X.; et al. Systematic comparison of exosomal proteomes from human saliva and serum for the detection of lung cancer. Anal. Chim. Acta 2017, 982, 84–95. [Google Scholar] [CrossRef] [PubMed]
  24. Bel’skaya, L.V.; Kosenok, V.K.; Massard, G. Endogenous Intoxication and Saliva Lipid Peroxidation in Patients with Lung Cancer. Diagnostics 2016, 6, 39. [Google Scholar] [CrossRef] [PubMed] [Green Version]
  25. Bel’skaya, L.V.; Kosenok, V.K. A new field of application of saliva tests for prognostic purpose: Focus on lung cancer. Biomed. Chem. Res. Methods 2020, 3, e00133. [Google Scholar] [CrossRef]
  26. Wang, Z.-X.; Yang, L.-P.; Qiu, M.-Z.; Wang, Z.-Q.; Zhou, Y.-X.; Wang, F.; Zhang, D.-S.; Wang, F.-H.; Li, Y.-H.; Xu, R.-H. Prognostic value of preoperative serum lactate dehydrogenase levels for resectable gastric cancer and prognostic nomograms. Oncotarget 2016, 26, 945–956. [Google Scholar] [CrossRef] [Green Version]
  27. Yao, F.; Zhao, T.; Zhong, C.; Zhu, J.; Zhao, H. LDHA is necessary for the tumorigenicity of esophageal squamous cell carcinoma. Tumor Biol. 2013, 34, 25–31. [Google Scholar] [CrossRef]
  28. Koh, Y.W.; Lee, S.J.; Park, S.Y. Prognostic significance of lactate dehydrogenase B according to histologic type of non-small-cell lung cancer and its association with serum lactate dehydrogenase. Pathol. Res. Pract. 2017, 213, 1134–1138. [Google Scholar] [CrossRef]
  29. Huijgen, H.J.; Sanders, G.; Koster, R.W.; Vreeken, J.; Bossuyt, P. The clinical value of lactate dehydrogenase in serum: A quantitative review. Eur. Clin. Chem. Clin. Biochem. 1997, 35, 569–579. [Google Scholar]
  30. Mazzaschi, G.; Minari, R.; Zecca, A.; Cavazzonib, A.; Ferria, V.; Mori, C.; Squadrilli, A.; Bordia, P.; Buti, S.; Bersanelli, M.; et al. Soluble PD-L1 and Circulating CD8+PD-1+ and NK Cells Enclose a Prognostic and Predictive Immune Effector Score in Immunotherapy Treated NSCLC patients. Lung Cancer 2020, 148, 1–11. [Google Scholar] [CrossRef]
  31. Bel’skaya, L.V.; Sarf, E.A.; Kosenok, V.K. Correlation interrelations between the composition of saliva and blood plasma in norm. Klin. Lab. Diagn. Russ. Clin. Lab. Diagn. 2018, 63, 477–482. [Google Scholar]
  32. Xue, X.; Zang, X.; Liu, Y.; Lin, D.; Jiang, T.; Gao, J.; Wu, C.; Ma, X.; Deng, H.; Yu, Z.; et al. Independent risk factors for lymph node metastasis in 2623 patients with Non–Small cell lung cancer. Surg. Oncol. 2020, 34, 256–260. [Google Scholar] [CrossRef]
  33. Friedel, G.; Steger, V.; Kyriss, T.; Zoller, J.; Toomes, H. Prognosis in N2 NSCLC. Lung Cancer 2004, 45 (Suppl. 2), S45–S53. [Google Scholar] [CrossRef] [PubMed]
  34. Katsumata, S.; Aokage, K.; Ishii, G.; Nakasone, S.; Sakai, T.; Okada, S.; Miyoshi, T.; Tane, K.; Tsuboi, M. Prognostic Impact of the Number of Metastatic Lymph Nodes on the Eighth Edition of the TNM Classification of NSCLC. J. Thorac. Oncol. 2019, 14, 1408–1418. [Google Scholar] [CrossRef] [PubMed]
Figure 1. Kaplan–Meier survival curves illustrating the impact of pN stage on OS (p < 0.00001).
Diagnostics 11 00912 g001
Figure 2. Kaplan–Meier survival curves illustrating the impact of biochemical salivary markers on OS. (A): N0—LDH (i), DC (ii) and LDH + DK (iii); (B): N1—ICs (i), MM (ii) and ICs + MM (iii); (C): N2—Protein (i), SB (ii) and Protein + SB (iii). LDH—lactate dehydrogenase, DC—diene conjugates, ICs—imidazole compounds, MM—middle molecular toxins, SB—Schiff bases.
Diagnostics 11 00912 g002
Table 1. Overall survival rates depending on tumor size, histological type, growth form, and degree of differentiation of lung cancer.
LNSVariablesHR (95% CI)p-ValueOS, Months
pT
pN0pT1, n = 1810.0336340.4
pT2, n = 801.31 (0.50–3.43)36.8
pT3, n = 222.18 (0.67–7.03)28.9
pN1pT2, n = 2010.0022329.6
pT3, n = 231.10 (0.31–3.93)19.7
pT4, n = 82.40 (0.25–22.75)5.9
pN2pT2, n = 2510.1891416.8
pT3, n = 182.96 (0.57–15.20)10.2
pT4, n = 253.85 (0.94–15.56)11.0
Histological Subtype
pN0ADC, n = 7510.0336636.5
SCC, n = 452.75 (1.28–5.86) *32.7
pN1ADC, n = 2210.0306926.3
SCC, n = 292.13 (0.30–4.27)9.6
pN2ADC, n = 3410.0712216.6
SCC, n = 342.21 (0.51–9.55)9.7
Morphological Growth Forms
pN0Peripheral, n = 106
ADC-71, SCC-35
10.8077336.7
Central, n = 14
ADC-3, SCC-11
1.29 (0.46–3.59)31.2
pN1Peripheral, n = 28
ADC-19, SCC-9
10.0824825.3
Central, n = 23
ADC-3, SCC-20
1.26 (0.36–4.34)13.5
pN2Peripheral, n = 30
ADC-22, SCC-8
10.2078916.0
Central, n = 31
ADC-10, SCC-21
2.22 (0.62–7.90)10.8
Mediastinal, n = 7
ADC-0, SCC-7
2.89 (0.33–24.84)9.8
Degree of Differentiation
pN0G1, n = 3010.0677238.7
G2, n = 381.61 (0.59–4.37)36.7
G3, n = 271.22 (0.41–3.62)32.3
G4, n = 251.42 (0.45–4.43)22.5
pN1G1, n = 1010.0631437.9
G2, n = 130.80 (0.10–6.27)16.0
G3, n = 82.70 (0.33–21.52)18.2
G4, n = 203.30 (0.42–25.79)11.8
pN2G1, n = 1210.4703625.2
G2, n = 181.25 (0.09–17.63)9.7
G3, n = 91.63 (0.14–18.12)11.8
G4, n = 291.58 (0.13–19.04)10.1
Note. *—differences are statistically significant, p < 0.05; ADC—adenocarcinoma, SCC—squamous cell carcinoma; G1—highly, G2—moderately, and G3—poorly differentiated, G4—undifferentiated lung cancer. LNS—lymph node status, OS—overall survival.
Table 2. Overall survival rates depending on the type of treatment and the volume of surgery.
LNSVariablesHR (95% CI)p-ValueOS, Months
Treatment Type
pN0Radical, n = 7910.0019637.7
Combined, n = 362.66 (1.22–5.71) *30.9
pN1Combined, n = 2710.0073826.3
Palliative, n = 1910.91 (1.29–89.53) *11.2
pN2Combined, n = 1910.0802323.9
Palliative, n = 362.63 (0.76–9.04)12.7
The Extent of Surgical Treatment
pN0Lobectomy, n = 7510.0002137.6
Bilobectomy, n = 331.11 (0.49–2.55)31.2
Pneumonectomy, n = 73.87 (0.86–17.10)18.5
No surgery, n = 56.96 (1.31–36.00) *13.4
pN1Lobectomy, n = 1410.0568932.8
Bilobectomy, n = 70.62 (0.11–3.63)21.8
Pneumonectomy, n = 90.25 (0.04–1.38)17.8
No surgery, n = 218.31 (0.84–79.56)11.2
pN2Lobectomy, n = 410.5638122.6
Bilobectomy, n = 82.00 (0.14–27.78)20.5
Pneumonectomy, n = 124.33 (0.33–56.10)17.1
No surgery, n = 442.63 (0.45–15.00)11.0
Note. LNS—lymph node status, OS—overall survival, *—differences are statistically significant, p < 0.05.
Table 3. Prognostic value of saliva biochemical markers depending on the prevalence of metastases in the lymph nodes.
IndicatorsVariablesHR (95% CI)p-ValueOS, Months
pN0
LDH, U/L<1294, n = 6010.0107530.6
>1294, n = 600.42 (0.20–0.90) *36.6
LDH, U/L<636, n = 4610.1626330.1
636–1900, n = 470.47 (0.21–1.09)37.2
>1900, n = 270.26 (0.09–0.77) *36.4
DC, c.u.<3.97, n = 5610.0298338.2
>3.97, n = 641.64 (0.78–3.44)30.3
DC, c.u.<3.76, n = 2910.1455341.3
3.76–4.19, n = 701.48 (0.59–3.69)36.5
>4.16, n = 211.67 (0.52–5.30)23.6
LDH + DC>1294, <3.97, n = 3010.0154139.6
<1294, >3.97, n = 343.48 (1.21–9.85) *28.7
pN1
ICs, mmol/L<0.296, n = 2510.0082226.2
>0.296, n = 266.75 (1.28–34.57) *14.7
ICs, mmol/L<0.182, n = 1310.0063926.2
0.182–0.455, n = 250.64 (0.14–2.95)23.7
>0.455, n = 134.20 (1.38–45.31) *6.8
MM, c.u.<0.903, n = 2510.1690316.0
<0.903, n = 260.52 (0.13–2.04)24.0
MM, c.u.<0.832, n = 1310.1024014.9
0.832–0.989, n = 260.28 (0.03–2.58)18.8
>0.989, n = 120.17 (0.02–0.97) *28.7
ICs + MM<0.296, >0.903, n = 1510.0422426.3
>0.296, <0.903, n = 159.80 (1.04–89.91) *14.5
pN2
Protein, g/L<0.583, n = 3410.4847413.5
>0.583, n = 330.75 (0.18–3.04)14.3
SB, c.u.<0.602, n = 3410.5152114.3
>0.602, n = 341.29 (0.32–5.24)12.9
Protein + SB><, <>, n = 3310.043519.3
>>, <<, n = 350.50 (0.12–0.98) *16.6
Note. *—differences are statistically significant, p < 0.05; LDH—lactate dehydrogenase, DC—diene conjugates, ICs—imidazole compounds, MM—middle molecular toxins, SB—Schiff bases.
Table 4. Results of multivariate survival analysis using the Cox regression model.
Prognostic FactorsβStandard Errort-Valuep-Value
N0 (χ2 = 34.55, p < 0.00001)
pT0.20200.29380.68750.4918
Histological Subtype0.80110.31542.5400.0111
Morphological Growth Forms−1.0310.5382−1.9150.0555
Treatment Types1.2200.25094.8620.0000
LDH−1.0940.3440−3.1790.0015
DC0.61920.30832.0080.0447
N1 (χ2 = 20.57, p = 0.00446)
pT0.65980.34171.9310.0535
Histological Subtype0.66800.43061.5510.1208
Morphological Growth Forms−0.87180.4470−1.9510.0511
Treatment Types0.87760.44881.9560.0505
ICs0.67090.33422.0070.0448
MM−0.24860.3269−0.76060.4469
N2 (χ2 = 18.80, p = 0.00884)
pT−0.14630.2107−0.69430.4875
Histological Subtype0.48860.32751.4920.1357
Morphological Growth Forms0.27400.28600.95820.3380
Treatment Types0.63140.27072.3330.0197
Protein−0.08910.2878−0.30950.7569
SB0.08060.28690.28080.7789
Protein + SB−0.68860.3007−2.2900.0220
Note. Histological subtype (ADC = 0, SCC = 1); Morphological growth forms (Peripheral = 0, Central = 1); Treatment Types (Radical = 0, Combined = 1, Palliative = 2); LDH, DC, ICs, MM, Protein and SB (continue variables); Protein + SB (Favorable prognosis = 0, unfavorable prognosis = 1). Statistical results with p < 0.05 are bolded. LDH—lactate dehydrogenase, DC—diene conjugates, ICs—imidazole compounds, MM—middle molecular toxins, SB—Schiff bases.
Publisher’s Note: MDPI stays neutral with regard to jurisdictional claims in published maps and institutional affiliations.

