1. Introduction
Breast cancer is the second leading cause of cancer death in women [
1,
2]. Automated techniques are proposed for building interoperability functions among different clinical departments such as the diagnosis, screening and treatment of breast cancer [
3,
4,
5]. As parts of these automated systems, different types of imaging modalities such as mammography, ultrasound and magnetic resonance imaging have been used for diagnosing breast tumors. Whilst mammography has been proven to be a useful technique for diagnosing breast cancer leading to reduced mortality [
6], its sensitivity is limited in dense breast tissues. Breast density has been established as an independent risk factor for breast cancer [
7,
8,
9]. Women with heterogenous dense and extremely dense breast tissues have relatively higher risks, 1.2 and 2.1 times, of developing breast cancers compared to average women [
10]. The accuracy rate for simple benign cyst diagnosis in breast ultrasound images has been reported to be 96–100%; therefore, they do not require further evaluation [
11]. In a meta-analysis of 29 studies, various adjunct screening methods were studied to assess the limitations of various breast cancer screening modalities, and ultrasound has demonstrated an increase in cancer detection of 40% [
12].
Computer-aided diagnosis (CAD) systems are extensively used for the detection and classification of tumors in breast ultrasound images. The CAD systems are highly suggested for helping radiologists in identifying breast tumors and disease prognosis. Statistical methods [
13] have been predominantly used to analyze extracted features such as lesion shapes, margins, homogeneity and posterior acoustic attenuation. However, the identification of the shapes and margins of lesions is difficult in ultrasound images [
14]. Machine learning techniques have also been extensively deployed to analyze and classify lesions based on the handcrafted morphological and texture features of tumors [
15,
16]. However, the extraction of features is still highly dependent on the radiologist’s experience. The struggles of researchers for handcrafting features led to the development of newer algorithms that can learn features automatically from data such as deep learning algorithms, which are particularly useful for extracting non-linear features from data. Deep learning models are surprisingly promising in the classification of ultrasound images, in which pattern recognition is not easily hand-engineered [
17,
18].
A large group of studies with deep learning approaches leverage the concept of pre-trained Convolutional Neural Networks (CNNs) to classify tumors in breast ultrasound images [
19,
20,
21,
22]. In [
19], the pretrained GoogLeNet network was finetuned with their local dataset to differentiate benign and malignant tumors. In this strategy, the parameters of the modified pre-trained CNN model are fine-tuned on breast ultrasound images, and the last fully connected layer of the pre-trained CNN model is modified based on the number of classes in the classification problem. In [
20], deep networks were applied to integrate feature learning with feature selection on breast shear wave elastography images. The stacked denoising autoencoder was used in [
21] to differentiate lesions in breast ultrasound images.
Along with the rapid growth of deep learning methods in the past few years, attention mechanisms are needed to efficiently integrate local and global features and exploit localized information [
23]. The attention has been used in computer vision tasks such as detection [
24,
25], segmentation [
26] and classification [
27], and it improves the model performance by focusing on the most relevant features that are important in the given task. To the best of our knowledge, attention modules have been widely used in medical image segmentation but not classification. In this study, we used the attention gate module [
23] in a modified VGG16 architecture with a new loss function to increase the classification performance of breast lesion classification in ultrasound images.
2. Materials and Methods
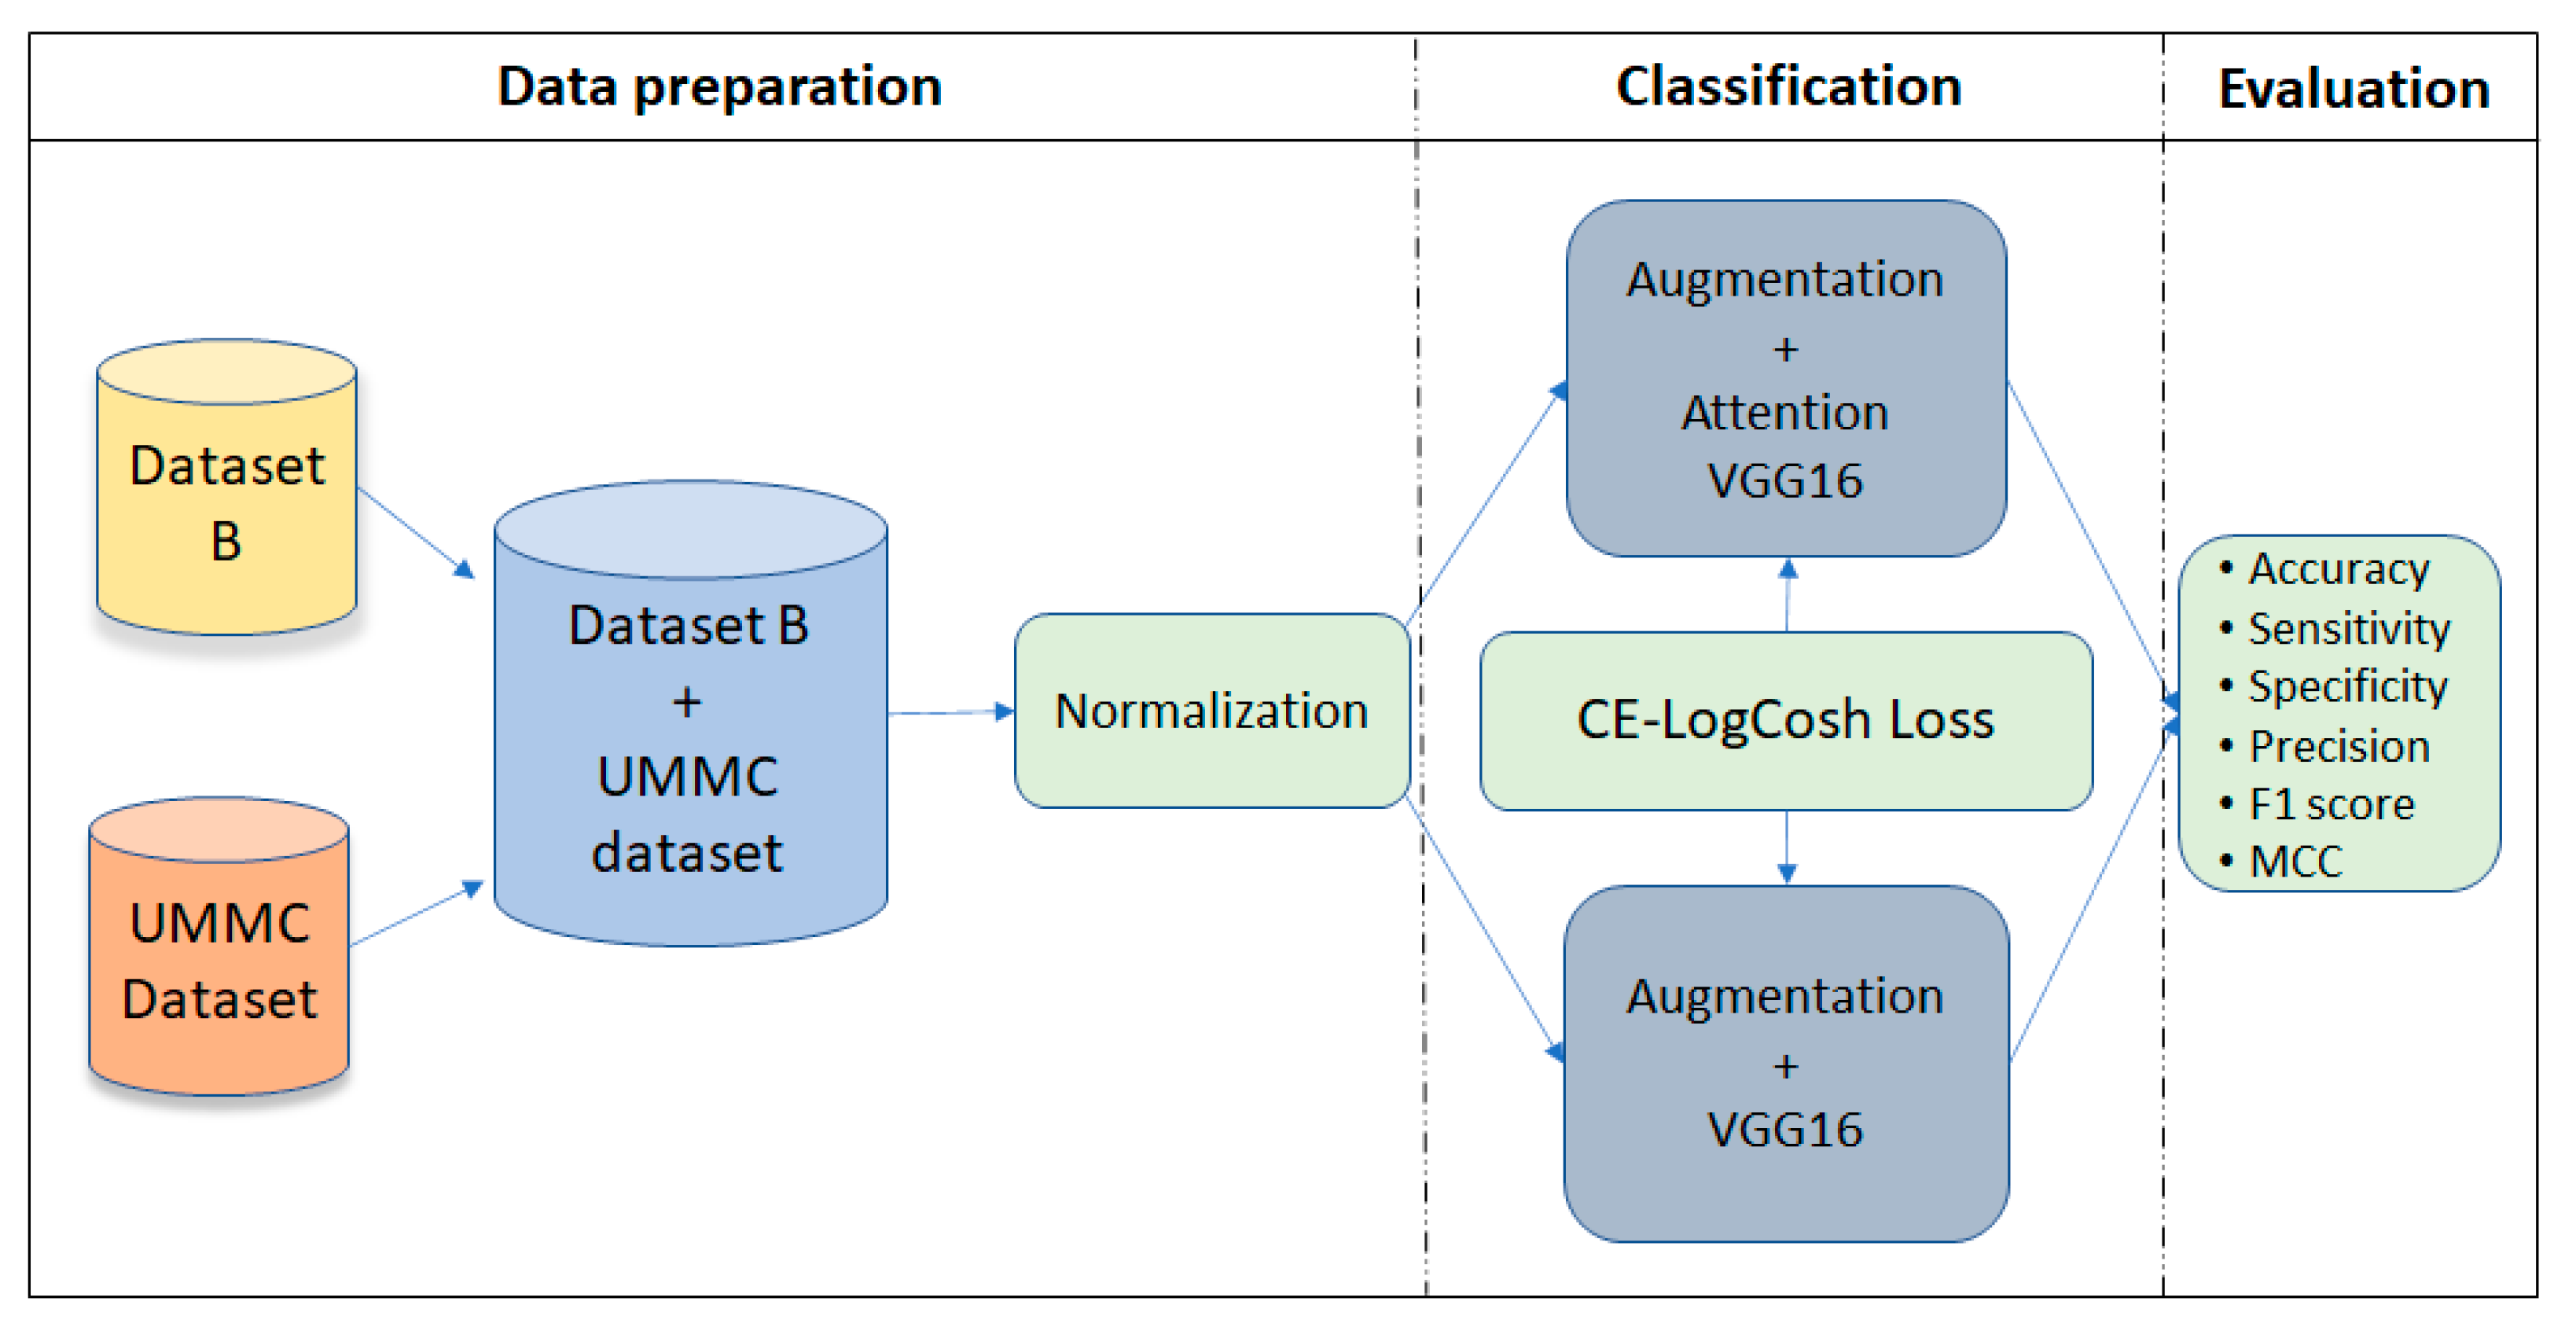
The proposed framework in this study was inspired by [
23], in which the authors introduced attention gates. We used a layer with attention mechanism in the modified VGG16 architecture. The attention block was used in convolutional layers 13 and 18 in the VGG16 network architecture to extract and prune features [
28]. The framework is illustrated in
Figure 1.
2.1. The Datasets
In this study, we combined two datasets, one publicly available set of breast ultrasound images, named Breast Ultrasound Database B [
29], with 163 images of 109 benign and 54 malignant lesions, and another dataset that was collected at the University Malaya Medical Centre (UMMC), between June 2012 and April 2013, with 276 ultrasound breast images comprising 140 benign and 136 malignant lesions obtained from 83 different patients. All the subjects were biopsy confirmed. The patients were either from the breast assessment clinic with palpable lumps or had sonographically detected lesions. Patients without confirmed histological diagnoses and those with a previously known histological diagnosis were excluded.
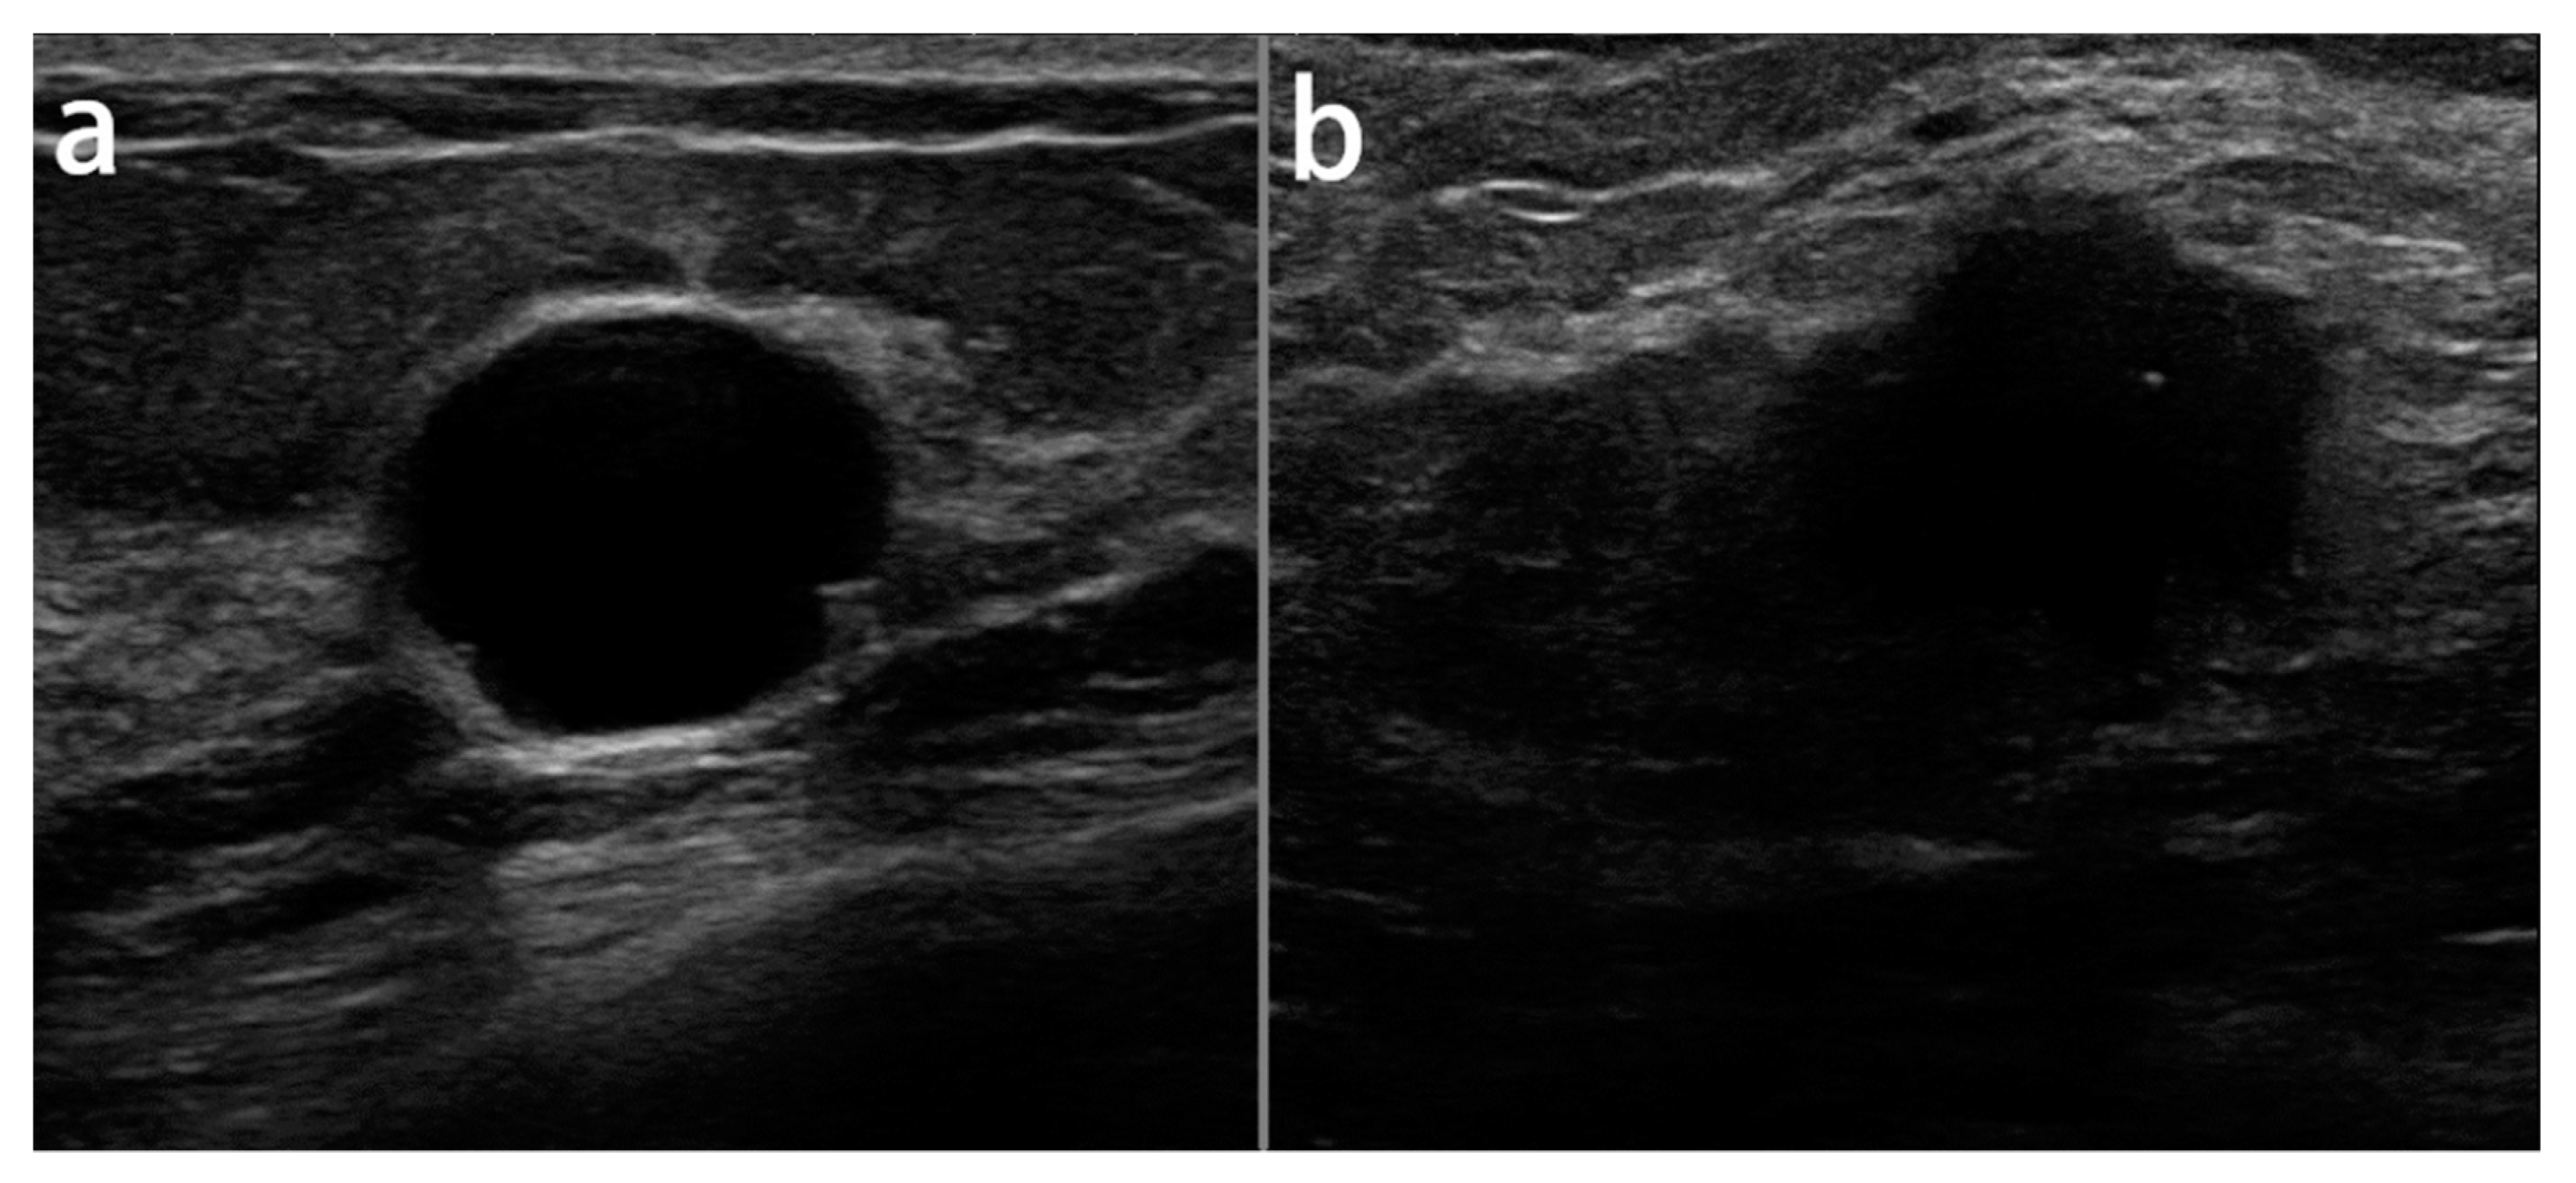
Most of the malignant lesions were infiltrating ductal carcinomas (IDCs), whereas the majority of the benign lesions were fibroadenomas. The sizes of the malignant lesions ranged from 0.5 to 9.0 cm (mean ± SD: 2.1 ± 1.2 cm), whereas the sizes of the benign lesions ranged from 0.3 to 5.0 cm (mean ± SD: 1.4 ± 1.0 cm).
2.2. Data Pre-Processing
All the ultrasound images in the UMMC dataset were acquired using the Aixplorer ultrasound system (SuperSonic Imagine, Aix en Provence, France) using a 15-4 MHz linear transducer probe. Two radiologists specialized in breast imaging performed the scanning task, and they were blinded to the histological diagnosis results. All the images were in JPEG format and at the resolution of 1400 × 1050 pixels. However, the average image resolution size in dataset B was 760 × 570 pixels, where each of the images presented one or more lesions. In our experiments, the images were resized to 128 × 128 pixels and the whole data were split 75%, 10% and 15% for training, validation and test sets, respectively. Image normalization was applied to all of the images in the datasets to create a consistent dynamic range across the dataset.
Figure 2 illustrates the samples of benign and malignant lesions in the breast ultrasound images of the UMMC dataset.
2.3. Attention Module
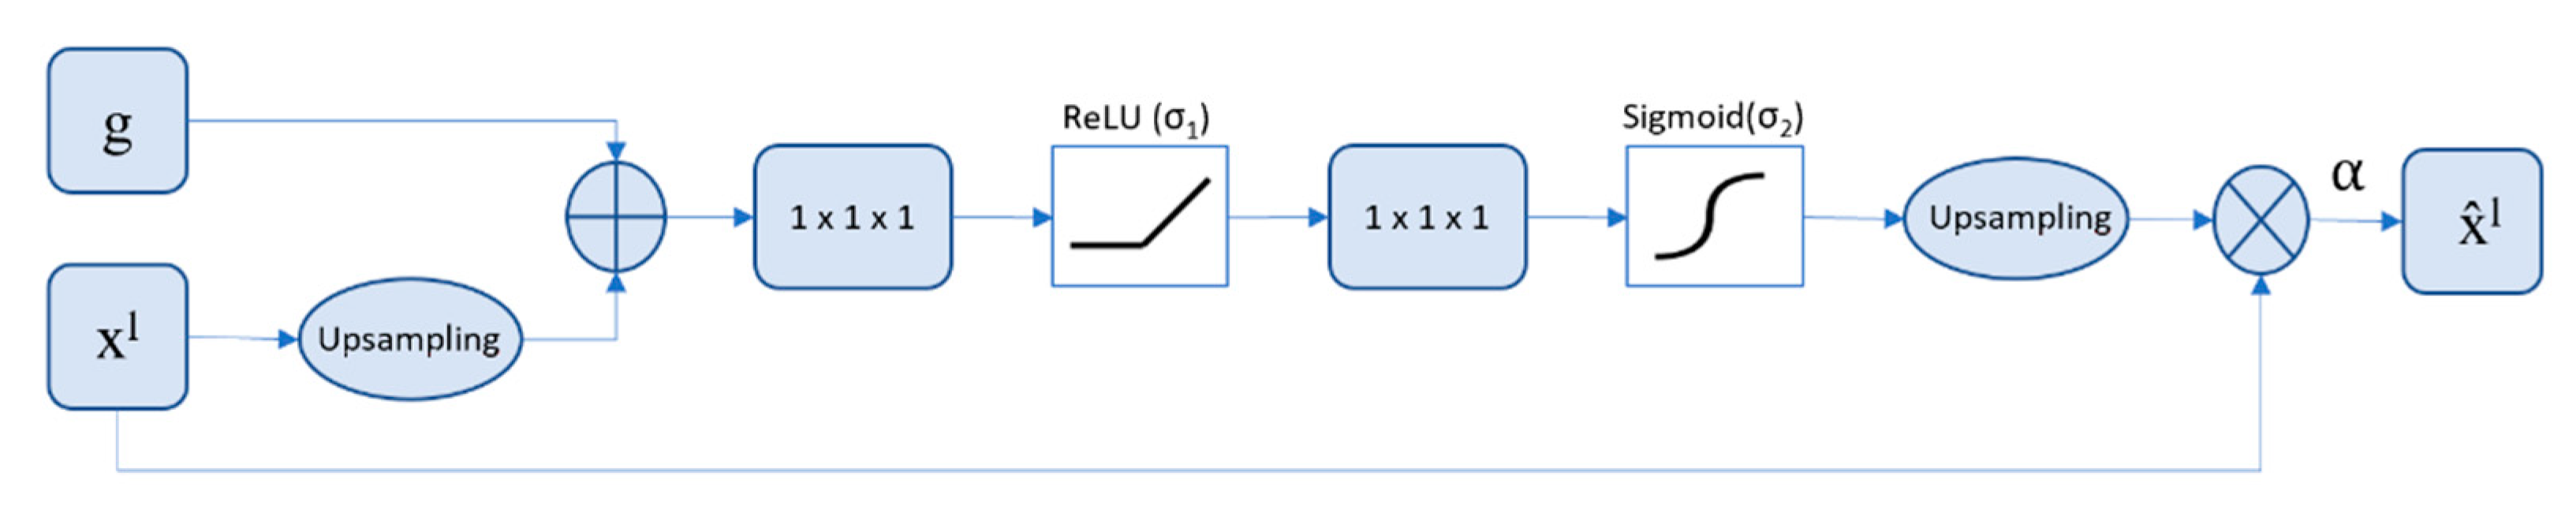
The main idea of the attention mechanism is to highlight relevant features and suppress irrelevant components such as shadows or speckle noises in US images from background regions, with no ROI cropping required. At the deep levels of convolutional layers, the network acquires the richest possible feature representation. Early CNN layers capture low-level features (i.e, shapes, edges, texture and intensity), whereas deep layers extract higher-level features [
30,
31]. Here, in this study, we used the attention coefficient to give scaler attention to targeted lesion regions. We used the attention gate (AG) [
23] mechanism to highlight the relevant feature representations to discriminate between the lesion and non-lesion pixels in US images. This allows ignoring the artifacts from US images which significantly improves the results. Through the AG, the input feature map was submitted to element-wise multiplication with the attention coefficient to highlight the salient features; see
Figure 3.
The attention gate parameters (Ꞝ
attn) contain a set of linear transformations
,
and б
T and bias terms b
g and bб. The attention coefficients
i ∈ [0, 1] are produced by AG at each pixel
i to scale the input features
and output features
. The localization of focus regions is obtained using the gating signal, g, for each pixel
i. The gating signal is retrieved from a coarser scale than the input features
. The linear attention coefficients are computed using the element-wise sum of the
Wx, b
б,
Wg and b
g parameters followed by 1 × 1 × 1 linear transformation б
T [
23]:
ReLU and sigmoid as σ1 and σ2, respectively, were used to transform the intermediate maps in calculating the attention coefficients. The attention coefficients determine the important regions of image and prune features to maintain the relevant activations in specific tasks. The output maps at each scale were upsampled and then concatenated with the pruned features. In this stage, 1 × 1 × 1 convolutions and non-linear activations were applied on each output map, and then, the high-dimensional feature representation was supervised with CE-logCosh loss.
2.4. Cross Entropy—Log Hyperbolic Cosine (CE-LogCosh) Loss
According to importance of the loss function in the learning algorithms, this study was inspired by the ensembled methods [
32] in order to develop an ensemble loss function for the classification of breast ultrasound images. We combined two loss functions, cross entropy [
33] and log hyperbolic cosine [
34], to boost the learning process and achieve better performance. The cross-entropy loss compares the distribution of predictions and true labels and defines it as:
The log-cosh loss function is the hyperbolic cosine algorithm of the prediction error.
where y is the label and
is the predicted label. The proposed ensembled loss function is formulated as follows:
In the CE-logCosh Loss function, α and β are weighting parameters that can be tuned to shift the emphasis on the cross entropy or logCosh loss. In this study, we set α and β to 0.5, as the best performance was achieved.
2.5. Network Architecture
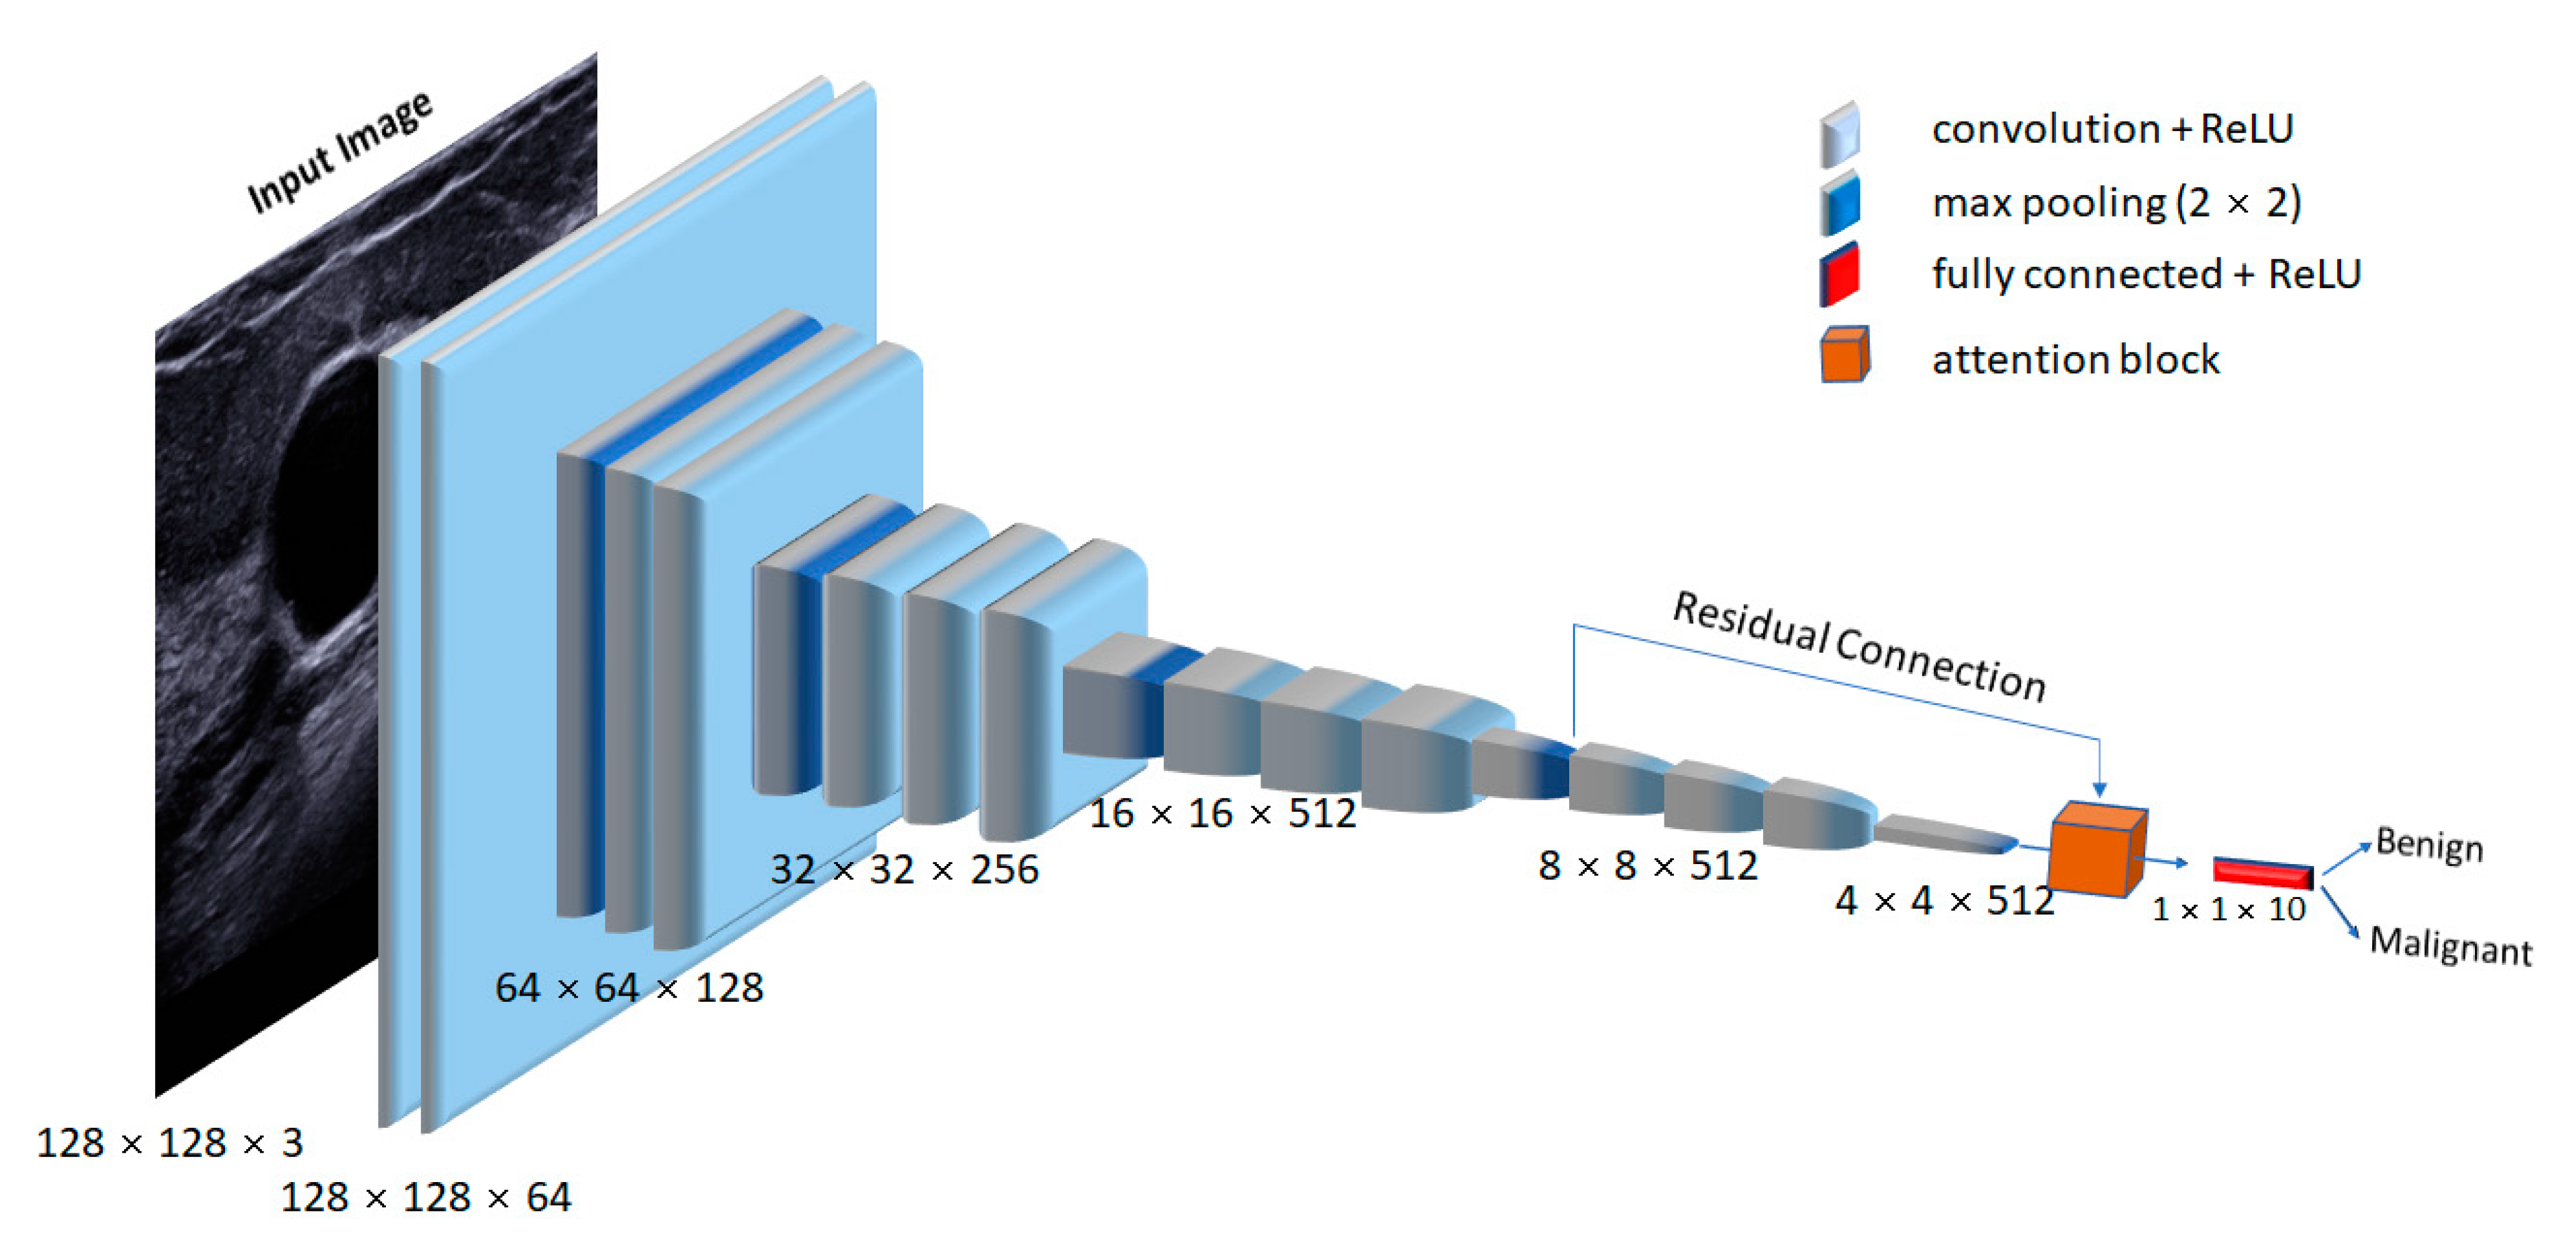
In this study, we used a trained VGG16 network to extract relevant features from the ultrasound datasets.
Figure 4 presents the schematic of the proposed network architecture. The input image size for the VGG16 network was 128 × 128 × 3. Each convolutional layer used a kernel size of 3 × 3, followed by a non-linear ReLU activation function. After every convolutional block, a max-pooling operation with a stride of 2 was used to downsample the extracted feature maps. We applied the attention mechanism to convolutional layers 13 and 18 to boost the feature discriminability, which captured the most relevant features by ignoring the irrelevant ones. Finally, the enhanced feature output was fed to modified fully connected (FC) [
35] layers for the classification of malignant and benign lesions.
Due to the limitation of the small breast ultrasound image dataset, training a deep network from scratch was not feasible and would have caused overfitting. Therefore, to overcome this issue, we replaced the fully connected layer 1000 classes from the ImageNet pre-trained network to two classes for the classification into benign and malignant in breast ultrasound images. The “dropout” strategy [
36] was also used to avoid overfitting. The experiment was trained for 250 epochs with a batch size of 32. The model was optimized using RMSprop with an initial learning rate of 2 × 10
−6, which decayed by 10
−6. All the experiments were performed using the deep neural networks in the Keras framework with the TensorFlow backend.
We propose a new model based on attention gating and new loss function to enhance the performance of classification for breast ultrasound images.
2.6. Evaluation
In this study, we measured the classification performance of models by using six evaluation metrices: the sensitivity, specificity, accuracy, precision, F1 score and Matthews correlation coefficient [
37], which were obtained from confusion matrix entries. In a confusion matrix, the relation between classification outcomes and predicted classes is illustrated. The level of classification performance was calculated from the number of correct and incorrect classified samples in each class. The accuracy was computed based on the total number of correct predictions, defined as:
The sensitivity is the proportion of true positives that are identified correctly, defined as:
The specificity is the proportion of true negatives that are correctly predicted, defined as:
The precision or positive predictive value is the ratio of correctly predicted positive observations to the total predicted positive observations, defined as:
The F1 score is the weighted average of the precision, which is calculated as:
The Matthews correlation coefficient (MCC) is the coefficient of the correlation between the observed and predicted classifications, defined as:
where true positive (
TP) and true negative (
TN) refer to the numbers of correct predictions and false positive (
FP) and false negative (
FN), those of incorrect predictions.
3. Results
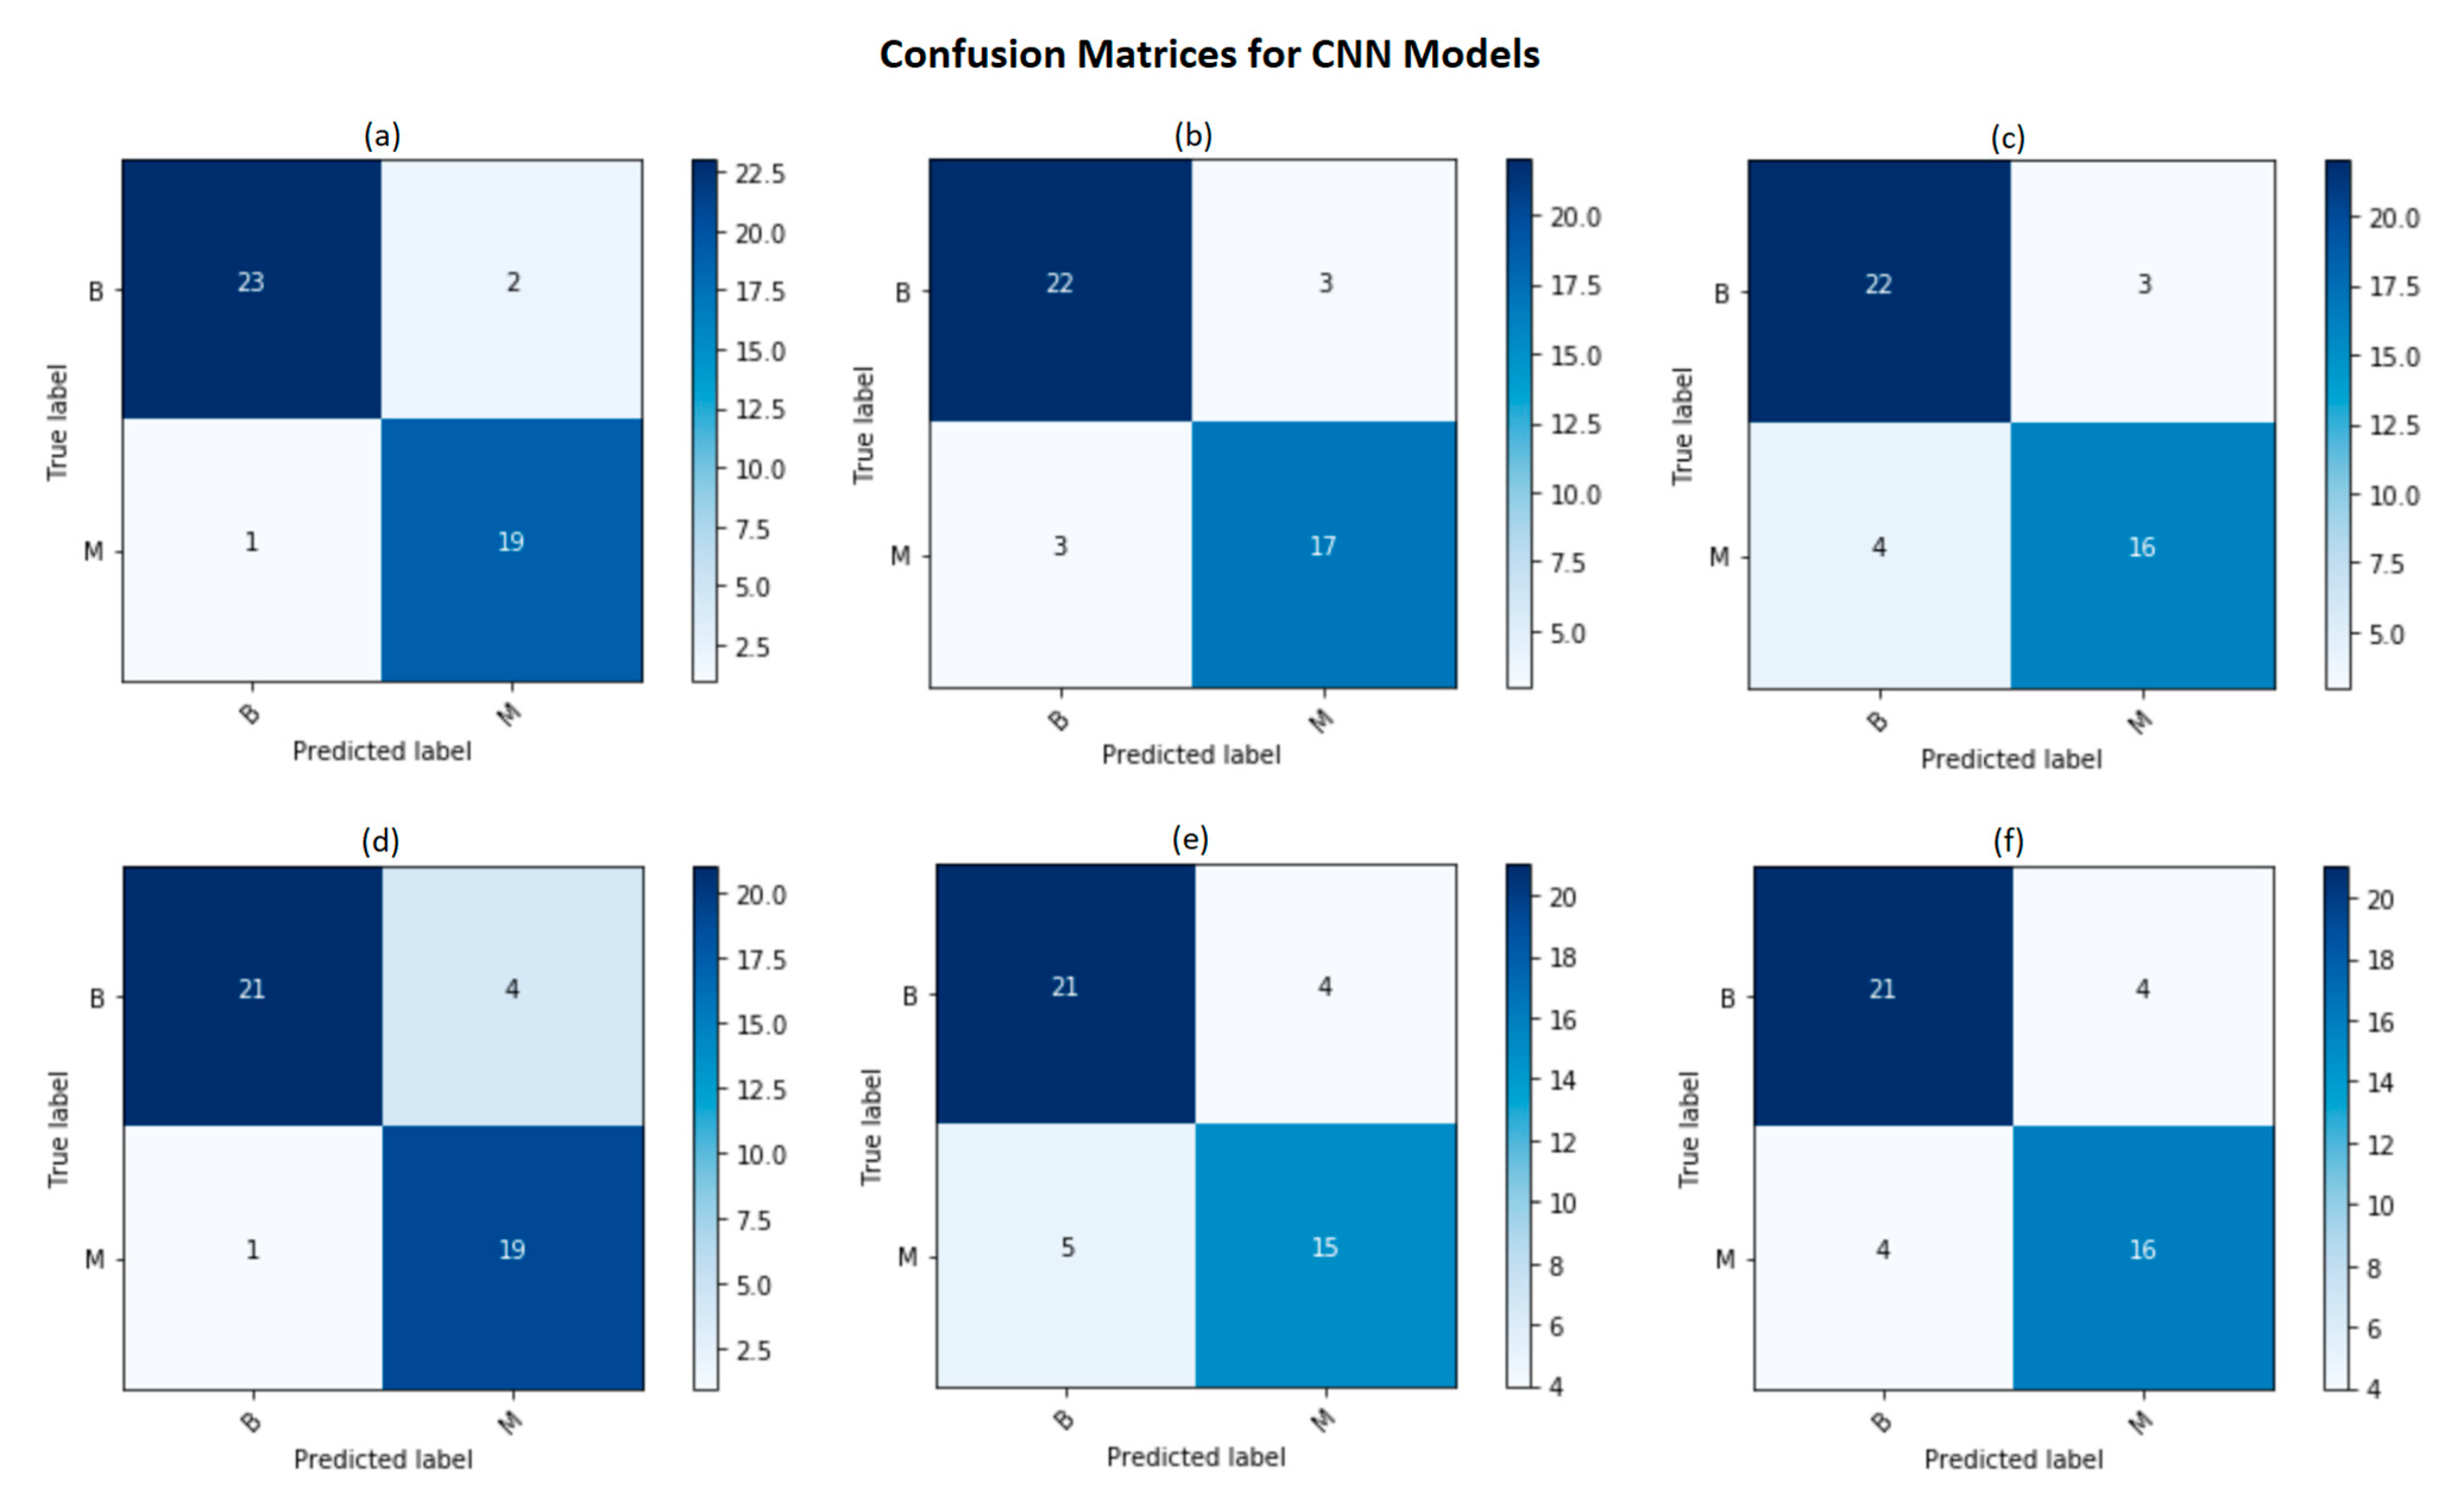
We evaluated our proposed model for the classification of ultrasound breast lesions into benign and malignant. In particular, the accurate classification of benign and malignant lesions in ultrasound images is a challenging task in the presence of various artifacts such as variety in shape, a low signal-to-noise ratio, ill-defined boundaries and poor contrast. We compared the proposed Attention-VGG16 model with the standard VGG16 network by utilizing a combination of different loss functions (i.e., pls add all the losses ).
According to
Table 1 and
Figure 5, it is notable that our proposed Attention-VGG16 model with CE-logCosh outperformed other classification models in terms of the accuracy, sensitivity, specificity, precision, F1 score and MCC.
4. Discussion
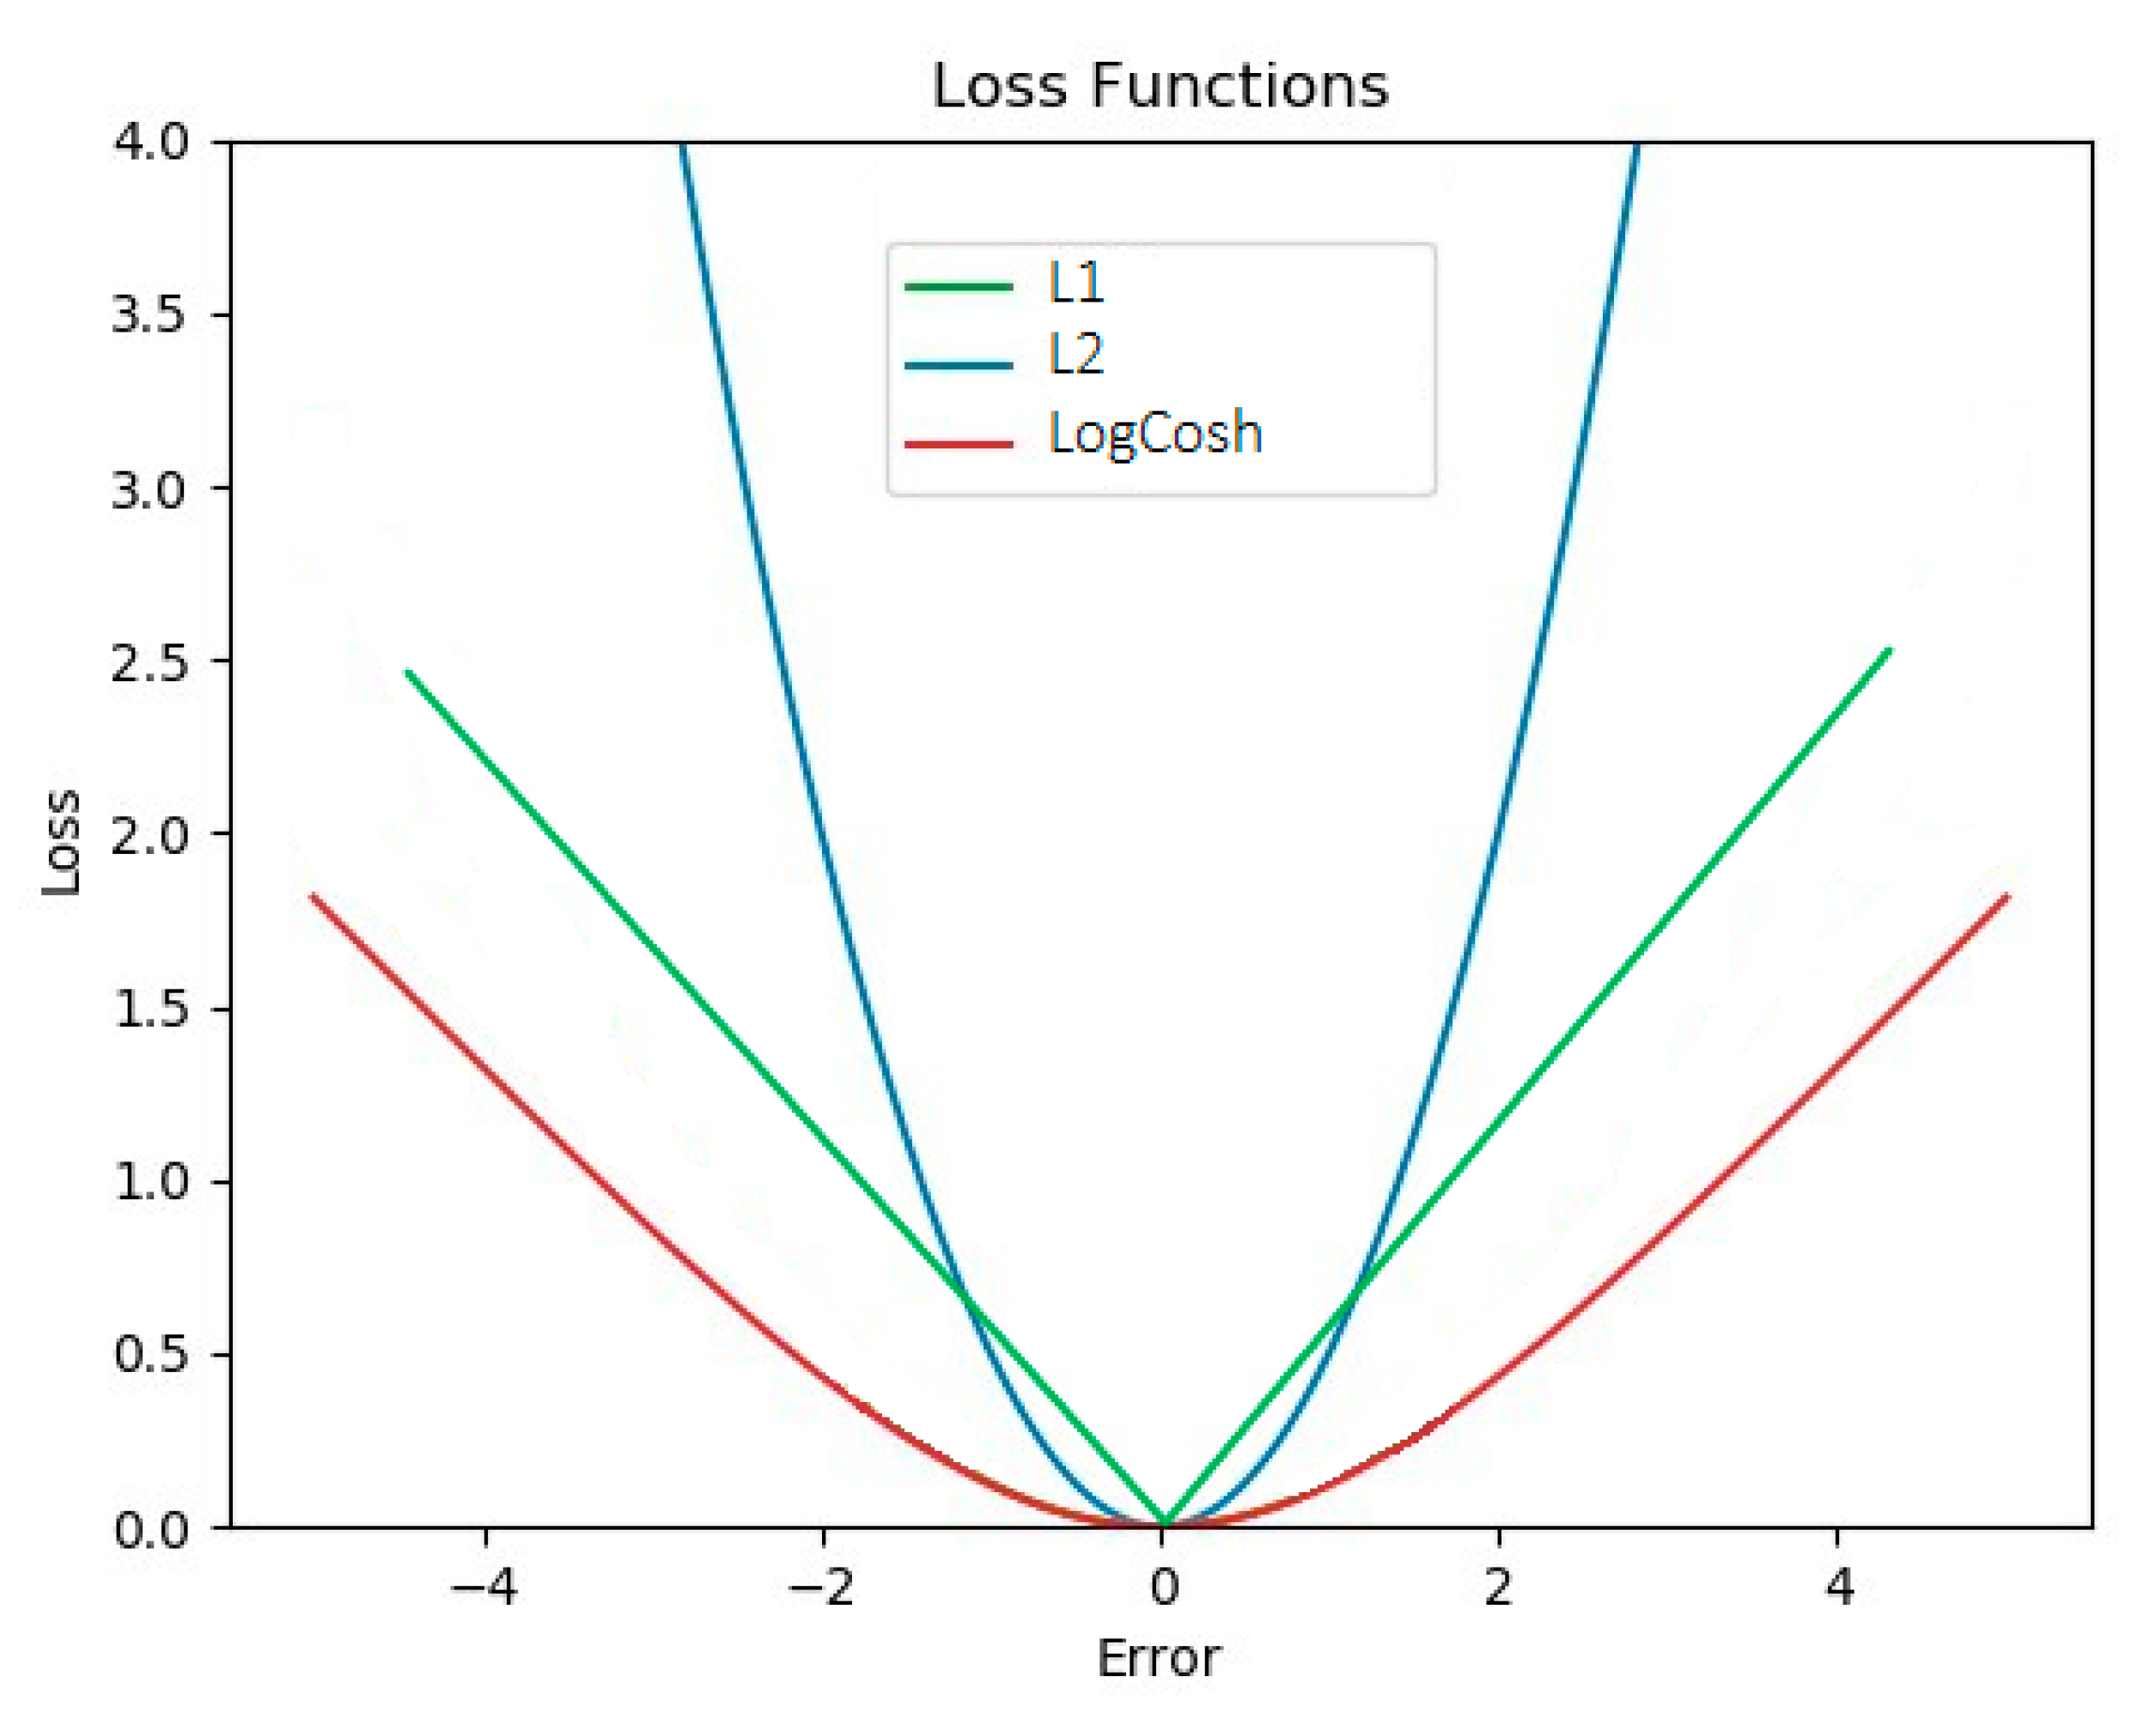
In this paper, modified VGG16 architectures were compared to achieve higher performance in the classification of benign and malignant breast tumors. Modifications such as an additional attention block, different dense layers and ensembled loss functions were made. One of the improvements in the CNN models was the use of ensembled loss functions. Within the training phase, in the gradient propagation optimization, the weight of each loss function was tuned, and they were parametrized by α and β to control the emphasis. To the best of our knowledge and according to Equation (4), logCosh loss works mostly like L2 at small values and like L1 at large values and is usually used in regression or reconstruction tasks [
34]. In
Figure 6, it is notable that the logCosh loss could obtain the benefit of L2 loss’ smoothness and the sharpness of L1.
In this study, we used logCosh loss, combined with binary cross-entropy, to improve the classification accuracy. It is notable in
Table 1 that the ensemble of both losses could improve the classification performance.
On the other hand, by using an attention block, relevant spatial information was identified from low-level feature maps and propagated to the classification stage. The lack of this relevant spatial information is caused by transforming large sized feature maps that are obtained after the convolutional layers in the CNN and reaching smaller feature dimensions. Therefore, the attention block was proposed, which attempts to compute the contribution of each feature.
In our study, out of all the models, the Attention-VGG16 with logCosh loss demonstrated the highest accuracy and precision. Additionally, the proposed deep convolutional neural network architecture does not need prior expert knowledge or image segmentation; hence, it will be more convenient in CAD and suitable for future clinical diagnosis.
Table 2 demonstrates some state-of-the-art deep learning models for lesion classification for breast ultrasound images. It is notable that the performance of our proposed model is comparable to these published models [
19,
21,
22].
One of the hyperparameters that was assessed in this study was the number of neurons in the dense layers. We used the smallest number of neurons to decrease the number of parameters, and surprisingly, this achieved the same accuracy as using 4096 or 10 neurons in dense layers.
In summary, we propose the Attention-VGG16 classifier as a potential architecture for classifying breast cancer ultrasound images. We suggest that this model be tested further using a larger dataset to improve the robustness of this architecture. Additionally, we also suggest that the VGG16 is implemented with machine learning classifiers as potential architectures in clinical studies. As the classification of breast lesions’ subtypes is of greater clinical impact [
16,
38], in future studies, the deep convolutional neural network architecture should be used on big data with various tumor subtypes to adapt it to multi-class classification.
5. Conclusions
In this study, we analyzed CNN models for the classification of benign and malignant lesions for the UMMC breast ultrasound image dataset and Breast Ultrasound Dataset B. We employed transfer learning approaches with the pre-trained VGG16 architecture. Different CNN models for classification were trained to predict benign or malignant lesions in breast ultrasound images. Our experimental results demonstrated that the choice of loss function is highly important in classification tasks and that adding an attention block could improve the performance of the proposed model. Additionally, the proposed model with extracted features from VGG16 and a fully connected network with only 10 neurons achieved the best performance in the classification task with respect to the precision of 92% and accuracy of 93%. With this framework, evaluation tests show that the combination of loss functions can provide suitable information to enable the construction of the most accurate prediction model when compared with other models. In the future, other deep neural network models will be tested on a larger dataset of ultrasound images with the hope of further increasing the accuracy and performance.
Author Contributions
Conceptualization, S.K.D. and E.Y.K.; data curation, E.Y.K., N.W.L. and K.R.; formal analysis, E.Y.K., A.J. and S.K.S.; funding acquisition, S.K.D. and E.Y.K.; investigation, E.Y.K. and A.J.; methodology, E.Y.K., A.J., S.K.S., K.R. and S.K.D.; project administration, N.W.L., N.A.T. and S.K.D.; resources, N.W.L. and K.R.; software, E.Y.K.; supervision, S.K.D. and N.A.T.; validation, M.D.G.; visualization, A.J., S.K.S. and M.D.G.; writing—original draft, E.Y.K.; writing—review and editing, S.K.D., A.J., S.K.S., N.W.L., K.R., N.A.T. and M.D.G. All authors have read and agreed to the published version of the manuscript.
Funding
This project was supported by the University of Malaya Research Grant (PRGS) Program Based Grant (PRGS 2017-1) and FRGS /1/2019 SKK03/UM/01/1 (MOHE Malaysia) awarded to the corresponding authors.
Institutional Review Board Statement
Not applicable.
Informed Consent Statement
Not applicable.
Data Availability Statement
Acknowledgments
We would like to thank the University Malaya Medical Center (UMMC) for providing the data to conduct this study.
Conflicts of Interest
The authors declare no conflict of interest.
References
- Spaeth, E.; Starlard-Davenport, A.; Allman, R. Bridging the Data Gap in Breast Cancer Risk Assessment to Enable Widespread Clinical Implementation across the Multiethnic Landscape of the US. J. Cancer Treat. Diagn. 2018, 2, 1–6. [Google Scholar] [CrossRef]
- Joshi, R.; Basu, A. The Involvement of S6 Kinase-2 in Breast Cancer; The University of North Texas Health Science Centre: Fort Worth, TX, USA, 6 April 2018. [Google Scholar]
- Nor, N.A.M.; Taib, N.A.; Saad, M.; Zaini, H.S.; Ahmad, Z.; Ahmad, Y.; Dhillon, S.K. Development of electronic medical records for clinical and research purposes: The breast cancer module using an implementation framework in a middle income country- Malaysia. BMC Bioinform. 2019, 19, 402. [Google Scholar] [CrossRef] [Green Version]
- Ganggayah, M.D.; Taib, N.A.; Har, Y.C.; Lio, P.; Dhillon, S.K. Predicting factors for survival of breast cancer patients using machine learning techniques. BMC Med. Inform. Decis. Mak. 2019, 19, 48. [Google Scholar] [CrossRef] [PubMed] [Green Version]
- Kalafi, E.Y.; Nor, N.A.M.; Taib, N.A.; Ganggayah, M.D.; Town, C.; Dhillon, S.K. Machine Learning and Deep Learning Approaches in Breast Cancer Survival Prediction Using Clinical Data. Folia Biol. 2019, 65, 212–220. [Google Scholar]
- Tabar, L.; Gad, A.; Holmberg, L.H.; Ljungquist, U.; Group, K.C.P.; Fagerberg, C.J.G.; Baldetorp, L.; Gröntoft, O.; Lundström, B.; Månson, J.C.; et al. Reduction in mortality from breast cancer after mass screening with mammography. Randomised trial from the Breast Cancer Screening Working Group of the Swedish National Board of Health and Welfare. Lancet Lond. Engl. 1985, 1, 829–832. [Google Scholar] [CrossRef]
- Houssami, N.; Abraham, L.A.; Kerlikowske, K.; Buist, D.S.; Irwig, L.; Lee, J.; Miglioretti, D.L. Risk Factors for Second Screen-Detected or Interval Breast Cancers in Women with a Personal History of Breast Cancer Participating in Mammography Screening. Cancer Epidemiol. Biomark. Prev. 2013, 22, 946–961. [Google Scholar] [CrossRef] [PubMed] [Green Version]
- Kerlikowske, K.; Zhu, M.W.; Tosteson, S.A.N.; Sprague, B.L.; Tice, J.A.; Lehman, C.D.; Miglioretti, D.L. Identifying Women with Dense Breasts at High Risk for Interval Cancer: A cohort study. Ann. Intern. Med. 2015, 162, 673–681. [Google Scholar] [CrossRef] [PubMed] [Green Version]
- McCormack, V.A. Breast Density and Parenchymal Patterns as Markers of Breast Cancer Risk: A Meta-analysis. Cancer Epidemiol. Biomark. Prev. 2006, 15, 1159–1169. [Google Scholar] [CrossRef] [PubMed] [Green Version]
- Sickles, E.A. The Use of Breast Imaging to Screen Women at High Risk for Cancer. Radiol. Clin. N. Am. 2010, 48, 859–878. [Google Scholar] [CrossRef] [PubMed]
- Jackson, V.P. The role of US in breast imaging. Radiology 1990, 177, 305–311. [Google Scholar] [CrossRef] [PubMed]
- Rebolj, M.; Assi, V.; Brentnall, A.; Parmar, D.; Duffy, S.W. Addition of ultrasound to mammography in the case of dense breast tissue: Systematic review and meta-analysis. Br. J. Cancer 2018, 118, 1559–1570. [Google Scholar] [CrossRef] [PubMed]
- Giger, M.L.; Al-Hallaq, H.; Huo, Z.; Moran, C.; Wolverton, D.E.; Chan, C.W.; Zhong, W. Computerized analysis of lesions in US images of the breast. Acad. Radiol. 1999, 6, 665–674. [Google Scholar] [CrossRef]
- Sivaramakrishna, R.; Powell, K.A.; Lieber, M.L.; Chilcote, W.A.; Shekhar, R. Texture analysis of lesions in breast ultrasound images. Comput. Med Imaging Graph. 2002, 26, 303–307. [Google Scholar] [CrossRef]
- Xiao, Y.; Zeng, J.; Niu, L.; Zeng, Q.; Wu, T.; Wang, C.; Zheng, R.; Zheng, H. Computer-Aided Diagnosis Based on Quantitative Elastographic Features with Supersonic Shear Wave Imaging. Ultrasound Med. Biol. 2014, 40, 275–286. [Google Scholar] [CrossRef] [PubMed]
- Zhang, Q.; Xiao, Y.; Chen, S.; Wang, C.; Zheng, H. Quantification of Elastic Heterogeneity Using Contourlet-Based Texture Analysis in Shear-Wave Elastography for Breast Tumor Classification. Ultrasound Med. Biol. 2015, 41, 588–600. [Google Scholar] [CrossRef] [PubMed]
- Brattain, L.J.; Telfer, B.A.; Dhyani, M.; Grajo, J.R.; Samir, A.E. Machine learning for medical ultrasound: Status, methods, and future opportunities. Abdom. Radiol. 2018, 43, 786–799. [Google Scholar] [CrossRef] [PubMed]
- Singh, V.K.; Abdel-Nasser, M.; Akram, F.; Rashwan, H.A.; Sarker, M.K.; Pandey, N.; Romani, S.; Puig, D. Breast tumor segmentation in ultrasound images using contextual-information-aware deep adversarial learning framework. Expert Syst. Appl. 2020, 162, 113870. [Google Scholar] [CrossRef]
- Han, S.; Kang, H.-K.; Jeong, J.-Y.; Park, M.-H.; Kim, W.; Bang, W.-C.; Seong, Y.-K. A deep learning framework for supporting the classification of breast lesions in ultrasound images. Phys. Med. Biol. 2017, 62, 7714–7728. [Google Scholar] [CrossRef] [PubMed]
- Zhang, Q.; Xiao, Y.; Dai, W.; Suo, J.; Wang, C.; Shi, J.; Zheng, H. Deep learning based classification of breast tumors with shear-wave elastography. Ultrasonics 2016, 72, 150–157. [Google Scholar] [CrossRef]
- Shi, J.; Zhou, S.; Liu, X.; Zhang, Q.; Lu, M.; Wang, T. Stacked deep polynomial network based representation learning for tumor classification with small ultrasound image dataset. Neurocomputing 2016, 194, 87–94. [Google Scholar] [CrossRef]
- Cheng, J.-Z.; Ni, D.; Chou, Y.-H.; Qin, J.; Tiu, C.-M.; Chang, Y.-C.; Huang, C.-S.; Shen, D.; Chen, C.-M. Computer-Aided Diagnosis with Deep Learning Architecture: Applications to Breast Lesions in US Images and Pulmonary Nodules in CT Scans. Sci. Rep. 2016, 6, 24454. [Google Scholar] [CrossRef] [Green Version]
- Schlemper, J.; Oktay, O.; Schaap, M.; Heinrich, M.; Kainz, B.; Glocker, B.; Rueckert, D. Attention gated networks: Learning to leverage salient regions in medical images. Med. Image Anal. 2019, 53, 197–207. [Google Scholar] [CrossRef] [PubMed]
- Cao, C.; Liu, X.; Yang, Y.; Yu, Y.; Wang, J.; Wang, Z.; Huang, Y.; Huang, C.; Xu, W.; Ramanan, D.; et al. Look and Think Twice: Capturing Top-Down Visual Attention with Feedback Convolutional Neural Networks. In Proceedings of the 2015 IEEE International Conference on Computer Vision (ICCV), Santiago, Chile, 7–13 December 2015; pp. 2956–2964. [Google Scholar]
- Zhou, B.; Khosla, A.; Lapedriza, A.; Oliva, A.; Torralba, A. Learning deep features for discriminative localization. In Proceedings of the IEEE Conference on Computer Vision and Pattern Recognition, Las Vegas, NV, USA, 27–30 June 2016; pp. 2921–2929. [Google Scholar]
- Simonyan, K.; Vedaldi, A.; Zisserman, A. Deep Inside Convolutional Networks: Visualising Image Classification Models and Saliency Maps. arXiv 2014, arXiv:1312.6034. [Google Scholar]
- Zagoruyko, S.; Komodakis, N. Paying More Attention to Attention: Improving the Performance of Convolutional Neural Networks via Attention Transfer. arXiv 2017, arXiv:1612.03928. [Google Scholar]
- Simonyan, K.; Zisserman, A. Very deep convolutional networks for large-scale image recognition. arXiv 2014, arXiv:1409.1556. [Google Scholar]
- Yap, M.H.; Pons, G.; Marti, J.; Ganau, S.; Sentis, M.; Zwiggelaar, R.; Davison, A.K.; Martí, R. Automated Breast Ultrasound Lesions Detection Using Convolutional Neural Networks. IEEE J. Biomed. Health Inform. 2018, 22, 1218–1226. [Google Scholar] [CrossRef] [Green Version]
- Abraham, N.; Khan, N.M. A Novel Focal Tversky Loss Function with Improved Attention U-Net for Lesion Segmentation. In Proceedings of the 2019 IEEE 16th International Symposium on Biomedical Imaging (ISBI 2019), Venice, Italy, 8–11 April 2019; pp. 683–687. [Google Scholar]
- Oktay, O.; Schlemper, J.; Folgoc, L.L.; Lee, M.; Heinrich, M.; Misawa, K.; Mori, K.; McDonagh, S. Attention U-Net: Learning Where to Look for the Pancreas. arXiv 2018, arXiv:1804.03999. [Google Scholar]
- Hajiabadi, H.; Molla-Aliod, D.; Monsefi, R. On Extending Neural Networks with Loss Ensembles for Text Classification. In Proceedings of the Australasian Language Technology Association Workshop 2017, Brisbane, Australia, 6–8 December 2017; pp. 98–102. [Google Scholar]
- Murphy, K.P.; Bach, F. Machine Learning: A Probabilistic Perspective; MIT Press: Cambridge, MA, USA, 2012. [Google Scholar]
- Chen, P.; Chen, G.; Zhang, S. Log Hyperbolic Cosine Loss Improves Variational Auto-Encoder. In Proceedings of the 2018 Sixth International Conference on Learning Representations, Vancouver, BC, Canada, 30 April–3 May 2018. [Google Scholar]
- Krizhevsky, A.; Sutskever, I.; Hinton, G.E. ImageNet classification with deep convolutional neural networks. Adv. Neural Inf. Process. 2012, 2, 1097–1105. [Google Scholar] [CrossRef]
- Hinton, G.E.; Srivastava, N.; Krizhevsky, A.; Sutskever, I.; Salakhutdinov, R.R. Improving neural networks by preventing co-adaptation of feature detectors. Comput. Sci. 2012, 3, 212–223. [Google Scholar]
- Powers, D.M. Evaluation: From precision, recall and f-measure to roc, informedness, markedness and correlation. J. Mach. Learn. Technol. 2011, 2, 37–63. [Google Scholar]
- Berg, W.A.; Mendelson, E.B.; Cosgrove, D.O.; Doré, C.J.; Gay, J.; Henry, J.-P.; Cohen-Bacrie, C. Quantitative Maximum Shear-Wave Stiffness of Breast Masses as a Predictor of Histopathologic Severity. Am. J. Roentgenol. 2015, 205, 448–455. [Google Scholar] [CrossRef] [PubMed] [Green Version]
| Publisher’s Note: MDPI stays neutral with regard to jurisdictional claims in published maps and institutional affiliations. |
© 2021 by the authors. Licensee MDPI, Basel, Switzerland. This article is an open access article distributed under the terms and conditions of the Creative Commons Attribution (CC BY) license (https://creativecommons.org/licenses/by/4.0/).


