
Biomarkers of Cholestasis and Liver Injury in the Early Phase of Acute Respiratory Distress Syndrome and Their Pathophysiological Value

 , and
, and
Abstract
:1. Introduction
2. Materials and Methods
3. Results
4. Discussion
5. Conclusions
Supplementary Materials
Author Contributions
Funding
Institutional Review Board Statement
Informed Consent Statement
Data Availability Statement
Conflicts of Interest
References
- Fuhrmann, V.; Kneidinger, N.; Herkner, H.; Heinz, G.; Nikfardjam, M.; Bojic, A.; Schellongowski, P.; Angermayr, B.; Schoniger-Hekele, M.; Madl, C.; et al. Impact of hypoxic hepatitis on mortality in the intensive care unit. Intensive Care Med. 2011, 37, 1302–1310. [Google Scholar] [CrossRef] [PubMed]
- Kramer, L.; Jordan, B.; Druml, W.; Bauer, P.; Metnitz, P.G.; Austrian Epidemiologic Study on Intensive Care, A.S.G. Incidence and prognosis of early hepatic dysfunction in critically ill patients—A prospective multicenter study. Crit. Care Med. 2007, 35, 1099–1104. [Google Scholar] [CrossRef]
- Birrer, R.; Takuda, Y.; Takara, T. Hypoxic hepatopathy: Pathophysiology and prognosis. Intern. Med. 2007, 46, 1063–1070. [Google Scholar] [CrossRef] [PubMed] [Green Version]
- Kortgen, A.; Paxian, M.; Werth, M.; Recknagel, P.; Rauchfuss, F.; Lupp, A.; Krenn, C.G.; Muller, D.; Claus, R.A.; Reinhart, K.; et al. Prospective assessment of hepatic function and mechanisms of dysfunction in the critically ill. Shock 2009, 32, 358–365. [Google Scholar] [CrossRef] [PubMed]
- Kulaksiz, H.; Heuberger, D.; Engler, S.; Stiehl, A. Poor outcome in progressive sclerosing cholangitis after septic shock. Endoscopy 2008, 40, 214–218. [Google Scholar] [CrossRef] [PubMed]
- Lone, N.I.; Walsh, T.S. Impact of intensive care unit organ failures on mortality during the five years after a critical illness. Am. J. Respir. Crit. Care Med. 2012, 186, 640–647. [Google Scholar] [CrossRef] [PubMed]
- Kirchner, G.I.; Scherer, M.N.; Obed, A.; Ruemmele, P.; Wiest, R.; Froh, M.; Loss, M.; Schlitt, H.J.; Scholmerich, J.; Gelbmann, C.M. Outcome of patients with ischemic-like cholangiopathy with secondary sclerosing cholangitis after liver transplantation. Scand. J. Gastroenterol. 2011, 46, 471–478. [Google Scholar] [CrossRef] [PubMed]
- Taramasso, L.; Vena, A.; Bovis, F.; Portunato, F.; Mora, S.; Dentone, C.; Delfino, E.; Mikulska, M.; Giacobbe, D.R.; De Maria, A.; et al. Higher Mortality and Intensive Care Unit Admissions in COVID-19 Patients with Liver Enzyme Elevations. Microorganisms 2020, 8, 2010. [Google Scholar] [CrossRef] [PubMed]
- Henrion, J.; Schapira, M.; Luwaert, R.; Colin, L.; Delannoy, A.; Heller, F.R. Hypoxic hepatitis: Clinical and hemodynamic study in 142 consecutive cases. Medicine 2003, 82, 392–406. [Google Scholar] [CrossRef]
- Seeto, R.K.; Fenn, B.; Rockey, D.C. Ischemic hepatitis: Clinical presentation and pathogenesis. Am. J. Med. 2000, 109, 109–113. [Google Scholar] [CrossRef]
- Whitehead, M.W.; Hawkes, N.D.; Hainsworth, I.; Kingham, J.G. A prospective study of the causes of notably raised aspartate aminotransferase of liver origin. Gut 1999, 45, 129–133. [Google Scholar] [CrossRef] [PubMed]
- Johnson, R.D.; O'Connor, M.L.; Kerr, R.M. Extreme serum elevations of aspartate aminotransferase. Am. J. Gastroenterol. 1995, 90, 1244–1245. [Google Scholar]
- Fuhrmann, V.; Kneidinger, N.; Herkner, H.; Heinz, G.; Nikfardjam, M.; Bojic, A.; Schellongowski, P.; Angermayr, B.; Kitzberger, R.; Warszawska, J.; et al. Hypoxic hepatitis: Underlying conditions and risk factors for mortality in critically ill patients. Intensive Care Med. 2009, 35, 1397–1405. [Google Scholar] [CrossRef] [PubMed]
- Henrion, J.; Minette, P.; Colin, L.; Schapira, M.; Delannoy, A.; Heller, F.R. Hypoxic hepatitis caused by acute exacerbation of chronic respiratory failure: A case-controlled, hemodynamic study of 17 consecutive cases. Hepatology 1999, 29, 427–433. [Google Scholar] [CrossRef]
- Henrion, J.; Colin, L.; Schapira, M.; Heller, F.R. Hypoxic hepatitis caused by severe hypoxemia from obstructive sleep apnea. J. Clin. Gastroenterol. 1997, 24, 245–249. [Google Scholar] [CrossRef]
- Leonhardt, S.; Veltzke-Schlieker, W.; Adler, A.; Schott, E.; Hetzer, R.; Schaffartzik, W.; Tryba, M.; Neuhaus, P.; Seehofer, D. Trigger mechanisms of secondary sclerosing cholangitis in critically ill patients. Crit. Care 2015, 19, 131. [Google Scholar] [CrossRef] [PubMed] [Green Version]
- Fuhrmann, V.; Jager, B.; Zubkova, A.; Drolz, A. Hypoxic hepatitis-epidemiology, pathophysiology and clinical management. Wien. Klin. Wochenschr. 2010, 122, 129–139. [Google Scholar] [CrossRef] [PubMed]
- Ebert, E.C. Hypoxic liver injury. Mayo Clin. Proc. 2006, 81, 1232–1236. [Google Scholar] [CrossRef] [PubMed] [Green Version]
- Gelbmann, C.M.; Rummele, P.; Wimmer, M.; Hofstadter, F.; Gohlmann, B.; Endlicher, E.; Kullmann, F.; Langgartner, J.; Scholmerich, J. Ischemic-like cholangiopathy with secondary sclerosing cholangitis in critically ill patients. Am. J. Gastroenterol. 2007, 102, 1221–1229. [Google Scholar] [CrossRef] [PubMed]
- Li, M.K.; Crawford, J.M. The pathology of cholestasis. Semin Liver Dis 2004, 24, 21–42. [Google Scholar] [CrossRef] [PubMed]
- Kobayashi, S.; Nakanuma, Y.; Matsui, O. Intrahepatic Peribiliary Vascular Plexus in Various Hepatobiliary Diseases—A Histological Survey. Hum. Pathol. 1994, 25, 940–946. [Google Scholar] [CrossRef]
- Saner, F.H.; Olde Damink, S.W.M.; Pavlaković, G.; Sotiropoulos, G.C.; Radtke, A.; Treckmann, J.; Beckebaum, S.; Cicinnati, V.; Paul, A. How far can we go with positive end-expiratory pressure (PEEP) in liver transplant patients? J. Clin. Anesth. 2010, 22, 104–109. [Google Scholar] [CrossRef]
- Bein, T.; Grasso, S.; Moerer, O.; Quintel, M.; Guerin, C.; Deja, M.; Brondani, A.; Mehta, S. The standard of care of patients with ARDS: Ventilatory settings and rescue therapies for refractory hypoxemia. Intensive Care Med. 2016, 42, 699–711. [Google Scholar] [CrossRef] [PubMed] [Green Version]
- Gattinoni, L.; Quintel, M. How ARDS should be treated. Crit. Care 2016, 20, 86. [Google Scholar] [CrossRef] [PubMed] [Green Version]
- Putensen, C.; Wrigge, H.; Hering, R. The effects of mechanical ventilation on the gut and abdomen. Curr. Opin. Crit. Care 2006, 12, 160–165. [Google Scholar] [CrossRef] [PubMed]
- Michelet, P.; Roch, A.; Gainnier, M.; Sainty, J.M.; Auffray, J.P.; Papazian, L. Influence of support on intra-abdominal pressure, hepatic kinetics of indocyanine green and extravascular lung water during prone positioning in patients with ARDS: A randomized crossover study. Crit. Care 2005, 9, R251–R257. [Google Scholar] [CrossRef] [PubMed] [Green Version]
- Bonnert, F.; Richard, C.; Glaser, P.; Lafay, M. Changes in hepatic flow induced by continuous positive pressure ventilation in critically ill patients. Crit. Care Med. 1982, 10, 703–706. [Google Scholar] [CrossRef] [PubMed]
- Chikhani, M.; Evans, D.L.; Blatcher, A.W.; Jackson, A.P.; Guha, I.N.; Aithal, G.P.; Moppett, I.K. The effect of prone positioning with surgical bolsters on liver blood flow in healthy volunteers. Anaesthesia 2016, 71, 550–555. [Google Scholar] [CrossRef] [PubMed] [Green Version]
- Saner, F.H.; Pavlaković, G.; Gu, Y.; Fruhauf, N.R.; Paul, A.; Radtke, A.; Nadalin, S.; Malagó, M.; Broelsch, C.E. Does PEEP impair the hepatic outflow in patients following liver transplantation? Intensive Care Med. 2006, 32, 1584–1590. [Google Scholar] [CrossRef]
- Brienza, N.; Revelly, J.P.; Ayuse, T.; Robotham, J.L. Effects of PEEP on liver arterial and venous blood flows. Am. J. Respir. Crit. Care Med. 1995, 152, 504–510. [Google Scholar] [CrossRef]
- Kimberly, W.T. Biomarkers in neurocritical care. Neurotherapeutics 2012, 9, 17–23. [Google Scholar] [CrossRef] [Green Version]
- Ackland, G.L.; Mythen, M.G. Novel biomarkers in critical care: Utility or futility? Crit. Care 2007, 11, 175. [Google Scholar] [CrossRef] [Green Version]
- Kibe, S.; Adams, K.; Barlow, G. Diagnostic and prognostic biomarkers of sepsis in critical care. J. Antimicrob. Chemother. 2011, 66 (Suppl. 2), ii33–ii40. [Google Scholar] [CrossRef] [PubMed] [Green Version]
- Leonhardt, J.; Haider, R.S.; Sponholz, C.; Leonhardt, S.; Drube, J.; Spengler, K.; Mihaylov, D.; Neugebauer, S.; Kiehntopf, M.; Lambert, N.A.; et al. Circulating Bile Acids in Liver Failure Activate TGR5 and Induce Monocyte Dysfunction. Cell. Mol. Gastroenterol. Hepatol. 2021, 12, 25–40. [Google Scholar] [CrossRef] [PubMed]
- Rose-John, S. IL-6 trans-signaling via the soluble IL-6 receptor: Importance for the pro-inflammatory activities of IL-6. Int. J. Biol. Sci. 2012, 8, 1237–1247. [Google Scholar] [CrossRef]
- Brandstetter, S.; Dodoo-Schittko, F.; Blecha, S.; Sebok, P.; Thomann-Hackner, K.; Quintel, M.; Weber-Carstens, S.; Bein, T.; Apfelbacher, C. Influence of quality of care and individual patient characteristics on quality of life and return to work in survivors of the acute respiratory distress syndrome: Protocol for a prospective, observational, multi-centre patient cohort study (DACAPO). BMC Health Serv. Res. 2015, 15, 563. [Google Scholar] [CrossRef] [PubMed] [Green Version]
- Kumachev, A.; Wu, P.E. Drug-induced liver injury. CMAJ 2021, 193, E310. [Google Scholar] [CrossRef] [PubMed]
- Hoofnagle, J.H.; Bjornsson, E.S. Drug-Induced Liver Injury—Types and Phenotypes. N. Engl. J. Med. 2019, 381, 264–273. [Google Scholar] [CrossRef] [PubMed]
- Woreta, T.A.; Alqahtani, S.A. Evaluation of abnormal liver tests. Med. Clin. N. Am. 2014, 98, 1–16. [Google Scholar] [CrossRef] [PubMed]
- Lin, T.; Qu, K.; Xu, X.; Tian, M.; Gao, J.; Zhang, C.; Di, Y.; Zhang, Y.; Liu, C. Sclerosing cholangitis in critically ill patients: An important and easily ignored problem based on a German experience. Front. Med. 2014, 8, 118–126. [Google Scholar] [CrossRef] [PubMed]
- Geiger, K.; Georgieff, M.; Lutz, H. Side effects of positive pressure ventilation on hepatic function and splanchnic circulation. Int.J. Clin. Monit. Comput. 1986, 3, 103–106. [Google Scholar] [CrossRef] [PubMed]
- Killip, T., 3rd; Payne, M.A. High serum transaminase activity in heart disease. Circulatory failure and hepatic necrosis. Circulation 1960, 21, 646–660. [Google Scholar] [CrossRef] [PubMed] [Green Version]
- Visentin, M.; Lenggenhager, D.; Gai, Z.; Kullak-Ublick, G.A. Drug-induced bile duct injury. Biochim. Biophys. Acta Mol. Basis Dis. 2018, 1864, 1498–1506. [Google Scholar] [CrossRef] [PubMed]
- Hirata, E.; Inoue, M.; Morino, Y. Mechanism of biliary secretion of membranous enzymes: Bile acids are important factors for biliary occurrence of gamma-glutamyltransferase and other hydrolases. J. Biochem. 1984, 96, 289–297. [Google Scholar] [CrossRef] [PubMed]
- Arrese, M.; Pizarro, M.; Solís, N.; Koenig, C.; Accatino, L. Enhanced biliary excretion of canalicular membrane enzymes in ethynylestradiol-inducedcholestasis. Biochem. Pharmacol. 1995, 50, 1223–1232. [Google Scholar] [CrossRef]
- Accatino, L.; Figueroa, C.; Pizarro, M.; Solís, N. Enhanced biliary excretion of canalicular membrane enzymes in estrogen-induced and obstructive cholestasis, and effects of different bile acids in the isolated perfused rat liver. J. Hepatol. 1995, 22, 658–670. [Google Scholar] [CrossRef]
- Schlaeger, R.; Haux, P.; Kattermann, R. Studies on the mechanism of the increase in serum alkaline phosphatase activity in cholestasis: Significance of the hepatic bile acid concentration for the leakage of alkaline phosphatase from rat liver. Enzyme 1982, 28, 3–13. [Google Scholar] [CrossRef] [PubMed]
- Harnisch, L.O.; Moerer, O. The Specific Bile Acid Profile of Shock: A Hypothesis Generating Appraisal of the Literature. J. Clin. Med. 2020, 9, 3844. [Google Scholar] [CrossRef] [PubMed]


| Parameter | Mean ± SD | ||
|---|---|---|---|
| Age (years) | 58.0 ± 14.9 | ||
| Female:male | 27:43 | ||
| SAPS II | 40.0 ± 12.1 | ||
| ARDS severity | mild | moderate | severe |
| 4 | 38 | 28 | |
| Deceased in ICU | 19 | ||
| Cause of ARDS | pulmonal | extrapulmonal | |
| 40 | 30 | ||
| ECMO therapy | 21 (30%) | ||
| Parameter | Day 0 | Day 3 | Day 5 | Day 10 |
|---|---|---|---|---|
| Total bilirubin (mg/dl) | 0.6 (0.4–1.275) | 0.6 (0.4–1.1) | 0.7 (0.4–1.5) | 0.9 (0.5–1.875) |
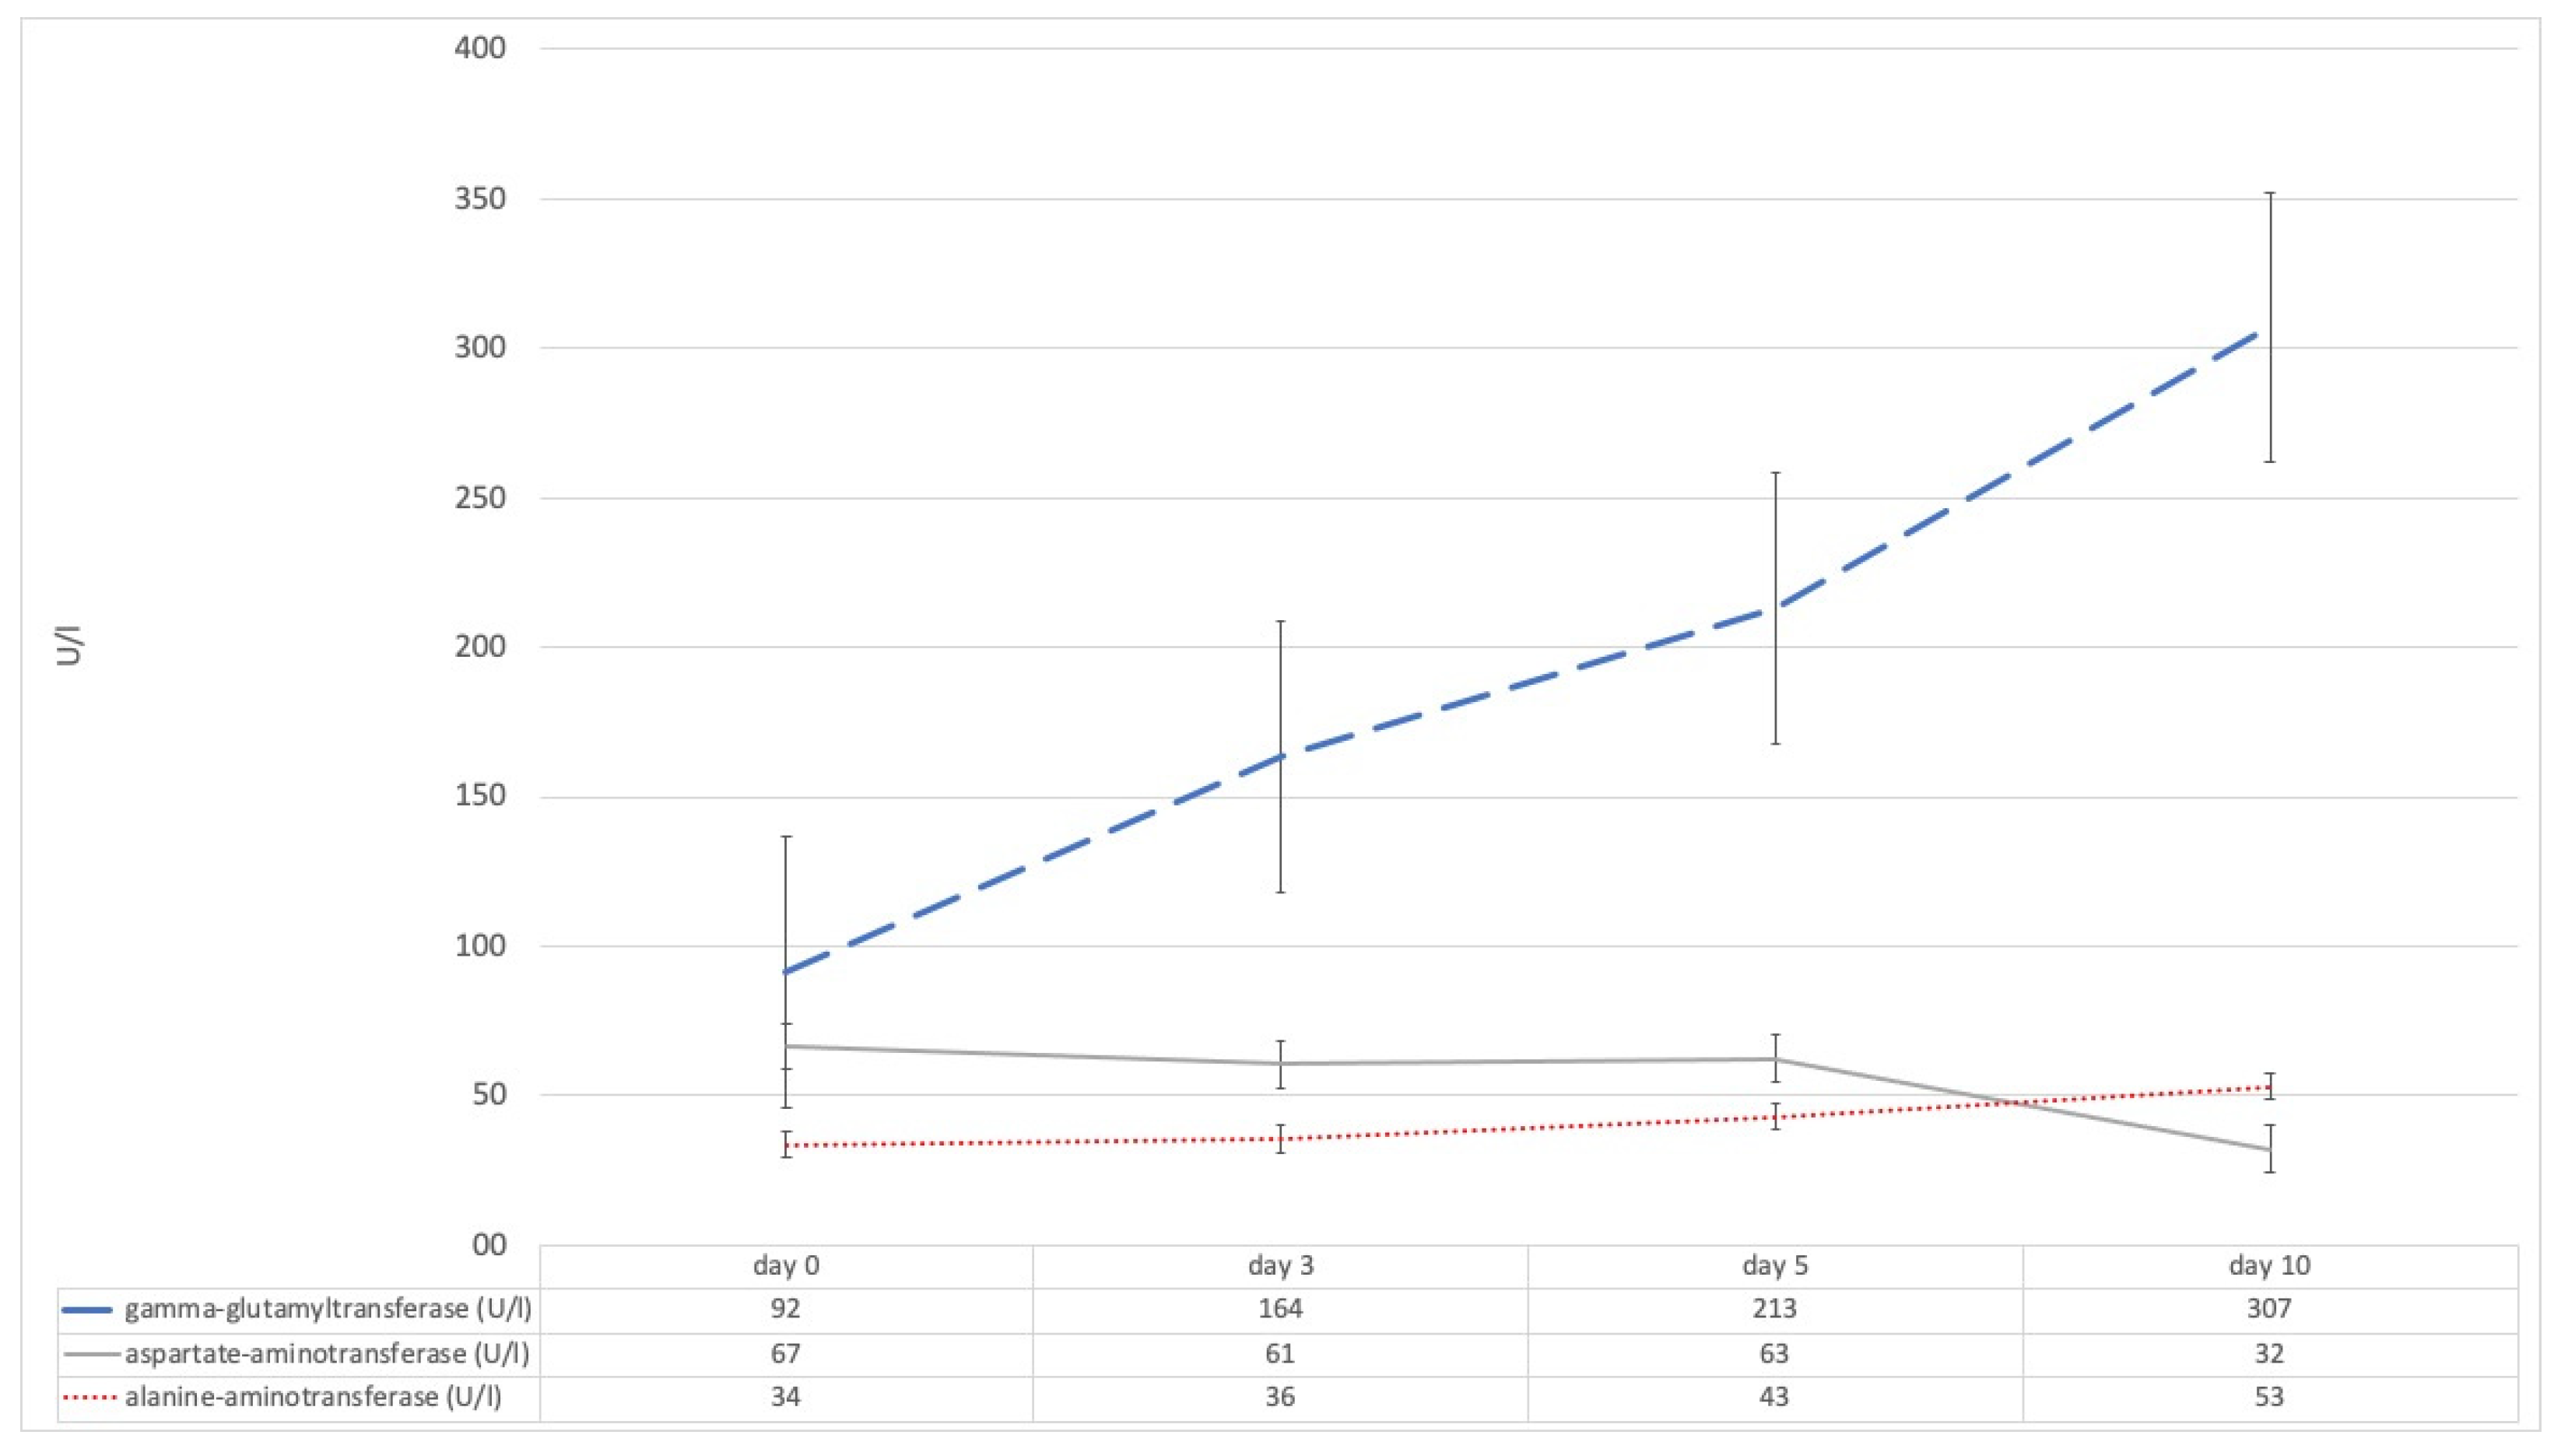
| Gamma-glutamyltransferase (U/l) | 91.5 (47–202.5) | 163.5 (86.75–253.25) | 213 (124–355.5) | 307 (143–767) |
| Aspartat aminotransferase (U/l) | 66.5 (32.5–119) | 60.5 (38–119.5) | 63.5 (32.25–106.5) | 32.1 (32.05–32.1) |
| Alanin aminotransferase (U/l) | 33.5 (17.75–83.25) | 35.5 (20.75–69.25) | 43 (22–75) | 53 (28.5–90) |
| Total bile acids (µM/l) | 2.42 (1.16–5.69) | 5.14 (2.7–7.42) | 5.41 (2.40–10.99) | n.a. |
| lowest paO2 (mmHg) | 60 (53–71.5) | 65.5 (58.25–73) | 65 (57.25–74.75) | 68 (60–79) |
| mean paO2 (mmHg) | 84.25 (77.1–95.38) | 84.35 (76.7–93.33) | 81.05 (74.53–91.13) | 86.15 (78.03–97.53) |
| mean PEEP (cmH2O) | 11.65 (9.78–13.83) | 10.7 (8–12.9) | 10.25 (8–12.93) | 10 (8.3–12) |
Publisher’s Note: MDPI stays neutral with regard to jurisdictional claims in published maps and institutional affiliations. |
© 2021 by the authors. Licensee MDPI, Basel, Switzerland. This article is an open access article distributed under the terms and conditions of the Creative Commons Attribution (CC BY) license (https://creativecommons.org/licenses/by/4.0/).
Share and Cite
Harnisch, L.-O.; Baumann, S.; Mihaylov, D.; Kiehntopf, M.; Bauer, M.; Moerer, O.; Quintel, M. Biomarkers of Cholestasis and Liver Injury in the Early Phase of Acute Respiratory Distress Syndrome and Their Pathophysiological Value. Diagnostics 2021, 11, 2356. https://0-doi-org.brum.beds.ac.uk/10.3390/diagnostics11122356
Harnisch L-O, Baumann S, Mihaylov D, Kiehntopf M, Bauer M, Moerer O, Quintel M. Biomarkers of Cholestasis and Liver Injury in the Early Phase of Acute Respiratory Distress Syndrome and Their Pathophysiological Value. Diagnostics. 2021; 11(12):2356. https://0-doi-org.brum.beds.ac.uk/10.3390/diagnostics11122356
Chicago/Turabian StyleHarnisch, Lars-Olav, Sophie Baumann, Diana Mihaylov, Michael Kiehntopf, Michael Bauer, Onnen Moerer, and Michael Quintel. 2021. "Biomarkers of Cholestasis and Liver Injury in the Early Phase of Acute Respiratory Distress Syndrome and Their Pathophysiological Value" Diagnostics 11, no. 12: 2356. https://0-doi-org.brum.beds.ac.uk/10.3390/diagnostics11122356