
Deep Learning-Based Four-Region Lung Segmentation in Chest Radiography for COVID-19 Diagnosis

 , , , , ,
Abstract
:1. Introduction
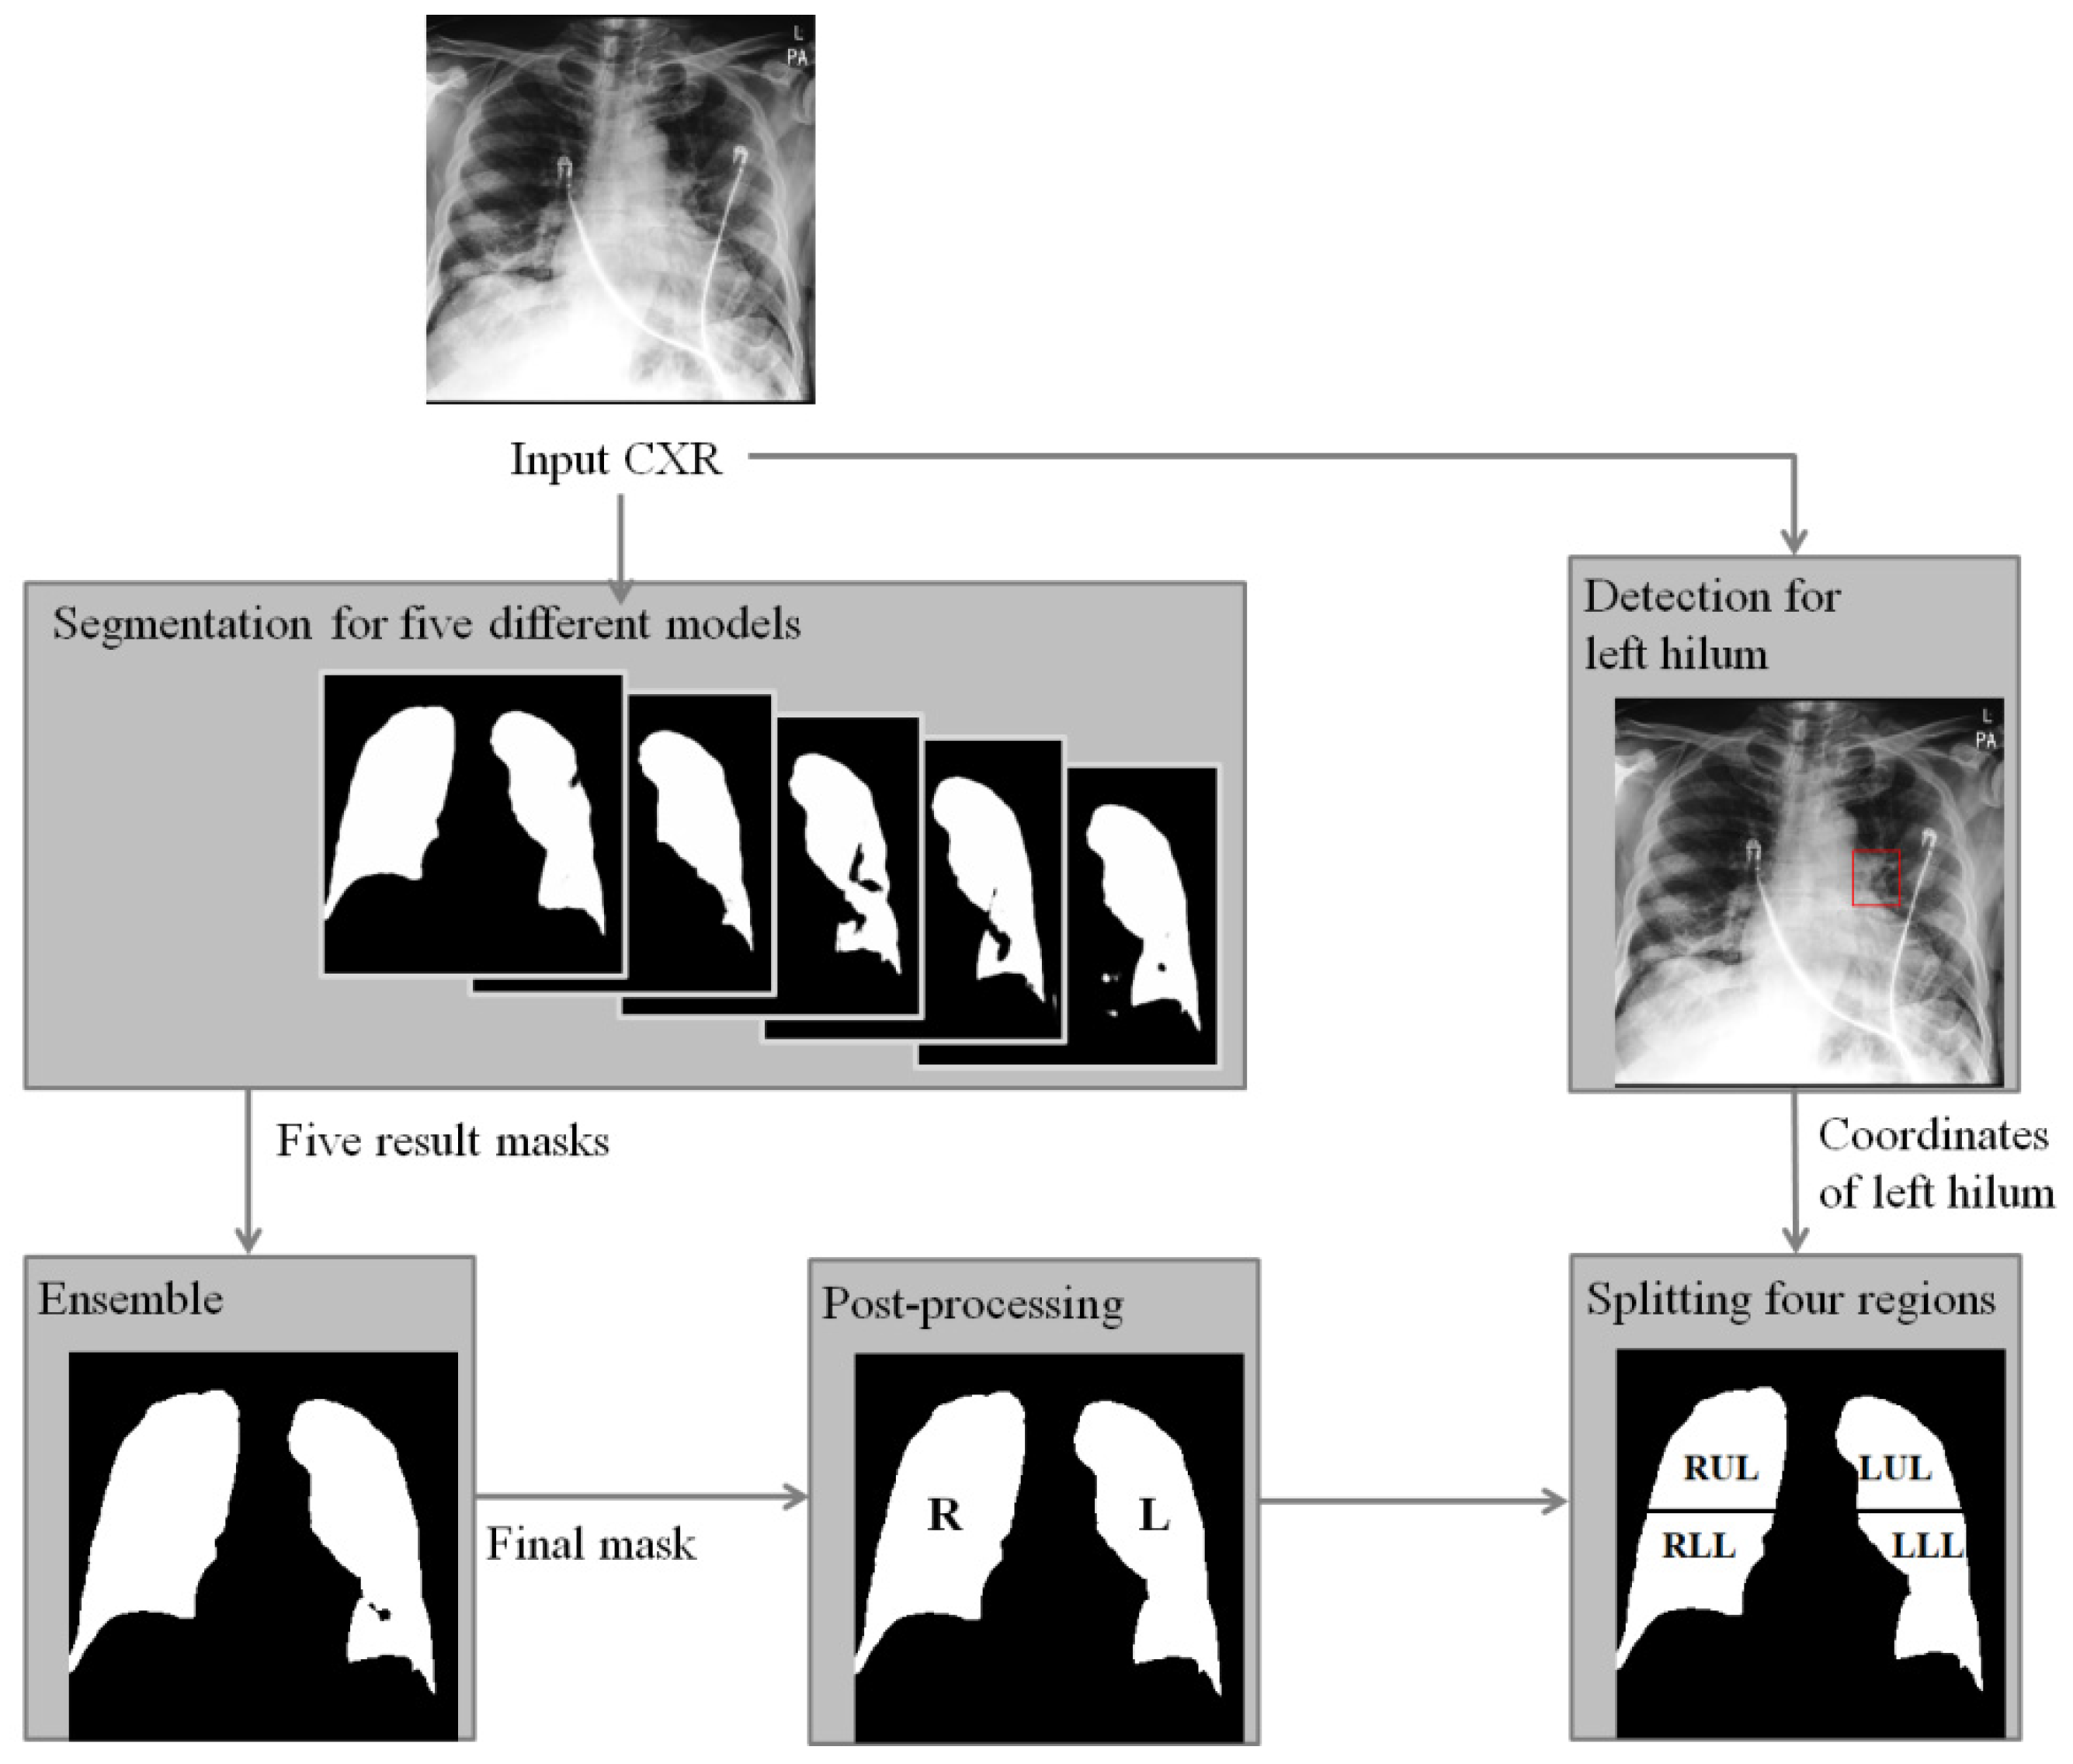
2. Method
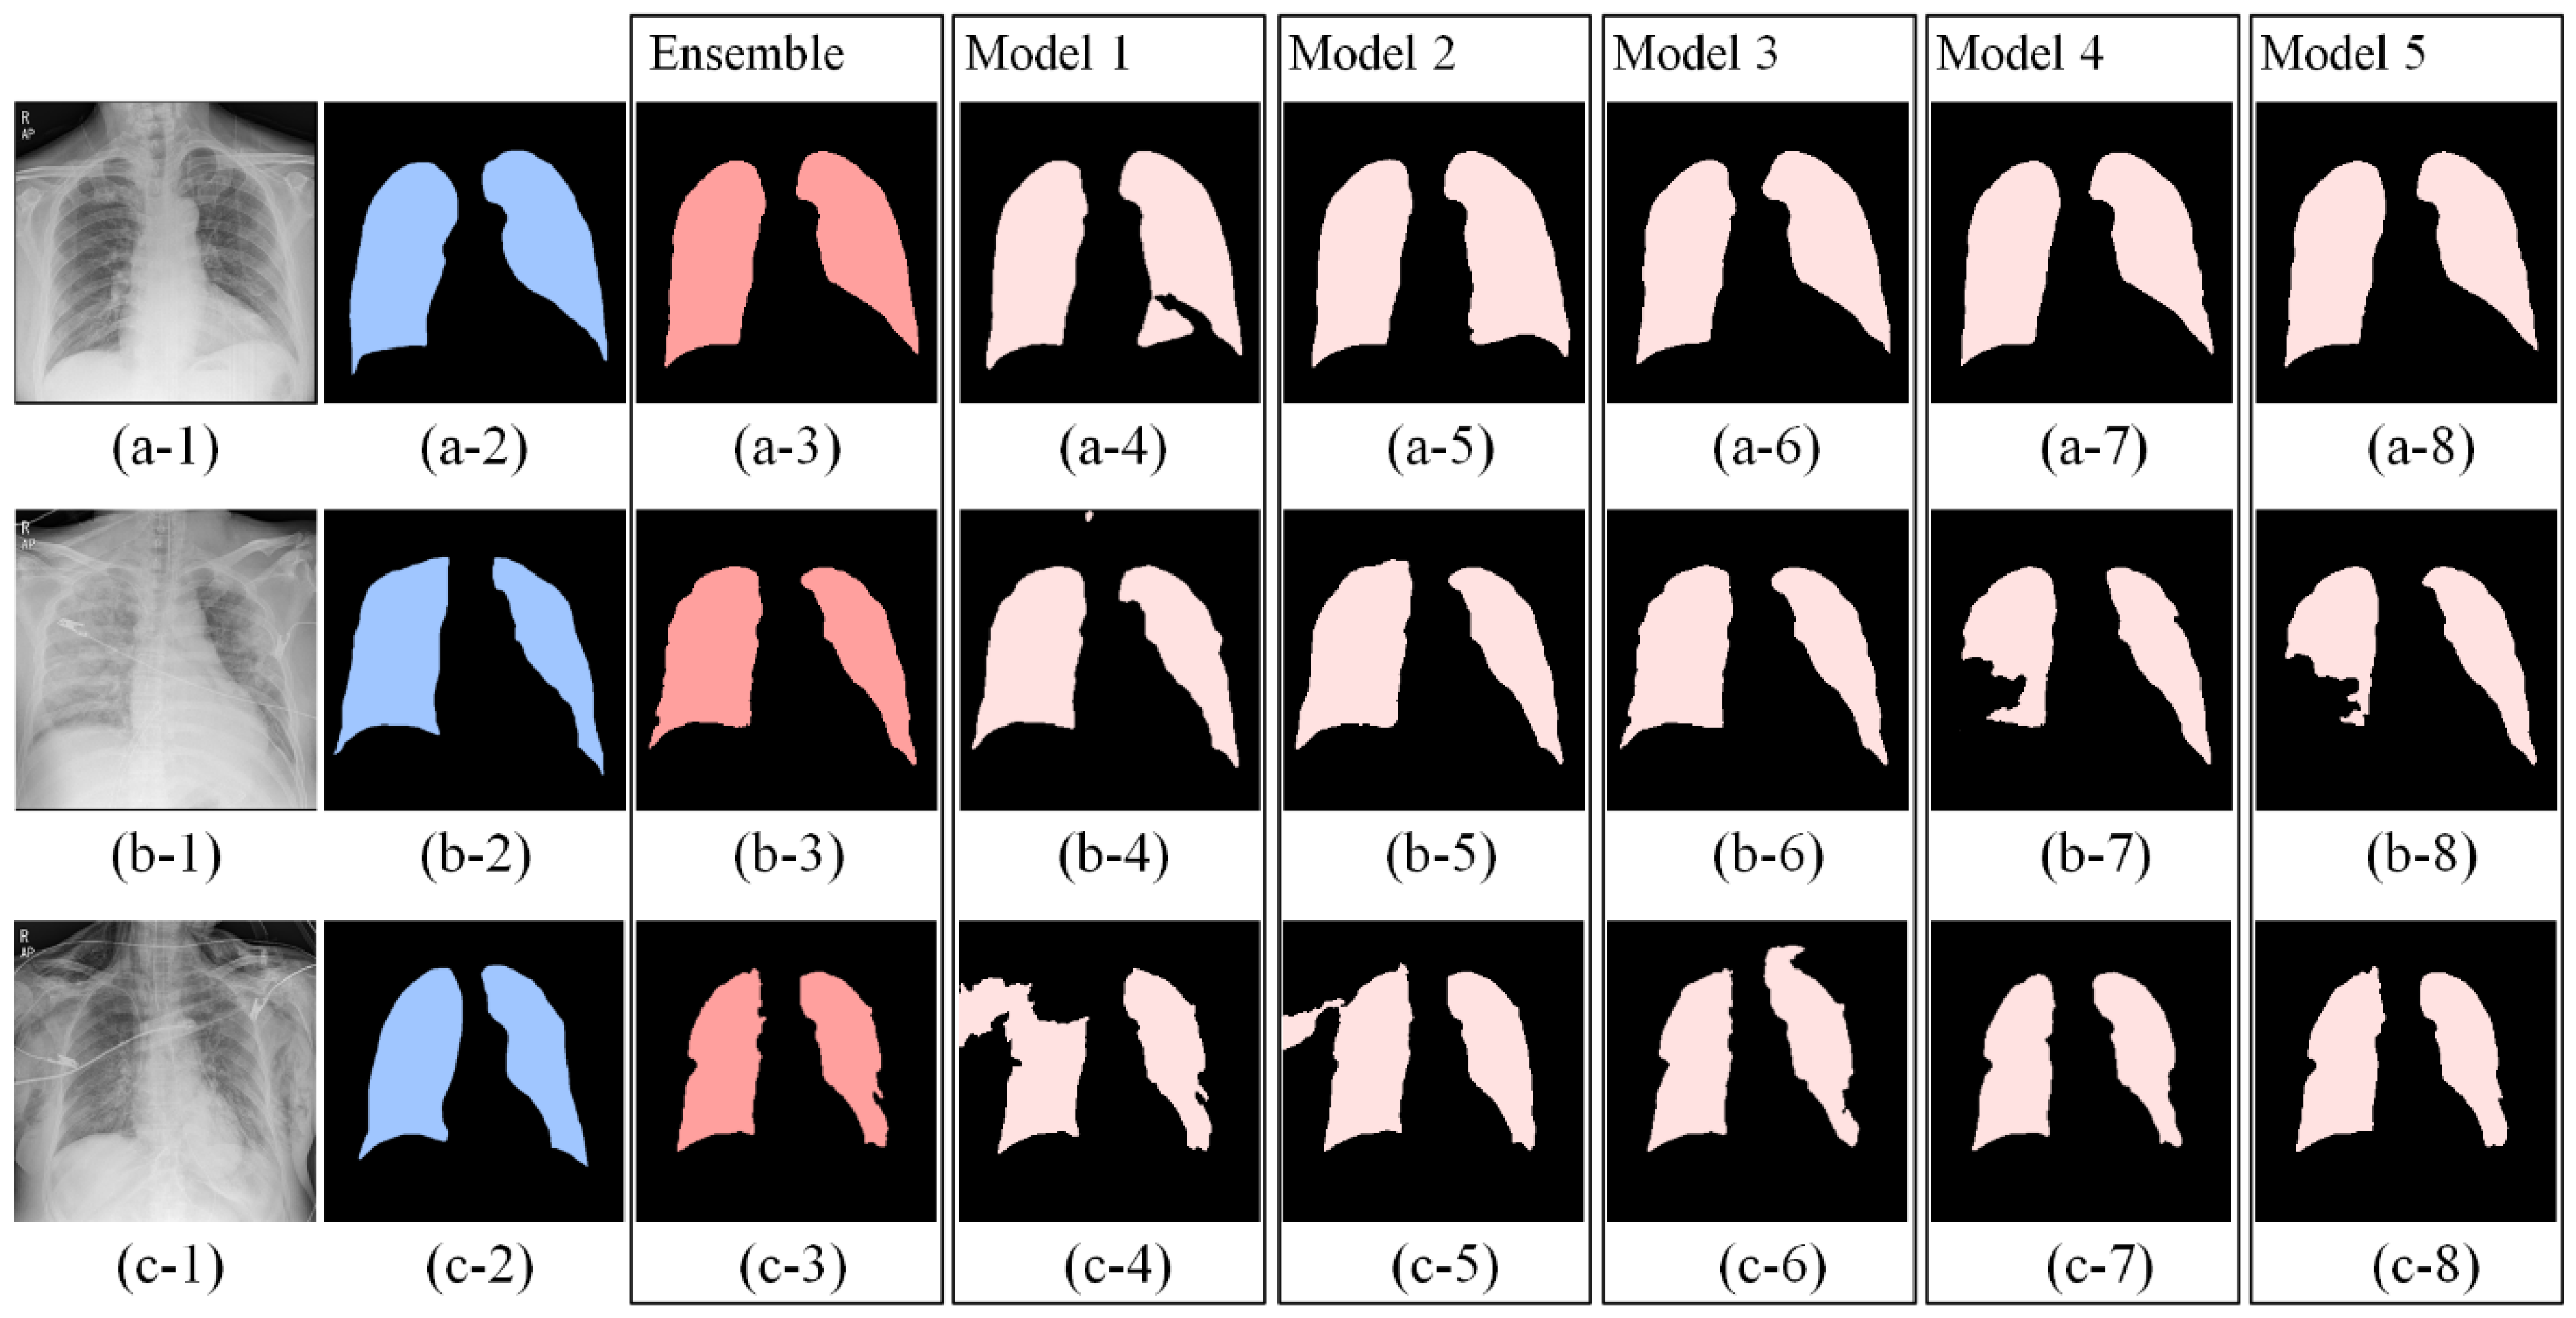
2.1. Segmentation Model
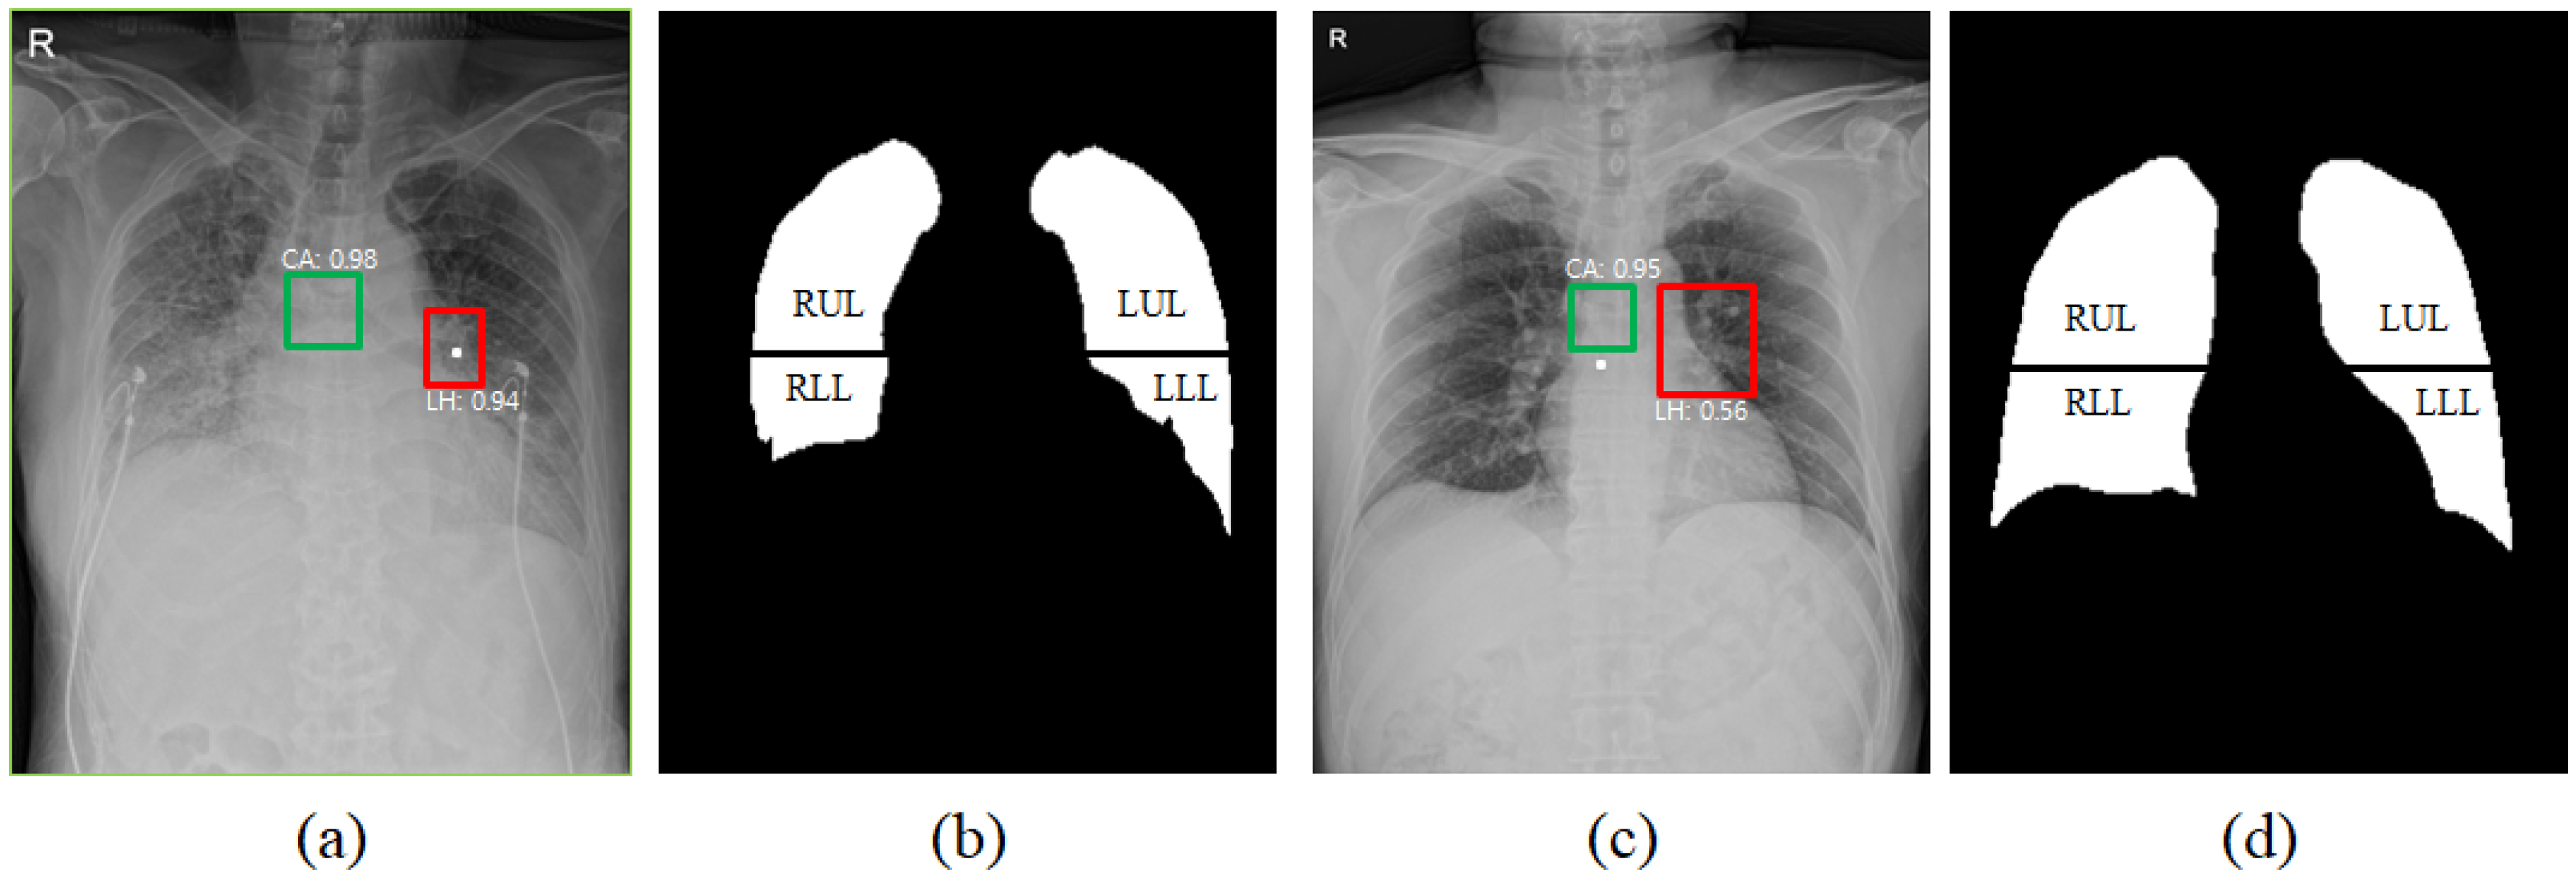
2.2. Detection Model
2.3. Normalization
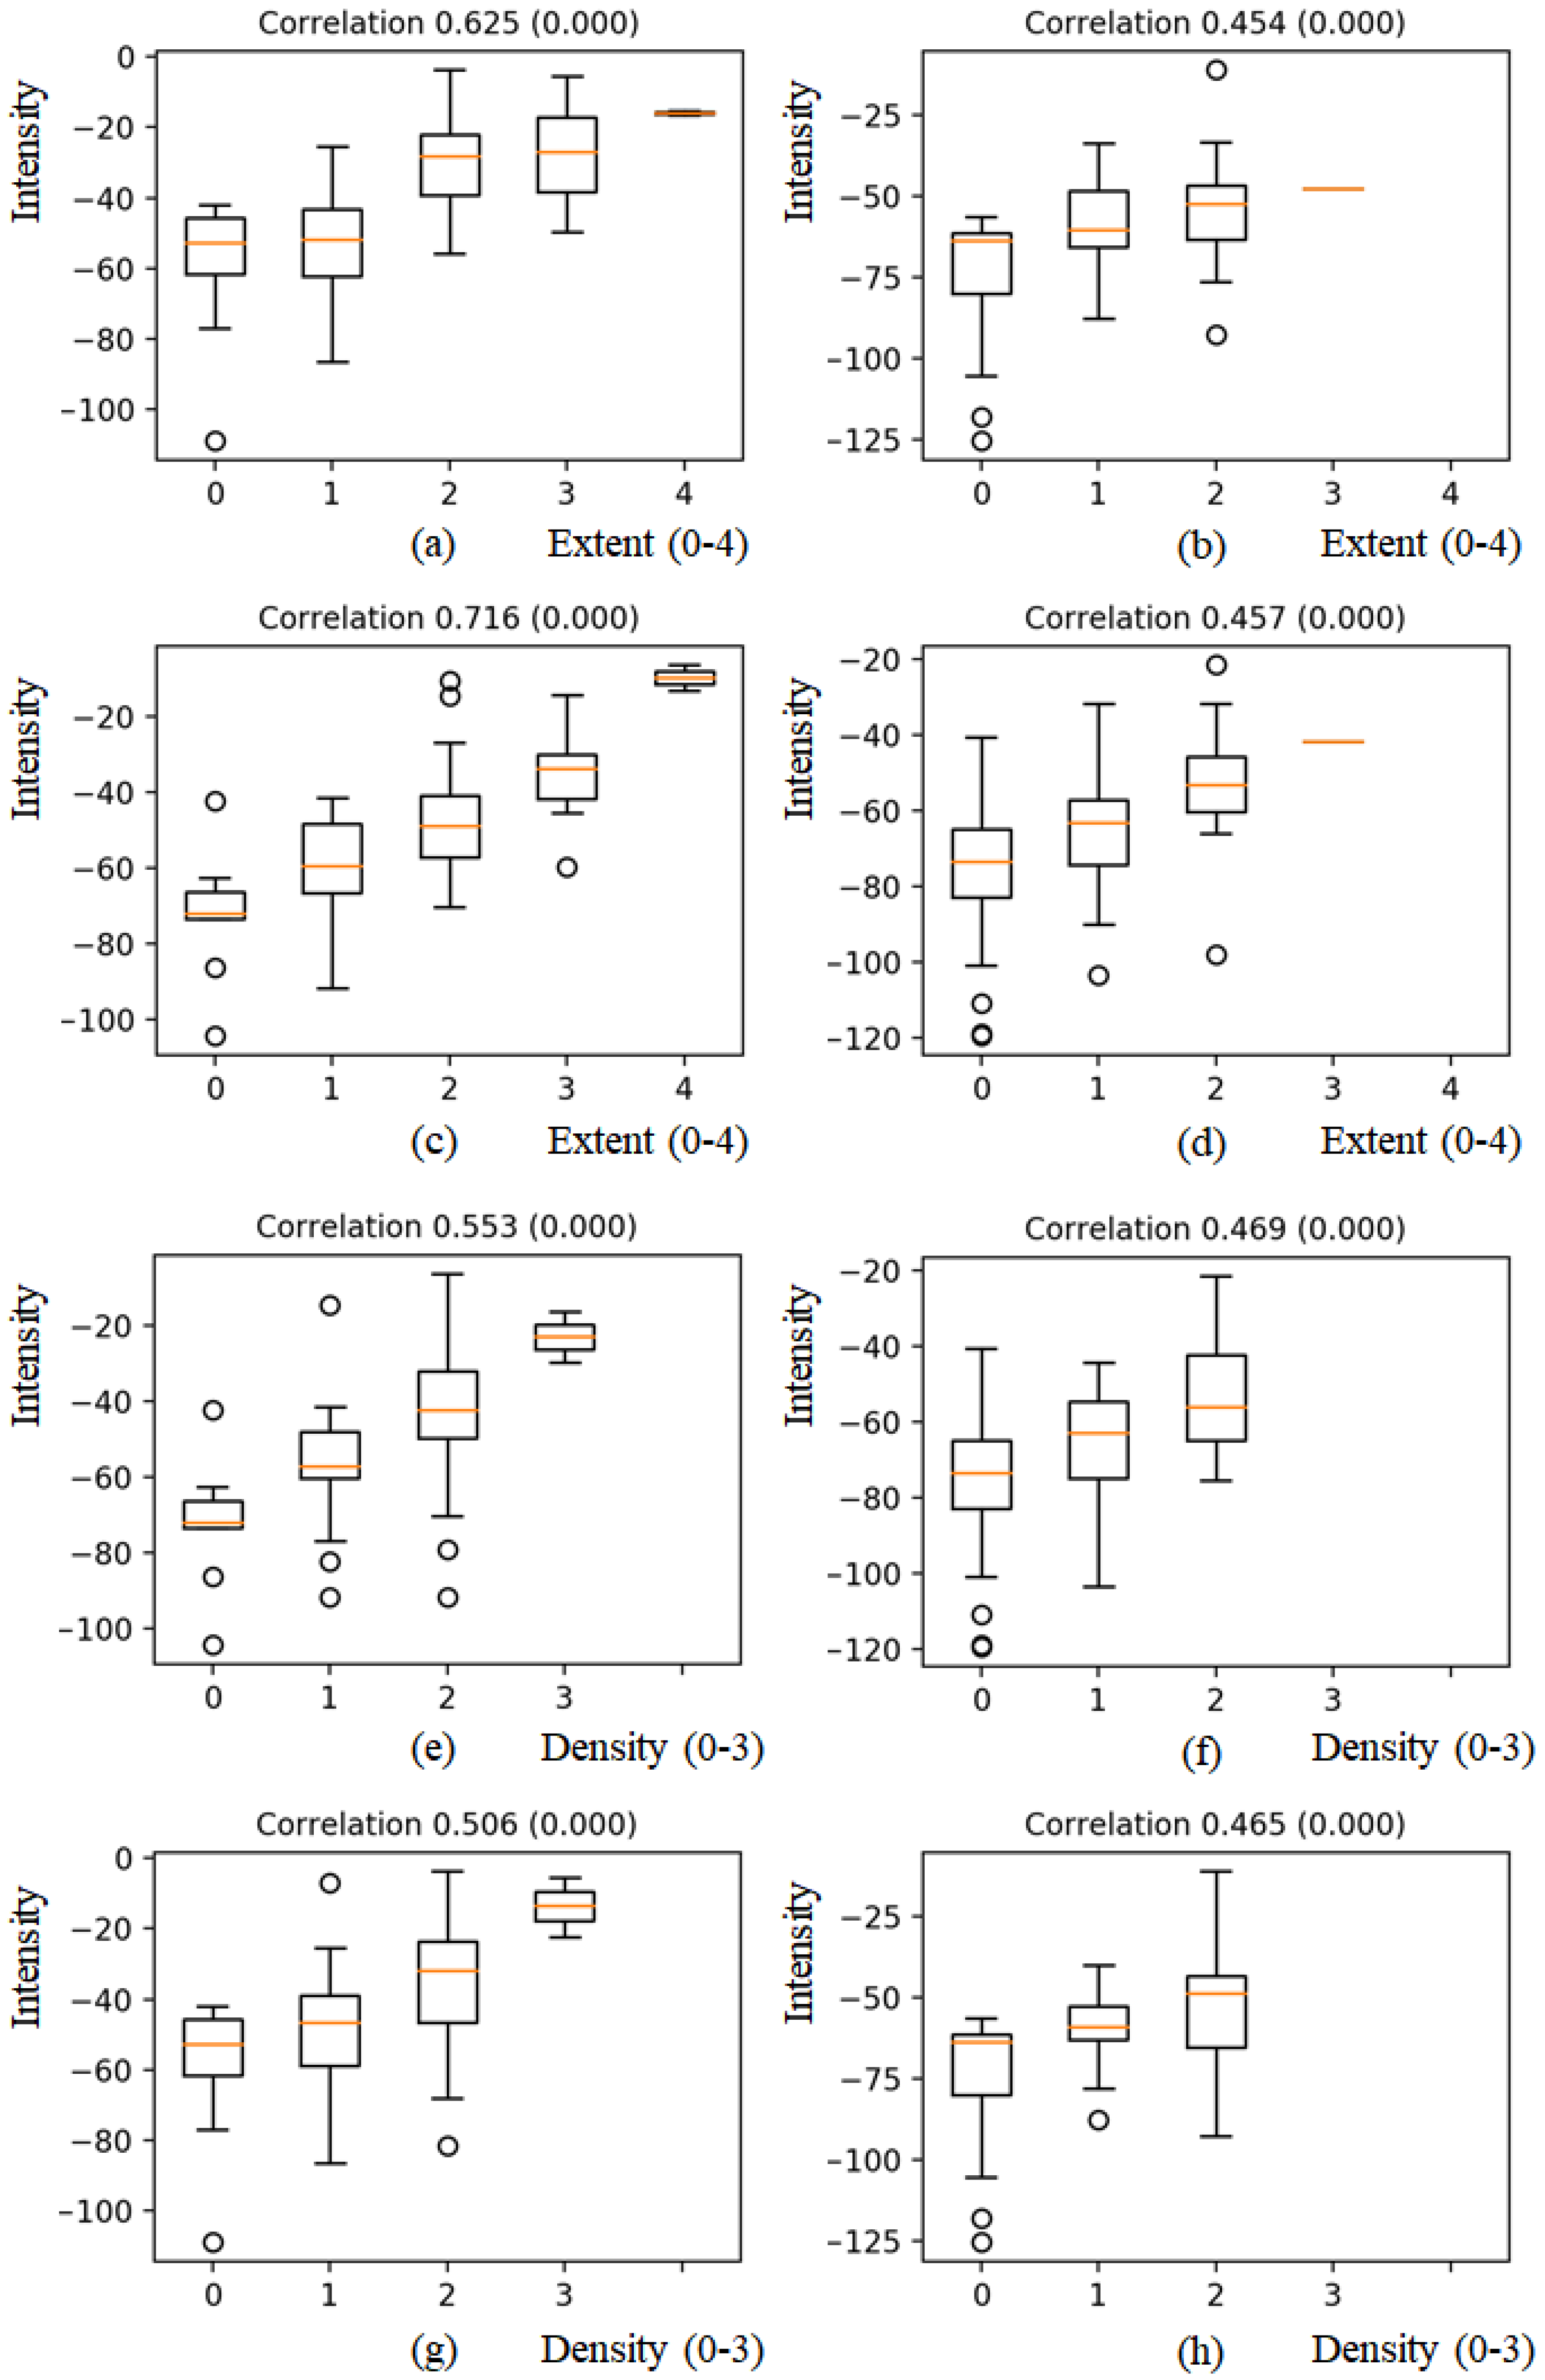
2.4. Correlation with RALE Score
2.5. Data Description
2.6. Experimental Environment
3. Results
4. Discussion
5. Conclusions
Author Contributions
Funding
Institutional Review Board Statement
Informed Consent Statement
Data Availability Statement
Conflicts of Interest
Abbreviations
| CXR | Chest X-ray radiography |
| RALE | Radiographic Assessment of the Quality of Lung Edema |
| ARDS | Acute Respiratory Distress Syndrome |
| RT-PCR | Reverse Transcription Polymerase Chain Reaction |
| RUR | Right Upper Region |
| RLR | Right Lower Region |
| LUR | Low Upper Region |
| LLR | Left Lower Region |
| mAP | Mean of Average Precision |
References
- Gibson, P.G.; Qin, L.; Puah, S. COVID-19 ARDS: Clinical features and differences to “usual” pre-COVID ARDS. Med. J. Aust. 2020, 213, 54–56. [Google Scholar] [CrossRef]
- Huang, C.; Wang, Y.; Li, X.; Ren, L.; Zhao, J.; Hu, Y.; Zhang, L.; Fan, G.; Xu, J.; Gu, X.; et al. Clinical features of patients infected with 2019 novel coronavirus in Wuhan, China. Lancet 2020, 395, 497–506. [Google Scholar] [CrossRef] [Green Version]
- Dong, E.; Du, H.; Gardner, L. An interactive web-based dashboard to track COVID-19 in real time. Lancet Infect. Dis. 2020, 20, 533–534. [Google Scholar] [CrossRef]
- Ai, T.; Yang, Z.; Hou, H.; Zhan, C.; Chen, C.; Lv, W.; Tao, Q.; Sun, Z.; Xia, L. Correlation of Chest CT and RT-PCR Testing for Coronavirus Disease 2019 (COVID-19) in China: A Report of 1014 Cases. Radiology 2020, 296, E32–E40. [Google Scholar] [CrossRef] [Green Version]
- Zhou, S.; Wang, Y.; Zhu, T.; Xia, L. CT Features of Coronavirus Disease 2019 (COVID-19) Pneumonia in 62 Patients in Wuhan, China. Am. J. Roentgenol. 2020, 214, 1287–1294. [Google Scholar] [CrossRef] [PubMed]
- Narin, A.; Kaya, C.; Pamuk, Z. Automatic detection of coronavirus disease (COVID-19) using X-ray images and deep convolutional neural networks. Pattern Anal. Appl. 2021, 24, 1207–1220. [Google Scholar] [CrossRef] [PubMed]
- Wang, L.; Wong, A. COVID-Net: A tailored deep convolutional neural network design for detection of COVID-19 cases from chest X-ray images. arXiv 2020, arXiv:2003.09871. [Google Scholar] [CrossRef] [PubMed]
- Hemdan, E.E.-D.; Shouman, M.A.; Karar, M.E. COVIDX-Net: A Framework of Deep Learning Classifiers to Diagnose COVID-19 in X-Ray Images. arXiv 2020, arXiv:2003.11055. [Google Scholar]
- Apostolopoulos, I.D.; Aznaouridis, S.I.; Tzani, M.A. Extracting Possibly Representative COVID-19 Biomarkers from X-ray Images with Deep Learning Approach and Image Data Related to Pulmonary Diseases. J. Med Biol. Eng. 2020, 40, 462–469. [Google Scholar] [CrossRef] [PubMed]
- Pan, I.; Cadrin-Chênevert, A.; Cheng, P. Tackling the Radiological Society of North America Pneumonia Detection Challenge. Am. J. Roentgenol. 2019, 213, 568–574. [Google Scholar] [CrossRef]
- Wong, A.; Lin, Z.Q.; Wang, L.; Chung, A.G.; Shen, B.; Abbasi, A.; Hoshmand-Kochi, M.; Duong, T.Q. Towards computer-aided severity assessment: Training and validation of deep neural networks for geographic extent and opacity extent scoring of chest X-rays for SARS-CoV-2 lung disease severity. arXiv 2020, arXiv:2005.12855. [Google Scholar]
- Zimatore, C.; Pisani, L.; Lippolis, V.; Warren, M.A.; Calfee, C.S.; Ware, L.B.; Algera, A.G.; Smit, M.R.; Grasso, S.; Schultz, M.J.; et al. Accuracy of the Radiographic Assessment of Lung Edema Score for the Diagnosis of ARDS. Front. Physiol. 2021, 12, 114. [Google Scholar] [CrossRef]
- Souza, J.C.; Diniz, J.O.B.; Ferreira, J.L.; da Silva, G.L.F.; Silva, A.C.; Paiva, A. An automatic method for lung segmentation and reconstruction in chest X-ray using deep neural networks. Comput. Methods Programs Biomed. 2019, 177, 285–296. [Google Scholar] [CrossRef] [PubMed]
- Gordienko, Y.; Gang, P.; Hui, J.; Zeng, W.; Kochura, Y.; Alienin, O.; Rokovyi, O.; Stirenko, S. Deep Learning with Lung Segmentation and Bone Shadow Exclusion Techniques for Chest X-Ray Analysis of Lung Cancer. In Proceedings of the Advances in Intelligent Systems and Computing, Kiev, Ukraine, 18–20 January 2018; Springer: Singapore, 2018; pp. 638–647. [Google Scholar]
- Warren, M.A.; Zhao, Z.; Koyama, T.; Bastarache, J.A.; Shaver, C.M.; Semler, M.W.; Rice, T.W.; Matthay, M.A.; Calfee, C.S.; Ware, L.B. Severity scoring of lung oedema on the chest radiograph is associated with clinical outcomes in ARDS. Thorax 2018, 73, 840–846. [Google Scholar] [CrossRef] [PubMed]
- Wang, Y.; Dong, C.; Hu, Y.; Li, C.; Ren, Q.; Zhang, X.; Shi, H.; Zhou, M. Temporal Changes of CT Findings in 90 Patients with COVID-19 Pneumonia: A Longitudinal Study. Radiology 2020, 296, E55–E64. [Google Scholar] [CrossRef] [Green Version]
- Toussie, D.; Voutsinas, N.; Finkelstein, M.; Cedillo, M.A.; Manna, S.; Maron, S.Z.; Jacobi, A.; Chung, M.; Bernheim, A.; Eber, C.; et al. Clinical and Chest Radiography Features Determine Patient Outcomes In Young and Middle Age Adults with COVID-19. Radiology 2020, 297, E197–E206. [Google Scholar] [CrossRef] [PubMed]
- Borghesi, A.; Maroldi, R. COVID-19 outbreak in Italy: Experimental chest X-ray scoring system for quantifying and monitoring disease progression. La Radiol. Med. 2020, 125, 509–513. [Google Scholar] [CrossRef]
- Ronneberger, O.; Fischer, P.; Brox, T. U-Net: Convolutional Networks for Biomedical Image Segmentation. In International Conference on Medical Image Computing and Computer-Assisted Intervention, Munich, Germany, 5–9 October 2015; Springer: Cham, Switzerland, 2015; pp. 234–241. [Google Scholar] [CrossRef] [Green Version]
- Tan, M.; Le, Q.V. Efficientnet: Rethinking model scaling for convolutional neural networks. arXiv 2019, arXiv:1905.1194. [Google Scholar]
- Buslaev, A.; Iglovikov, V.I.; Khvedchenya, E.; Parinov, A.; Druzhinin, M.; Kalinin, A.A. Albumentations: Fast and Flexible Image Augmentations. Information 2020, 11, 125. [Google Scholar] [CrossRef] [Green Version]
- Chassagnon, G.; Morel, B.; Carpentier, E.; Ducou Le Pointe, H.; Sirinelli, D. Tracheobronchial branching abnormalities: Lobe-based classification scheme. Radiographics 2016, 36, 358–373. [Google Scholar] [CrossRef]
- Lin, T.-Y.; Goyal, P.; Girshick, R.; He, K.; Dollár, P. Focal loss for dense object detection. In Proceedings of the IEEE International Conference on Computer Vision, Venice, Italy, 22–29 October 2017; pp. 2980–2988. [Google Scholar]
- Benesty, J.; Chen, J.; Huang, Y.; Cohen, I. Pearson Correlation Coefficient. In Noise Reduction in Speech Processing; Springer: Berlin/Heidelberg, Germany, 2009; pp. 1–4. [Google Scholar]
- Jaeger, S.; Candemir, S.; Antani, S.; Wáng, Y.-X.J.; Lu, P.-X.; Thoma, G. Two public chest X-ray datasets for computer-aided screening of pulmonary diseases. Quant. Imaging Med. Surg. 2014, 4, 475–477. [Google Scholar] [PubMed]
- Shiraishi, J.; Katsuragawa, S.; Ikezoe, J.; Matsumoto, T.; Kobayashi, T.; Komatsu, K.; Matsui, M.; Fujita, H.; Kodera, Y.; Doi, K. Development of a digital image database for chest radiographs with and without a lung nodule: Receiver operating characteristic analysis of radiologists’ detection of pulmonary nodules. Am. J. Roentgenol. 2000, 174, 71–74. [Google Scholar] [CrossRef] [PubMed]


| Model | Backbone | Pre-Proc. | Augmentation |
|---|---|---|---|
| Model 1 | Efficient0 | N/A | DA |
| Model 2 | Efficient0 | HE | DA |
| Model 3 | Efficient0 | HE | DA + Gaussian noise (0.5) + gamma correction (0.5) + grid distortion (0.1) + elastic transform (0.1) + affine transform (0.1) |
| Model 4 | Efficient7 | HE | DA + Gaussian noise (0.5) + gamma correction (0.5) |
| Model 5 | Efficient7 | HE | DA + Gaussian noise (0.5) + gamma correction (0.5) + grid distortion (0.1) + elastic transform (0.1) + affine transform (0.1) |
| Training Set (n = 551) | Validation Set (n = 153) | Testing Set (n = 200) | |
|---|---|---|---|
| Patient | 124 | 42 | 51 |
| Age | 68.3 ± 14.8 | 59.5 ± 16.2 | 54.3 ± 18.4 |
| Male | 53 (42.7%) | 16 (38.0%) | 23 (54.7%) |
| RALE | 9.9 ± 10.7 | 3.9 ± 6.7 | 4.2 ± 6.2 |
| Death | 43 (34.6%) | 2 (4.7%) | 4 (9.5%) |
| No. | Model | Mean ± Std. |
|---|---|---|
| 1 | Model 1 | 0.874 ± 0.057 * |
| 2 | Model 2 | 0.854 ± 0.072 * |
| 3 | Model 3 | 0.873 ± 0.089 * |
| 4 | Model 4 | 0.888 ± 0.084 * |
| 5 | Model 5 | 0.889 ± 0.079 * |
| 6 | Ensemble | 0.900 ± 0.074 |
Publisher’s Note: MDPI stays neutral with regard to jurisdictional claims in published maps and institutional affiliations. |
© 2022 by the authors. Licensee MDPI, Basel, Switzerland. This article is an open access article distributed under the terms and conditions of the Creative Commons Attribution (CC BY) license (https://creativecommons.org/licenses/by/4.0/).
Share and Cite
Kim, Y.-G.; Kim, K.; Wu, D.; Ren, H.; Tak, W.Y.; Park, S.Y.; Lee, Y.R.; Kang, M.K.; Park, J.G.; Kim, B.S.; et al. Deep Learning-Based Four-Region Lung Segmentation in Chest Radiography for COVID-19 Diagnosis. Diagnostics 2022, 12, 101. https://0-doi-org.brum.beds.ac.uk/10.3390/diagnostics12010101
Kim Y-G, Kim K, Wu D, Ren H, Tak WY, Park SY, Lee YR, Kang MK, Park JG, Kim BS, et al. Deep Learning-Based Four-Region Lung Segmentation in Chest Radiography for COVID-19 Diagnosis. Diagnostics. 2022; 12(1):101. https://0-doi-org.brum.beds.ac.uk/10.3390/diagnostics12010101
Chicago/Turabian StyleKim, Young-Gon, Kyungsang Kim, Dufan Wu, Hui Ren, Won Young Tak, Soo Young Park, Yu Rim Lee, Min Kyu Kang, Jung Gil Park, Byung Seok Kim, and et al. 2022. "Deep Learning-Based Four-Region Lung Segmentation in Chest Radiography for COVID-19 Diagnosis" Diagnostics 12, no. 1: 101. https://0-doi-org.brum.beds.ac.uk/10.3390/diagnostics12010101