
Over-the-Counter Breast Cancer Classification Using Machine Learning and Patient Registration Records

 ,
,  ,
,  , and
, and 
Abstract
:1. Introduction
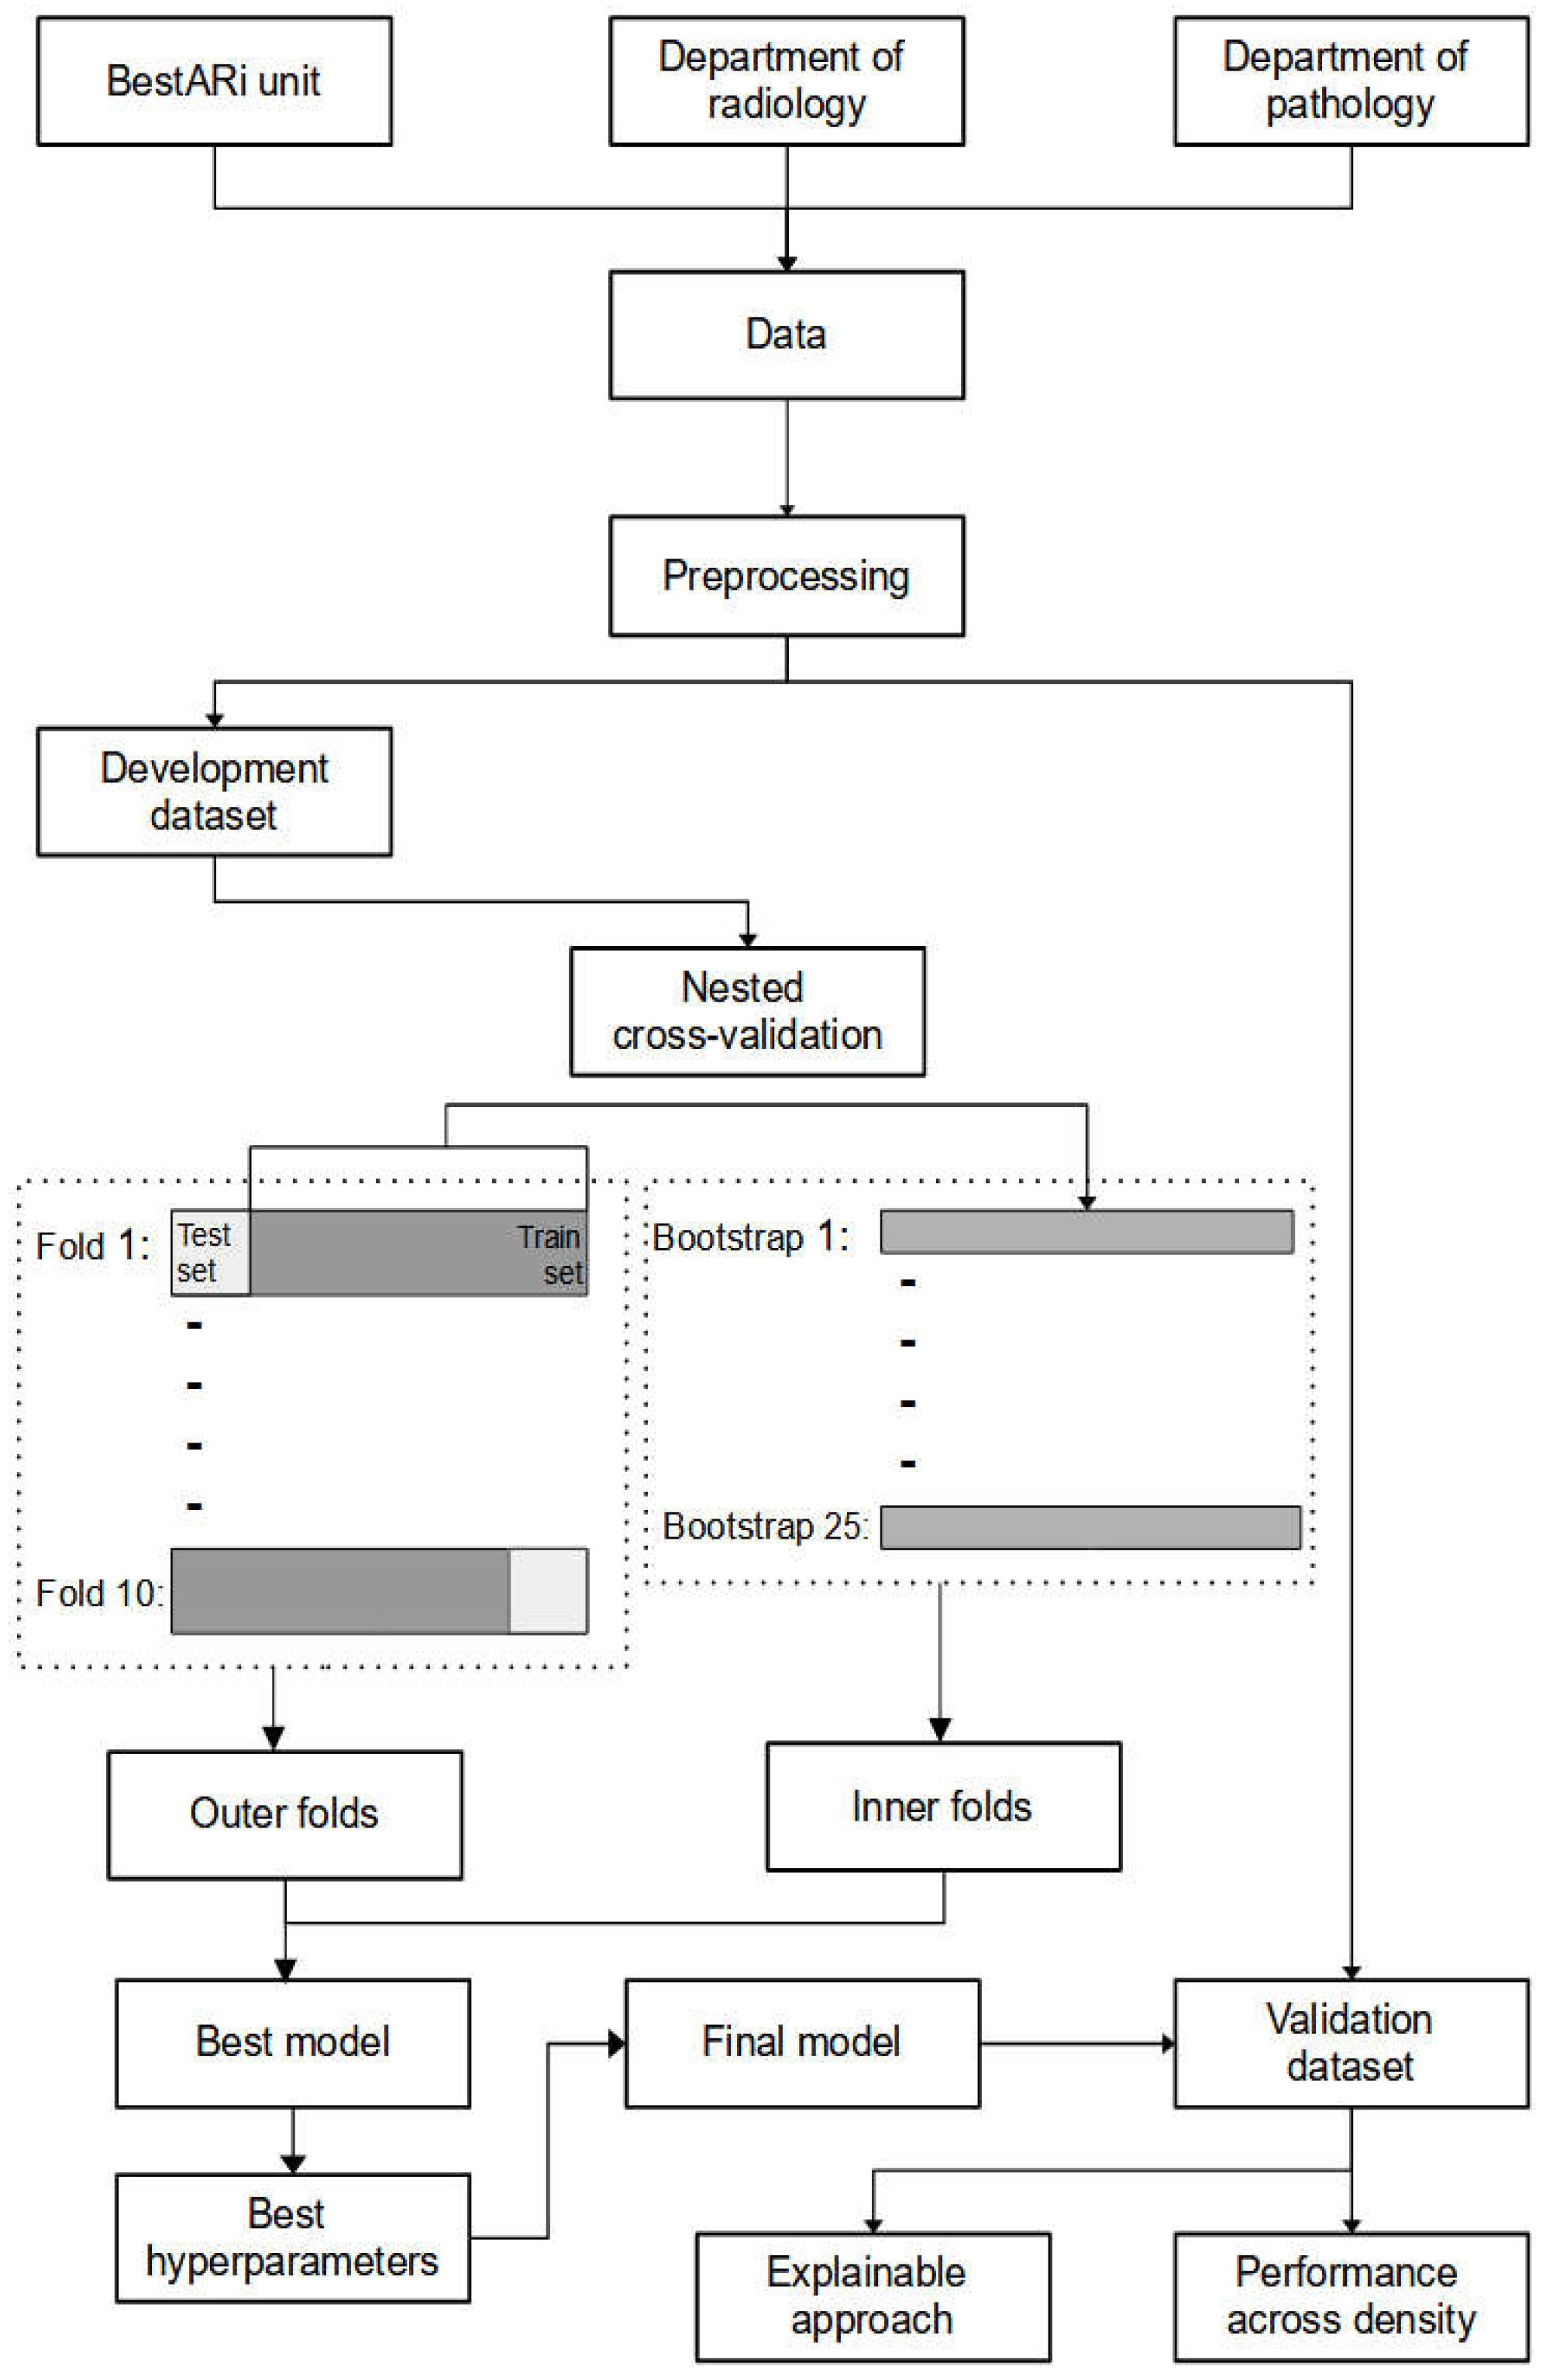
2. Materials and Methods
2.1. Data
2.2. Pre-Processing Steps
2.3. Machine Learning Models
2.4. Model Comparison and Hyperparameter Tuning
2.5. Performance Metrics
2.6. Explainable Approach
3. Related Works
4. Results
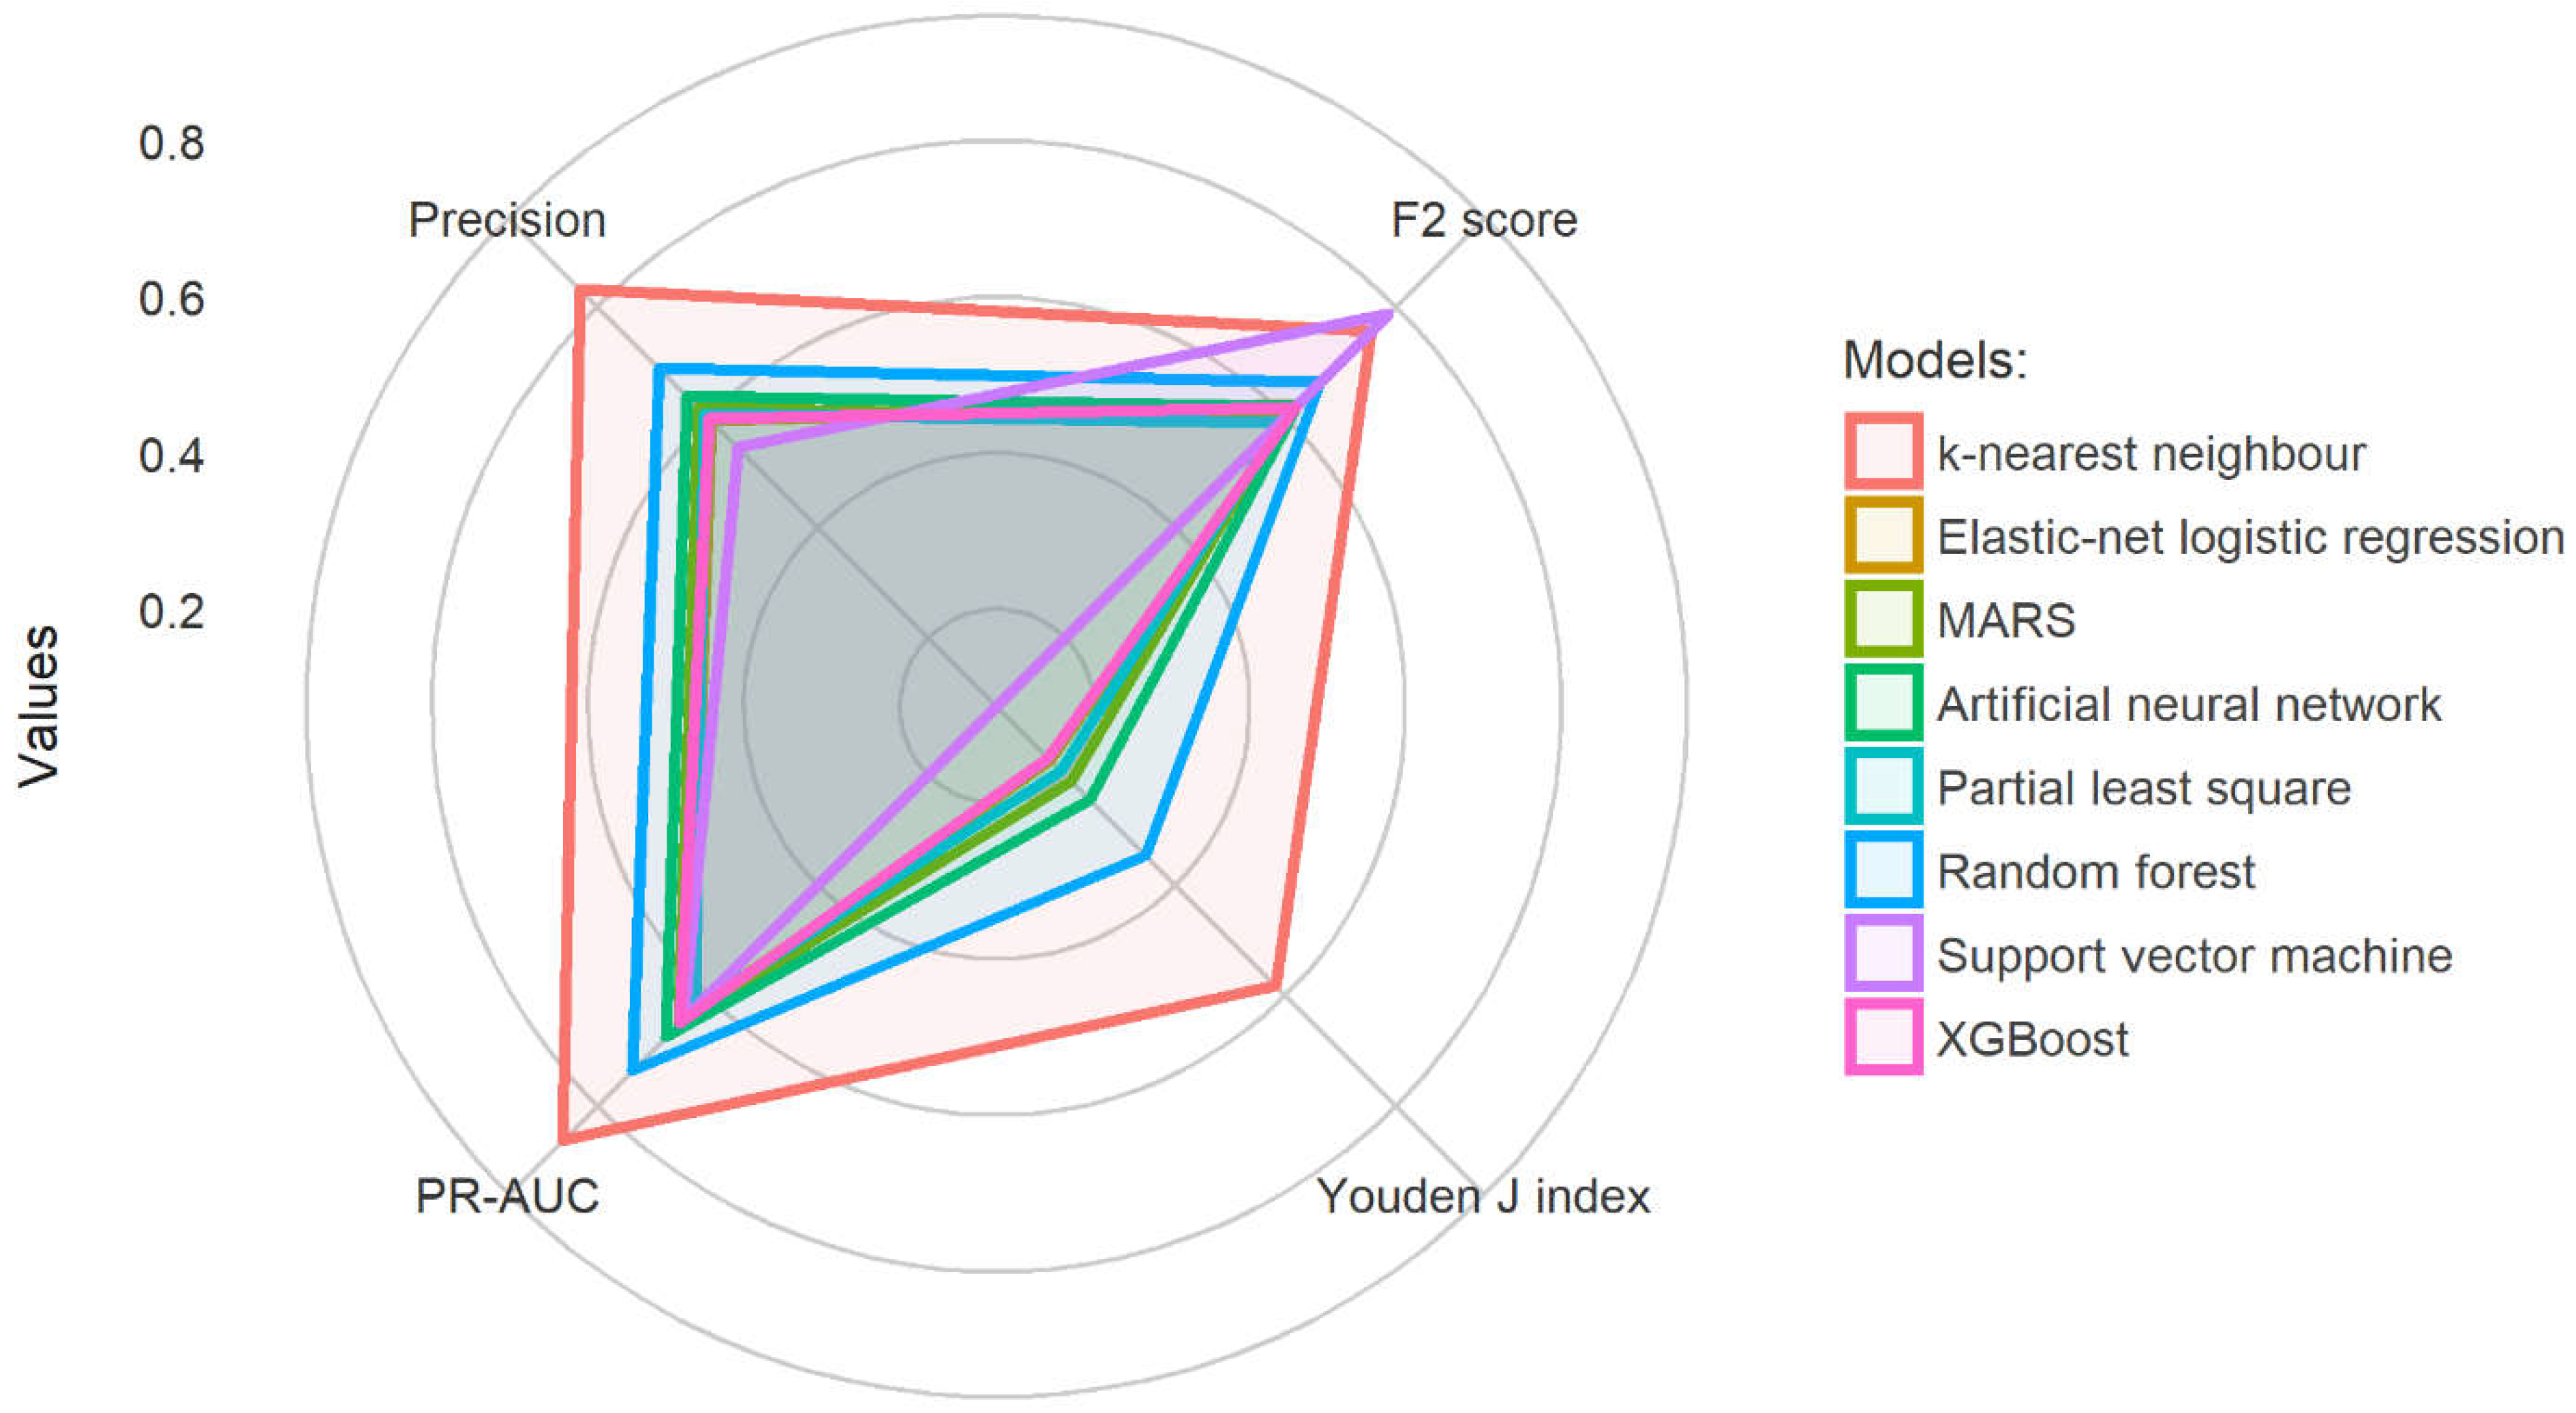
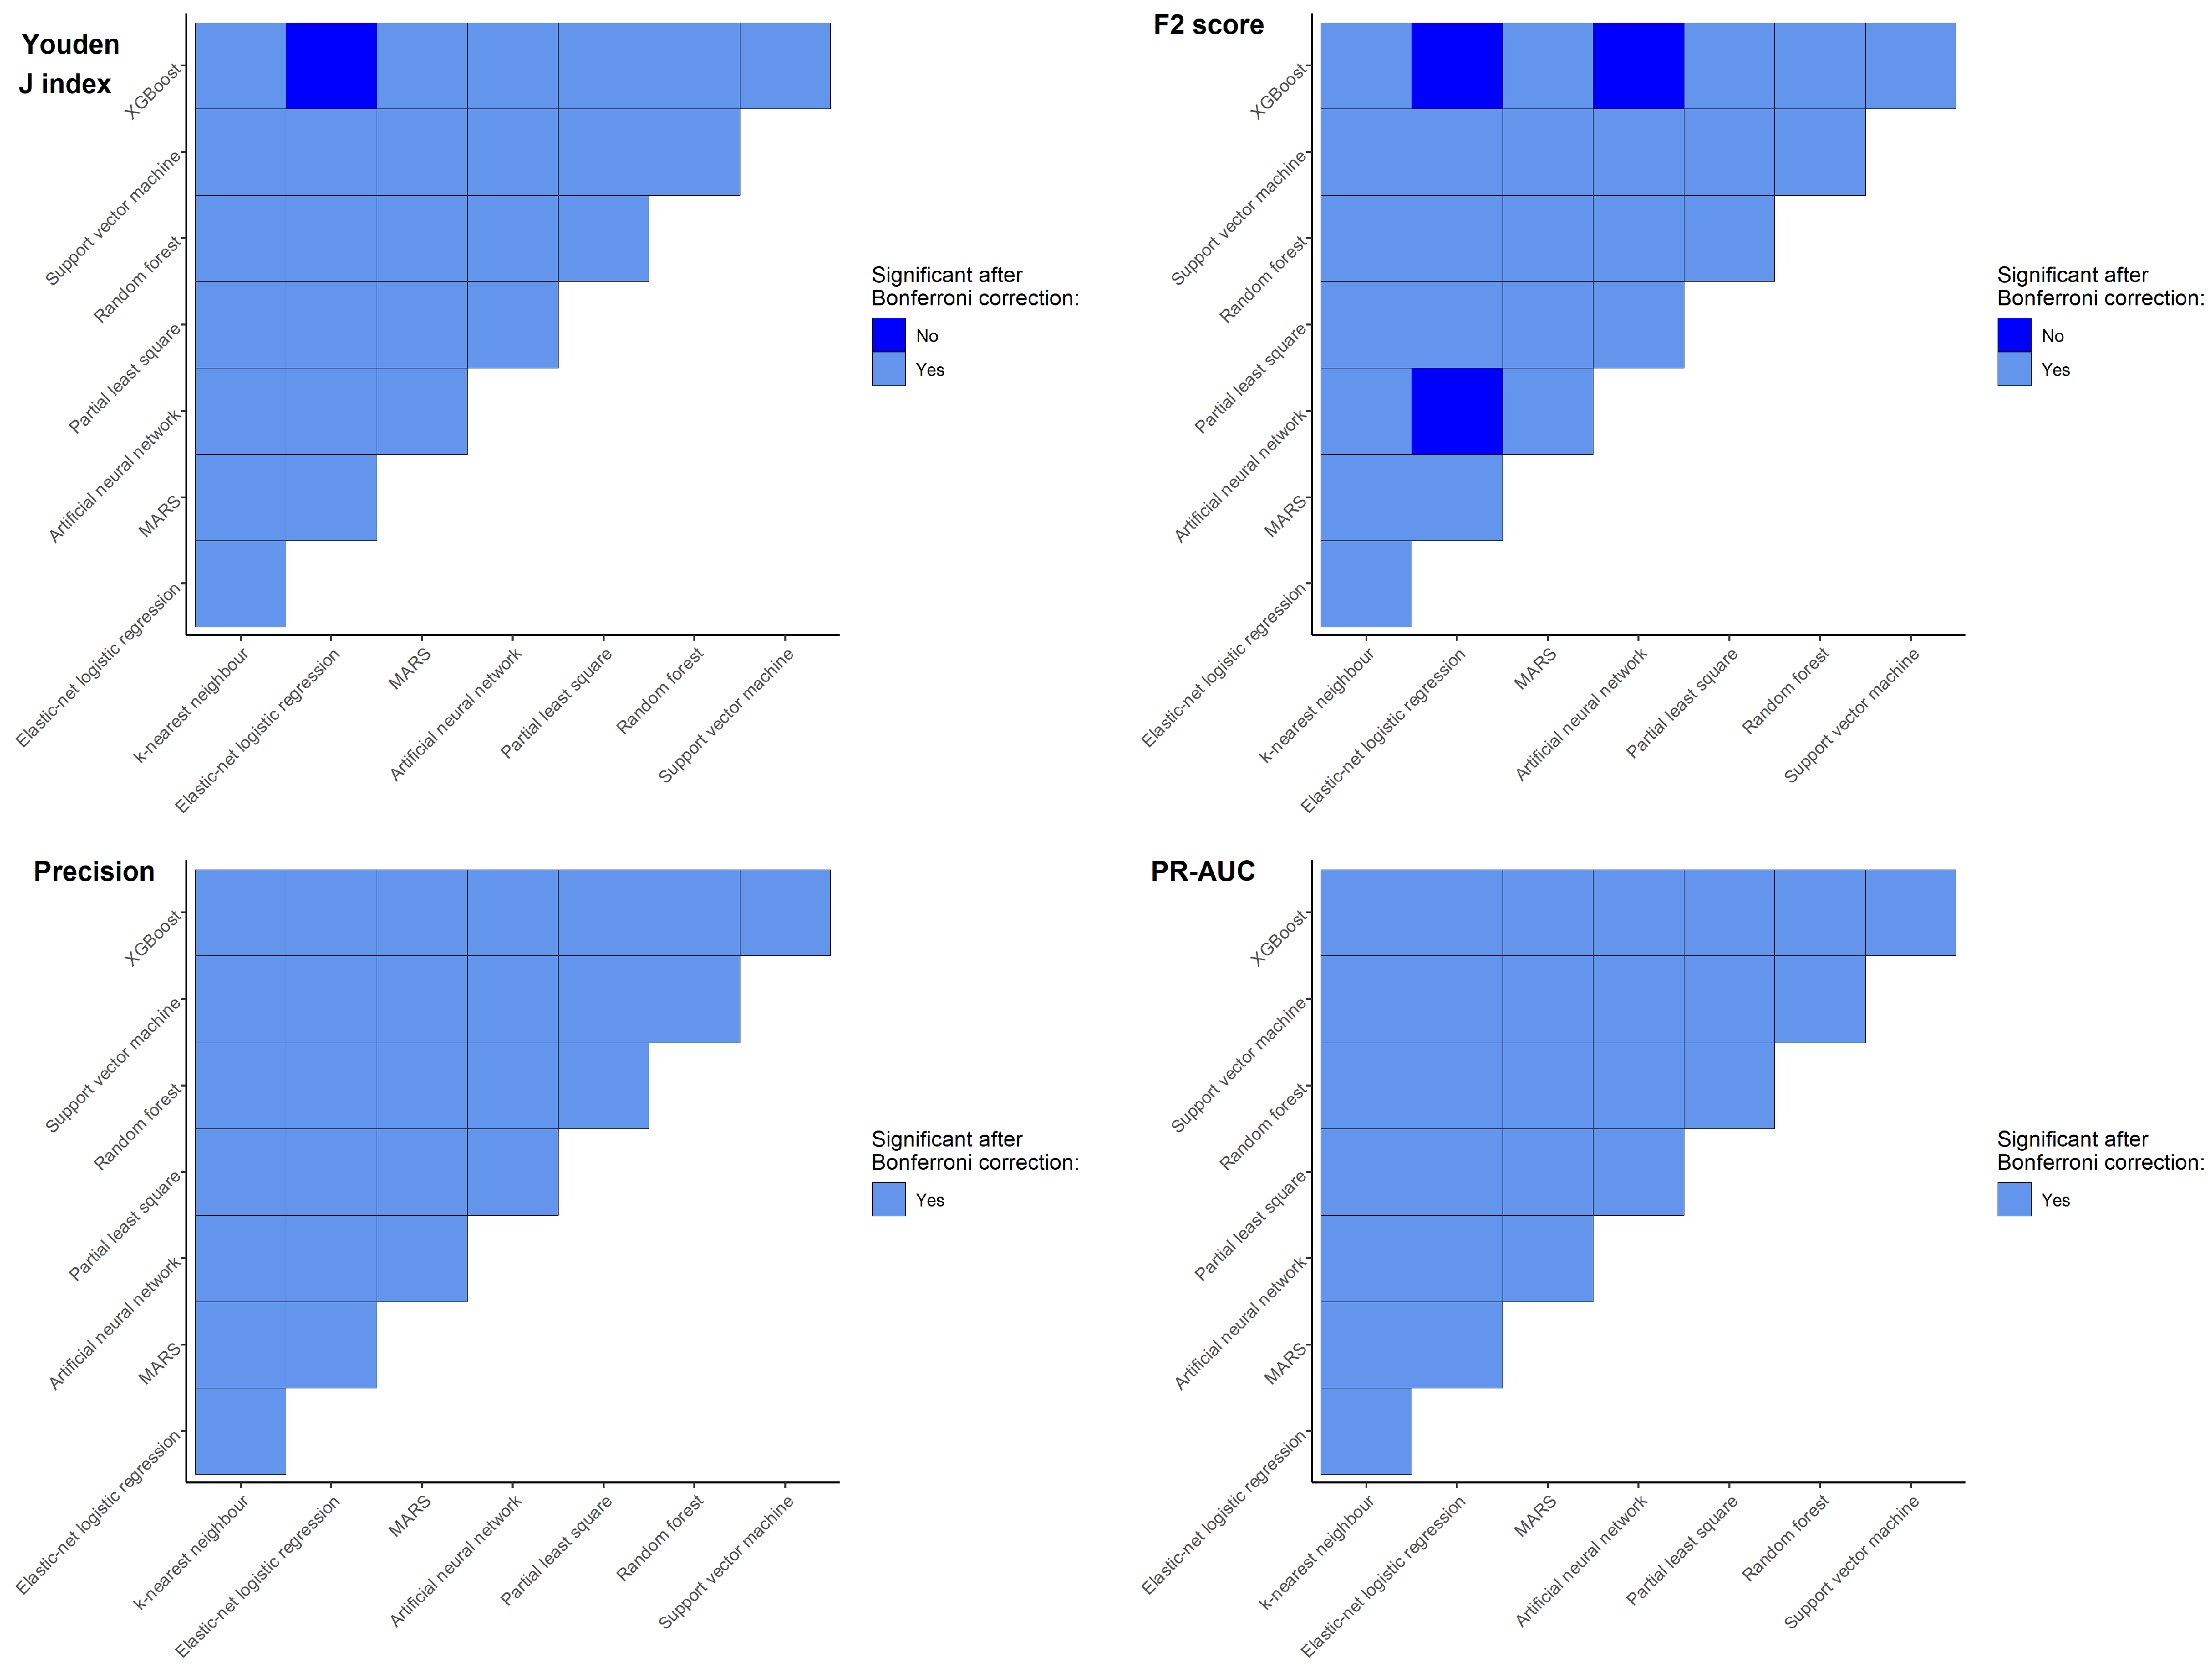
4.1. Model Comparison
4.2. Hyperparameter Tuning
4.3. Explainable Approach
5. Discussion
6. Conclusions
Author Contributions
Funding
Institutional Review Board Statement
Informed Consent Statement
Data Availability Statement
Acknowledgments
Conflicts of Interest
References
- DeSantis, C.E.; Bray, F.; Ferlay, J.; Lortet-Tieulent, J.; Anderson, B.O.; Jemal, A. International variation in female breast cancer incidence and mortality rates. Cancer Epidemiol. Biomark. Prev. 2015, 24, 1495–1506. [Google Scholar] [CrossRef] [PubMed] [Green Version]
- WHO Breast Cancer. Available online: https://www.who.int/news-room/fact-sheets/detail/breast-cancer (accessed on 24 May 2022).
- Parks, R.M.; Derks, M.G.M.; Bastiaannet, E.; Cheung, K.L. Breast Cancer Epidemiology. In Breast Cancer Management for Surgeons; Springer: Cham, Switzerland, 2018; pp. 5615–5623. ISBN 9783319566733. [Google Scholar]
- Anders, C.K.; Johnson, R.; Litton, J.; Phillips, M.; Bleyer, A. Breast Cancer Before Age 40 Years. Semin. Oncol. 2009, 36, 237–249. [Google Scholar] [CrossRef] [PubMed] [Green Version]
- Momenimovahed, Z.; Salehiniya, H. Epidemiological characteristics of and risk factors for breast cancer in the world. Breast Cancer Targets Ther. 2019, 11, 151–164. [Google Scholar] [CrossRef] [Green Version]
- Kamińska, M.; Ciszewski, T.; Łopacka-Szatan, K.; Miotła, P.; Starosławska, E. Breast cancer risk factors. Prz. Menopauzalny 2015, 14, 196–202. [Google Scholar] [CrossRef] [Green Version]
- Warner, E.T.; Rice, M.S.; Zeleznik, O.A.; Fowler, E.E.; Murthy, D.; Vachon, C.M.; Bertrand, K.A.; Rosner, B.A.; Heine, J.; Tamimi, R.M. Automated percent mammographic density, mammographic texture variation, and risk of breast cancer: A nested case-control study. npj Breast Cancer 2021, 7, 68. [Google Scholar] [CrossRef]
- Burton, A.; Maskarinec, G.; Perez-Gomez, B.; Vachon, C.; Miao, H.; Lajous, M.; López-Ridaura, R.; Rice, M.; Pereira, A.; Garmendia, M.L.; et al. Mammographic density and ageing: A collaborative pooled analysis of cross-sectional data from 22 countries worldwide. PLoS Med. 2017, 14, e1002335. [Google Scholar] [CrossRef] [PubMed] [Green Version]
- Sherratt, M.J.; McConnell, J.C.; Streuli, C.H. Raised mammographic density: Causative mechanisms and biological consequences. Breast Cancer Res. 2016, 18, 45. [Google Scholar] [CrossRef] [Green Version]
- Nazari, S.S.; Mukherjee, P. An overview of mammographic density and its association with breast cancer. Breast Cancer 2018, 25, 259–267. [Google Scholar] [CrossRef] [PubMed] [Green Version]
- Unger-Saldaña, K. Challenges to the early diagnosis and treatment of breast cancer in developing countries. World J. Clin. Oncol. 2014, 5, 465–477. [Google Scholar] [CrossRef]
- Andersen, B.L.; Cacioppo, J.T.; Roberts, D.C. Delay in seeking a cancer diagnosis: Delay stages and psychophysiological comparison processes. Br. J. Soc. Psychol. 1995, 34, 33–52. [Google Scholar] [CrossRef]
- Taib, N.A.; Yip, C.H.; Low, W.Y. A grounded explanation of why women present with advanced breast cancer. World J. Surg. 2014, 38, 1676–1684. [Google Scholar] [CrossRef]
- McKenzie, F.; Zietsman, A.; Galukande, M.; Anele, A.; Adisa, C.; Parham, G.; Pinder, L.; Cubasch, H.; Joffe, M.; Kidaaga, F.; et al. Drivers of advanced stage at breast cancer diagnosis in the multicountry African breast cancer—Disparities in outcomes (ABC-DO) study. Int. J. Cancer 2018, 142, 1568–1579. [Google Scholar] [CrossRef] [PubMed] [Green Version]
- Ren, S.; Zhang, Y.; Qin, P.; Wang, J. Factors Influencing Total Delay of Breast Cancer in Northeast of China. Front. Oncol. 2022, 12, 10–15. [Google Scholar] [CrossRef] [PubMed]
- Toh, T.S.; Dondelinger, F.; Wang, D. Looking beyond the hype: Applied AI and machine learning in translational medicine. EBioMedicine 2019, 47, 607–615. [Google Scholar] [CrossRef] [PubMed] [Green Version]
- Blasiak, A.; Khong, J.; Kee, T. CURATE.AI: Optimizing Personalized Medicine with Artificial Intelligence. SLAS Technol. 2020, 25, 95–105. [Google Scholar] [CrossRef] [PubMed]
- Raghu, G.; Remy-Jardin, M.; Myers, J.L.; Richeldi, L.; Ryerson, C.J.; Lederer, D.J.; Behr, J.; Cottin, V.; Danoff, S.K.; Morell, F.; et al. Diagnosis of idiopathic pulmonary fibrosis An Official ATS/ERS/JRS/ALAT Clinical practice guideline. Am. J. Respir. Crit. Care Med. 2018, 198, e44–e68. [Google Scholar] [CrossRef]
- Hwang, E.J.; Park, S.; Jin, K.N.; Kim, J.I.; Choi, S.Y.; Lee, J.H.; Goo, J.M.; Aum, J.; Yim, J.J.; Park, C.M.; et al. Development and Validation of a Deep Learning-based Automatic Detection Algorithm for Active Pulmonary Tuberculosis on Chest Radiographs. Clin. Infect. Dis. 2019, 69, 739–747. [Google Scholar] [CrossRef] [Green Version]
- Zou, Q.; Qu, K.; Luo, Y.; Yin, D.; Ju, Y.; Tang, H. Predicting Diabetes Mellitus With Machine Learning Techniques. Front. Genet. 2018, 9, 515. [Google Scholar] [CrossRef]
- van Leeuwen, N.M.; Maurits, M.; Liem, S.; Ciaffi, J.; Ajmone Marsan, N.; Ninaber, M.; Allaart, C.; Gillet van Dongen, H.; Goekoop, R.; Huizinga, T.; et al. New risk model is able to identify patients with a low risk of progression in systemic sclerosis. RMD Open 2021, 7, e001524. [Google Scholar] [CrossRef]
- Tiulpin, A.; Klein, S.; Bierma-Zeinstra, S.M.A.; Thevenot, J.; Rahtu, E.; van Meurs, J.; Oei, E.H.G.; Saarakkala, S. Multimodal Machine Learning-based Knee Osteoarthritis Progression Prediction from Plain Radiographs and Clinical Data. Sci. Rep. 2019, 9, 20038. [Google Scholar] [CrossRef]
- Ansart, M.; Epelbaum, S.; Bassignana, G.; Bône, A.; Bottani, S.; Cattai, T.; Couronné, R.; Faouzi, J.; Koval, I.; Louis, M.; et al. Predicting the progression of mild cognitive impairment using machine learning: A systematic, quantitative and critical review. Med. Image Anal. 2021, 67, 101848. [Google Scholar] [CrossRef] [PubMed]
- Dagliati, A.; Marini, S.; Sacchi, L.; Cogni, G.; Teliti, M.; Tibollo, V.; De Cata, P.; Chiovato, L.; Bellazzi, R. Machine Learning Methods to Predict Diabetes Complications. J. Diabetes Sci. Technol. 2018, 12, 295–302. [Google Scholar] [CrossRef] [PubMed] [Green Version]
- Ungaro, R.C.; Hu, L.; Ji, J.; Nayar, S.; Kugathasan, S.; Denson, L.A.; Hyams, J.; Dubinsky, M.C.; Sands, B.E.; Cho, J.H. Machine learning identifies novel blood protein predictors of penetrating and stricturing complications in newly diagnosed paediatric Crohn’s disease. Aliment. Pharmacol. Ther. 2021, 53, 281–290. [Google Scholar] [CrossRef] [PubMed]
- Lip, G.Y.H.; Genaidy, A.; Tran, G.; Marroquin, P.; Estes, C. Incidence and Complications of Atrial Fibrillation in a Low Socioeconomic and High Disability United States (US) Population: A Combined Statistical and Machine Learning Approach. Int. J. Clin. Pract. 2022, 2022, 8649050. [Google Scholar] [CrossRef]
- Poon, A.I.F.; Sung, J.J.Y. Opening the black box of AI-Medicine. J. Gastroenterol. Hepatol. 2021, 36, 581–584. [Google Scholar] [CrossRef]
- Adadi, A.; Berrada, M. Explainable AI for Healthcare: From Black Box to Interpretable Models. In Advances in Intelligent Systems and Computing; Springer: Singapore, 2020; Volume 1076, pp. 327–337. ISBN 9789811509469. [Google Scholar]
- Sabol, P.; Sinčák, P.; Hartono, P.; Kočan, P.; Benetinová, Z.; Blichárová, A.; Verbóová, Ľ.; Štammová, E.; Sabolová-Fabianová, A.; Jašková, A. Explainable classifier for improving the accountability in decision-making for colorectal cancer diagnosis from histopathological images. J. Biomed. Inform. 2020, 109, 103523. [Google Scholar] [CrossRef]
- Cozma, G.V.; Onchis, D.; Istin, C.; Petrache, I.A. Explainable Machine Learning Solution for Observing Optimal Surgery Timings in Thoracic Cancer Diagnosis. Appl. Sci. 2022, 12, 6506. [Google Scholar] [CrossRef]
- Kim, H.M.; Jeong, C.W.; Kwak, C.; Song, C.; Kang, M.; Seo, S.I.; Kim, J.K.; Lee, H.; Chung, J.; Hwang, E.C.; et al. A Machine Learning Approach to Predict the Probability of Brain Metastasis in Renal Cell Carcinoma Patients. Appl. Sci. 2022, 12, 6174. [Google Scholar] [CrossRef]
- Wang, L.; Lin, Z.Q.; Wong, A. COVID-Net: A tailored deep convolutional neural network design for detection of COVID-19 cases from chest X-ray images. Sci. Rep. 2020, 10, 19549. [Google Scholar] [CrossRef]
- Sarp, S.; Kuzlu, M.; Wilson, E.; Cali, U.; Guler, O. The enlightening role of explainable artificial intelligence in chronic wound classification. Electron. 2021, 10, 1406. [Google Scholar] [CrossRef]
- El-Sappagh, S.; Alonso, J.M.; Islam, S.M.R.; Sultan, A.M.; Kwak, K.S. A multilayer multimodal detection and prediction model based on explainable artificial intelligence for Alzheimer’s disease. Sci. Rep. 2021, 11, 2660. [Google Scholar] [CrossRef] [PubMed]
- Holzinger, A.; Langs, G.; Denk, H.; Zatloukal, K.; Müller, H. Causability and explainability of artificial intelligence in medicine. Wiley Interdiscip. Rev. Data Min. Knowl. Discov. 2019, 9, e1312. [Google Scholar] [CrossRef] [PubMed] [Green Version]
- Lunardon, N.; Menardi, G.; Torelli, N. ROSE: A package for binary imbalanced learning. R J. 2014, 6, 79–89. [Google Scholar] [CrossRef] [Green Version]
- Yeo, I.-K.; Johnson, R.A. A new family of power transformations to improve normality or symmetry. Biometrika 2000, 87, 954–959. [Google Scholar] [CrossRef]
- Kuhn, M.; Johnson, K. Feature Engineering and Selection: A Practical Approach for Predictive Models, 1st ed.; CRC Press: Boca Raton, FL, USA, 2020; ISBN 9781315108230. [Google Scholar]
- Hvitfeldt, E. Themis: Extra Recipes Steps for Dealing with Unbalanced Data. 2022. Available online: https://themis.tidymodels.org (accessed on 13 October 2022).
- Kuhn, M.; Wickham, H. Recipes: Preprocessing and Feature Engineering Steps for Modeling. 2022. Available online: https://rdrr.io/cran/recipes/ (accessed on 13 October 2022).
- Kuhn, M.; Vaughan, D. Parsnip: A Common API to Modeling and Analysis Functions. 2022. Available online: https://rdrr.io/cran/parsnip/ (accessed on 13 October 2022).
- Schliep, K.; Hechenbichler, K. kknn: Weighted k-Nearest Neighbors 2016. Available online: https://github.com/KlausVigo/kknn (accessed on 13 October 2022).
- Friedman, J.; Hastie, T.; Tibshirani, R. Regularization Paths for Generalized Linear Models via Coordinate Descent. J. Stat. Softw. 2010, 33, 1–22. [Google Scholar] [CrossRef] [Green Version]
- Milborrow, S. Earth: Multivariate Adaptive Regression Splines. 2021. Available online: http://www.milbo.users.sonic.net/earth/ (accessed on 13 October 2022).
- Ripley, B.; Venables, W. Nnet: Feed-Forward Neural Networks and Multinomial Log-Linear Models. 2022. Available online: https://rdrr.io/cran/nnet/ (accessed on 13 October 2022).
- Rohart, F.; Gautier, B.; Singh, A.; Lê Cao, K.-A. mixOmics: An R package for ‘omics feature selection and multiple data integration. PLOS Comput. Biol. 2017, 13, e1005752. [Google Scholar] [CrossRef] [Green Version]
- Wright, M.N.; Ziegler, A. Ranger: A Fast Implementation of Random Forests for High Dimensional Data in C++ and R. J. Stat. Softw. 2017, 77, 1–17. [Google Scholar] [CrossRef] [Green Version]
- Karatzoglou, A.; Smola, A.; Hornik, K.; Zeileis, A. kernlab—An S4 Package for Kernel Methods in R. J. Stat. Softw. 2004, 11, 1–20. [Google Scholar] [CrossRef] [Green Version]
- Chen, T.; He, T.; Benesty, M.; Khotilovich, V.; Tang, Y.; Cho, H.; Chen, K.; Mitchell, R.; Cano, I.; Zhou, T.; et al. Xgboost: Extreme Gradient Boosting. 2022. Available online: https://cran.utstat.utoronto.ca/web/packages/xgboost/vignettes/xgboost.pdf (accessed on 13 October 2022).
- R Core Team. R: A Language and Environment for Statistical Computing; R Core Team: Vienna, Austria, 2022. [Google Scholar]
- Biecek, P. DALEX: Explainers for Complex Predictive Models in R. J. Mach. Learn. Res. 2018, 19, 1–5. [Google Scholar]
- Maksymiuk, S.; Gosiewska, A.; Biecek, P. Landscape of R packages for eXplainable Artificial Intelligence. arXiv 2020, arXiv:2009.13248. [Google Scholar] [CrossRef]
- Yassin, N.I.R.; Omran, S.; El Houby, E.M.F.; Allam, H. Machine learning techniques for breast cancer computer aided diagnosis using different image modalities: A systematic review. Comput. Methods Programs Biomed. 2018, 156, 25–45. [Google Scholar] [CrossRef] [PubMed]
- Breast Cancer Wisconsin (Diagnostic) Data Set. Available online: https://archive.ics.uci.edu/ml/datasets/breast+cancer+wisconsin+(diagnostic) (accessed on 6 July 2022).
- Richter, A.N.; Khoshgoftaar, T.M. A review of statistical and machine learning methods for modeling cancer risk using structured clinical data. Artif. Intell. Med. 2018, 90, 1–14. [Google Scholar] [CrossRef] [PubMed] [Green Version]
- Li, J.; Zhou, Z.; Dong, J.; Fu, Y.; Li, Y.; Luan, Z.; Peng, X. Predicting breast cancer 5-year survival using machine learning: A systematic review. PLoS ONE 2021, 16, e0250370. [Google Scholar] [CrossRef] [PubMed]
- Kim, W.; Kim, K.S.; Lee, J.E.; Noh, D.-Y.; Kim, S.-W.; Jung, Y.S.; Park, M.Y.; Park, R.W. Development of novel breast cancer recurrence prediction model using support vector machine. J. Breast Cancer 2012, 15, 230–238. [Google Scholar] [CrossRef] [Green Version]
- LG, A.; AT, E. Using Three Machine Learning Techniques for Predicting Breast Cancer Recurrence. J. Health Med. Inform. 2013, 4, 2–4. [Google Scholar] [CrossRef] [Green Version]
- Zeng, Z.; Yao, L.; Roy, A.; Li, X.; Espino, S.; Clare, S.E.; Khan, S.A.; Luo, Y. Identifying Breast Cancer Distant Recurrences from Electronic Health Records Using Machine Learning. J. Healthc. Inform. Res. 2019, 3, 283–299. [Google Scholar] [CrossRef]
- Cirkovic, B.R.A.; Cvetkovic, A.M.; Ninkovic, S.M.; Filipovic, N.D. Prediction models for estimation of survival rate and relapse for breast cancer patients. In Proceedings of the 2015 IEEE 15th International Conference on Bioinformatics and Bioengineering (BIBE), Belgrade, Serbia, 2–4 November 2015; pp. 1–6. [Google Scholar]
- Kabiraj, S.; Raihan, M.; Alvi, N.; Afrin, M.; Akter, L.; Sohagi, S.A.; Podder, E. Breast cancer risk prediction using XGBoost and random forest algorithm. In Proceedings of the 2020 11th International Conference on Computing, Communication and Networking Technologies (ICCCNT), Kharagpur, India, 1–3 July 2020; pp. 1–4. [Google Scholar]
- Sun, D.; Wang, M.; Li, A. A Multimodal Deep Neural Network for Human Breast Cancer Prognosis Prediction by Integrating Multi-Dimensional Data. IEEE/ACM Trans. Comput. Biol. Bioinforma. 2019, 16, 841–850. [Google Scholar] [CrossRef]
- Kalafi, E.Y.; Nor, N.A.M.; Taib, N.A.; Ganggayah, M.D.; Town, C.; Dhillon, S.K. Machine Learning and Deep Learning Approaches in Breast Cancer Survival Prediction Using Clinical Data. Folia Biol. 2019, 65, 212–220. [Google Scholar]
- Anisha, P.R.; Kishor Kumar Reddy, C.; Apoorva, K.; Meghana Mangipudi, C. Early Diagnosis of Breast Cancer Prediction using Random Forest Classifier. IOP Conf. Ser. Mater. Sci. Eng. 2021, 1116, 012187. [Google Scholar] [CrossRef]
- Khatun, T.; Utsho, M.M.R.; Islam, M.A.; Zohura, M.F.; Hossen, M.S.; Rimi, R.A.; Anni, S.J. Performance Analysis of Breast Cancer: A Machine Learning Approach. In Proceedings of the 2021 Third International Conference on Inventive Research in Computing Applications (ICIRCA), Coimbatore, India, 2–4 September 2021; pp. 1426–1434. [Google Scholar]
- Hou, C.; Zhong, X.; He, P.; Xu, B.; Diao, S.; Yi, F.; Zheng, H.; Li, J. Predicting breast cancer in chinese women using machine learning techniques: Algorithm development. JMIR Med. Inform. 2020, 8, e17364. [Google Scholar] [CrossRef]
- Nindrea, R.D.; Aryandono, T.; Lazuardi, L.; Dwiprahasto, I. Diagnostic accuracy of different machine learning algorithms for breast cancer risk calculation: A meta-analysis. Asian Pac. J. Cancer Prev. 2018, 19, 1747–1752. [Google Scholar] [CrossRef] [PubMed]
- Malvezzi, M.; Carioli, G.; Bertuccio, P.; Boffetta, P.; Levi, F.; La Vecchia, C.; Negri, E. European cancer mortality predictions for the year 2019 with focus on breast cancer. Ann. Oncol. 2019, 30, 781–787. [Google Scholar] [CrossRef] [PubMed]
- Tahmooresi, M.; Afshar, A.; Bashari Rad, B.; Nowshath, K.B.; Bamiah, M.A. Early detection of breast cancer using machine learning techniques. J. Telecommun. Electron. Comput. Eng. 2018, 10, 21–27. [Google Scholar]
- Khan, T.M.; Leong, J.P.Y.; Ming, L.C.; Khan, A.H. Association of knowledge and cultural perceptions of Malaysian women with delay in diagnosis and treatment of breast cancer: A systematic review. Asian Pac. J. Cancer Prev. 2015, 16, 5349–5357. [Google Scholar] [CrossRef] [Green Version]
- Mujar, N.M.M.; Dahlui, M.; Emran, N.A.; Hadi, I.A.; Wai, Y.Y.; Arulanantham, S.; Hooi, C.C.; Taib, N.A.M. Complementary and alternative medicine (CAM) use and delays in presentation and diagnosis of breast cancer patients in public hospitals in Malaysia. PLoS ONE 2017, 12, e0176394. [Google Scholar] [CrossRef] [Green Version]
- Caplan, L. Delay in breast cancer: Implications for stage at diagnosis and survival. Front. Public Health 2014, 2, 87. [Google Scholar] [CrossRef] [Green Version]
- Freitas, A.G.Q.; Weller, M. Patient delays and system delays in breast cancer treatment in developed and developing countries. Cien. Saude Colet. 2015, 20, 3177–3189. [Google Scholar] [CrossRef] [Green Version]
- Innos, K.; Padrik, P.; Valvere, V.; Eelma, E.; Kütner, R.; Lehtsaar, J.; Tekkel, M. Identifying women at risk for delayed presentation of breast cancer: A cross-sectional study in Estonia. BMC Public Health 2013, 13, 947. [Google Scholar] [CrossRef] [Green Version]
- Norsa’adah, B.; Rampal, K.G.; Rahmah, M.A.; Naing, N.N.; Biswal, B.M. Diagnosis delay of breast cancer and its associated factors in Malaysian women. BMC Cancer 2011, 11, 141. [Google Scholar] [CrossRef] [Green Version]
- Sun, Y.; Wong, A.K.C.; Kamel, M.S. Classification of imbalanced data: A review. Int. J. Pattern Recognit. Artif. Intell. 2009, 23, 687–719. [Google Scholar] [CrossRef]
- Johnson, R.H.; Anders, C.K.; Litton, J.K.; Ruddy, K.J.; Bleyer, A. Breast cancer in adolescents and young adults. Pediatr. Blood Cancer 2018, 65, e27397. [Google Scholar] [CrossRef] [PubMed]
- Rajaram, N.; Mariapun, S.; Eriksson, M.; Tapia, J.; Kwan, P.Y.; Ho, W.K.; Harun, F.; Rahmat, K.; Czene, K.; Taib, N.A.M.; et al. Differences in mammographic density between Asian and Caucasian populations: A comparative analysis. Breast Cancer Res. Treat. 2017, 161, 353–362. [Google Scholar] [CrossRef] [PubMed]
- Yap, Y.S.; Lu, Y.S.; Tamura, K.; Lee, J.E.; Ko, E.Y.; Park, Y.H.; Cao, A.Y.; Lin, C.H.; Toi, M.; Wu, J.; et al. Insights into Breast Cancer in the East vs the West: A Review. JAMA Oncol. 2019, 5, 1489–1496. [Google Scholar] [CrossRef] [PubMed]
- Kumari Chelliah, K.; Shatirah Mohd Fandi Voon, N.; Ahamad, H. Breast Density: Does It Vary among the Main Ethnic Groups in Malaysia? Open J. Med. Imaging 2013, 03, 105–109. [Google Scholar] [CrossRef] [Green Version]
- Mariapun, S.; Li, J.; Yip, C.H.; Taib, N.A.M.; Teo, S.H. Ethnic differences in mammographic densities: An Asian cross-sectional study. PLoS ONE 2015, 10, e0117568. [Google Scholar] [CrossRef]
- Hanis, T.M.; Arifin, W.N.; Haron, J.; Wan Abdul Rahman, W.F.; Ruhaiyem, N.I.R.; Abdullah, R.; Musa, K.I. Factors Influencing Mammographic Density in Asian Women: A Retrospective Cohort Study in the Northeast Region of Peninsular Malaysia. Diagnostics 2022, 12, 860. [Google Scholar] [CrossRef]
- Rahayu, A.; Zaharuddin, B.; Le, T.Q.; Rifhana, I.; Muhamad, B.; Mahmud, R.; Hamid, S.A. Relation of Breast Density with Age and Ethnicity in Malaysia. Front. Health Inform. 2013, 2, 1–4. [Google Scholar]
- McGuire, A.; Brown, J.A.L.; Malone, C.; McLaughlin, R.; Kerin, M.J. Effects of age on the detection and management of breast cancer. Cancers 2015, 7, 908–929. [Google Scholar] [CrossRef]
- Murphy, B.L.; Day, C.N.; Hoskin, T.L.; Habermann, E.B.; Boughey, J.C. Adolescents and Young Adults with Breast Cancer have More Aggressive Disease and Treatment Than Patients in Their Forties. Ann. Surg. Oncol. 2019, 26, 3920–3930. [Google Scholar] [CrossRef]
- Tao, Z.Q.; Shi, A.; Lu, C.; Song, T.; Zhang, Z.; Zhao, J. Breast Cancer: Epidemiology and Etiology. Cell Biochem. Biophys. 2015, 72, 333–338. [Google Scholar] [CrossRef]
- Chan, D.S.M.; Abar, L.; Cariolou, M.; Nanu, N.; Greenwood, D.C.; Bandera, E.V.; McTiernan, A.; Norat, T. World Cancer Research Fund International: Continuous Update Project—Systematic literature review and meta-analysis of observational cohort studies on physical activity, sedentary behavior, adiposity, and weight change and breast cancer risk. Cancer Causes Control 2019, 30, 1183–1200. [Google Scholar] [CrossRef] [PubMed] [Green Version]
- Ligibel, J.A.; Basen-Engquist, K.; Bea, J.W. Weight Management and Physical Activity for Breast Cancer Prevention and Control. Am. Soc. Clin. Oncol. Educ. B. 2019, 39, e22–e33. [Google Scholar] [CrossRef] [PubMed]
- Ahmed, Z.; Mohamed, K.; Zeeshan, S.; Dong, X.Q. Artificial intelligence with multi-functional machine learning platform development for better healthcare and precision medicine. Database 2020, 2020, baaa010. [Google Scholar] [CrossRef] [PubMed]


| Characteristic | Normal, n = 230 n (%) | Suspicious, n = 861 n (%) | Missing Values n (%) | Overall, n = 1091 |
|---|---|---|---|---|
| Age at examination 1, 2 | 50.0 (8.1) | 53.7 (9.6) | 3 (0.3%) | 52.9 (9.4) |
| Age at menarche 1, 2 | 13.0 (1.5) | 13.1 (1.5) | 97 (8.9%) | 13.1 (1.5) |
| No of children 1, 2 | 3.8 (2.7) | 3.6 (2.4) | 85 (7.8%) | 3.7 (2.5) |
| Weight (kg) 1, 2 | 64.2 (12.9) | 63.5 (12.8) | 263 (24.0%) | 63.7 (12.8) |
| Height (cm) 1 | 156.4 (5.5) | 155.0 (6.4) | 692 (63.0%) | 155.2 (6.3) |
| BMI 1, 2 | 27.1 (5.7) | 26.7 (5.6) | 696 (64.0%) | 26.8 (5.6) |
| Race 2 | 34 (3.1%) | |||
| Chinese | 21 (9.4%) | 112 (13.4%) | 133 (12.6%) | |
| Indian | 0 (0.0%) | 4 (0.5%) | 4 (0.4%) | |
| Malay | 201 (89.7%) | 706 (84.8%) | 907 (85.8%) | |
| Others | 0 (0.0%) | 3 (0.4%) | 3 (0.3%) | |
| Siamese | 2 (0.9%) | 8 (1.0%) | 10 (0.9%) | |
| Marriage status 2 | 59 (5.4%) | |||
| Divorced | 0 (0.0%) | 4 (0.5%) | 4 (0.4%) | |
| Married | 208 (95.9%) | 759 (93.1%) | 967 (93.7%) | |
| Single | 8 (3.7%) | 46 (5.6%) | 54 (5.2%) | |
| Widowed | 1 (0.5%) | 6 (0.7%) | 7 (0.7%) | |
| Breastfeeding 2 | 541 (50.0%) | |||
| No | 30 (24.4%) | 131 (30.7%) | 161 (29.3%) | |
| Yes | 93 (75.6%) | 296 (69.3%) | 389 (70.7%) | |
| Lump2 | 41 (3.8%) | |||
| No | 148 (67.0%) | 588 (70.9%) | 736 (70.1%) | |
| Yes | 73 (33.0%) | 241 (29.1%) | 314 (29.9%) | |
| Nipple discharge 2 | 52 (4.8%) | |||
| No | 205 (94.9%) | 793 (96.4%) | 998 (96.1%) | |
| Yes | 11 (5.1%) | 30 (3.6%) | 41 (3.9%) | |
| Nipple retraction 2 | 45 (4.1%) | |||
| No | 213 (97.3%) | 784 (94.8%) | 997 (95.3%) | |
| Yes | 6 (2.7%) | 43 (5.2%) | 49 (4.7%) | |
| Axillary mass 2 | 55 (5.0%) | |||
| No | 203 (94.0%) | 764 (93.2%) | 967 (93.3%) | |
| Yes | 13 (6.0%) | 56 (6.8%) | 69 (6.7%) | |
| Pain2 | 54 (4.9%) | |||
| No | 172 (80.0%) | 691 (84.1%) | 863 (83.2%) | |
| Yes | 43 (20.0%) | 131 (15.9%) | 174 (16.8%) | |
| Skin changes 2 | 55 (5.0%) | |||
| No | 204 (94.0%) | 772 (94.3%) | 976 (94.2%) | |
| Yes | 13 (6.0%) | 47 (5.7%) | 60 (5.8%) | |
| Breast surgery/implant 2 | 76 (7.0%) | |||
| No | 143 (69.1%) | 531 (65.7%) | 674 (66.4%) | |
| Yes | 64 (30.9%) | 277 (34.3%) | 341 (33.6%) | |
| Trauma 2 | 108 (9.9%) | |||
| No | 191 (94.6%) | 754 (96.5%) | 945 (96.1%) | |
| Yes | 11 (5.4%) | 27 (3.5%) | 38 (3.9%) | |
| BC-HR2 | 51 (4.7%) | |||
| No | 130 (59.1%) | 554 (67.6%) | 684 (65.8%) | |
| Yes | 90 (40.9%) | 266 (32.4%) | 356 (34.2%) | |
| Previous mammogram 2 | 40 (3.7%) | |||
| No | 116 (52.5%) | 348 (41.9%) | 464 (44.1%) | |
| Yes | 105 (47.5%) | 482 (58.1%) | 587 (55.9%) | |
| Breast self-examination 2 | 106 (9.7%) | |||
| No | 44 (20.9%) | 149 (19.3%) | 193 (19.6%) | |
| Yes | 167 (79.1%) | 625 (80.7%) | 792 (80.4%) | |
| Handedness 2 | 667 (61.0%) | |||
| Left | 6 (7.4%) | 20 (5.8%) | 26 (6.1%) | |
| Right | 75 (92.6%) | 323 (94.2%) | 398 (93.9%) | |
| TAHBSO 2 | 70 (6.4%) | |||
| No | 187 (86.6%) | 720 (89.4%) | 907 (88.8%) | |
| Yes | 29 (13.4%) | 85 (10.6%) | 114 (11.2%) | |
| Family history 2 | 520 (48.0%) | |||
| No | 101 (80.2%) | 352 (79.1%) | 453 (79.3%) | |
| Yes | 25 (19.8%) | 93 (20.9%) | 118 (20.7%) | |
| Menopause status 2 | 0 (0.0%) | |||
| No | 139 (60.4%) | 385 (44.7%) | 524 (48.0%) | |
| Yes | 91 (39.6%) | 476 (55.3%) | 567 (52.0%) | |
| Mammographic density | 0 (0.0%) | |||
| Non-dense | 124 (53.9%) | 468 (54.4%) | 592 (54.3%) | |
| Dense | 106 (46.1%) | 393 (45.6%) | 499 (45.7%) |
| Study | Dataset | ML Classifier | Purpose | Performance Metrics 1 |
|---|---|---|---|---|
| Kim 2012 [57] | Clinical, histological, and pathological data | SVM 2, ANN, Cox regression | Breast cancer recurrence | Accuracy = 0.85 AUC = 0.85 Sensitivity = 0.89 Specificity = 0.73 |
| Ahmad 2013 [58] | Sociodemographic, clinical, and pathological data | DT, SVM 2, ANN | Breast cancer recurrence | Accuracy = 0.96 Sensitivity = 0.97 Specificity = 0.95 |
| Cirkovic 2015 [60] | Clinical, histological, and molecular data | ANN 2, SVM, LR, DT, NB | Breast cancer recurrence | Accuracy = 0.93 AUC = 0.95 Sensitivity = 0.96 Specificity = 0.83 |
| ANN, SVM, LR, DT, NB 2 | Breast cancer survival | Accuracy = 0.80 AUC = 0.83 Sensitivity = 0.65 Specificity = 0.85 | ||
| Sun 2018 [62] | Clinical and genomic data | DL 2, SVM, RF, LR | Breast cancer survival | Accuracy = 0.83 Sensitivity = 0.20 Specificity = 0.95 Precision = 0.75 |
| Kalafi 2019 [63] | Sociodemographic, clinical, and pathological data | MLP 2, DT, RF, SVM | Breast cancer survival | Accuracy = 0.88 Sensitivity = 0.96 Specificity = 0.83 Precision = 0.79 F1 score = 0.87 |
| Zeng 2019 [59] | Sociodemographic, clinical, histological, and pathological data | SVM 2 | Breast cancer distant recurrence | AUC = 0.87 Sensitivity = 0.47 Precision = 0.68 F1 score = 0.56 |
| Hou 2020 [66] | Sociodemographic and medical history | XGBoost 2, RF, DL, LR | Breast cancer prediction | Accuracy = 0.67 AUC = 0.74 Sensitivity = 0.66 Specificity = 0.69 |
| Kabiraj 2020 [61] | Sociodemographic and clinical data | RF 2, XGBoost | Breast cancer recurrence | Accuracy = 0.75 Sensitivity = 0.94 Specificity = 0.32 Precision = 0.72 F1 score = 0.64 |
| Khatun 2021 [65] | Sociodemographic and clinical data | NB, RF, MLP 2, LR | Breast cancer prediction | AUC = 0.89 Sensitivity = 0.85 Precision = 0.85 F1 score = 0.84 |
| Anisha 2021 [64] | Sociodemographic and clinical data | RF 2 | Breast cancer prediction | Accuracy = 0.98 AUC = 0.98 |
| Models | Youden J Index Mean (SD) | F2 Score Mean (SD) | Precision Mean (SD) | PR-AUC Mean (SD) |
|---|---|---|---|---|
| k-nearest neighbour | 0.58 (0.06) | 0.75 (0.03) | 0.83 (0.04) | 0.86 (0.02) |
| Elastic-net logistic regression | 0.17 (0.05) | 0.62 (0.06) | 0.59 (0.03) | 0.63 (0.03) |
| MARS | 0.21 (0.05) | 0.60 (0.04) | 0.62 (0.02) | 0.65 (0.03) |
| Artificial neural network | 0.25 (0.05) | 0.62 (0.04) | 0.64 (0.03) | 0.67 (0.03) |
| Partial least square | 0.19 (0.01) | 0.59 (0.01) | 0.61 (0.01) | 0.62 (0.01) |
| Random forest | 0.35 (0.04) | 0.66 (0.03) | 0.69 (0.02) | 0.74 (0.03) |
| Support vector machine | 0.08 (0.16) | 0.79 (0.09) | 0.55 (0.08) | 0.64 (0.06) |
| XGBoost | 0.17 (0.07) | 0.62 (0.09) | 0.60 (0.04) | 0.65 (0.03) |
| Models | n | Youden J Index | F2 Score | Precision | PR-AUC | ||||
|---|---|---|---|---|---|---|---|---|---|
| F-Statistics (df1, df2) | p-Value | F-Statistics (df1, df2) | p-Value | F-Statistics (df1, df2) | p-Value | F-Statistics (df1, df2) | p-Value | ||
| kNN | 5000 | 21,471 (7, 38,132) | p < 0.01 | 8511 (7, 38,132) | p < 0.01 | 24,768 (7, 38,132) | p < 0.01 | 27,694 (7, 38,132) | p < 0.01 |
| EN-LR | 5000 | ||||||||
| MARS | 3140 | ||||||||
| ANN | 5000 | ||||||||
| PLS | 5000 | ||||||||
| RF | 5000 | ||||||||
| SVM | 5000 | ||||||||
| XGBoost | 5000 | ||||||||
| Model | Fold | Neighbours | Distance Weighting Function | Minkowski Distance | Sensitivity Mean (SD) | Specificity Mean (SD) | Youden J Index Mean (SD) | F2 Score Mean (SD) | Precision Mean (SD) | PR-AUC Mean (SD) |
|---|---|---|---|---|---|---|---|---|---|---|
| 1 | 1 | 1 | Inversion | 1.24 | 0.77 (0.03) | 0.88 (0.03) | 0.65 (0.04) | 0.78 (0.03) | 0.87 (0.03) | 0.88 (0.02) |
| 2 | 3 | 10 | Triweight | 1.92 | 0.76 (0.03) | 0.87 (0.03) | 0.63 (0.03) | 0.78 (0.02) | 0.86 (0.02) | 0.89 (0.02) |
| 3 | 10 | 3 | Rank | 1.99 | 0.82 (0.02) | 0.79 (0.03) | 0.62 (0.03) | 0.82 (0.02) | 0.81 (0.03) | 0.88 (0.02) |
| 4 | 10 | 4 | Triweight | 1.97 | 0.79 (0.02) | 0.87 (0.03) | 0.66 (0.03) | 0.80 (0.02) | 0.87 (0.03) | 0.88 (0.02) |
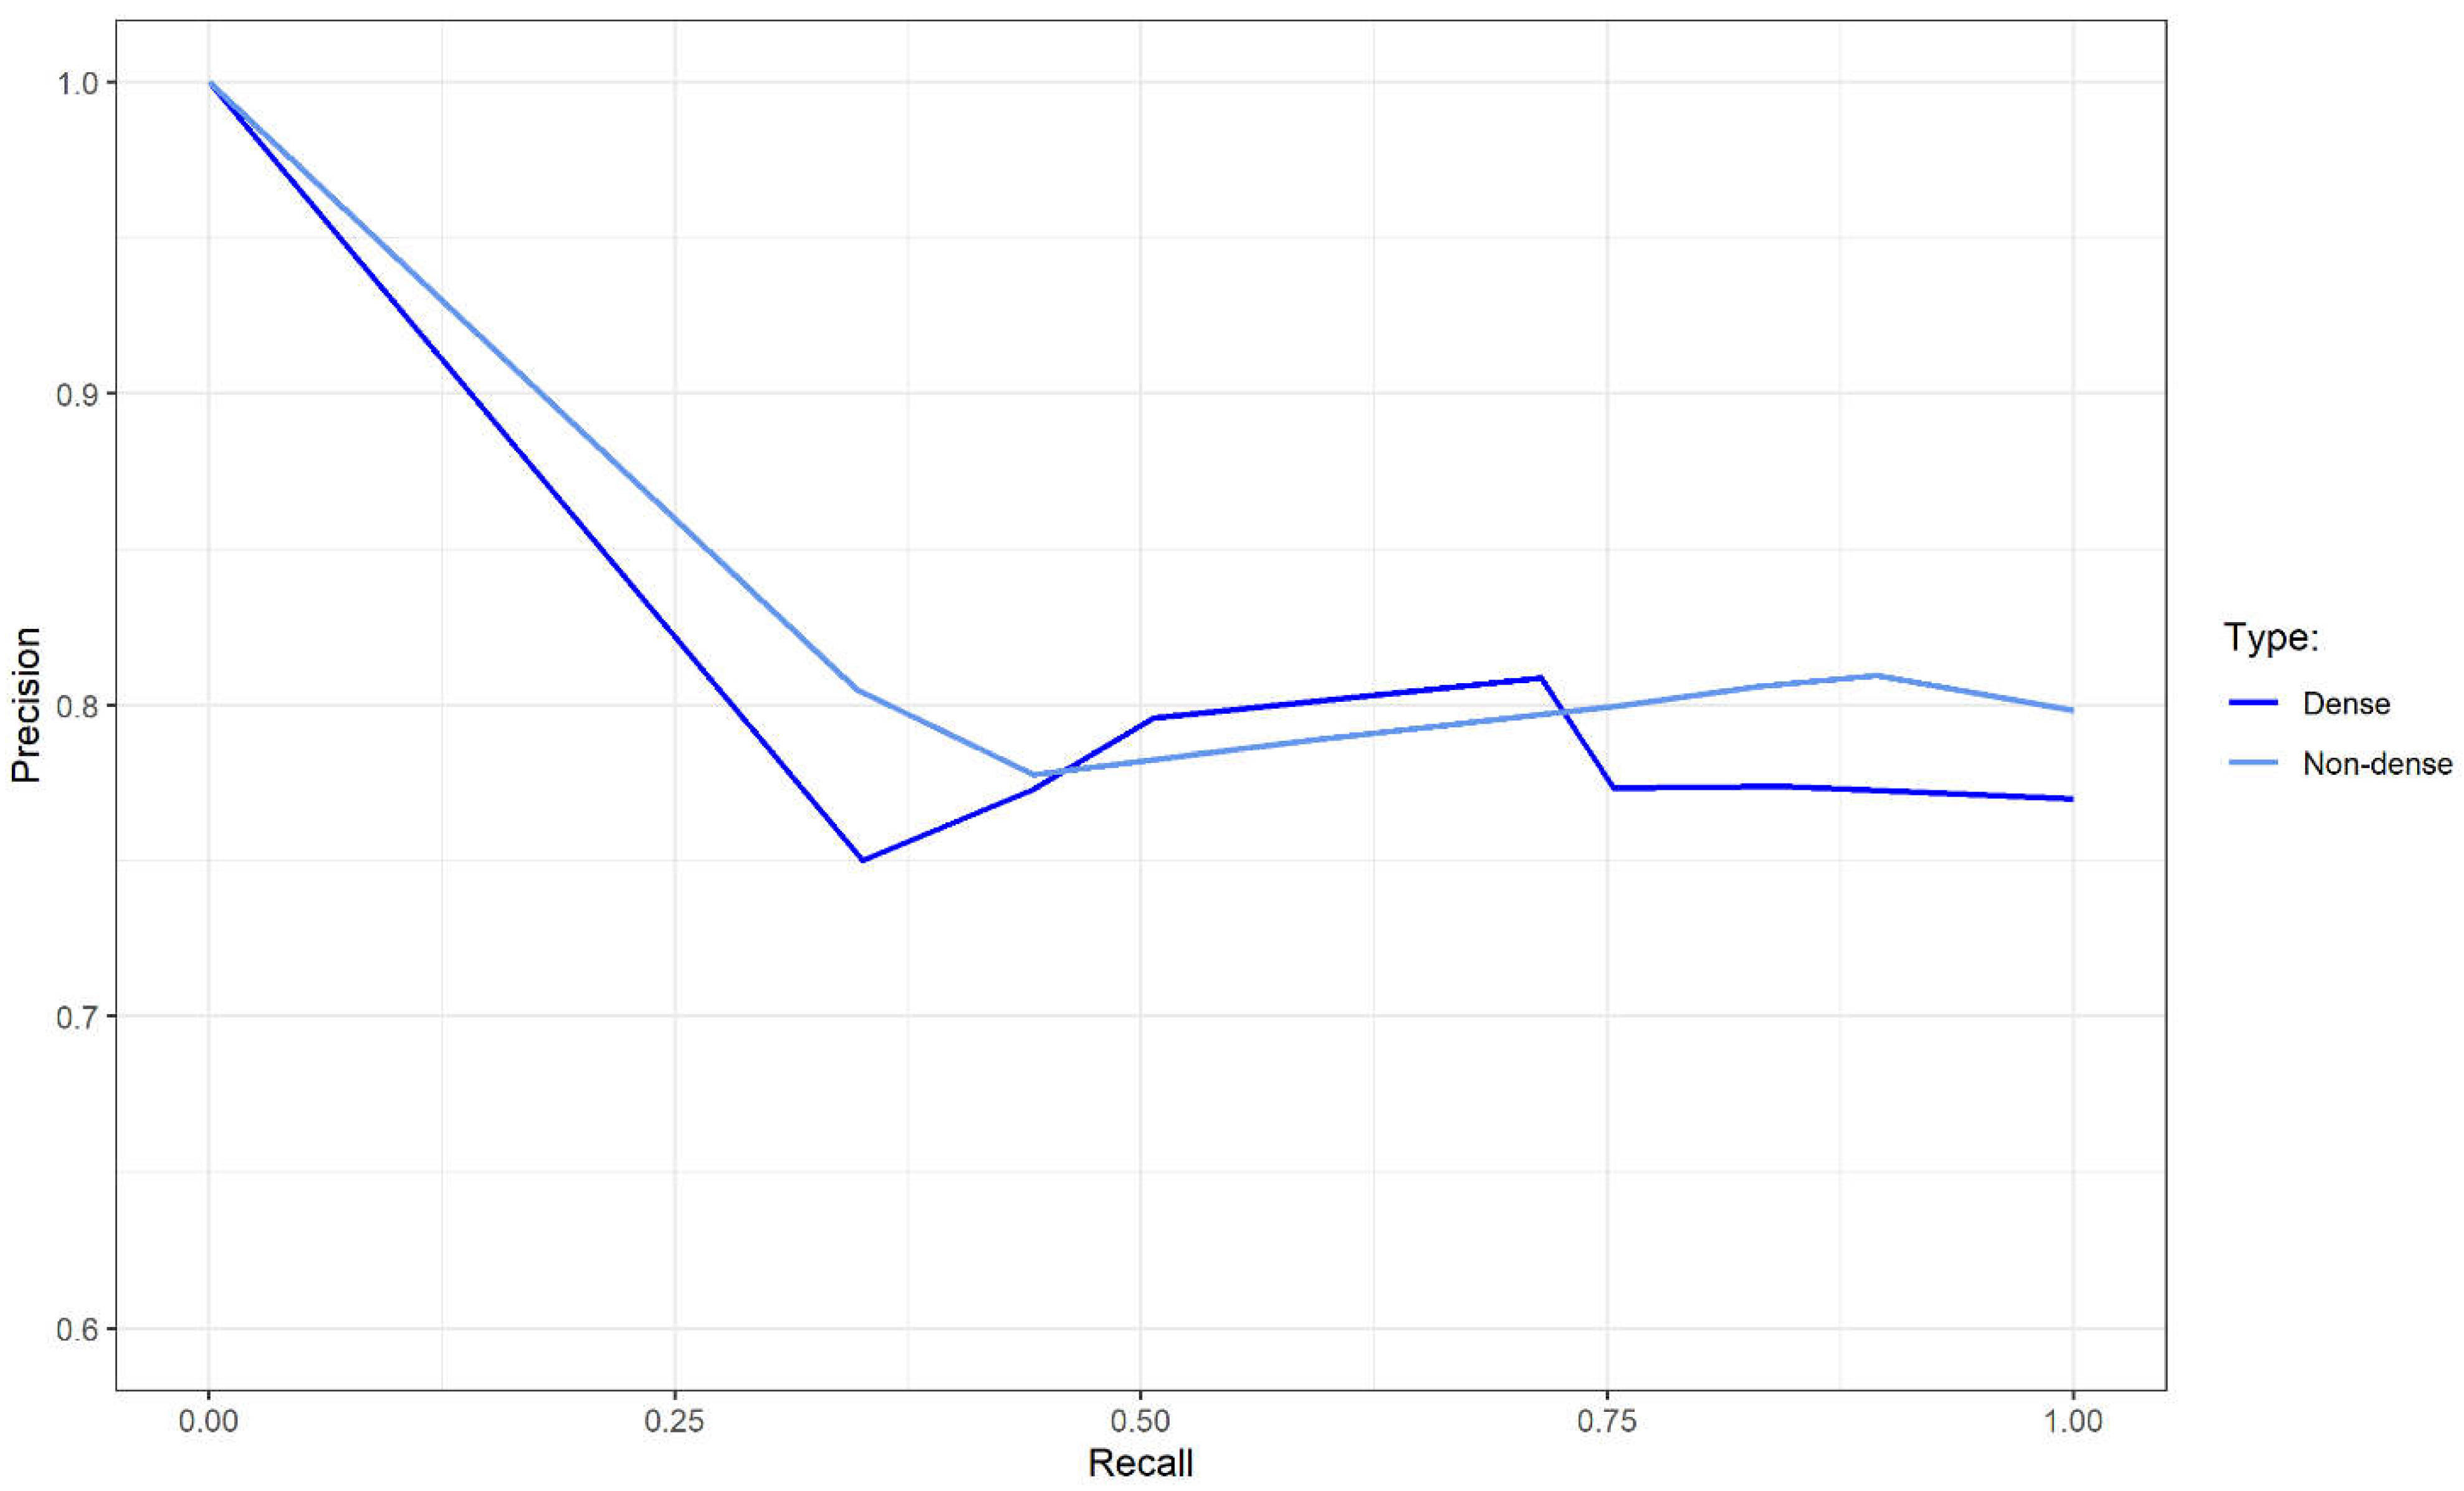
| Performance Metrics | Validation Dataset | ||
|---|---|---|---|
| Overall | Non-Dense | Dense | |
| Sensitivity | 0.74 | 0.76 | 0.71 |
| Specificity | 0.34 | 0.25 | 0.43 |
| Youden J index | 0.08 | 0.01 | 0.15 |
| F2 score | 0.75 | 0.77 | 0.73 |
| Precision | 0.80 | 0.80 | 0.81 |
| PR-AUC | 0.82 | 0.83 | 0.82 |
Publisher’s Note: MDPI stays neutral with regard to jurisdictional claims in published maps and institutional affiliations. |
© 2022 by the authors. Licensee MDPI, Basel, Switzerland. This article is an open access article distributed under the terms and conditions of the Creative Commons Attribution (CC BY) license (https://creativecommons.org/licenses/by/4.0/).
Share and Cite
Hanis, T.M.; Ruhaiyem, N.I.R.; Arifin, W.N.; Haron, J.; Wan Abdul Rahman, W.F.; Abdullah, R.; Musa, K.I. Over-the-Counter Breast Cancer Classification Using Machine Learning and Patient Registration Records. Diagnostics 2022, 12, 2826. https://0-doi-org.brum.beds.ac.uk/10.3390/diagnostics12112826
Hanis TM, Ruhaiyem NIR, Arifin WN, Haron J, Wan Abdul Rahman WF, Abdullah R, Musa KI. Over-the-Counter Breast Cancer Classification Using Machine Learning and Patient Registration Records. Diagnostics. 2022; 12(11):2826. https://0-doi-org.brum.beds.ac.uk/10.3390/diagnostics12112826
Chicago/Turabian StyleHanis, Tengku Muhammad, Nur Intan Raihana Ruhaiyem, Wan Nor Arifin, Juhara Haron, Wan Faiziah Wan Abdul Rahman, Rosni Abdullah, and Kamarul Imran Musa. 2022. "Over-the-Counter Breast Cancer Classification Using Machine Learning and Patient Registration Records" Diagnostics 12, no. 11: 2826. https://0-doi-org.brum.beds.ac.uk/10.3390/diagnostics12112826