
Diagnostic Accuracy of AI for Opportunistic Screening of Abdominal Aortic Aneurysm in CT: A Systematic Review and Narrative Synthesis

 , , , , , , , , , and
Abstract
:1. Introduction
2. Materials and Methods
2.1. Search Methods for the Identification of Studies
2.2. Data Collection and Analysis
3. Results
3.1. Description of Included Studies
3.2. Dataset Characteristics
3.3. Findings
3.4. Methodological Quality of Included Studies
4. Discussion
- 1.
- The AI sensitivity for AAA detection varied from 92 to 98.4% with a mean value of 95% (95% CI 100–87%; three studies);
- 2.
- The AI specificity for AAA detection varied from 95 to 98.3% with a mean value of 96.6% (95% CI 100–75.7%; two studies);
- 3.
- The AI accuracy for AAA detection varied from 92 to 98.4% with a mean value of 95.2% (95% CI 100–54.5%; two studies);
- 4.
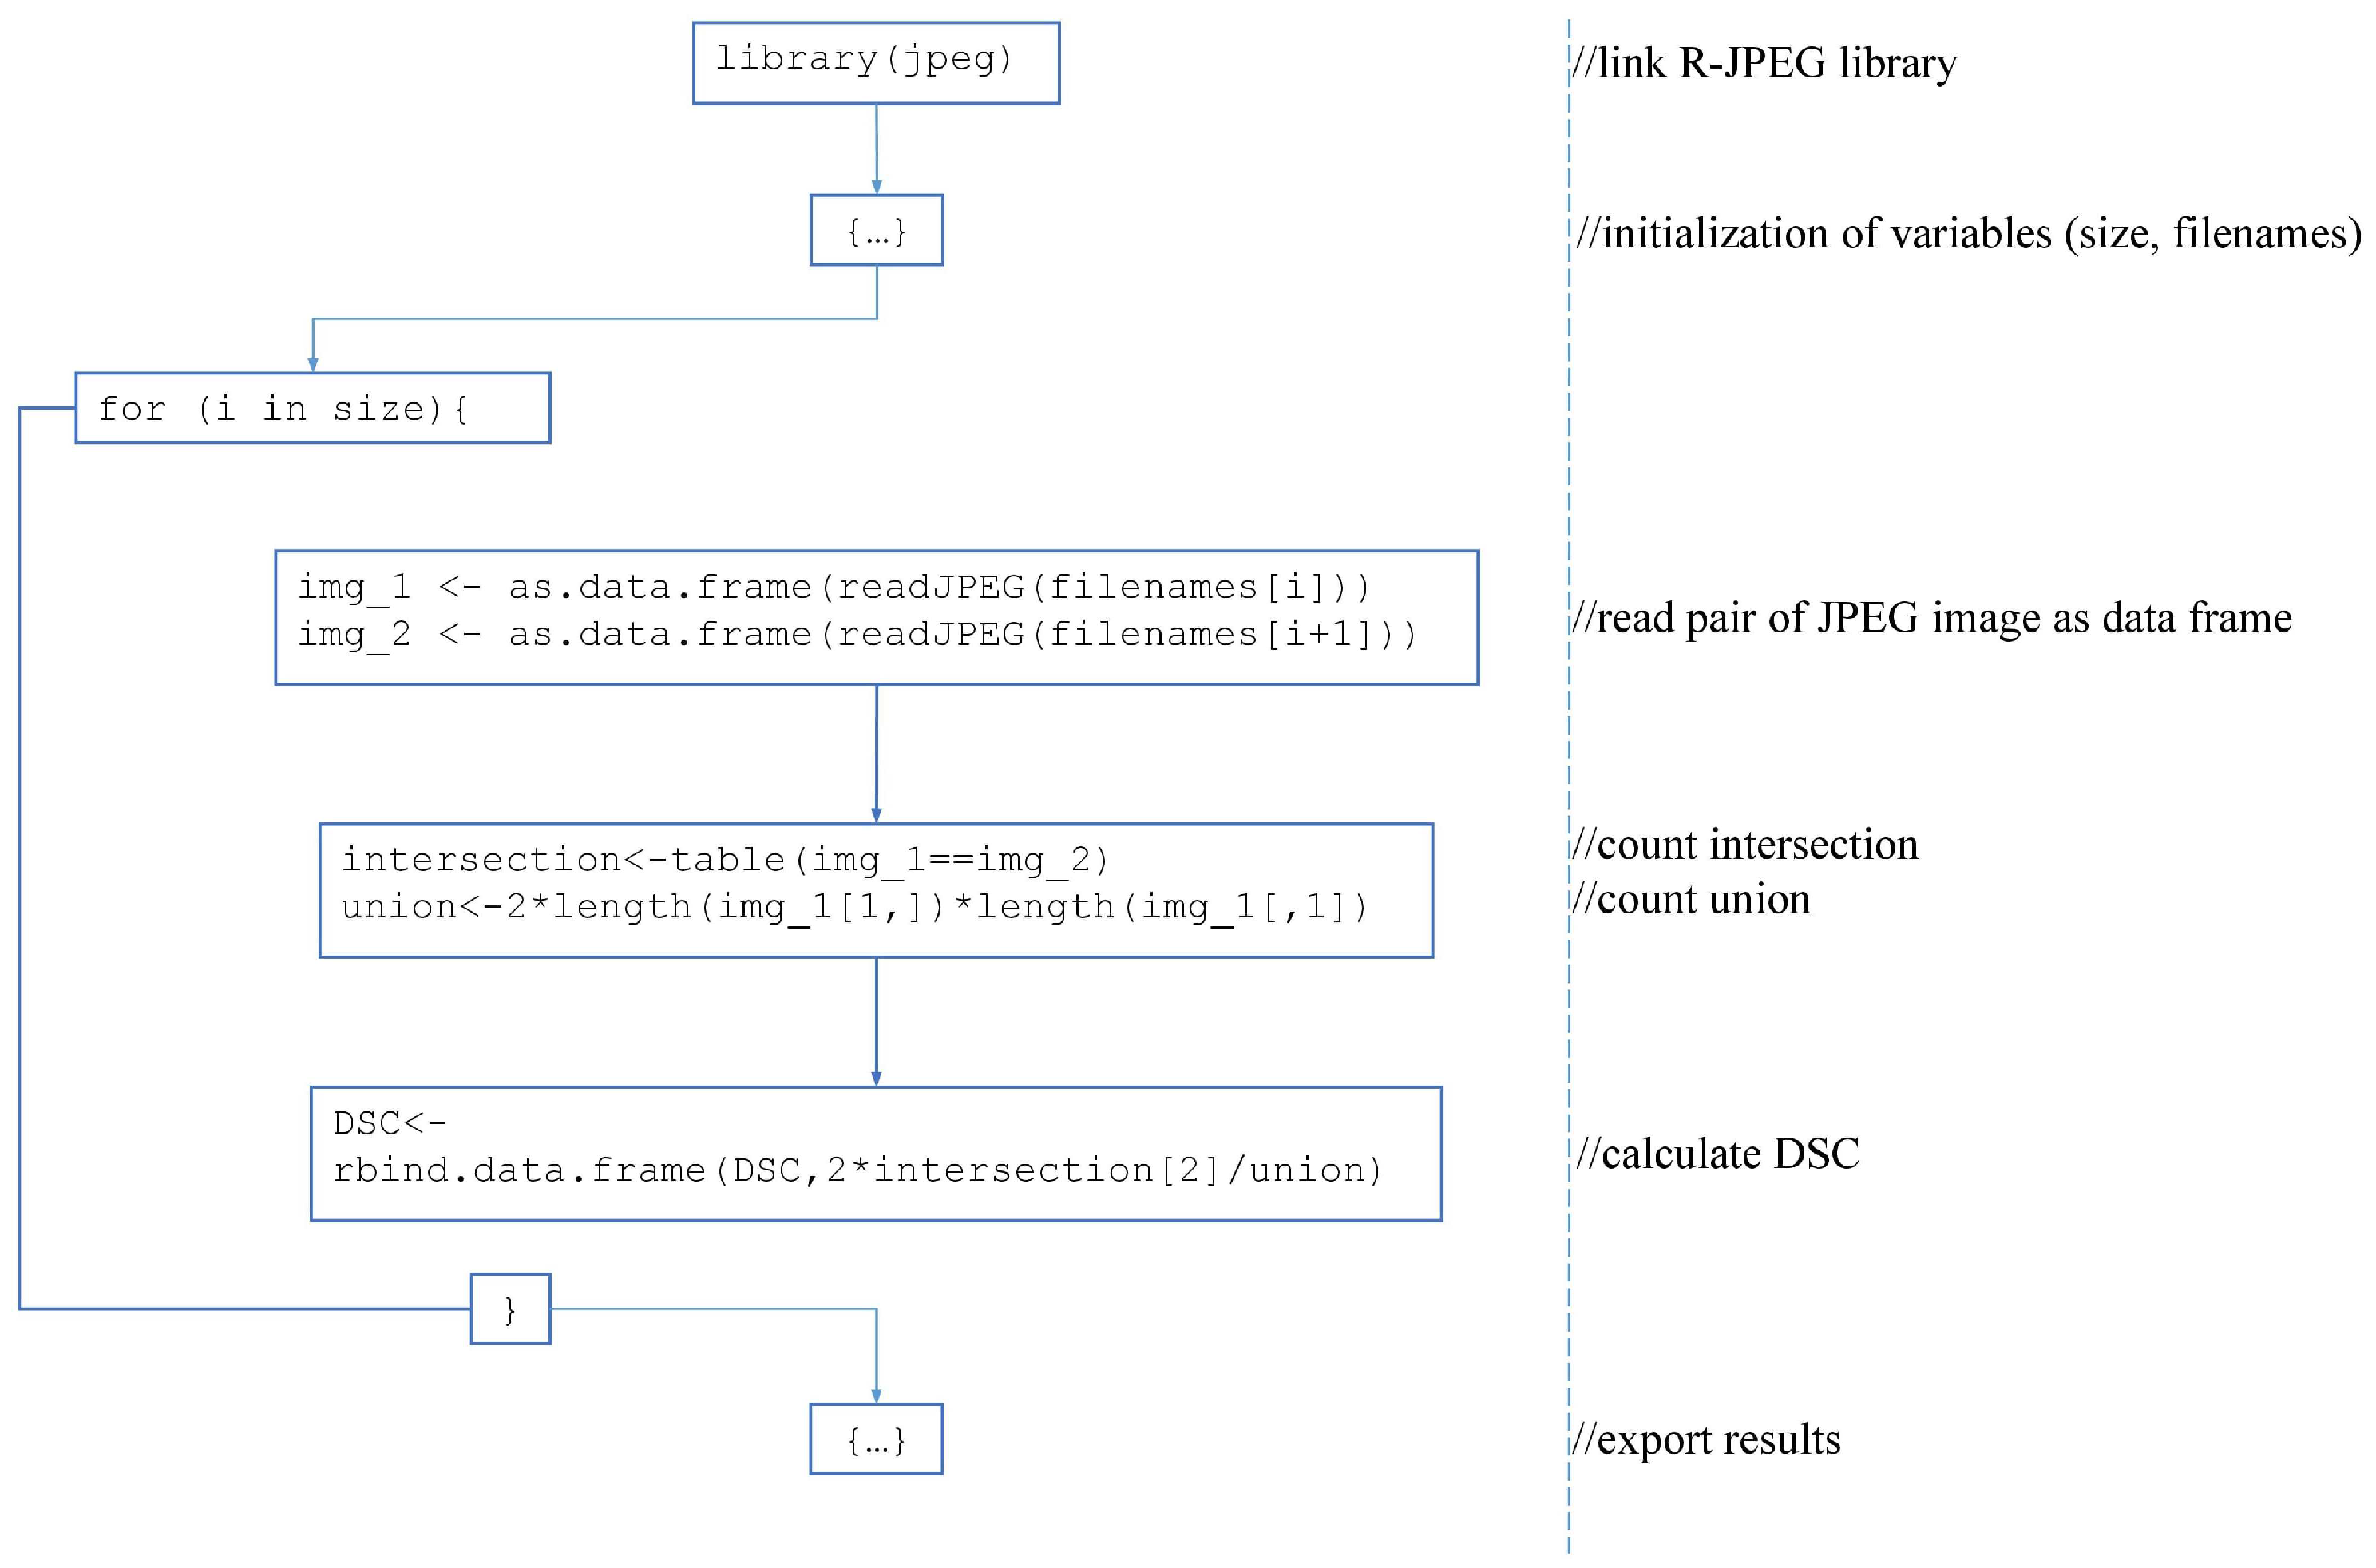
- The DSC for AAA segmentation varied from 0.93 to 0.99 with a mean value of 0.96 (95% CI 0.99–0.94; two studies).
4.1. Limitations of the Review
4.2. Implications of the Results for Practice, Policy, and Future Research
5. Conclusions
Author Contributions
Funding
Institutional Review Board Statement
Informed Consent Statement
Data Availability Statement
Acknowledgments
Conflicts of Interest
Abbreviations
| AAA | abdominal aortic aneurysm |
| AI | artificial intelligence |
| CT | computed tomography |
| CTA | computed tomography angiography |
| DSC | Dice similarity coefficient |
| GT | ground truth |
| NN | neural network |
| ROI | region of interest |
Appendix A. Search Queries
Appendix A.1. PubMed
Appendix A.2. Google Scholar
Appendix B. QADAS-CAD

| Domain | Patient Selection (D1) | Index Test (D2) | Reference Standard (D3) | Flow and Timing (D4) |
|---|---|---|---|---|
| Description | A description of included patient data (previous intervention, pathology rate, and severity) | A description of the index test and how it was conducted and interpreted within the context of the study | A description of the reference standard and how it was conducted and interpreted within the context of the study | A description of any difference between the index test(s) and the reference standard performance conditions |
| Signaling questions (yes/no/unclear) | Were the data (training and testing sets) balanced by the severity (including the absence) of the target pathology? | If a neural network was used, did the training and testing datasets have no intersections or resembles? | Is the reference standard likely to correctly classify the target condition? | Was there transparency in how the outcomes were generated? |
| Were the data (training and testing sets) balanced in terms of demographic factors? | If a neural network was used, was the size of each set rationalized? | Were the reference standard results prepared or verified with the required level of expertise? | Did all patient data have the same reference standard? | |
| Did the study avoid inappropriate exclusions? | If a pathology threshold was used, was it prespecified? | Were all patient data included in the analysis? | ||
| If a decision threshold (for AI) was used, was it prespecified? | ||||
| Risk of bias (high/low/unclear) | Could the selection of patient data has introduced bias? | Could the conduct or interpretation of the index test have introduced bias? | Could the reference standard, its conduct, or its interpretation have introduced bias? | Could the patient flow have introduced bias? |
| Concerns regarding applicability: high/low/unclear | Are there concerns that the included patient data do not match the review question? | Are there concerns that the index test, its conduct, or interpretation differ from the review question? | Are there concerns that the target condition as defined by the reference standard does not match the review question? |
| Domain | Question | Almuntashri A. (2012) [32] | Fujiwara J. F. (2021) [36] | Habijan M. (2020) [31] | Hosseini B. (2010) [33] | Kossioris G. T. (2008) [34] | Lu J.-T. (2019) [30] | Mohhamadi S. (2019) [23] | Schei T. R. (2003) [35] |
|---|---|---|---|---|---|---|---|---|---|
| D1 | Were the data (training and testing sets) balanced by the severity (including the absence) of the target pathology? | no | no | no | no | no | yes | yes | no |
| Were the data (training and testing sets) balanced in terms of demographic factors? | no | no | unclear | no | no | unclear | yes | no | |
| Did the study avoid inappropriate exclusions? | yes | yes | yes | yes | yes | yes | yes | yes | |
| D2 | If a neural network was used, did the training and testing datasets have no intersections or resembles? | x | unclear | yes | x | x | yes | yes | x |
| If a neural network was used, was the size of each set rationalized? | x | unclear | yes | x | x | yes | yes | x | |
| If a pathology threshold was used, was it prespecified? | yes | yes | yes | yes | yes | yes | yes | yes | |
| If a decision threshold (for AI) was used, was it prespecified? | x | unclear | unclear | x | x | unclear | unclear | x | |
| D3 | Is the reference standard likely to correctly classify the target condition? | unclear | unclear | yes | unclear | unclear | yes | yes | yes |
| Were the reference standard results prepared or verified with the required level of expertise? | unclear | unclear | yes | unclear | unclear | yes | yes | yes | |
| D4 | Was there transparency in how the outcomes were generated? | yes | no | yes | yes | yes | yes | yes | yes |
| Did all patient data have the same reference standard? | yes | unclear | yes | yes | yes | unclear | unclear | yes |
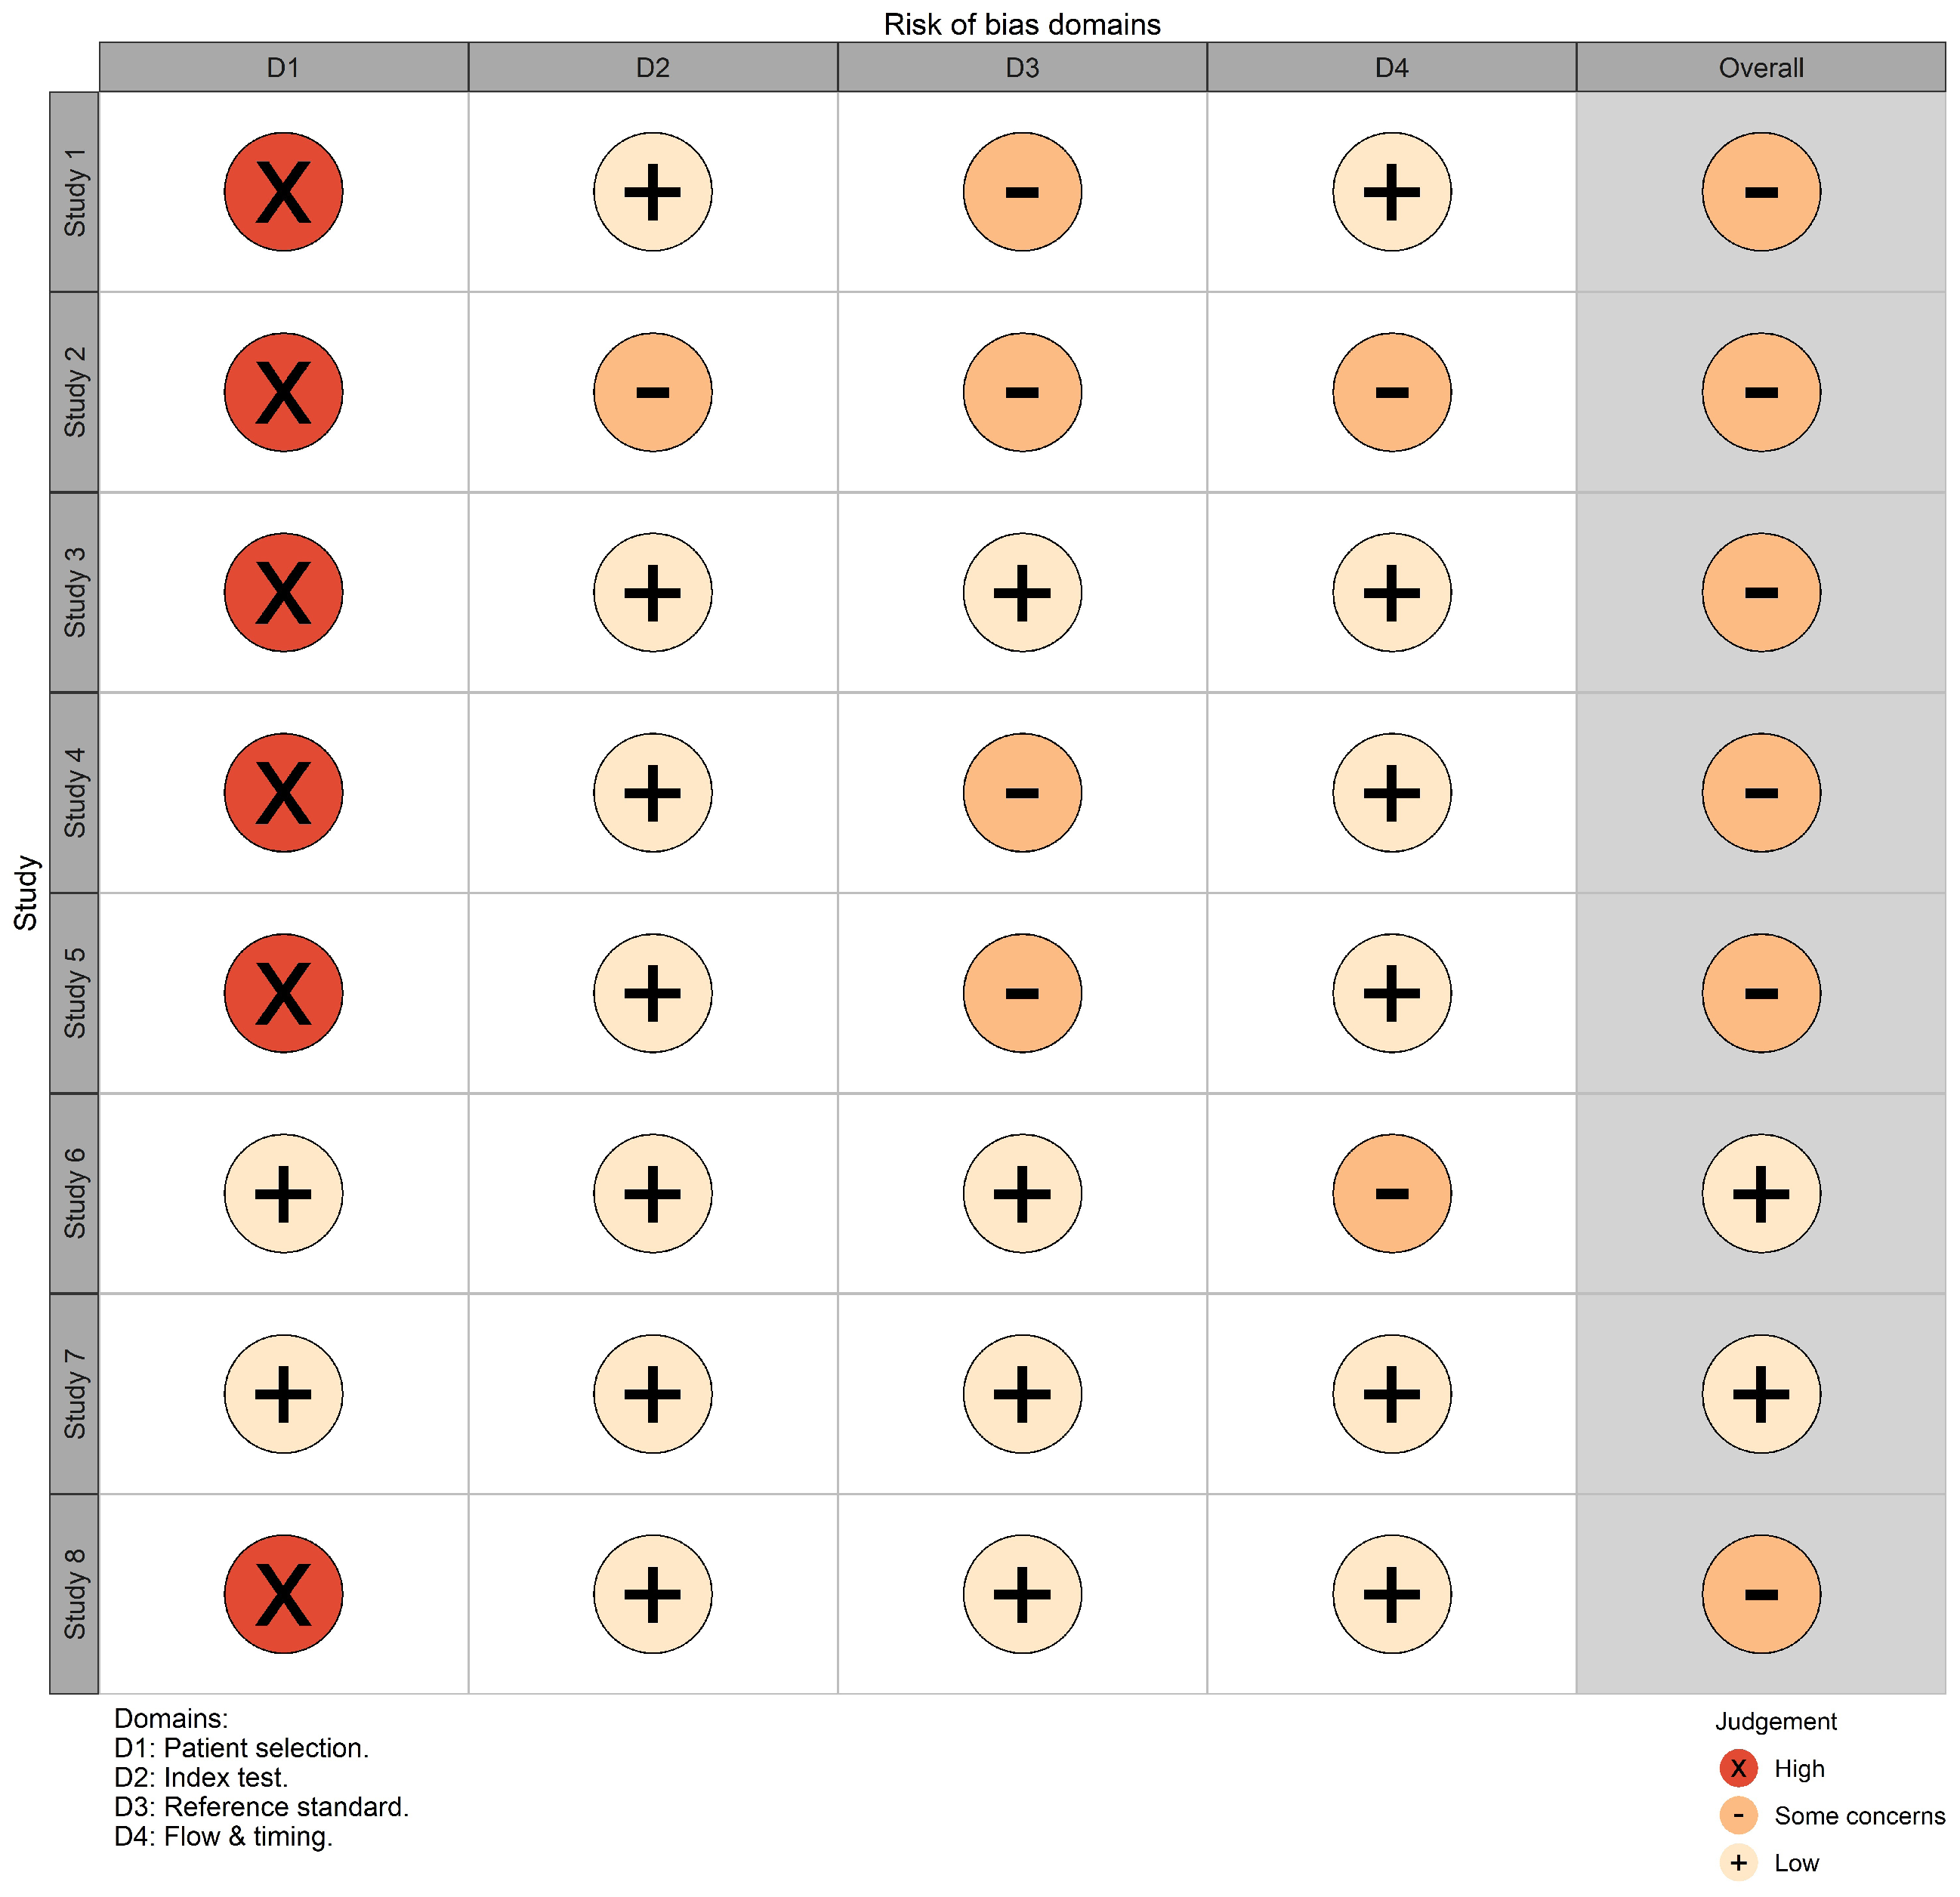
| Study | 1st Author (Year) | D1 | D2 | D3 | D4 | Overall | Weight (%) |
|---|---|---|---|---|---|---|---|
| Study 1 | Almuntashri A. (2012) [32] | high | low | some concerns | low | high | 3 |
| Study 2 | Fujiwara J. F. (2021) [36] | high | some concerns | some concerns | some concerns | high | 11 |
| Study 3 | Habijan M. (2020) [31] | high | low | low | low | low | 31.6 |
| Study 4 | Hosseini B. (2010) [33] | high | low | some concerns | low | high | 12.9 |
| Study 5 | Kossioris G. T. (2008) [34] | high | low | some concerns | low | high | 0.1 |
| Study 6 | Lu J.-T. (2019) [30] | low | low | low | some concerns | low | 29.2 |
| Study 7 | Mohhamadi S. (2019) [23] | low | low | low | low | low | 12.1 |
| Study 8 | Schei T. R. (2003) [35] | high | low | low | low | low | 0.1 |
References
- Gawenda, M.; Brunkwall, J. Ruptured abdominal aortic aneurysm: The state of play. Dtsch. Arztebl. Int. 2012, 109, 727. [Google Scholar] [CrossRef] [PubMed]
- Erbel, R.; Aboyans, V.; Boileau, C.; Bossone, E.; Bartolomeo, R.D.; Eggebrecht, H.; Evangelista, A.; Falk, V.; Frank, H.; Gaemperli, O.; et al. 2014 ESC Guidelines on the diagnosis and treatment of aortic diseases: Document covering acute and chronic aortic diseases of the thoracic and abdominal aorta of the adult The Task Force for the Diagnosis and Treatment of Aortic Diseases of the European Society of Cardiology (ESC). Eur. Heart J. 2014, 35, 2873–2926. [Google Scholar] [CrossRef] [PubMed] [Green Version]
- Mussa, F.F. Screening for abdominal aortic aneurysm. J. Vasc. Surg. 2015, 62, 774–778. [Google Scholar] [CrossRef] [PubMed] [Green Version]
- Ferket, B.S.; Grootenboer, N.; Colkesen, E.B.; Visser, J.J.; van Sambeek, M.R.; Spronk, S.; Steyerberg, E.W.; Hunink, M.M. Systematic review of guidelines on abdominal aortic aneurysm screening. J. Vasc. Surg. 2012, 55, 1296–1304. [Google Scholar] [CrossRef] [Green Version]
- Manning, B.J.; Kristmundsson, T.; Sonesson, B.; Resch, T. Abdominal aortic aneurysm diameter: A comparison of ultrasound measurements with those from standard and three-dimensional computed tomography reconstruction. J. Vasc. Surg. 2009, 50, 263–268. [Google Scholar] [CrossRef] [Green Version]
- Tisi, P.; McLain, A.; Jeddy, T.; Ashton, H.; Scott, R. Screening for abdominal aortic aneurysm: Is opportunistic detection a realistic alternative? Eur. J. Vasc. Endovasc. Surg. 1998, 15, 532–534. [Google Scholar] [CrossRef] [Green Version]
- Claridge, R.; Arnold, S.; Morrison, N.; van Rij, A.M. Measuring abdominal aortic diameters in routine abdominal computed tomography scans and implications for abdominal aortic aneurysm screening. J. Vasc. Surg. 2017, 65, 1637–1642. [Google Scholar] [CrossRef] [Green Version]
- Number of Examinations with Computer Tomography (CT) in Selected Countries as of 2019. Available online: https://0-www-statista-com.brum.beds.ac.uk/statistics/283085/computer-tomography-examinations-in-selected-countries/ (accessed on 3 September 2021).
- Busby, L.P.; Courtier, J.L.; Glastonbury, C.M. Bias in radiology: The how and why of misses and misinterpretations. Radiographics 2018, 38, 236. [Google Scholar] [CrossRef] [Green Version]
- Cai, L.; Gao, J.; Zhao, D. A review of the application of deep learning in medical image classification and segmentation. Ann. Transl. Med. 2020, 8, 713. [Google Scholar] [CrossRef]
- Singh, S.P.; Wang, L.; Gupta, S.; Goli, H.; Padmanabhan, P.; Gulyas, B. 3D deep learning on medical images: A review. Sensors 2020, 20, 5097. [Google Scholar] [CrossRef]
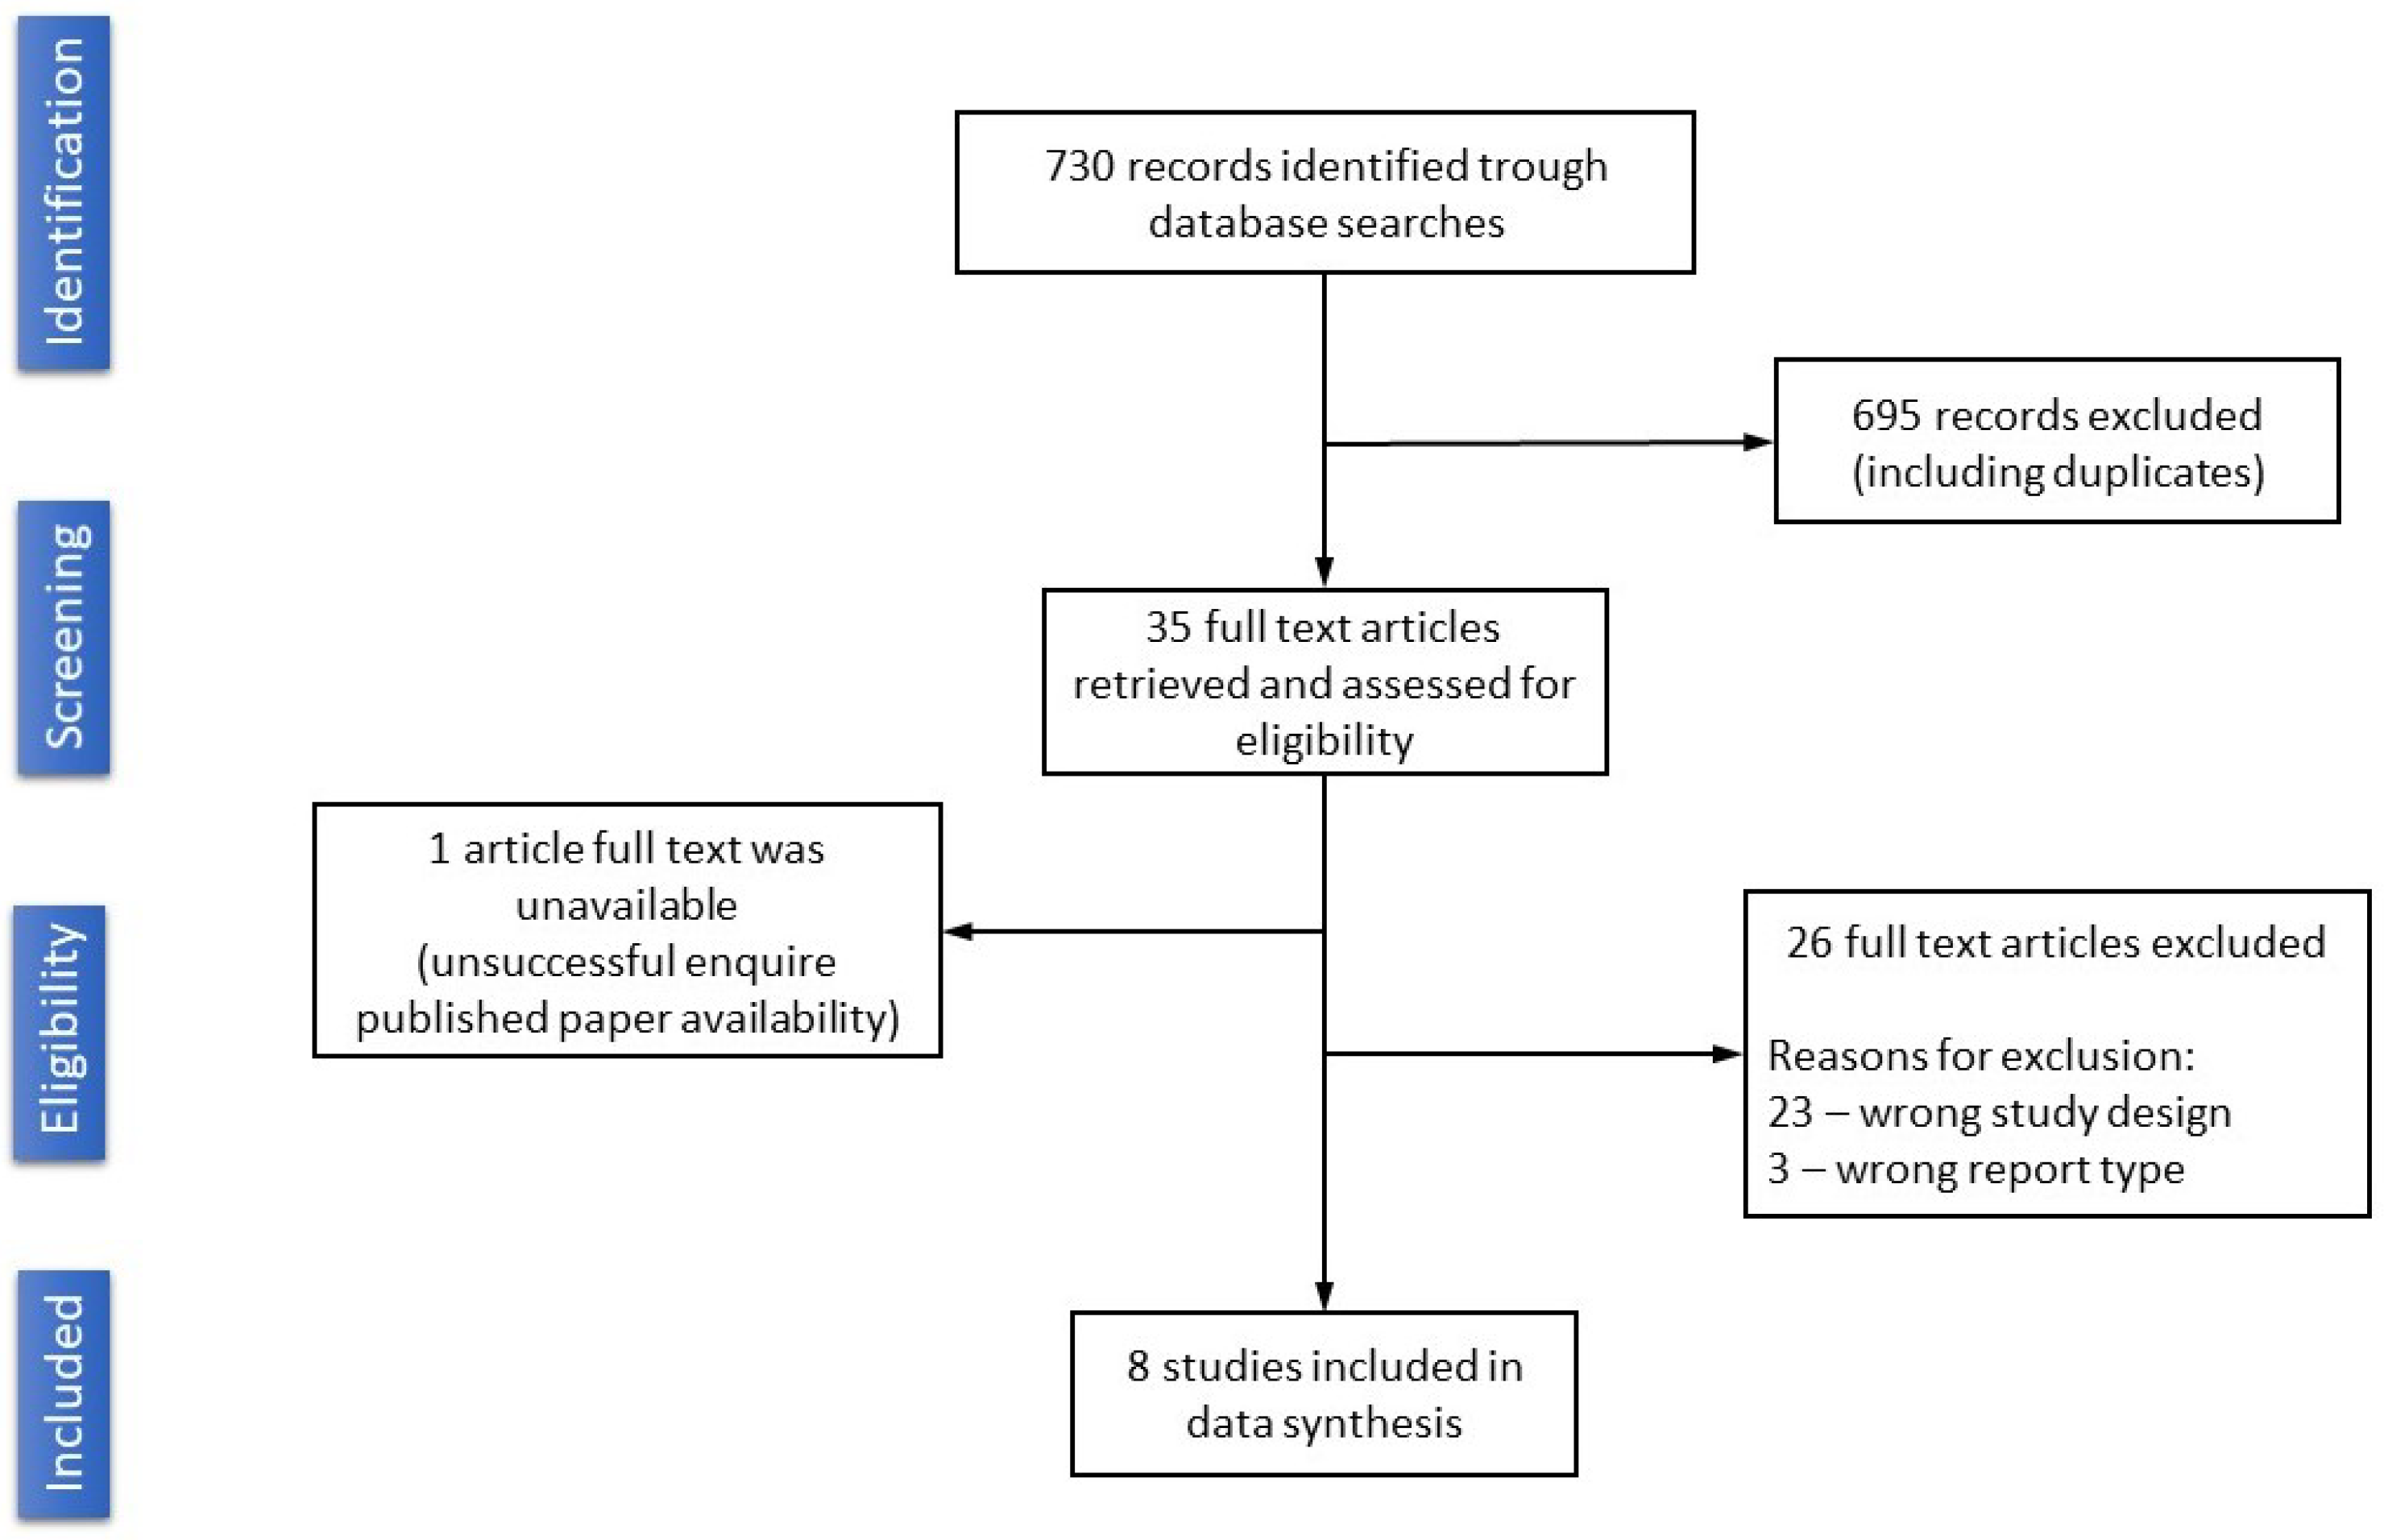
- Liberati, A.; Altman, D.G.; Tetzlaff, J.; Mulrow, C.; Gotzsche, P.C.; Ioannidis, J.P.; Clarke, M.; Devereaux, P.J.; Kleijnen, J.; Moher, D. The PRISMA statement for reporting systematic reviews and meta-analyses of studies that evaluate health care interventions: Explanation and elaboration. J. Clin. Epidemiol. 2009, 62, e1–e34. [Google Scholar] [CrossRef] [PubMed] [Green Version]
- Abdominal Aortic Aneurysm. Available online: https://radiopaedia.org/cases/85063 (accessed on 3 September 2021).
- Yu, Y.; Gao, Y.; Wei, J.; Liao, F.; Xiao, Q.; Zhang, J.; Yin, W.; Lu, B. A three-dimensional deep convolutional neural network for automatic segmentation and diameter measurement of type B aortic dissection. Korean J. Radiol. 2021, 22, 168. [Google Scholar] [CrossRef]
- ACR Data Science Institute AI Central. Available online: https://aicentral.acrdsi.org/ (accessed on 3 January 2021).
- Bramer, W.M.; De Jonge, G.B.; Rethlefsen, M.L.; Mast, F.; Kleijnen, J. A systematic approach to searching: An efficient and complete method to develop literature searches. J. Med Libr. Assoc. JMLA 2018, 106, 531. [Google Scholar] [CrossRef] [PubMed] [Green Version]
- MeSH (Medical Subject Headings). Available online: https://0-www-ncbi-nlm-nih-gov.brum.beds.ac.uk/mesh/ (accessed on 3 September 2021).
- Yale MeSH Analyzer. Available online: https://mesh.med.yale.edu/ (accessed on 3 September 2021).
- Lareyre, F.; Adam, C.; Carrier, M.; Dommerc, C.; Mialhe, C.; Raffort, J. A fully automated pipeline for mining abdominal aortic aneurysm using image segmentation. Sci. Rep. 2019, 9, 13750. [Google Scholar] [CrossRef] [PubMed] [Green Version]
- Sedghi Gamechi, Z.; Bons, L.R.; Giordano, M.; Bos, D.; Budde, R.P.; Kofoed, K.F.; Pedersen, J.H.; Roos-Hesselink, J.W.; de Bruijne, M. Automated 3D segmentation and diameter measurement of the thoracic aorta on non-contrast enhanced CT. Eur. Radiol. 2019, 29, 4613–4623. [Google Scholar] [CrossRef] [PubMed] [Green Version]
- Caradu, C.; Spampinato, B.; Vrancianu, A.M.; Berard, X.; Ducasse, E. Fully automatic volume segmentation of infrarenal abdominal aortic aneurysm computed tomography images with deep learning approaches versus physician controlled manual segmentation. J. Vasc. Surg. 2021, 74, 246–256. [Google Scholar] [CrossRef] [PubMed]
- Kauffmann, C.; Tang, A.; Therasse, E.; Giroux, M.F.; Elkouri, S.; Melanson, P.; Melanson, B.; Oliva, V.L.; Soulez, G. Measurements and detection of abdominal aortic aneurysm growth: Accuracy and reproducibility of a segmentation software. Eur. J. Radiol. 2012, 81, 1688–1694. [Google Scholar] [CrossRef] [PubMed]
- Mohammadi, S.; Mohammadi, M.; Dehlaghi, V.; Ahmadi, A. Automatic segmentation, detection, and diagnosis of abdominal aortic aneurysm (AAA) using convolutional neural networks and hough circles algorithm. Cardiovasc. Eng. Technol. 2019, 10, 490–499. [Google Scholar] [CrossRef]
- Mendeley Reference Manager. Available online: https://www.mendeley.com/reference-management/reference-manager (accessed on 3 November 2021).
- Dice, L.R. Measures of the Amount of Ecologic Association between Species. Ecology 1945, 26, 297–302. [Google Scholar] [CrossRef]
- Procreate. Available online: https://procreate.art/ (accessed on 3 November 2021).
- RStudio: Open Source and Professional Software for Data Science Teams—RStudio. Available online: https://www.rstudio.com/ (accessed on 3 September 2021).
- Sounderajah, V.; Ashrafian, H.; Rose, S.; Shah, N.H.; Ghassemi, M.; Golub, R.; Kahn, C.E.; Esteva, A.; Karthikesalingam, A.; Mateen, B.; et al. A quality assessment tool for artificial intelligence-centered diagnostic test accuracy studies: QUADAS-AI. Nat. Med. 2021, 27, 1663–1665. [Google Scholar] [CrossRef]
- QUADAS-2: University of Bristol. Available online: https://www.bristol.ac.uk/population-health-sciences/projects/quadas/quadas-2/ (accessed on 3 October 2021).
- Lu, J.T.; Brooks, R.; Hahn, S.; Chen, J.; Buch, V.; Kotecha, G.; Andriole, K.P.; Ghoshhajra, B.; Pinto, J.; Vozila, P.; et al. DeepAAA: Clinically Applicable and Generalizable Detection of Abdominal Aortic Aneurysm Using Deep Learning. In Medical Image Computing and Computer-Assisted Intervention; Springer: Cham, Switzerland, 2019; pp. 723–731. [Google Scholar] [CrossRef] [Green Version]
- Habijan, M.I.; Galić, H.L.K.R.; Babin, D. Abdominal aortic aneurysm segmentation from ct images using modified 3d u-net with deep supervision. In Proceedings of the 2020 International Symposium ELMAR, Zadar, Croatia, 14–15 September 2020; pp. 123–128. [Google Scholar] [CrossRef]
- Almuntashri, A.; Finol, E.; Agaian, S. Automatic lumen segmentation in CT and PC-MR images of abdominal aortic aneurysm. In Proceedings of the 2012 IEEE International Conference on Systems, Man, and Cybernetics (SMC), Seoul, Republic of Korea, 14–17 October 2012; pp. 2891–2896. [Google Scholar] [CrossRef]
- Hosseini, B.; Mashak, S.V.; Majd, E.M.; Sheikh, U.U.; Abu-Bakar, S. Automatic segmentation of abdominal aortic aneurysm using logical algorithm. In Proceedings of the 2010 Fourth UKSim European Symposium on Computer Modeling and Simulation, Pisa, Italy, 17–19 November 2010; pp. 147–151. [Google Scholar] [CrossRef]
- Kossioris, G.; Papaharilaou, Y.; Zohios, C. Detection of lumen, thrombus and outer wall boundaries of an abdominal aortic aneurysm From 2D medical images using level set methods. In Proceedings of the ASME Summer Bioengineering Conference, Marco Island, FL, USA, 25–29 June 2008; pp. 25–29. [Google Scholar] [CrossRef]
- Schei, T.R.; Barrett, S.; Jones, D.; Krupski, W. Automated Abdominal Aortic Aneurysm segmentation using MATLAB. Biomed. Sci. Instrum. 2003, 39, 53–58. [Google Scholar] [PubMed]
- Fujiwara, J.; Orii, O.; Araki, K.; Ogura, M.; Ito, T.; Oyamada, K.; Morino, Y.; Yoshioka, K. Fully automatic detection and measurement of abdominal aortic aneurysm using artificial intelligence. Eur. Heart J. 2021, 42, ehab724.3070. [Google Scholar] [CrossRef]
- Lareyre, F.; Adam, C.; Carrier, M.; Raffort, J. Artificial intelligence and automatic segmentation of abdominal aortic aneurysm: Past, present, and future. J. Vasc. Surg. 2021, 74, 347–348. [Google Scholar] [CrossRef] [PubMed]
- Sounderajah, V.; Ashrafian, H.; Golub, R.M.; Shetty, S.; De Fauw, J.; Hooft, L.; Moons, K.; Collins, G.; Moher, D.; Bossuyt, P.M.; et al. Developing a reporting guideline for artificial intelligence-centred diagnostic test accuracy studies: The STARD-AI protocol. BMJ Open 2021, 11, e047709. [Google Scholar] [CrossRef] [PubMed]
- Oakden-Rayner, L.; Dunnmon, J.; Carneiro, G.; Re, C. Hidden stratification causes clinically meaningful failures in machine learning for medical imaging. In Proceedings of the ACM Conference on Health, Inference, and Learning, Toronto, ON, Canada, 2–4 April 2020; pp. 151–159. [Google Scholar] [CrossRef]
- The Moscow Experiment on CV in Radiology. Available online: https://mosmed.ai/ (accessed on 3 January 2021).
- Morozov, S.; Vladzymyrskyy, A.; Ledikhova, N. Moscow experiment on computer vision in radiology: Involvement and participation of radiologists. Vrach I Inf. Tehnol. 2020, 20, 14–23. [Google Scholar] [CrossRef]
- Orlando, N.; Gyacskov, I.; Gillies, D.J.; Guo, F.; Romagnoli, C.; D’Souza, D.; Cool, D.W.; Hoover, D.A.; Fenster, A. Effect of dataset size, image quality, and image type on deep learning-based automatic prostate segmentation in 3D ultrasound. Phys. Med. Biol. 2022, 67, 074002. [Google Scholar] [CrossRef]
- Thresholds for Abdominal Aortic Aneurysm Repair: Abdominal Aortic Aneurysm: Diagnosis and Management: Evidence Review. Available online: https://0-www-ncbi-nlm-nih-gov.brum.beds.ac.uk/books/NBK556917/ (accessed on 3 January 2021).


| № | 1st Author (Year) | Study/Data Origin (Country) | Objectives | Type of Data Processing | Key Characteristics of Datasets | Relevant Outcomes | Calculated DSC |
|---|---|---|---|---|---|---|---|
| 1 | Almuntashri A. (2012) [32] | USA/- | AAA segmentation | Digital image processing algorithms | Two studies (one noncontrast case), 100% pathology rate, mixed | - | 0.94 |
| 2 | Fujiwara J. F. (2021) [36] | Japan/- | AAA detection and measurement | NN (not specified) | A single study, 100% pathology rate, noncontrast CT | Se 94.6% | - |
| 3 | Habijan M. (2020) [31] | Croatia/Belgium | AAA segmentation | NN (fourfold cross validation) | 19 studies, 100 % pathology rate, CT type n/s | DSC 0.91 ± 0.16 | 0.96 |
| 4 | Hosseini B. (2010) [33] | Malaysia/- | AAA detection | Non-NN (logical algorithm) | Two studies (one noncontrast case), 100% pathology rate, mixed | - | 0.99 |
| 5 | Kossioris G. T. (2008) [34] | Greece/- | AAA segmentation | Non-NN (level set method) | A single study, 100% pathology rate, CT type n/s | - | 0.93 |
| 6 | Lu J.-T. (2019) [30] | USA/USA | AAA detection | NN (fivefold cross validation) | 321 studies, 77% pathology rate, mixed | Ac 92.0 %; Se 92.0%; Sp 95.0%; DSC 0.90 ± 0.05 | 0.99 |
| 7 | Mohhamadi S. (2019) [23] | Iran/Iran | AAA segmentation and classification | Hough’s algorithm and NN (fivefold cross validation) | 10 studies, 20% pathology rate, mixed | Ac 98.4%; Se 98.4%; Sp 98.3% | - |
| 8 | Schei T. R. (2003) [35] | USA/- | AAA detection | Non-NN (computer algorithm) | A single study, 100% pathology rate, CT type n/s | - | 0.97 |
| № | Study First Author (Year) | Test Set Size (Images) | TP | FP | TN | FN |
|---|---|---|---|---|---|---|
| 1 | Almuntashri A. (2012) [32] | 40 | no information | |||
| 2 | Fujiwara J. F. (2021) [36] | 9 | ||||
| 3 | Habijan M. (2020) [31] | not stated | ||||
| 4 | Hosseini B. (2010) [33] | 170 | ||||
| 5 | Kossioris G. T. (2008) [34] | 1 | ||||
| 6 | Lu J.-T. (2019) [30] | 57 | ||||
| 7 | Mohhamadi S. (2019) [23] | 1448 | 357 | 11 | 1080 | 5 |
| 8 | Schei T. R. (2003) [35] | 1 | no information | |||
Publisher’s Note: MDPI stays neutral with regard to jurisdictional claims in published maps and institutional affiliations. |
© 2022 by the authors. Licensee MDPI, Basel, Switzerland. This article is an open access article distributed under the terms and conditions of the Creative Commons Attribution (CC BY) license (https://creativecommons.org/licenses/by/4.0/).
Share and Cite
Kodenko, M.R.; Vasilev, Y.A.; Vladzymyrskyy, A.V.; Omelyanskaya, O.V.; Leonov, D.V.; Blokhin, I.A.; Novik, V.P.; Kulberg, N.S.; Samorodov, A.V.; Mokienko, O.A.; et al. Diagnostic Accuracy of AI for Opportunistic Screening of Abdominal Aortic Aneurysm in CT: A Systematic Review and Narrative Synthesis. Diagnostics 2022, 12, 3197. https://0-doi-org.brum.beds.ac.uk/10.3390/diagnostics12123197
Kodenko MR, Vasilev YA, Vladzymyrskyy AV, Omelyanskaya OV, Leonov DV, Blokhin IA, Novik VP, Kulberg NS, Samorodov AV, Mokienko OA, et al. Diagnostic Accuracy of AI for Opportunistic Screening of Abdominal Aortic Aneurysm in CT: A Systematic Review and Narrative Synthesis. Diagnostics. 2022; 12(12):3197. https://0-doi-org.brum.beds.ac.uk/10.3390/diagnostics12123197
Chicago/Turabian StyleKodenko, Maria R., Yuriy A. Vasilev, Anton V. Vladzymyrskyy, Olga V. Omelyanskaya, Denis V. Leonov, Ivan A. Blokhin, Vladimir P. Novik, Nicholas S. Kulberg, Andrey V. Samorodov, Olesya A. Mokienko, and et al. 2022. "Diagnostic Accuracy of AI for Opportunistic Screening of Abdominal Aortic Aneurysm in CT: A Systematic Review and Narrative Synthesis" Diagnostics 12, no. 12: 3197. https://0-doi-org.brum.beds.ac.uk/10.3390/diagnostics12123197