
Mobile-HR: An Ophthalmologic-Based Classification System for Diagnosis of Hypertensive Retinopathy Using Optimized MobileNet Architecture

 ,
, 
 , , , ,
Abstract
:1. Introduction
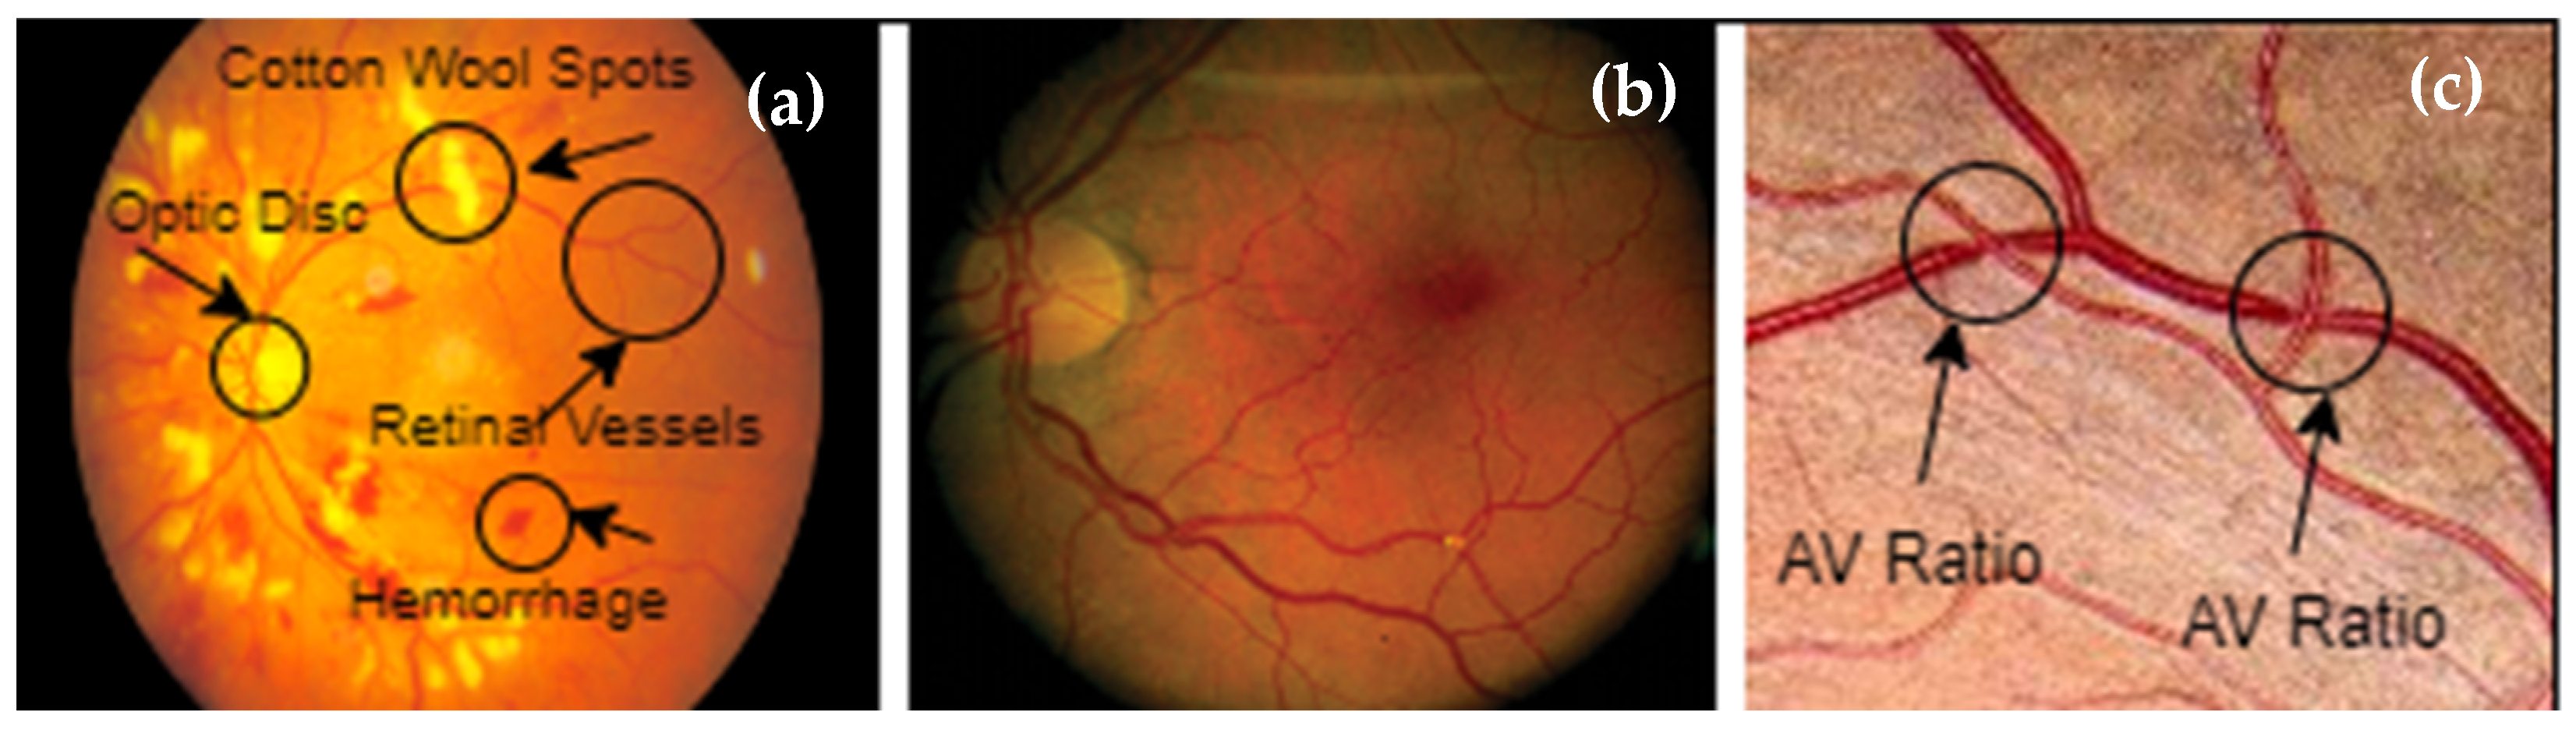
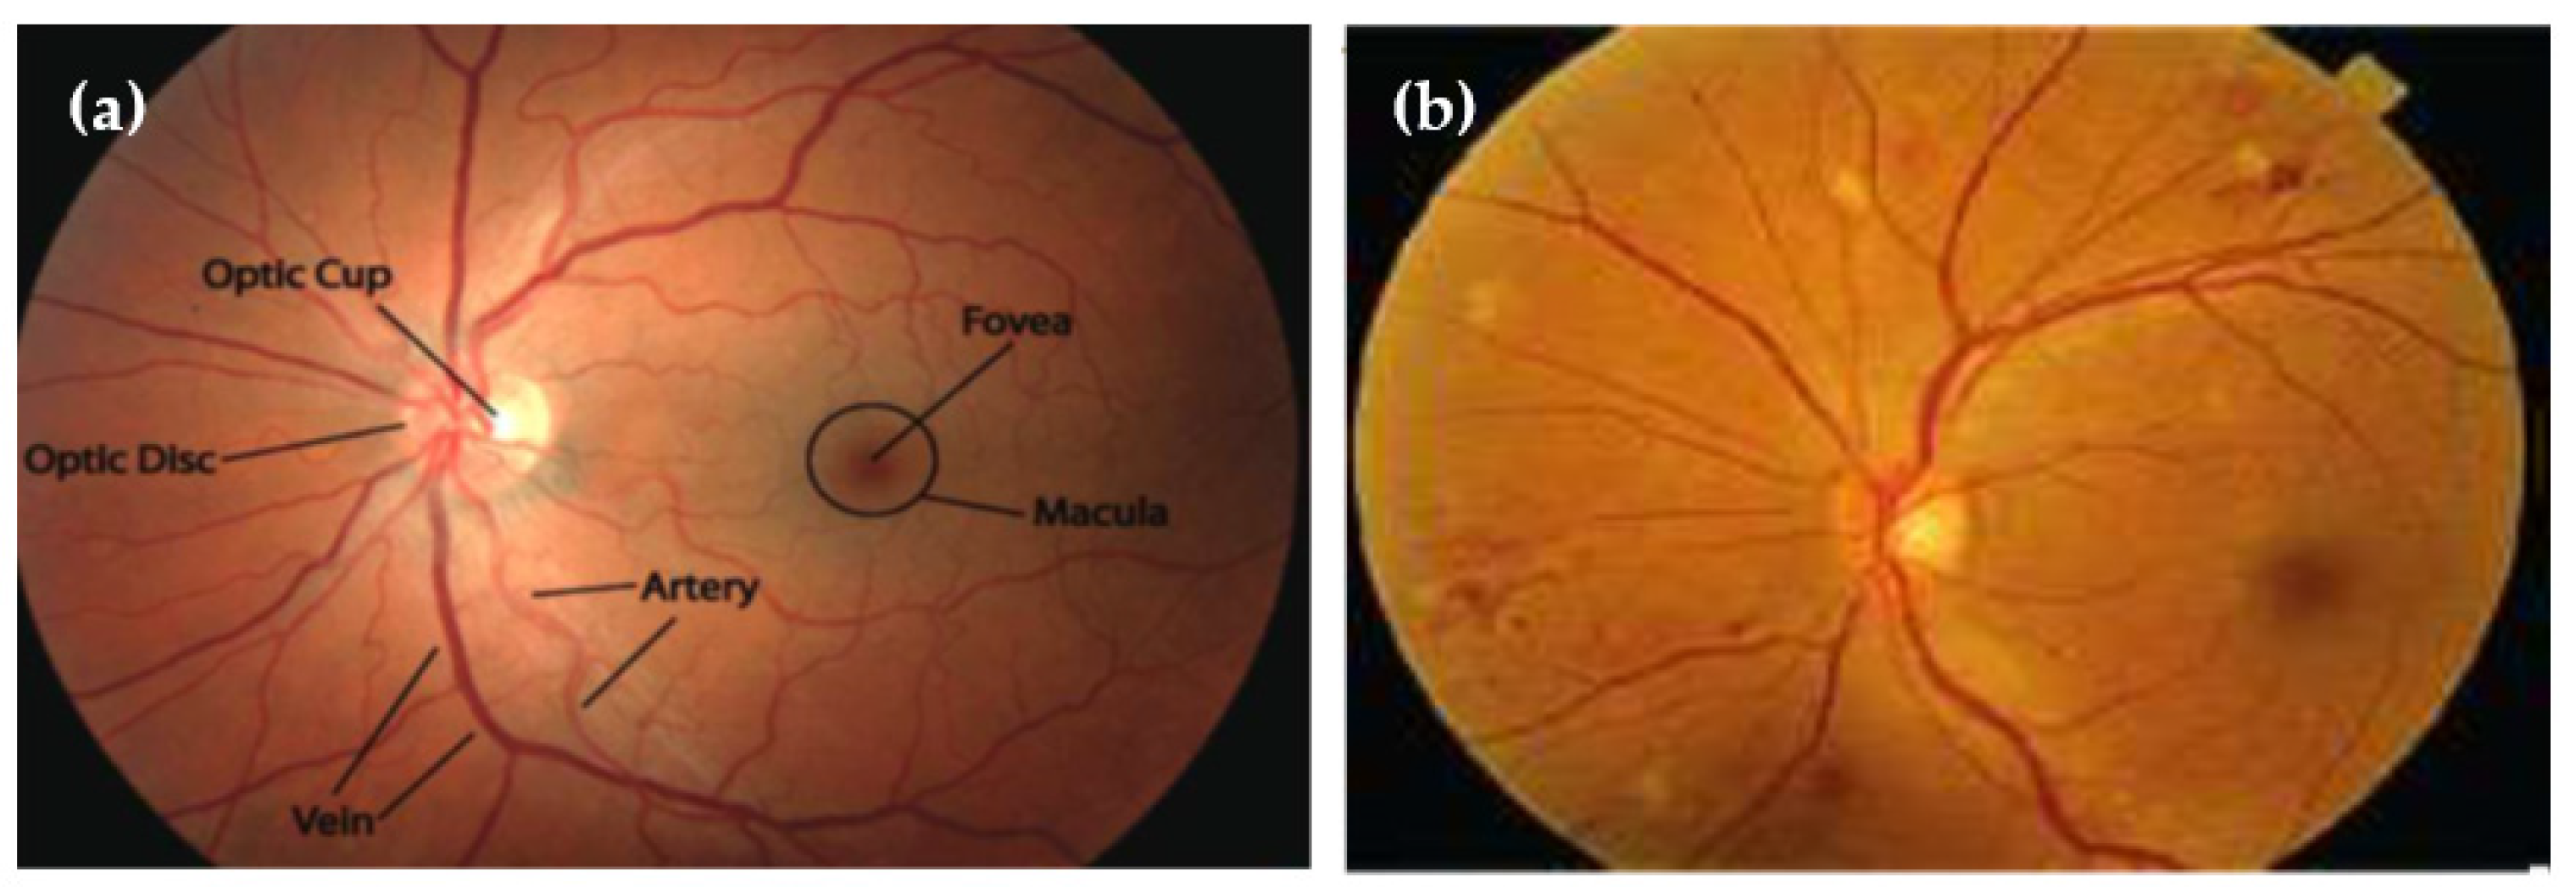
1.1. Clinical Implications of Hypertensive Retinopathy
- (1)
- Grade 1: mild widespread constriction of the retinal arteries.
- (2)
- Grade 2: arteriovenous pinching and definite focal constriction.
- (3)
- Grade 3: retinal hemorrhages, exudates, and cotton wool patches, in addition to grade 2 retinopathy symptoms.
- (4)
- Grade 4: severe retinopathy of grade 3 with papilledema.
1.2. Background
1.3. Major Contribution
- In this study, the authors gathered a huge dataset from Pakistani hospitals (named PAK-HR) and internet sources. With the help of the 9170 photos in this dataset, the trained model was able to be very accurate.
- In this study, the MobileNet architecture was made by putting together dense blocks to make the Mobile-HR system’s multilayer architecture. The complex architecture of the Mobile-HR model was changed to find HR-related eye disorders by adding dense blocks.
- The method used in this work to classify HR is based on deep characteristics and a color space that is geared toward how people see things. As far as we know, this is the first time anyone has tried to make an automated system for identifying HR diseases that works better than other methods described in the literature.
- Before it is used, Mobile-HR is trained with a huge number of HR retina images. This makes the model more generalized compared to state-of-the-art approaches.
- Mobile-HR has a very high level of accuracy (99%), which is higher than any other method that has been suggested in the literature.
1.4. Paper Organization
2. Related Work
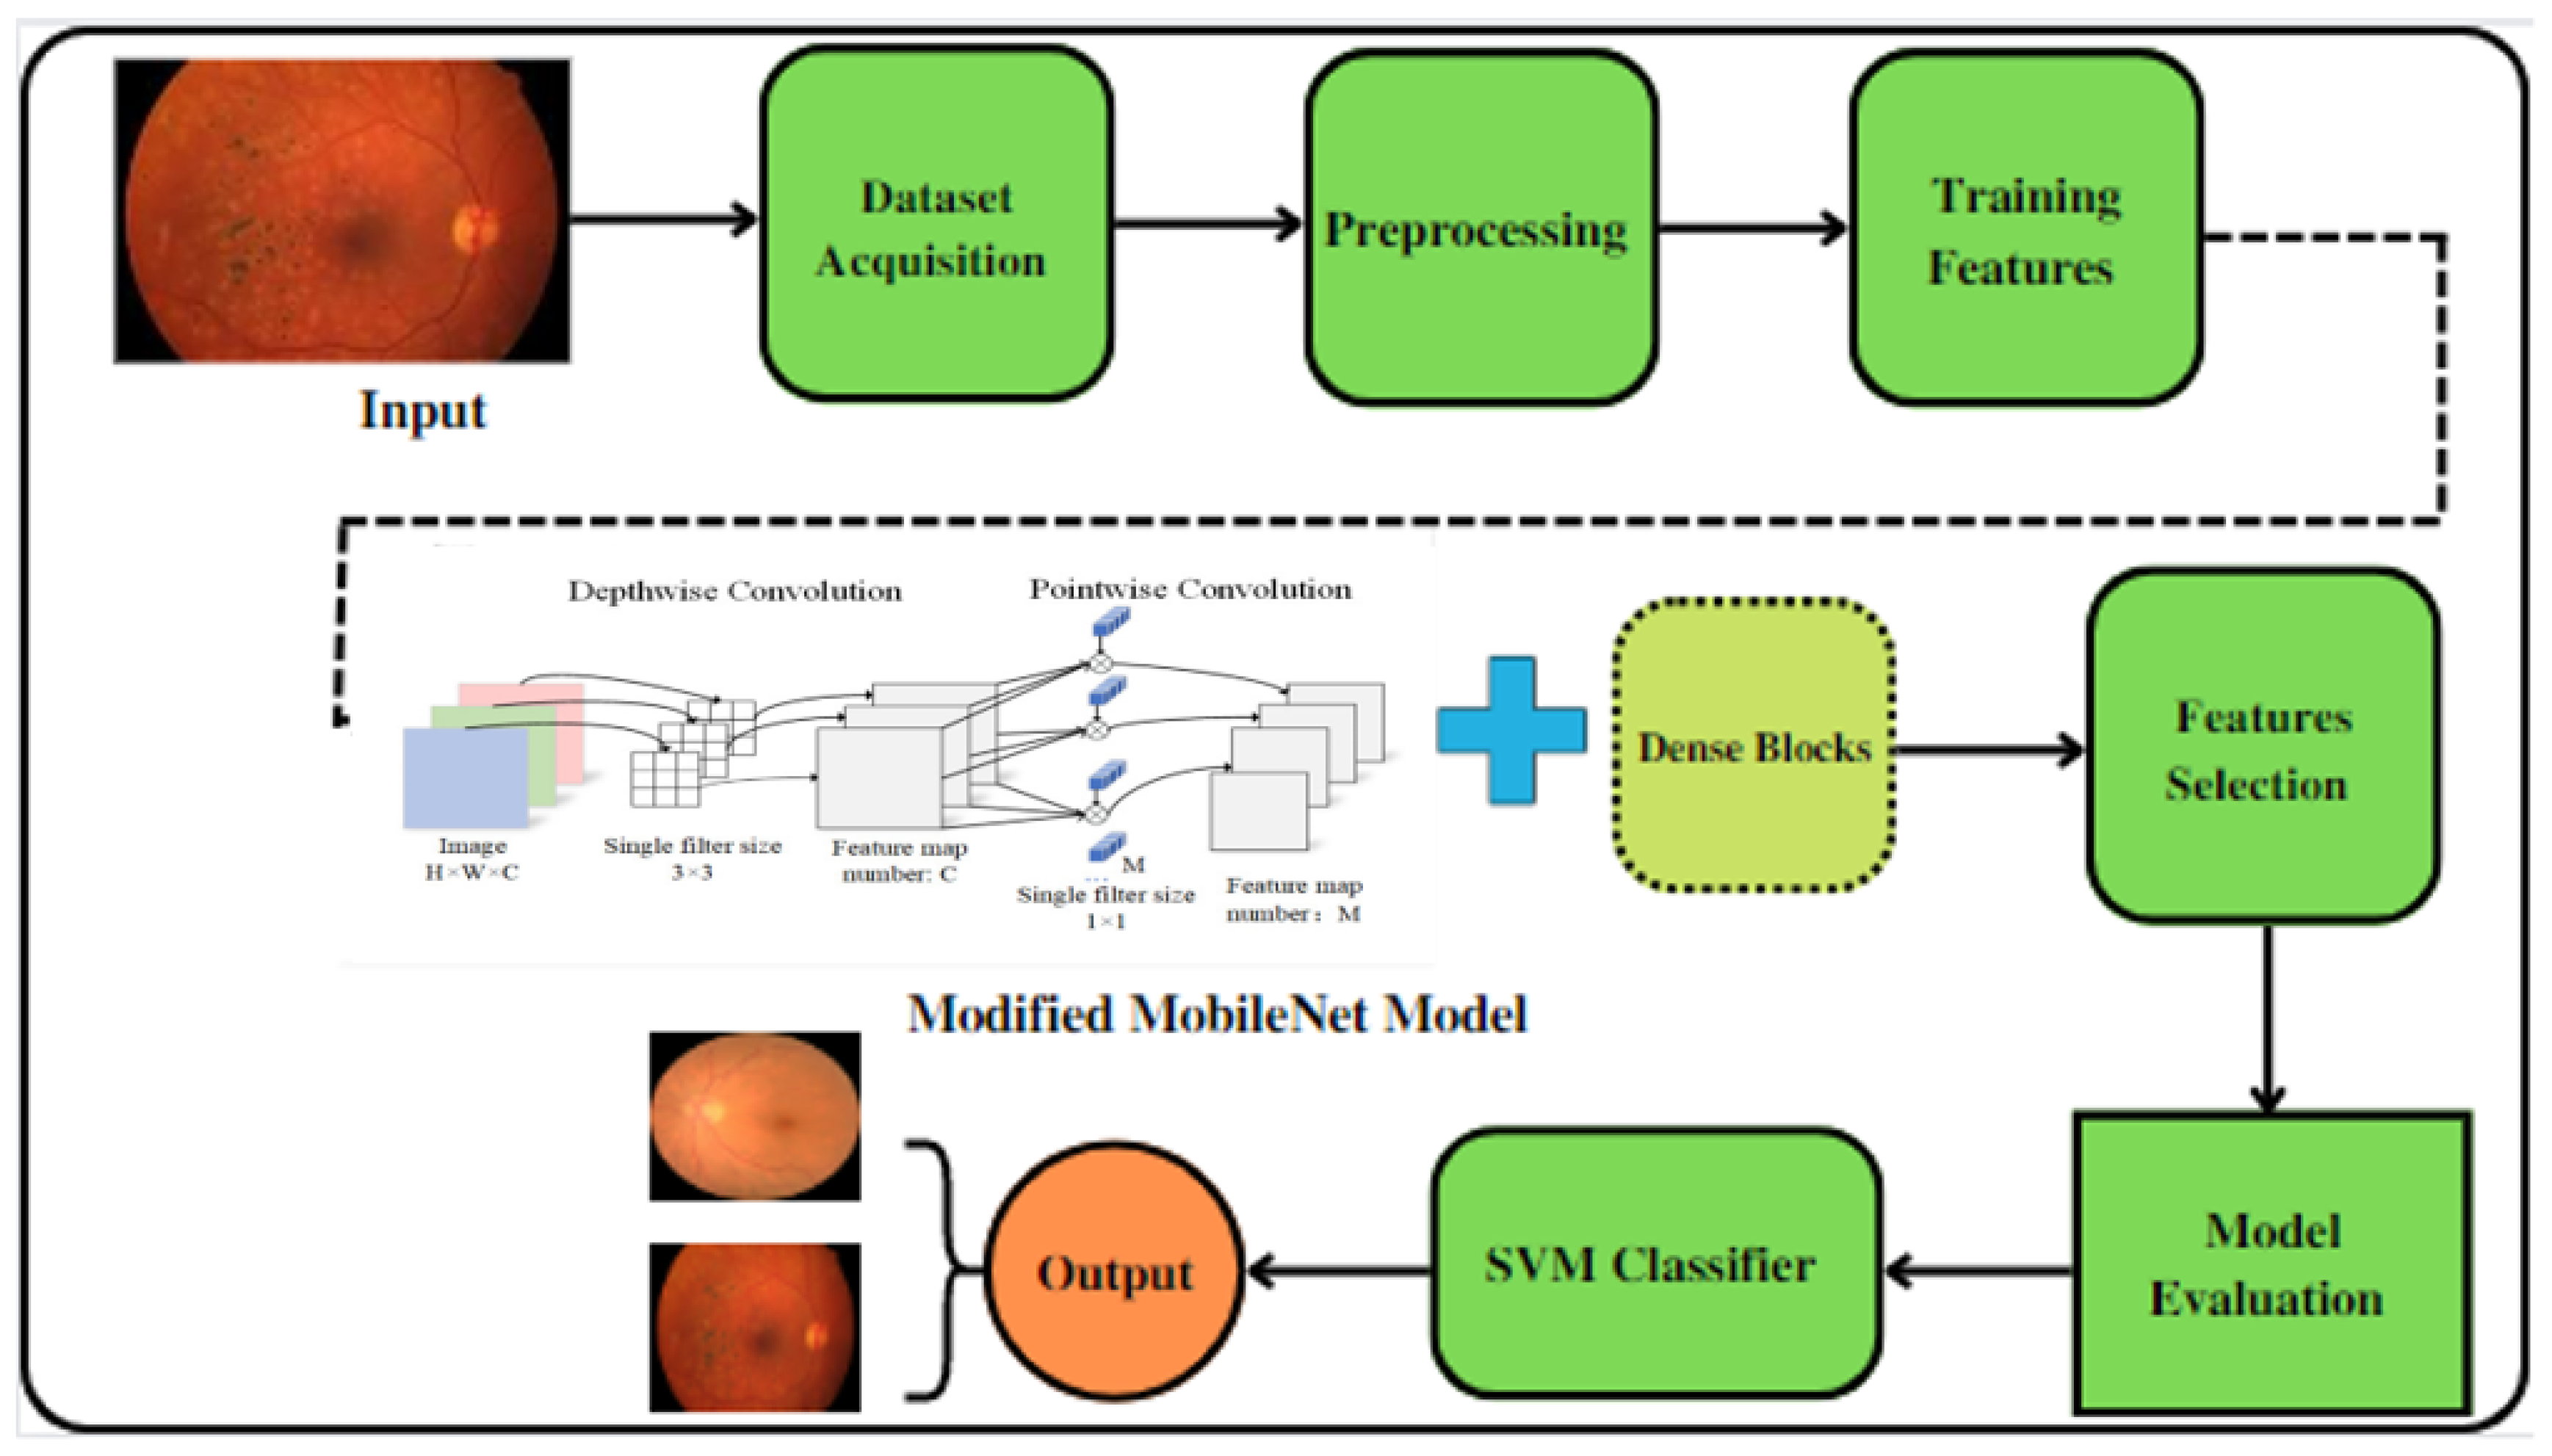
3. Materials and Methods
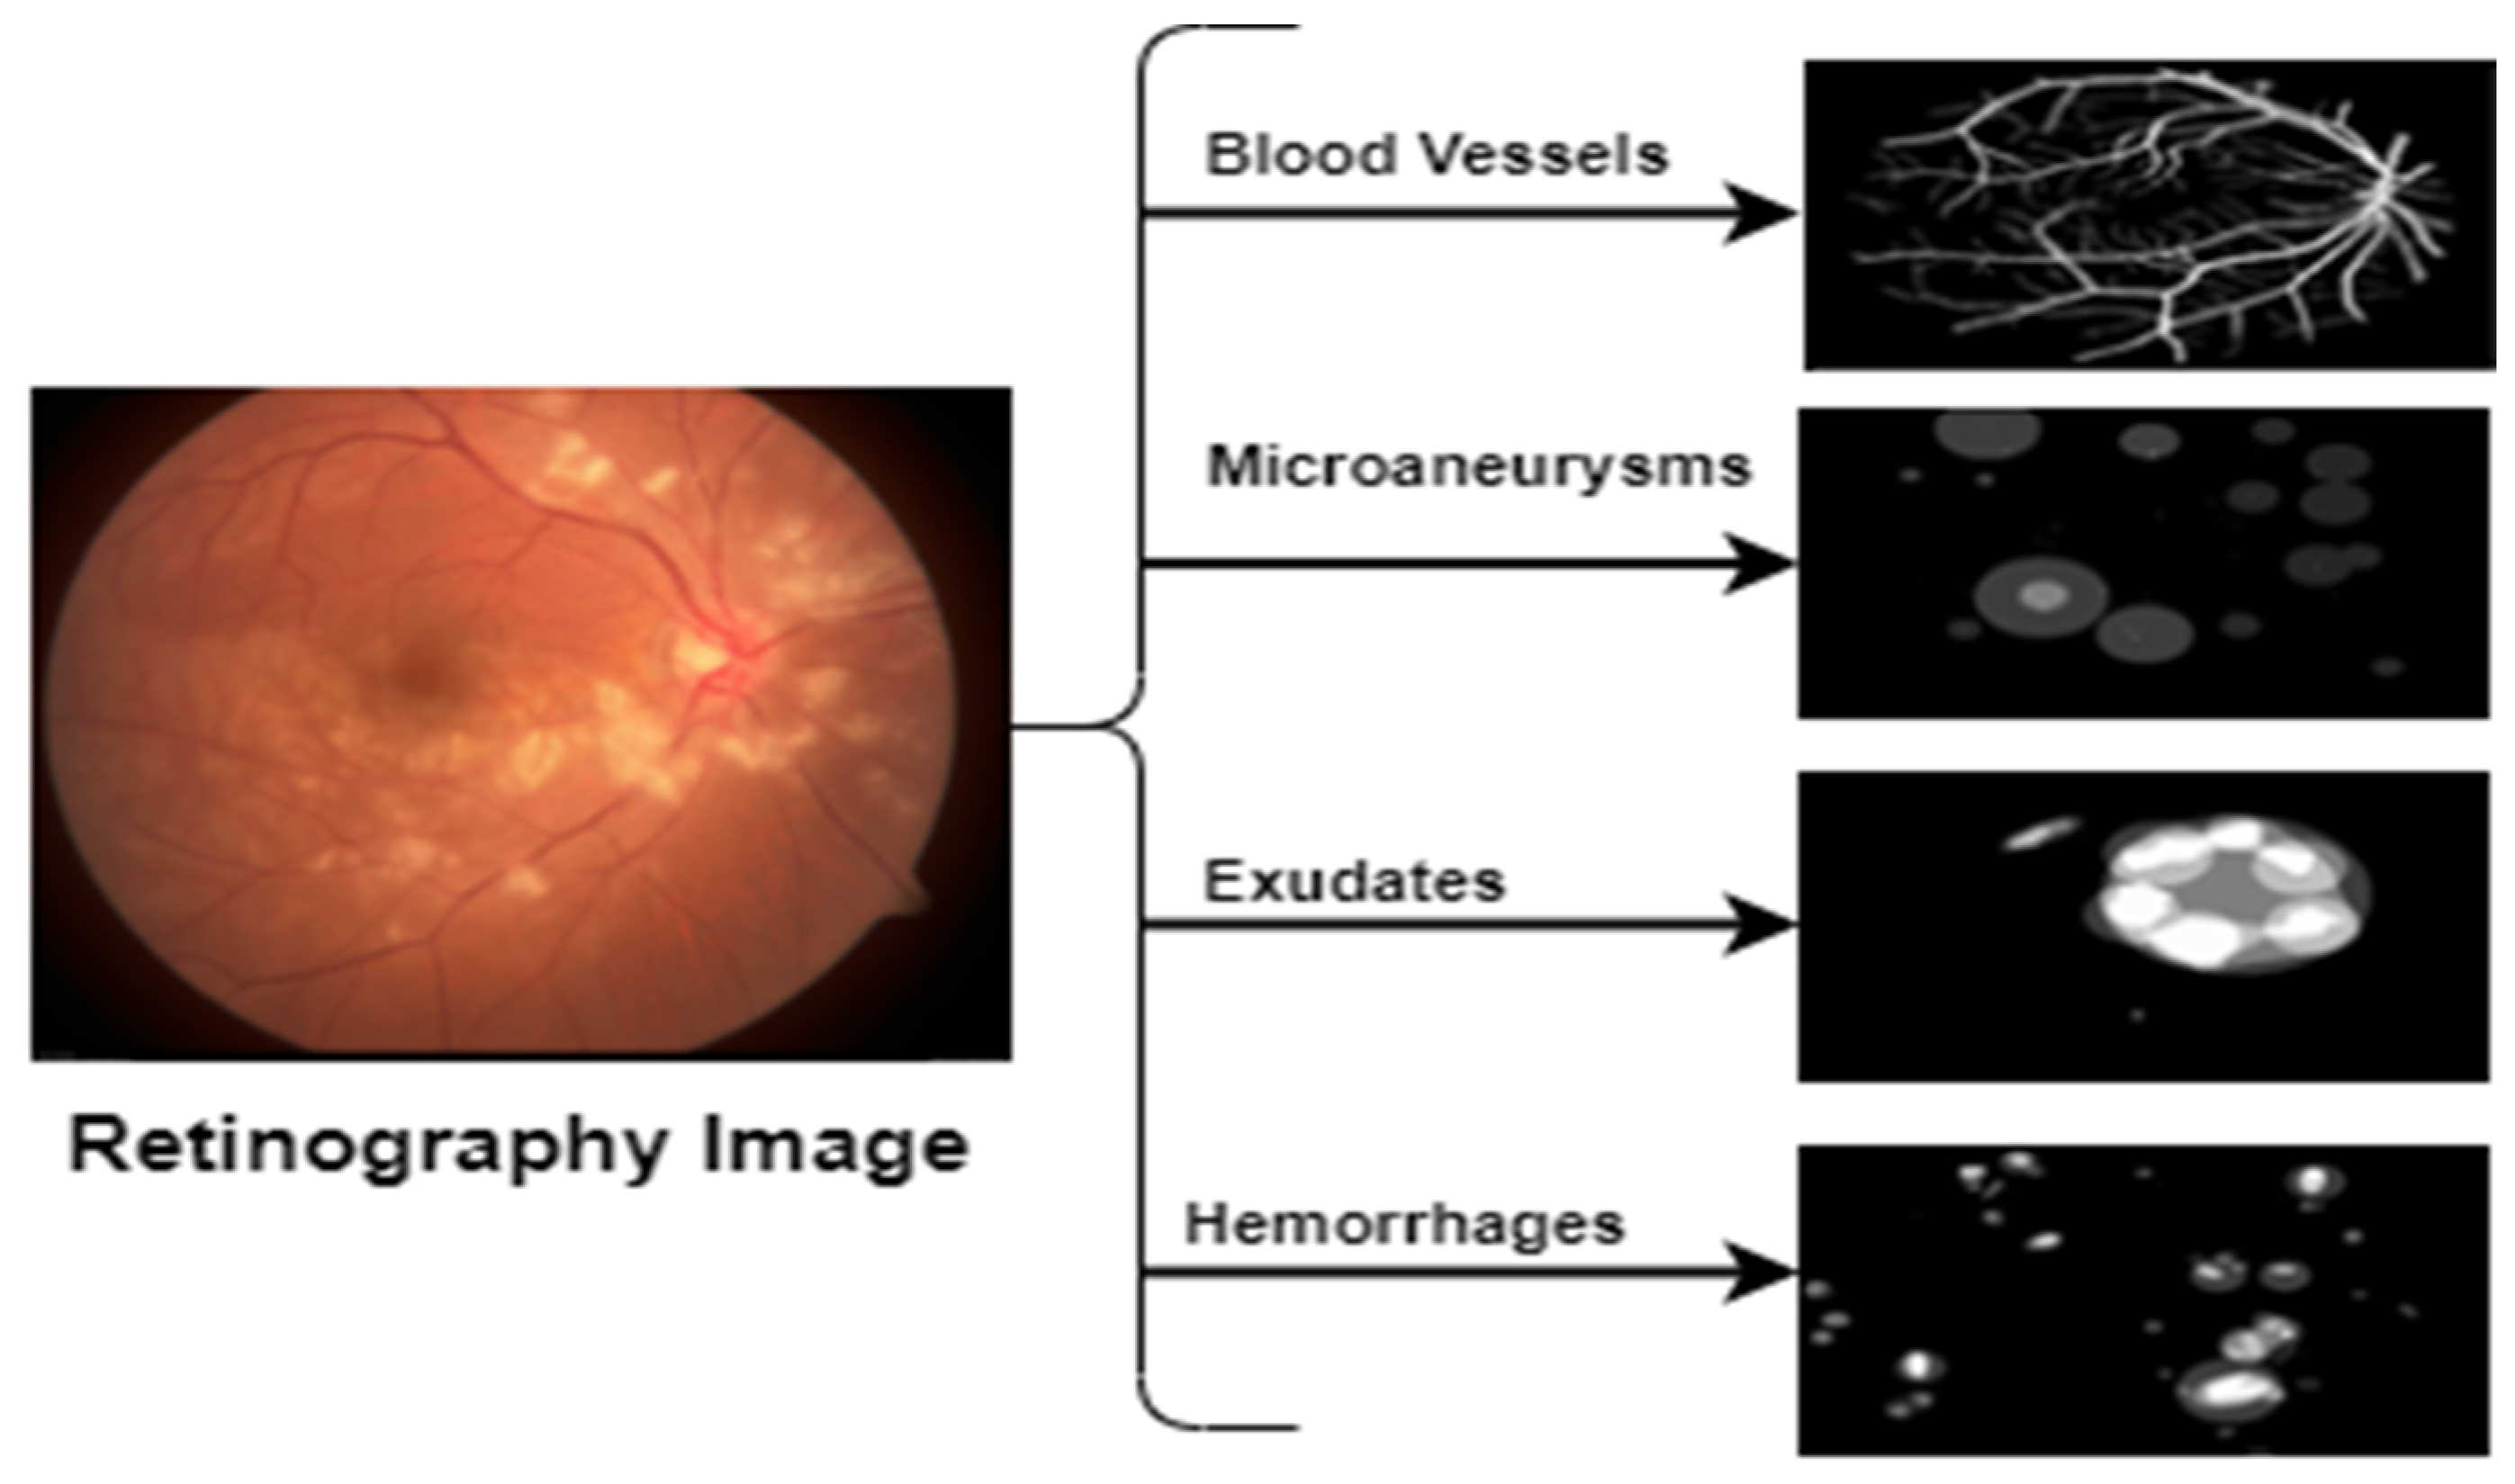
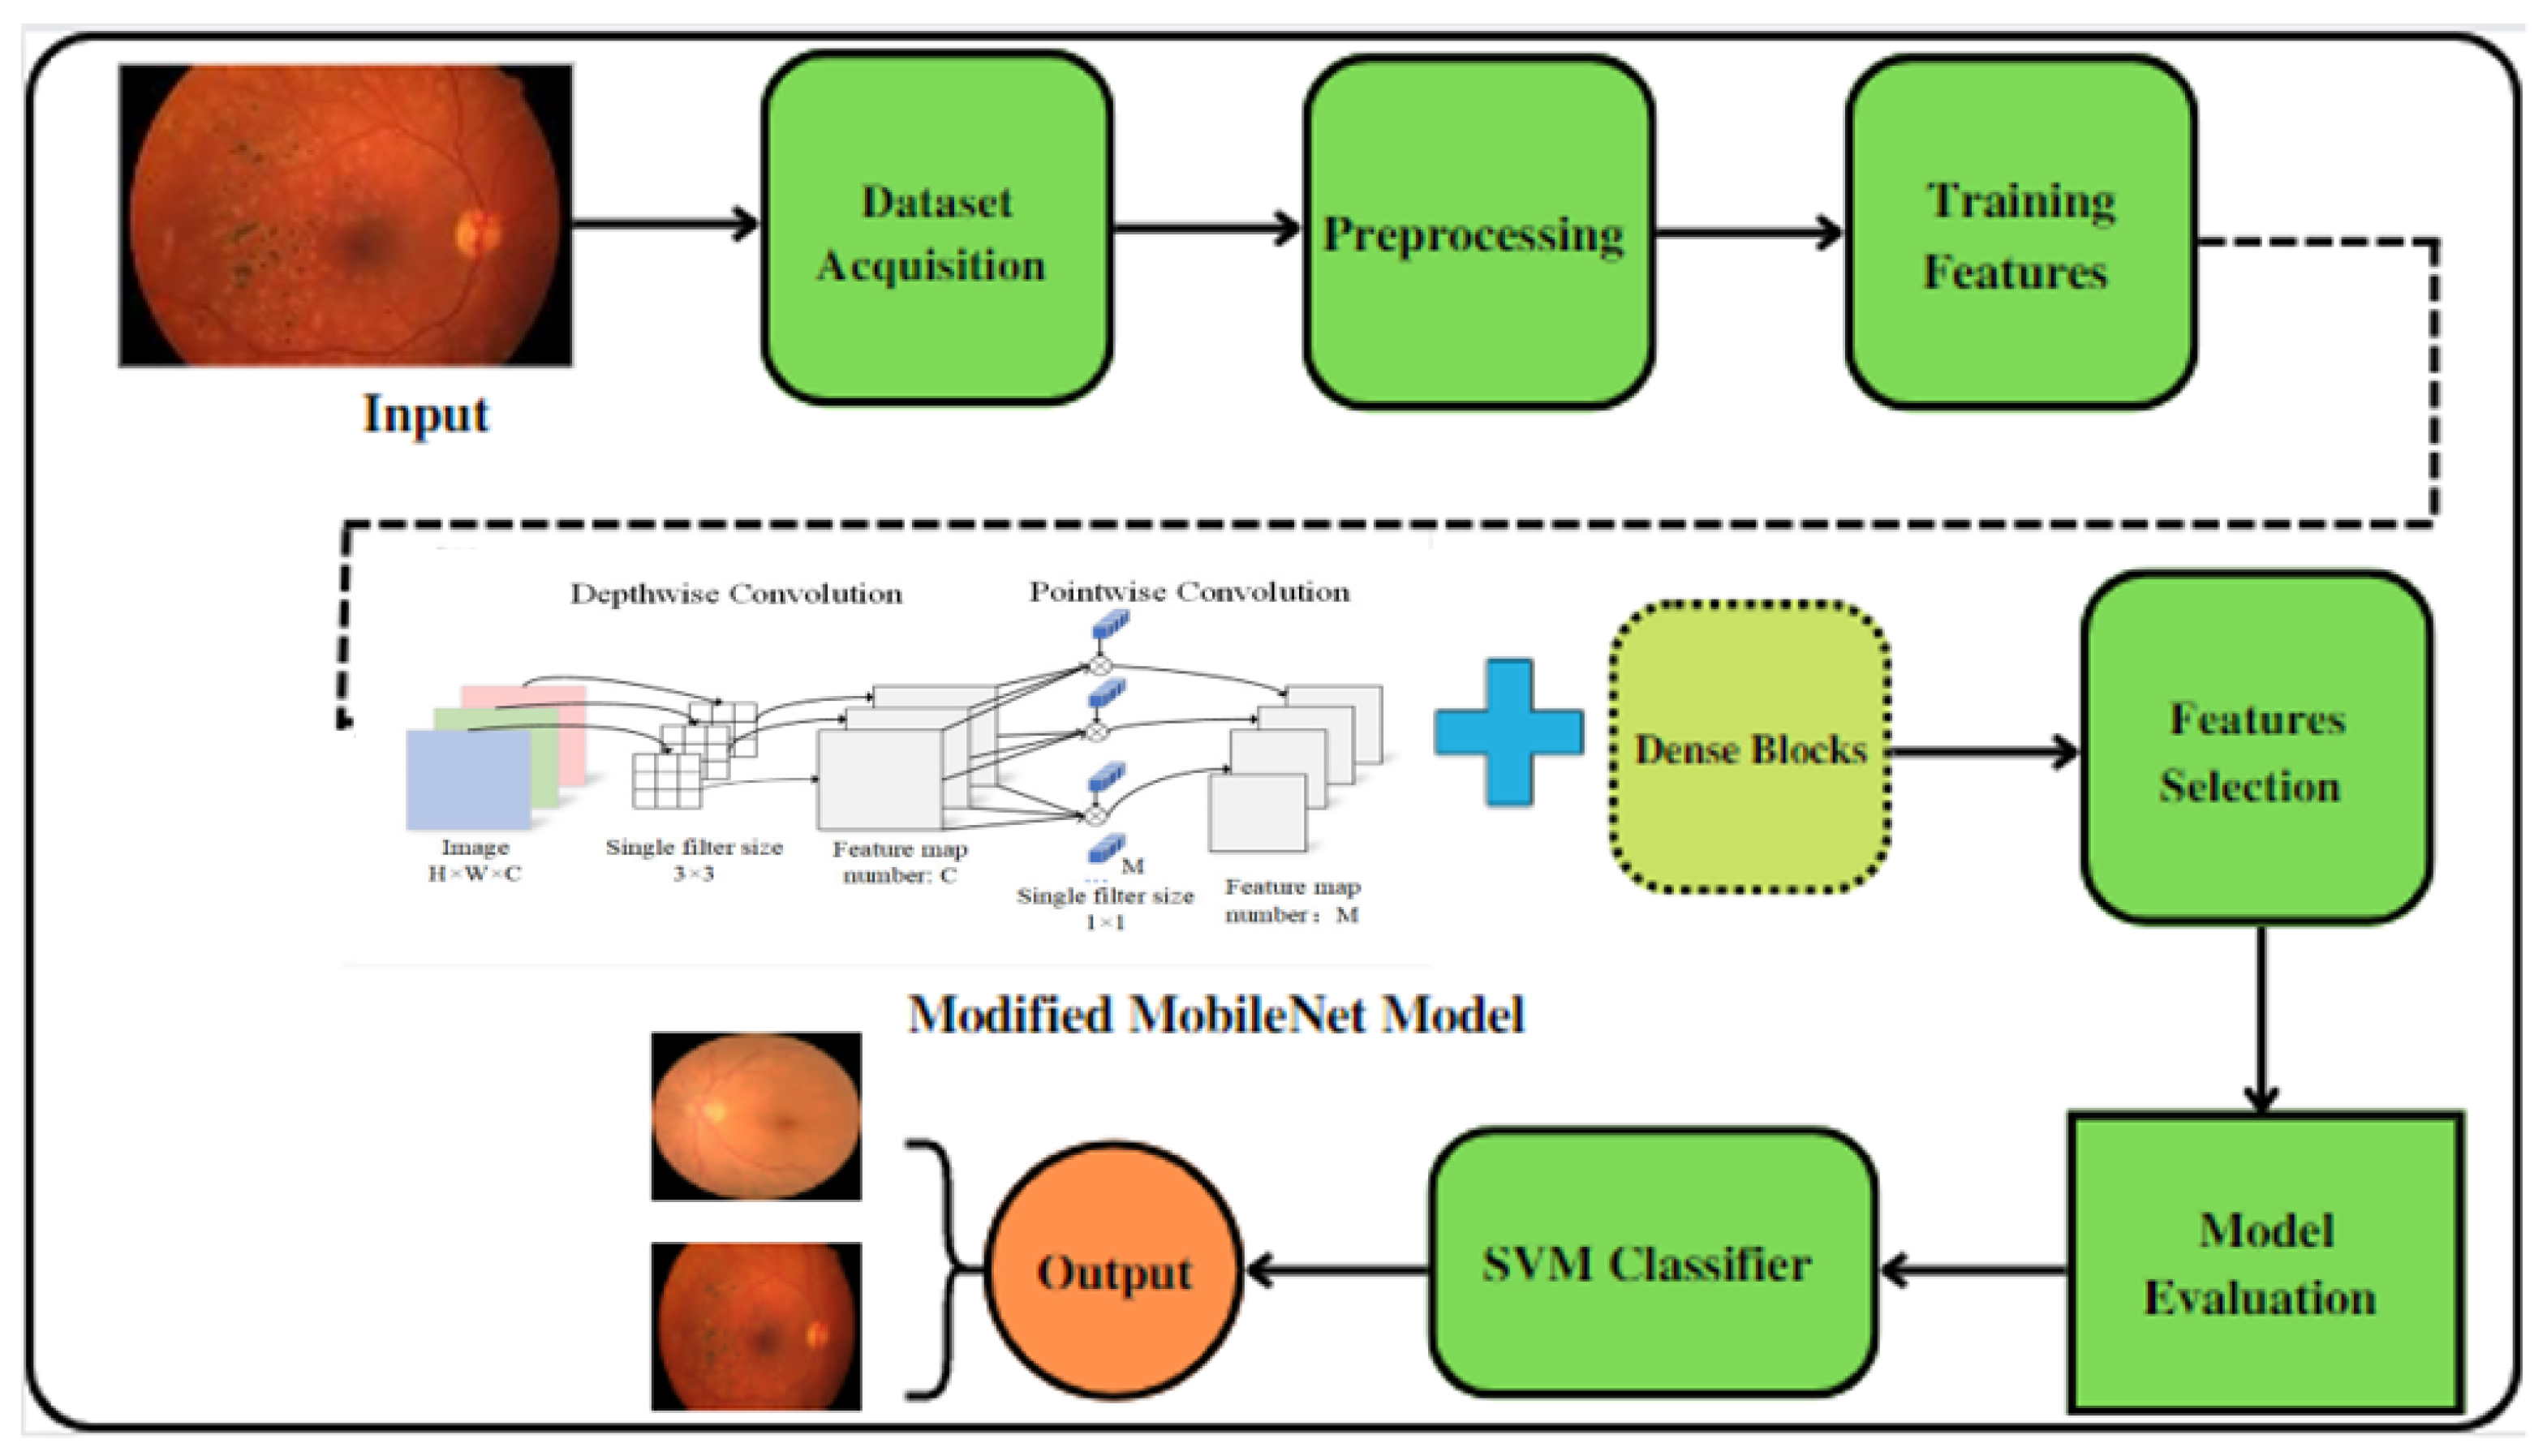
3.1. Data Acquisition
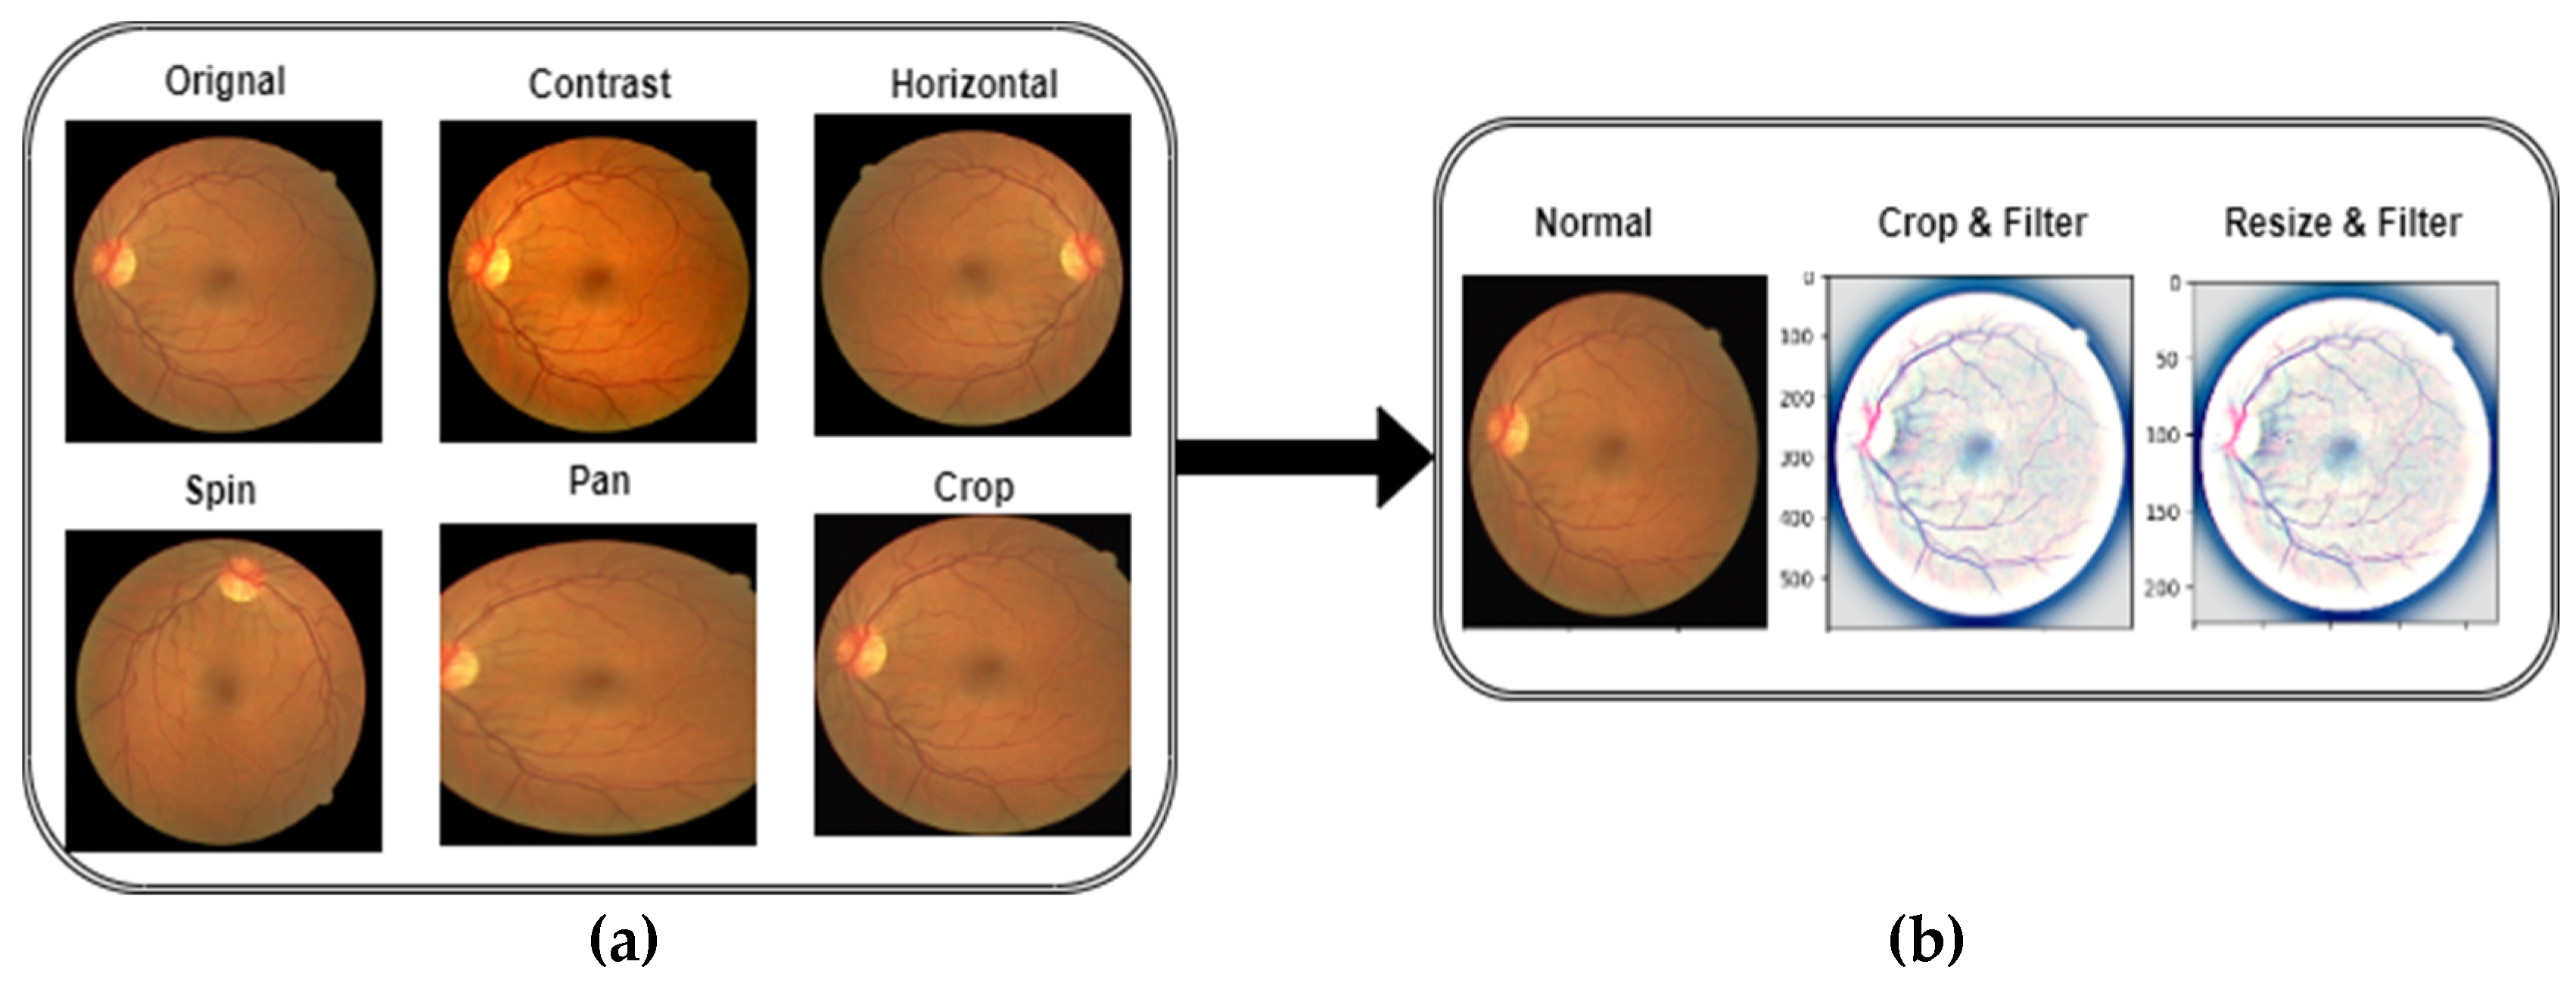
3.2. Preprocessing and Augmentation
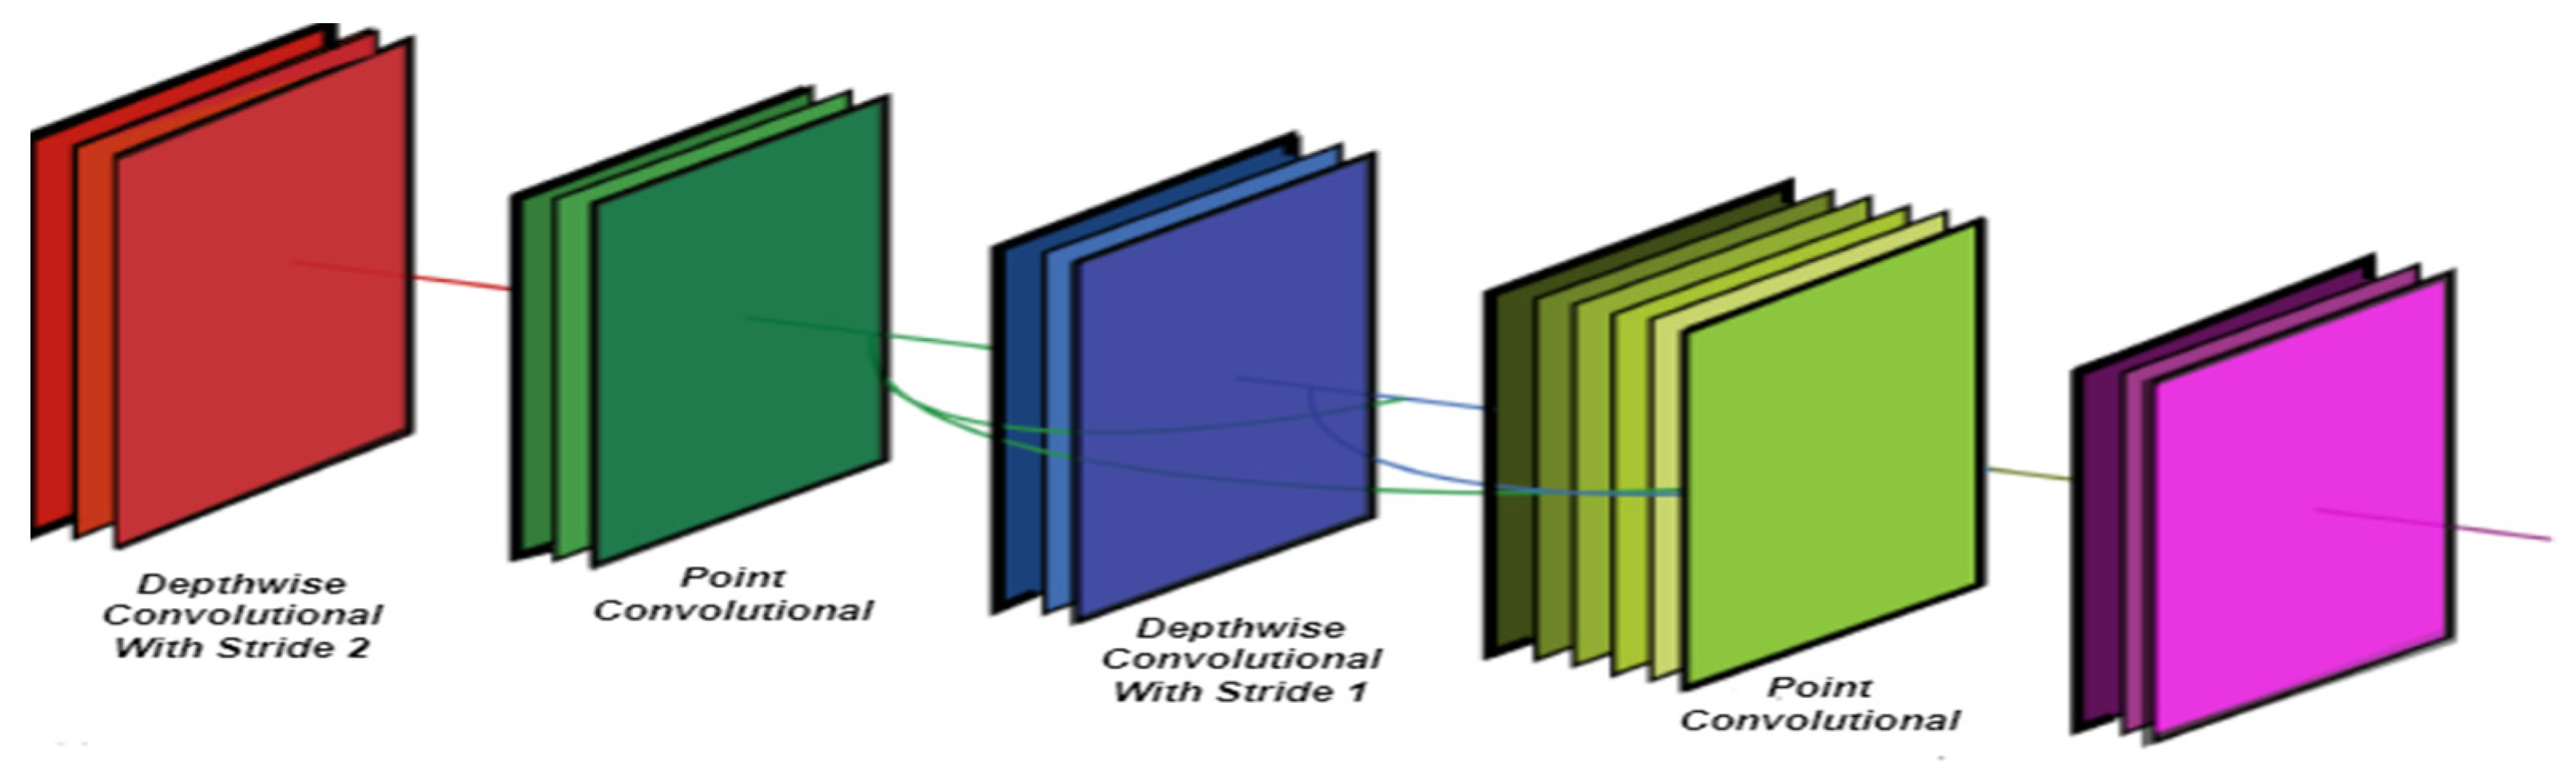
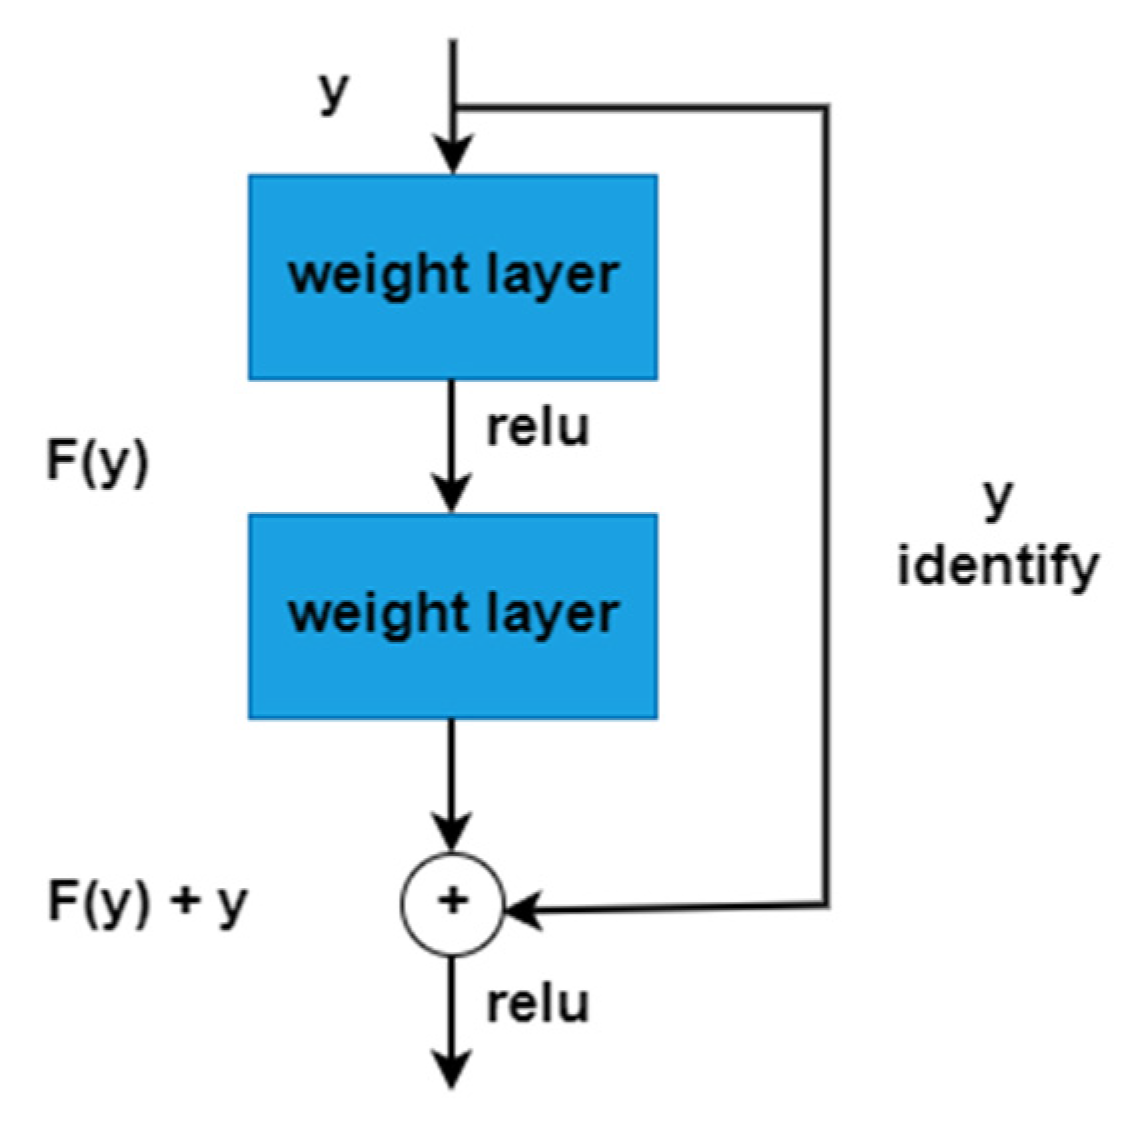
3.3. Mobile Net and Dense Block
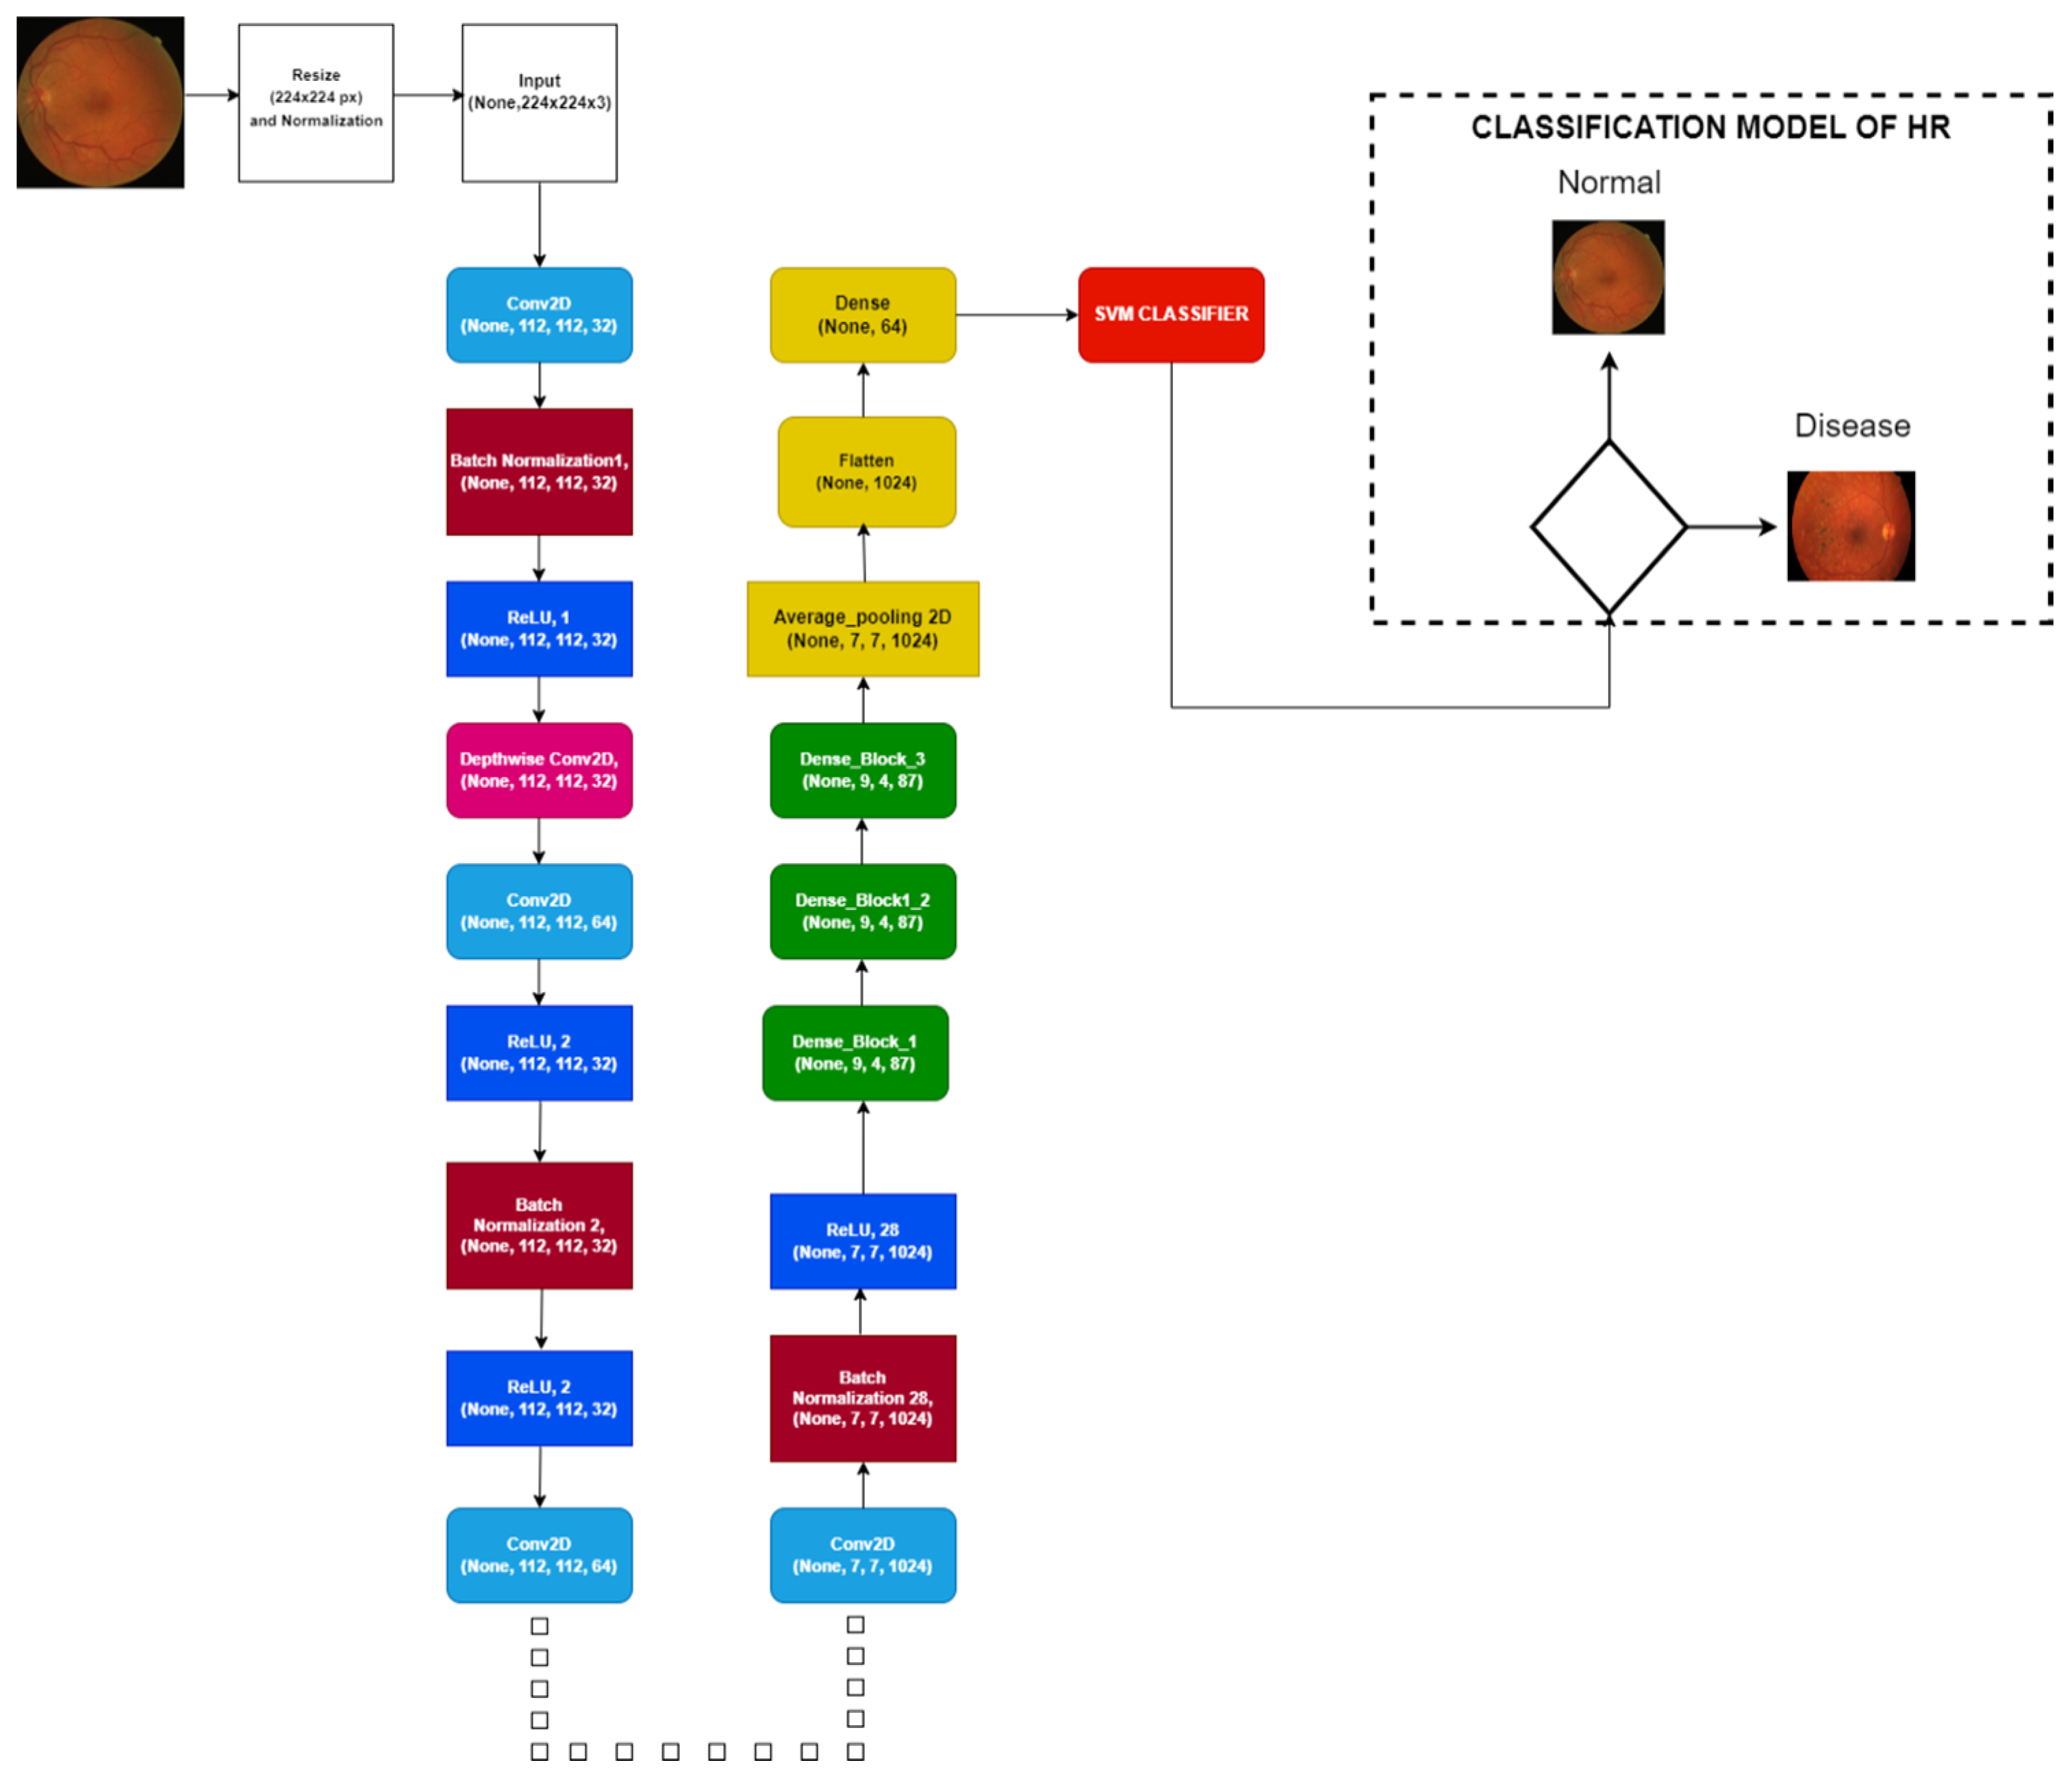
3.4. Mobile-HR Architecture
| Algorithm 1: Implementation of the proposed Mobile-HR model for feature map extraction | |
| Output | Feature map extraction y = (y1, y2 …, yn) |
| Step 1 | Input normalization of raw data |
| Step 2 | Function definition |
| Step 3 | Kernel sizes and array Y, which comprise several filters, are the inputs to the conv-batch norm a. Y = Conv (Y) and b. Y = BN (Y) are then applied |
| Step 4 | Depthwise Conv2D was used rather than Conv2D |
| Step 5 | Establishing the network a. 14 Convolution layers, each comprising 32,64128,256512,1024 filters, make up the first step of the procedure. After each of them, the ReLU is subsequently activated. b. The next step is to use Add to use skip connection c. Three distinct skip connections are utilized. Each skip connection has three depthwise convolution layers after the Maxpool layer. The skip connection has two strides and a conversion ratio of 1 to 1. |
| Step 6 | After, the flattened layer is used, the feature map and Y = (y1, y2 …, yn) are created and flattened at the end [End Feature map extraction function] |
| Algorithm 2: SVM Classifier to Recognize hypertensive retinopathy of the extracted features | |
| Input | Extracted feature map x = (a1, a2,. →, an) with annotations a = 0,1. Test data A test |
| Output | Recognition of hypertensive retinopathy (HR) and normal retinographic samples |
| Step 1 | Primarily, the SVM classifier and Kernel Regularize L2 parameters are defined for optimization |
| Step 2 | Classification of normal and abnormal samples |
| Step 3 | Depthwise Conv2D was used rather than Conv2D |
| Step 4 | Building classifier based on SVM a. The training process of SVM is completed using extracted features t = (a1, a2,.., an) by our Algorithm 1. b. For the generation of the hyperplane, use Equation (6). |
| Step 6 | The class label is allocated for testing the samples with z-test using the decision function of the equation below: A test= (Weig, Aiv) + c |
4. Experimental Results
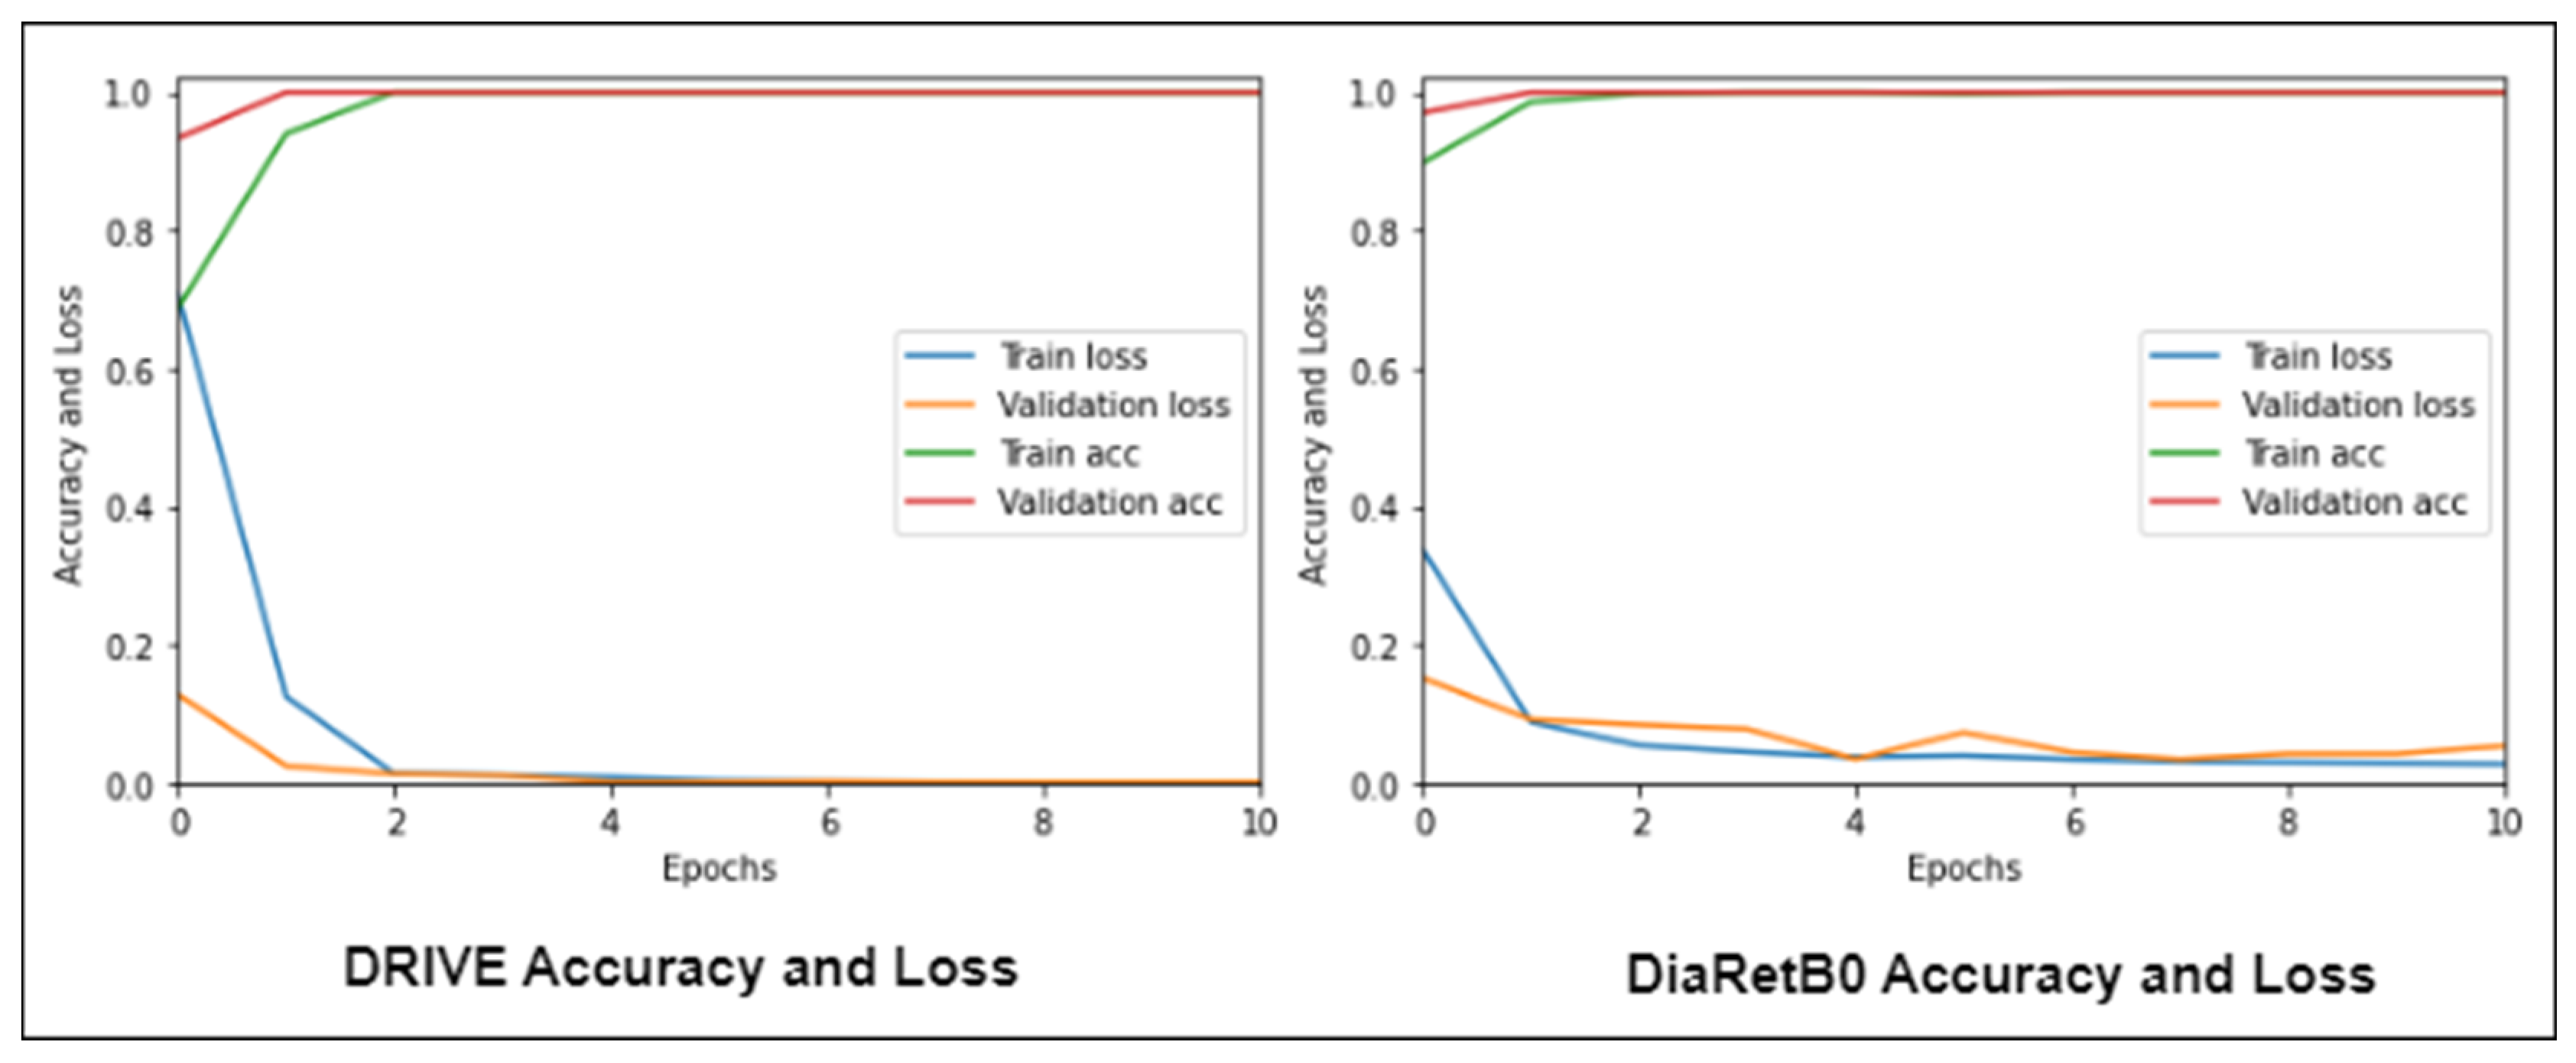
4.1. Experiment 1
4.2. Experiment 2
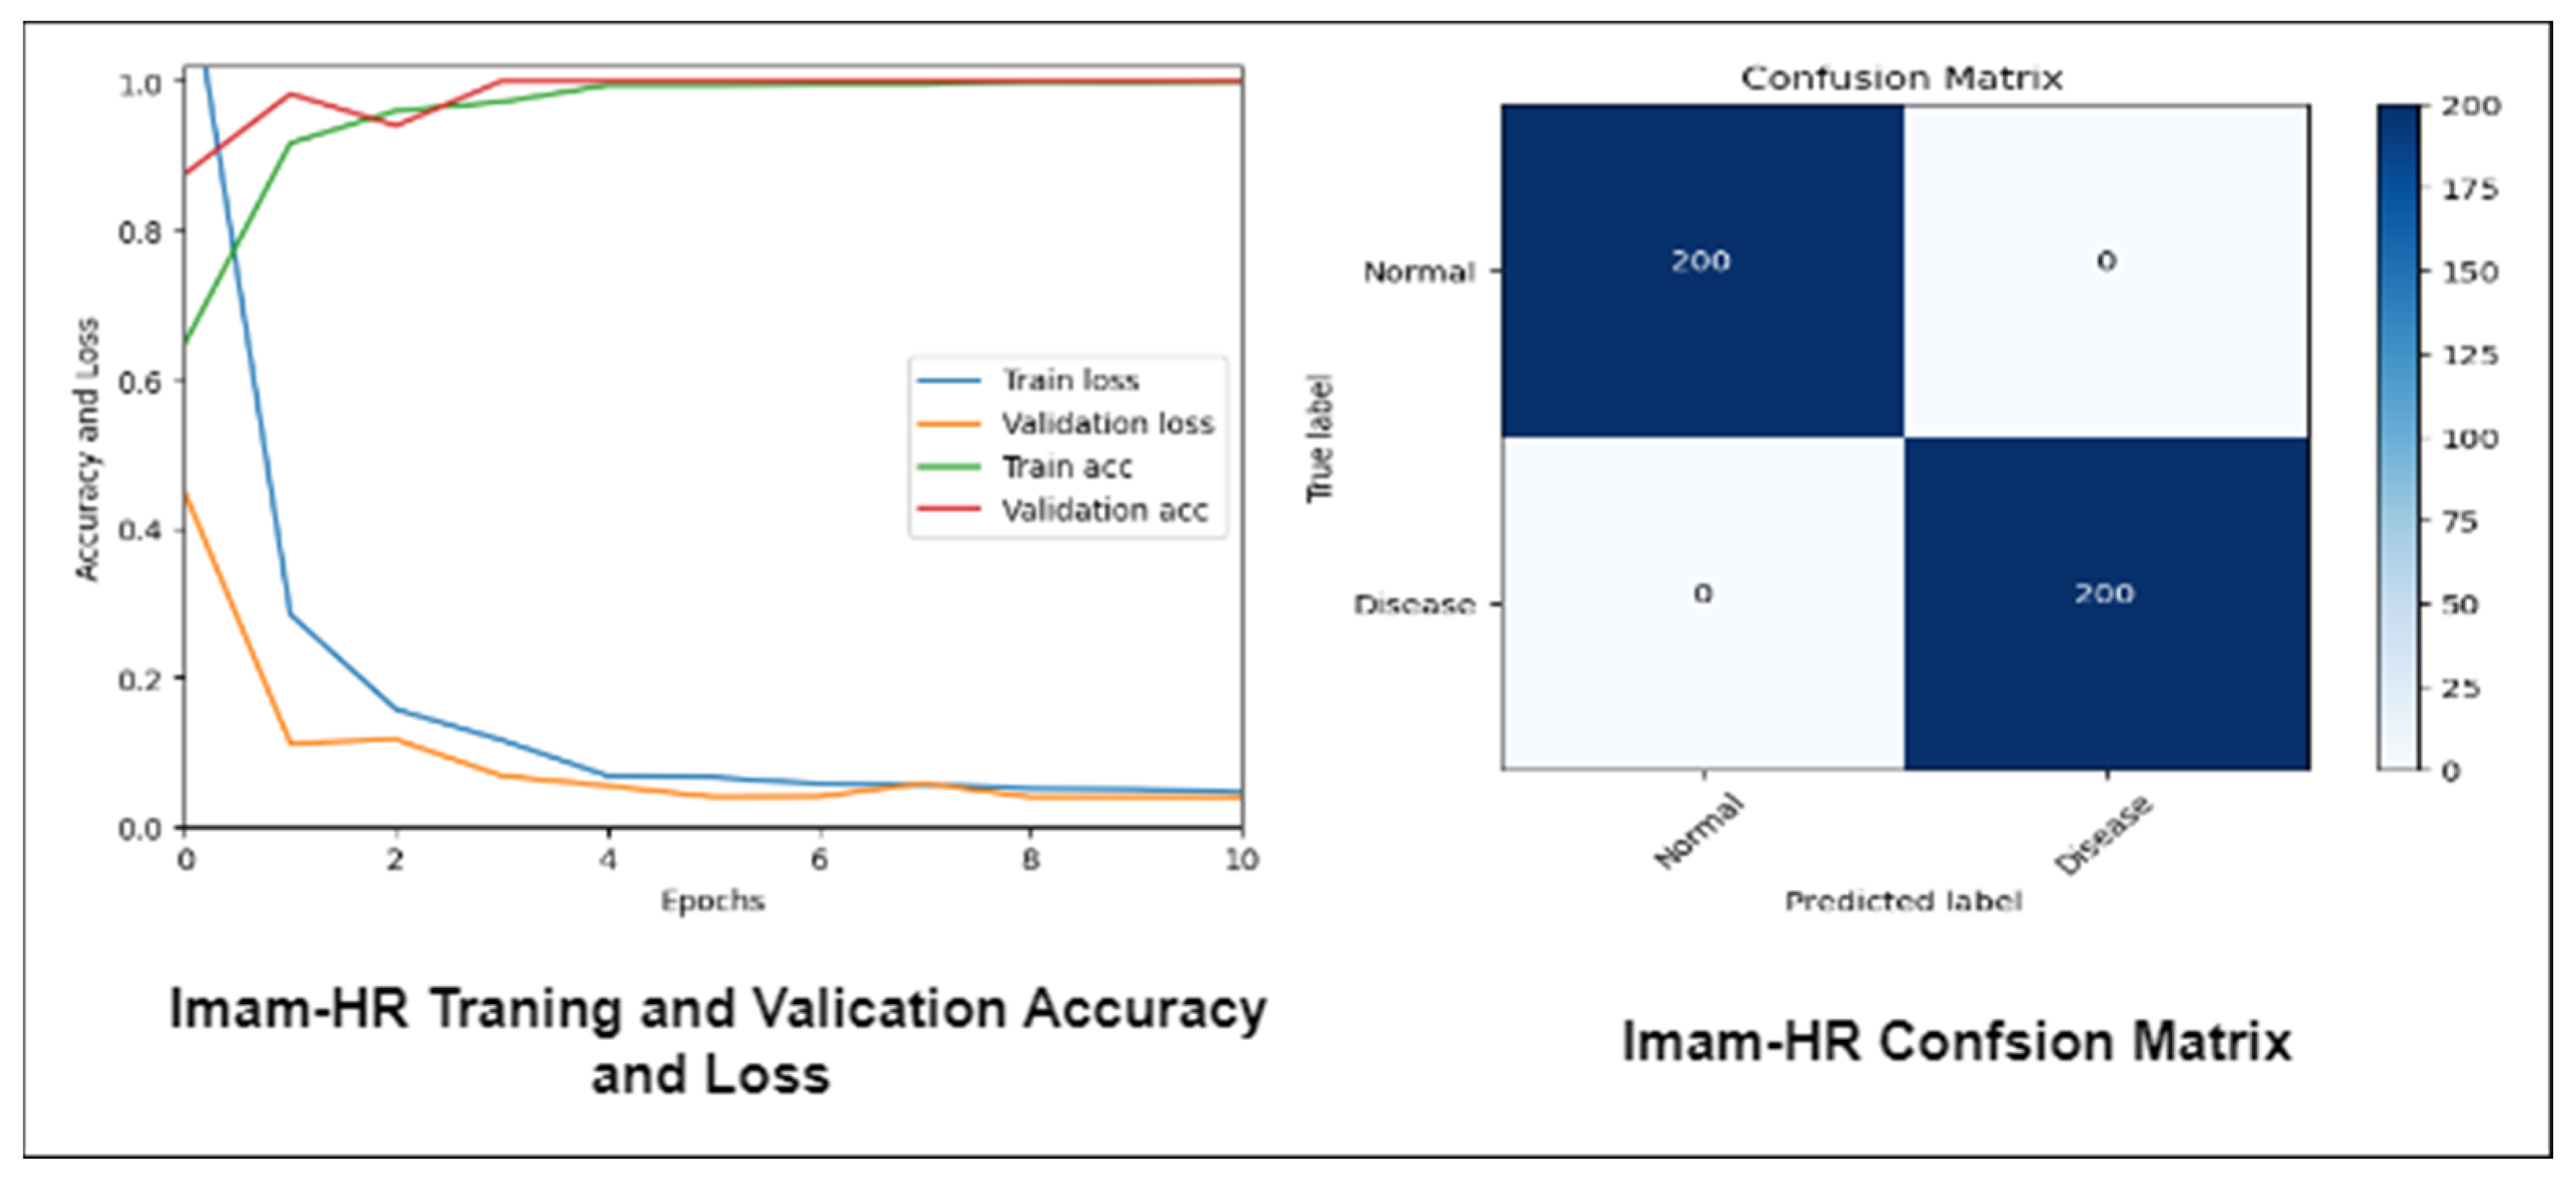
4.3. Experiment 3
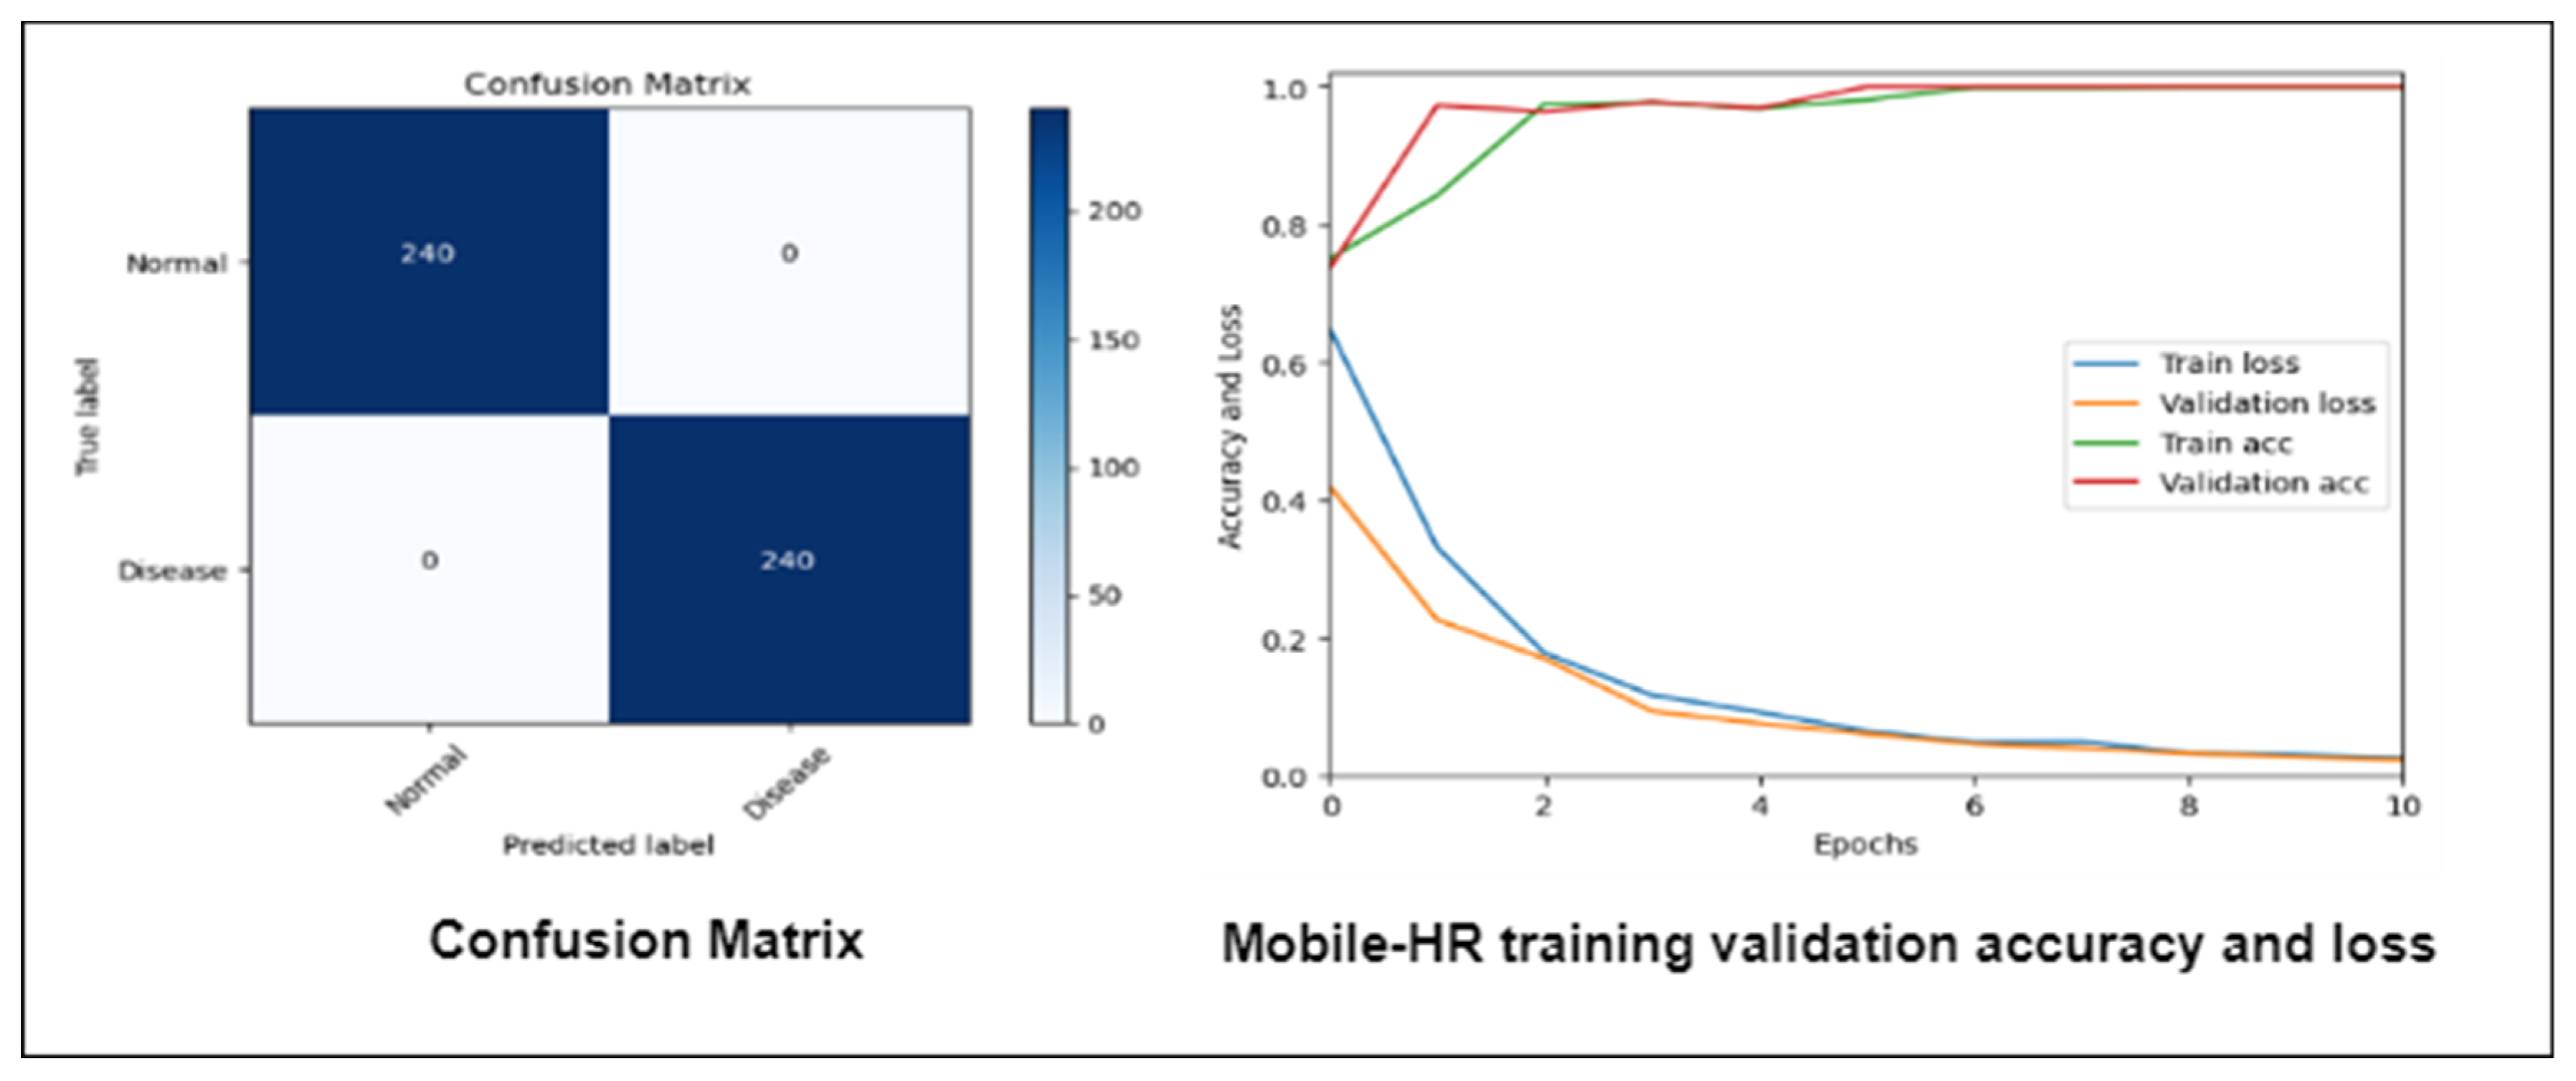
4.4. Experiment 4
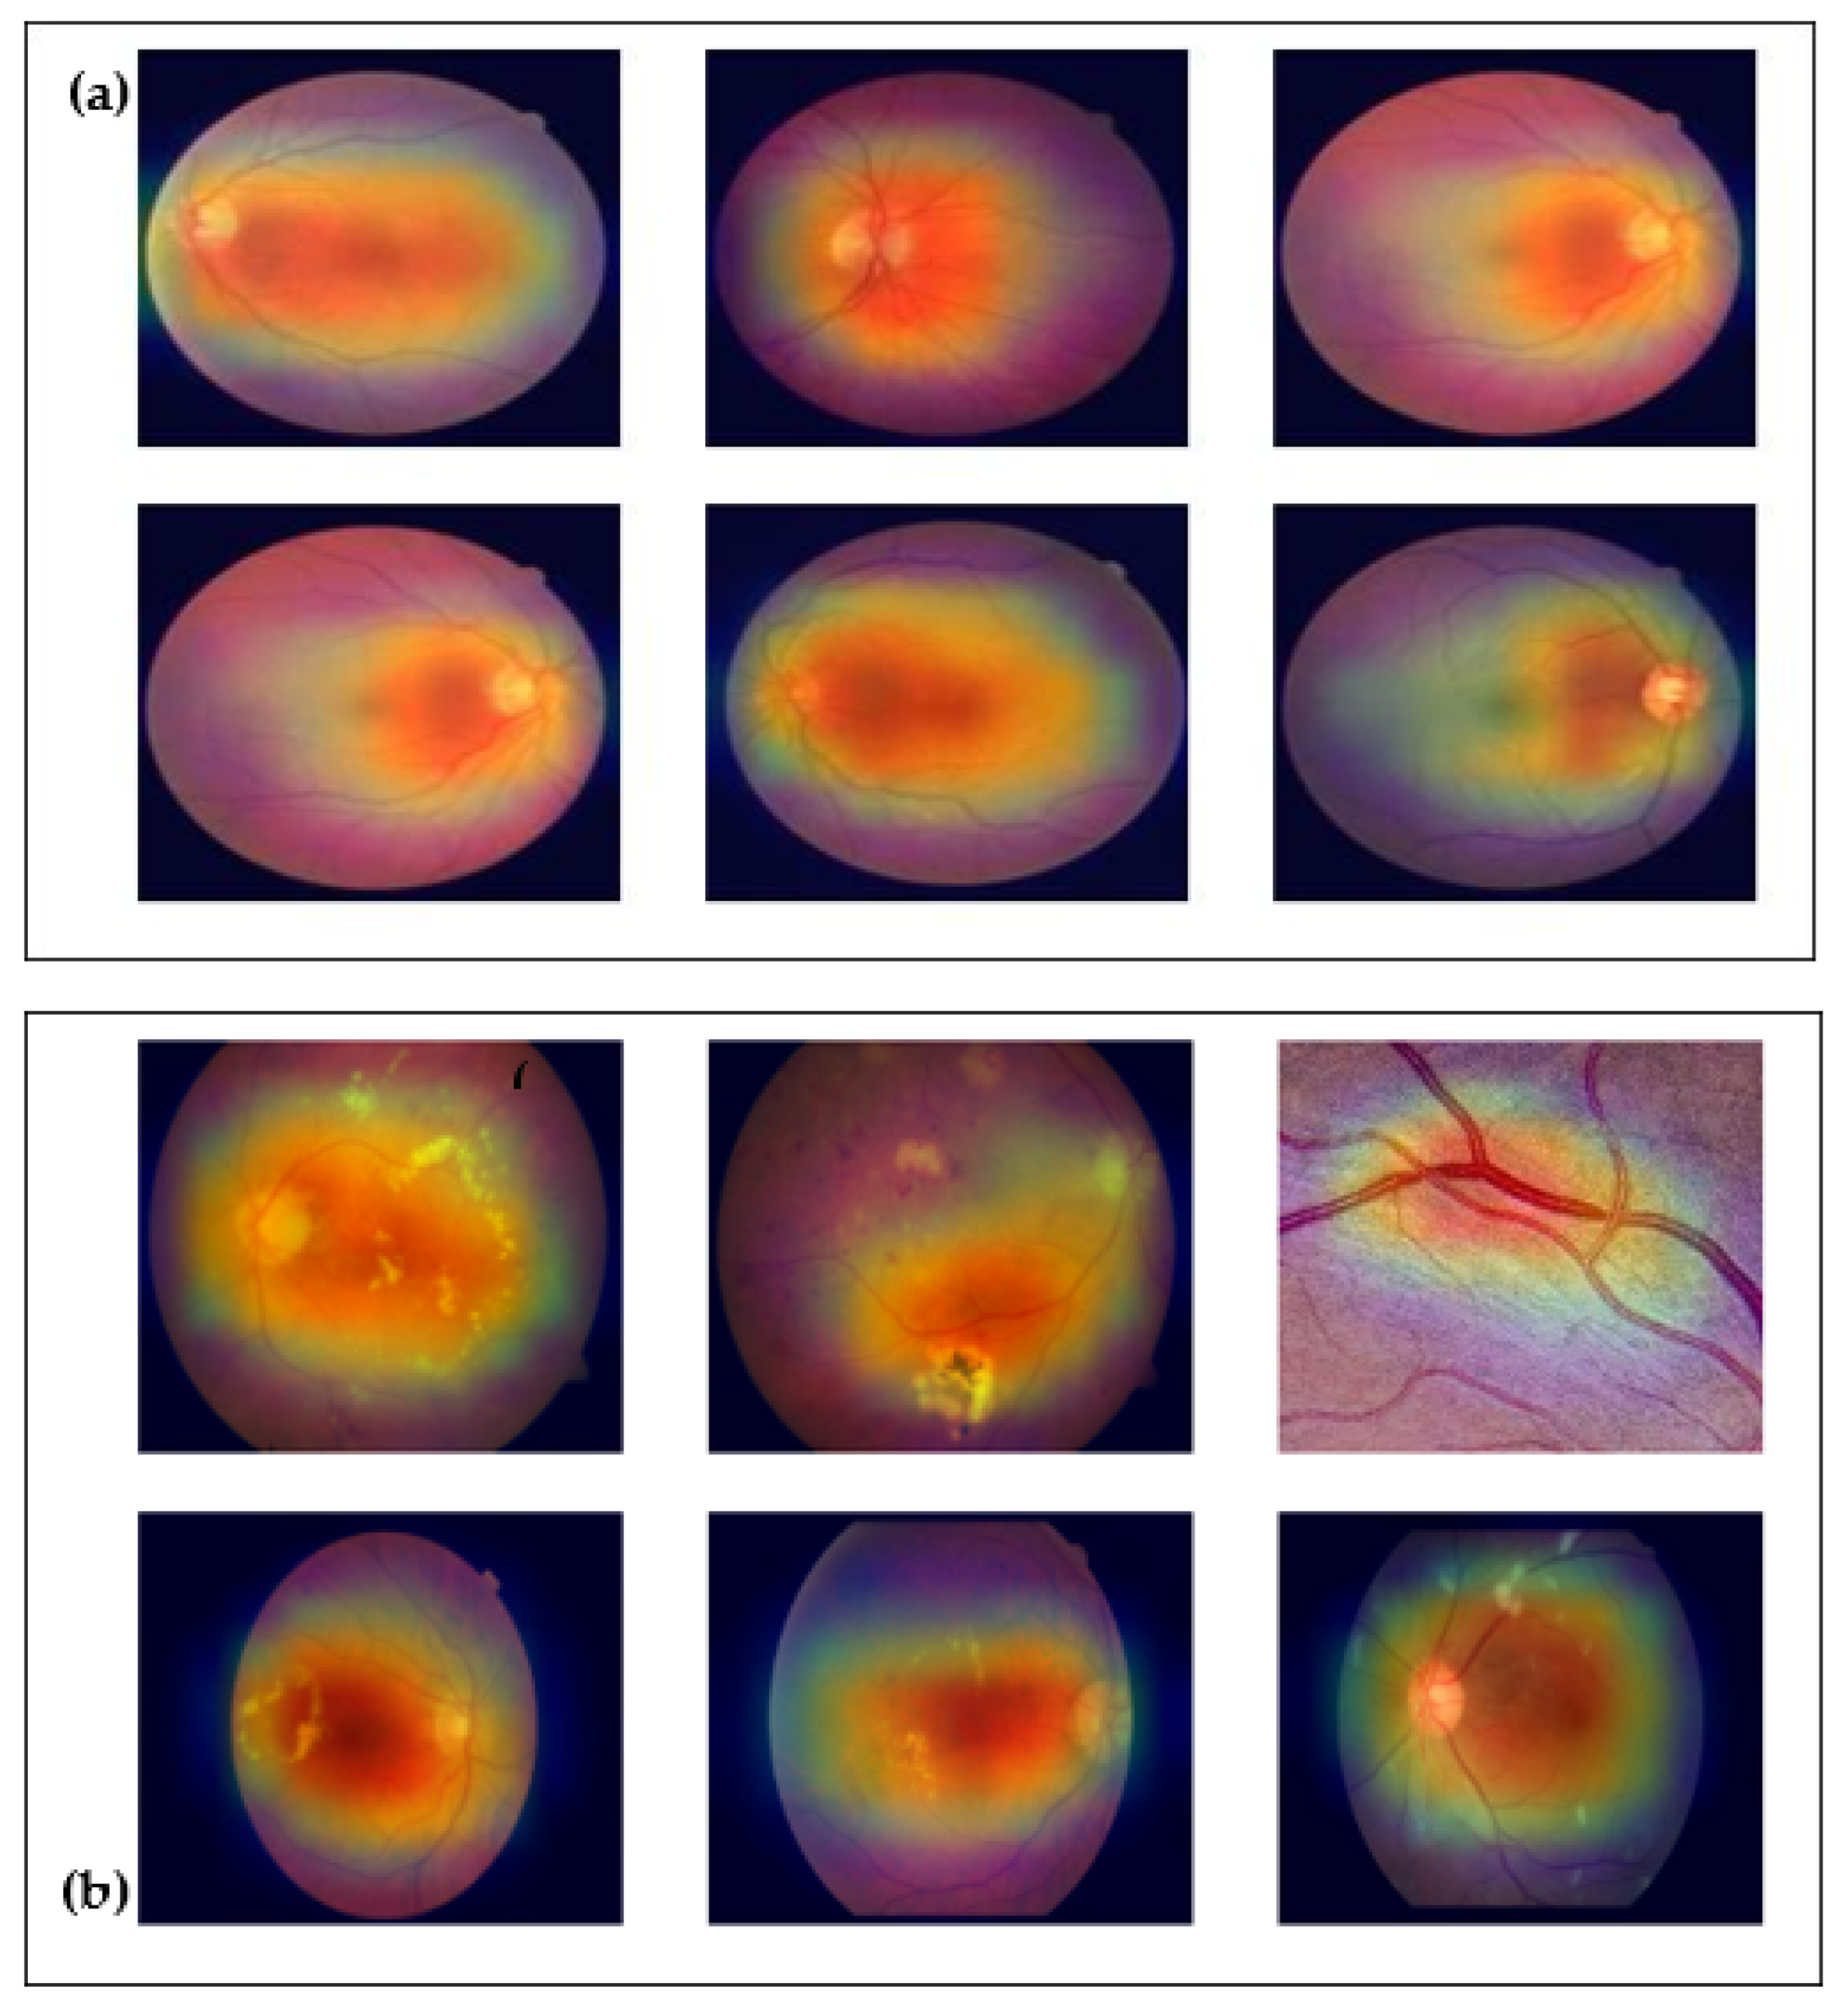
4.5. Final Experiment
4.6. State-of-the-Art Comparisons
5. Discussion
5.1. Advantages of the Proposed Approach
- 1.
- The most important part of our work (HR) is the idea of a new, highly optimized, and lightweight CNN model that can recognize hypertensive retinopathy. Compared to other deep learning (DL) architectures, the Mobile-HR design makes networks less complicated while improving their accuracy and speed through dense blocks. The dense block of our model’s Mobile-HR architecture modifies and increases the accuracy. Moreover, it has little effect on the model’s complexity or recognition rate.
- 2.
- Mobile-HR has a generic capability with no overfitting or underfitting issues. Since the activation function makes the model more accurate, we changed the original ReLU function in the suggested model to the GELU function instead, which, according to our study, made the model better. When the activation function is there, the model better recognizes the HR class.
5.2. Limitations of Proposed Approach and Future Works
6. Conclusions
Author Contributions
Funding
Institutional Review Board Statement
Informed Consent Statement
Data Availability Statement
Acknowledgments
Conflicts of Interest
References
- Mozaffarian, D.; Benjamin, E.J.; Go, A.S.; Arnett, D.K.; Blaha, M.J.; Cushman, M.; Das, S.R.; De Ferranti, S.; Després, J.P.; Fullerton, H.J.; et al. Executive summary: Heart disease and stroke statistics-2016 update: A report from the American heart association. Circulation 2016, 133, 447–454. [Google Scholar] [CrossRef]
- Modi, P.; Arsiwalla, T. Hypertensive retinopathy. In StatPearls; StatPearls Publishing: Treasure Island, FL, USA, 2022. [Google Scholar]
- Rosendorff, C.; Lackland, D.T.; Allison, M.; Aronow, W.S.; Black, H.R.; Blumenthal, R.S.; Gersh, B.J. Treatment of hypertension in patients with coronary artery disease: A scientific statement from the American heart association, American college of cardiology, and american society of hypertension. J. Am. Coll. Cardiol. 2015, 65, 1998–2038. [Google Scholar] [CrossRef] [PubMed]
- Qureshi, I.; Ma, J.; Abbas, Q. Diabetic retinopathy detection and stage classification in eye fundus images using active deep learning. Multimed. Tools Appl. 2021, 80, 11691–11721. [Google Scholar] [CrossRef]
- Bhargava, M.; Ikram, M.K.; Wong, T.Y. How does hypertension affect your eyes? J. Hum. Hypertens. 2012, 26, 71–83. [Google Scholar] [CrossRef]
- Wiharto; Suryani, E. The review of computer aided diagnostic hypertensive retinopathy based on the retinal image processing. IOP Conf. Ser. Mater. Sci. Eng. 2019, 620, 012099. [Google Scholar] [CrossRef]
- Rajalakshmi, R.; Subashini, R.; Anjana, R.M.; Mohan, V. Automated diabetic retinopathy detec- tion in smartphone-based fundus photography using artificial intelligence. Eye 2018, 32, 1138–1144. [Google Scholar] [CrossRef] [PubMed]
- Asiri, N.; Hussain, M.; Aboalsamh, H.A. Deep learning based computer-aided diagnosis Systems for Diabetic Retinopathy: A survey. Artif. Intell. Med. 2018, 99, 101701. [Google Scholar] [CrossRef] [PubMed]
- Abbas, Q.; Ibrahim, M.E.; Jaffar, M.A. A comprehensive review of recent advances on deep vision systems. Artif. Intell. Rev. 2018, 52, 39–76. [Google Scholar] [CrossRef]
- Abbas, Q.; Celebi, M.E. DermoDeep-A classification of melanoma-nevus skin lesions using multi-feature fusion of visual features and deep neural network. Multimed. Tools Appl. 2019, 78, 23559–23580. [Google Scholar] [CrossRef]
- Jin, J.; Dundar, A.; Culurciello, E. Flattened convolutional neural networks for feed- forward acceleration. arXiv 2016, arXiv:1412.5474. [Google Scholar]
- Wang, M.; Liu, B.; Foroosh, H. Factorized convolutional neural networks. arXiv 2016, arXiv:1608.04337. [Google Scholar]
- Howard, A.G.; Zhu, M.; Chen, B.; Kalenichenko, D.; Wang, W.; Weyand, T.; Andreetto, M.; Adam, H. MobileNets: Efficient Convolutional Neural Networks for Mobile Vision Applications. arXiv 2017, arXiv:1704.04861v1. [Google Scholar]
- Pavate, A.; Nerurkar, P.; Ansari, N.; Bansode, R. Early prediction of five major complications ascends in diabetes mellitus using fuzzy logic. In Soft Computing in Data Analytics: Proceedings of the International Conference on SCDA, Singapore, 15–16 December 2019; Springer: Singapore; Volume 758, pp. 759–768.
- Wu, Y.; Hu, Z. Recognition of Diabetic Retinopathy Basedon Transfer Learning. In Proceedings of the 2019 IEEE 4th International Conference on Cloud Computing and Big Data Analysis (ICCCBDA), Chengdu, China, 12–15 April 2019; pp. 398–401. [Google Scholar]
- Sun, Y.; Zhang, D. Diagnosis and Analysis of Diabetic Retinopathy Based on Electronic Health Records. IEEE Access 2019, 7, 86115–86120. [Google Scholar] [CrossRef]
- Sun, Y. The Neural Network of One-Dimensional Convolution—An Example of the Diagnosis of Diabetic Retinopathy. IEEE Access 2019, 7, 69657–69666. [Google Scholar] [CrossRef]
- Arsalan, M.; Haider, A.; Lee, Y.W.; Park, K.R. Detecting retinal vasculature as a key biomarker for deep Learning-based intelligent screening and analysis of diabetic and hypertensive retinopathy. Expert Syst. Appl. 2022, 200, 117009. [Google Scholar] [CrossRef]
- Soni, M.; Singh, N.K.; Das, P.; Shabaz, M.; Shukla, P.K.; Sarkar, P.; Singh, S.; Keshta, I.; Rizwan, A. IoT-Based Federated Learning Model for Hypertensive Retinopathy Lesions Classification. IEEE Trans. Comput. Soc. Systems 2022, 1–10. [Google Scholar] [CrossRef]
- Joseph, R.; Chauhan, S.; Chichria, K.; Bhatia, T.; Thakur, H. Detection of Hypertension Retinopathy and Diabetes Using Machine Learning. In Proceedings of the International Conference on Recent Advances in Computational Techniques (IC-RACT), Mumbai, India, 9 October 2020; pp. 1–6. [Google Scholar]
- Arsalan, M.; Haider, A.; Choi, J.; Park, K.R. Diabetic and hypertensive retinopathy screening in fundus images using artificially intelligent shallow architectures. J. Pers. Med. 2022, 12, 7. [Google Scholar] [CrossRef]
- Xu, K.; Feng, D.; Mi, H. Deep convolutional neural network-based early automated detection of diabetic retinopathy using fundus image. Molecules 2017, 22, 2054. [Google Scholar] [CrossRef] [PubMed]
- Carson, L.; Yi, D.; Guo, M.; Lindsey, T. Automated detection of diabetic retinopathy using deep learning. AMIA Summits Transl. Sci. Proc. 2018, 2018, 147. [Google Scholar]
- Narayanan, B.N.; Hardie, R.C.; De Silva, M.S.; Kueterman, N.K. Hybrid machine learning architecture for automated detection and grading of retinal images for diabetic retinopathy. J. Med. Imaging 2020, 7, 034501. [Google Scholar] [CrossRef] [PubMed]
- Hacisoftaoglu, R.E.; Karakaya, M.; Sallam, A.B. Deep learning frameworks for diabetic retinopathy detection with smartphone-based retinal imaging systems. Pattern Recognit. Lett. 2020, 135, 409–417. [Google Scholar] [CrossRef]
- Riaz, H.; Park, J.; Choi, H.; Kim, H.; Kim, J. Deep and densely connected networks for classification of diabetic retinopathy. Diagnostics 2020, 10, 24. [Google Scholar] [CrossRef] [PubMed]
- Pavate, A.; Mistry, J.; Palve, R.; Gami, N. Diabetic retinopathy detection-MobileNet binary classifier. Acta. Sci. Med. Sci. 2020, 4, 86–91. [Google Scholar] [CrossRef]
- Qureshi, I.; Abbas, Q.; Yan, J.; Hussain, A.; Shaheed, K.; Baig, A.R. Computer-Aided Detection of Hypertensive Retinopathy Using Depth-Wise Separable CNN. Appl. Sci. 2022, 12, 12086. [Google Scholar] [CrossRef]
- Triwijoyo, B.K.; Budiharto, W.; Abdurachman, E. The classification of hypertensive retinopathy using convolutional neural network. Procedia Comput. Sci. 2017, 116, 166–173. [Google Scholar] [CrossRef]
- Abbas, Q.; Ibrahim, M.E. DenseHyper: An automatic recognition system for detection of hypertensive retinopathy using dense features transform and deep-residual learning. Multimed. Tools Appl. 2020, 20, 31595–31623. [Google Scholar] [CrossRef]
- Arsalan, M.; Owais, M.; Mahmood, T.; Cho, S.W.; Park, K.R. Aiding the diagnosis of diabetic and hypertensive retinopathy using artificial intelligence-based semantic segmentation. J. Clin. Med. 2019, 8, 1446. [Google Scholar] [CrossRef]
- Abbas, Q.; Qureshi, I.; Ibrahim, M.E. An Automatic Detection and Classification System of Five Stages for Hypertensive Retinopathy Using Semantic and Instance Segmentation in DenseNet Architecture. Sensors 2021, 21, 6936. [Google Scholar] [CrossRef]
- Kumar, K.S.; Singh, N.P. Retinal disease prediction through blood vessel segmentation and classification using ensemble-based deep learning approaches. Neural Comput. Appl. 2023, 1–17. [Google Scholar] [CrossRef]
- Sathananthavathi, V.; Indumathi, G. Deep learning approaches for the retinal vasculature segmentation in fundus images. In Computational Methods and Deep Learning for Ophthalmology; Academic Press: Cambridge, MA, USA, 2023; pp. 139–155. [Google Scholar]


| No. | Key Factors Affected by Systematic Hypertension |
|---|---|
| 1 | Hypertension is a major risk factor for cardiovascular disease and is the term used to describe chronically elevated arterial blood pressure. |
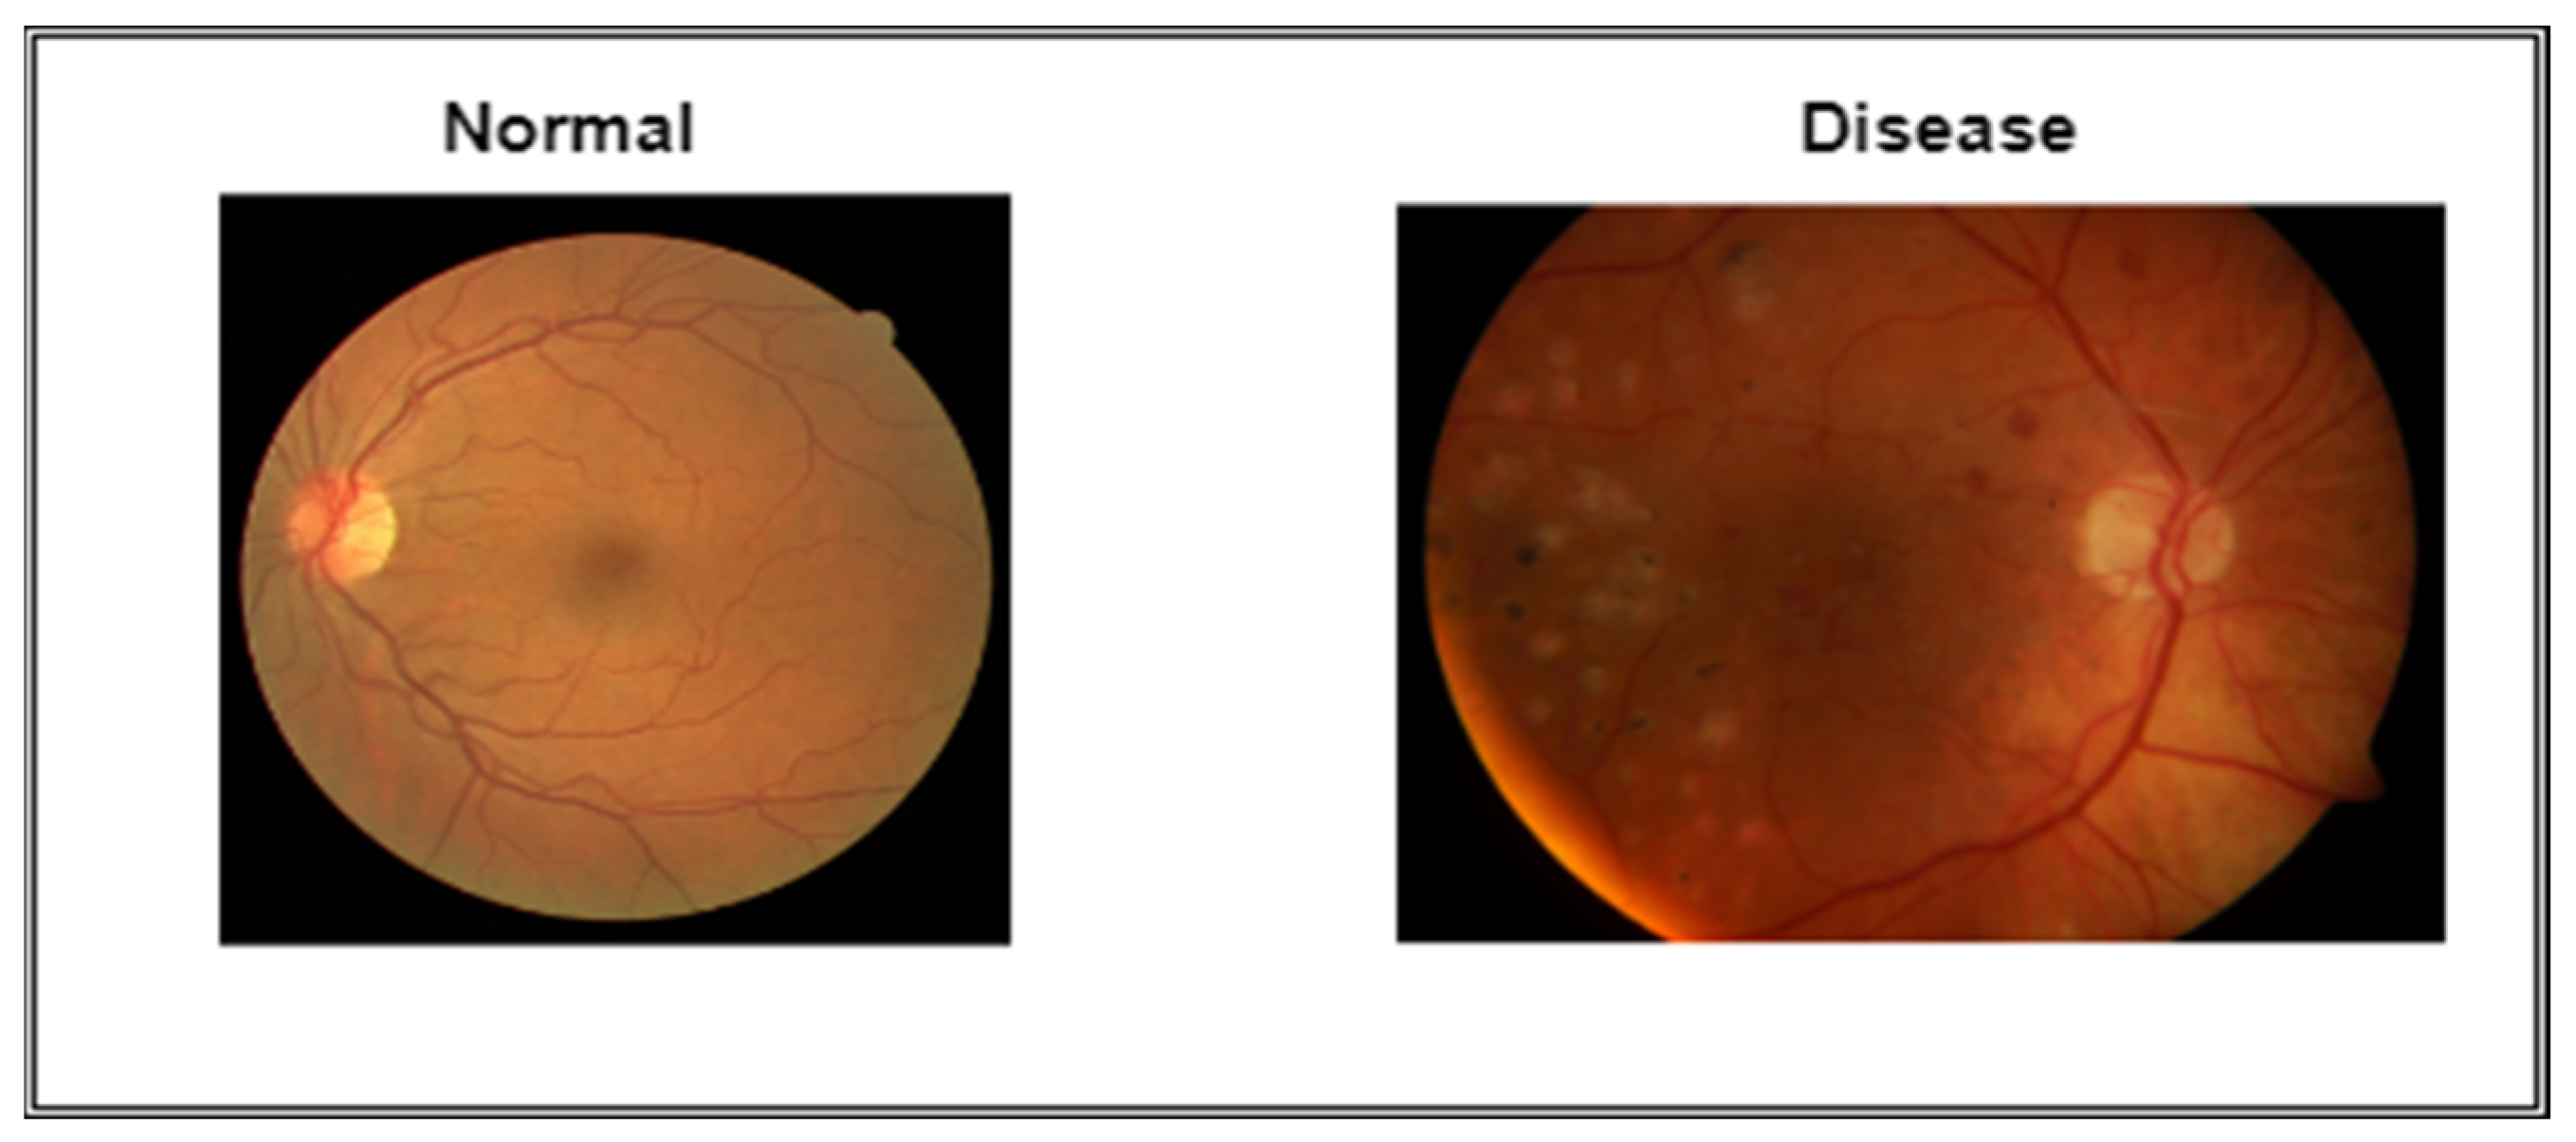
| 2 | Hypertensive retinopathy (HR), which occurs when blood pressure increases gradually over time or increases abruptly to extremely high levels, can harm the retina. |
| 3 | A clinical condition called HR has distinctive fundoscopic symptoms, such as arteriolar narrowing, AV nicking, hard exudates, and cotton wool spots. |
| 4 | Evidence of papilledema is used to diagnosis HR (optic disc swelling due to the fact of raised intracranial pressure) |
| 5 | Long-term hypertension can cause permanent damage to the lungs, heart, kidneys, and eyes. |
| 6 | Ineffective treatment for HR might cause irreparable visual damage. Further retinal vascular disease and the development of diabetic retinopathy (DR) are complications. |
| 7 | Malignant hypertension has a 90% death rate after one year if untreated, and delayed treatment may cause irreparable alterations and loss of vision. |
| Reference | Name | HR | Non-HR | Images Size | Fundus Images |
|---|---|---|---|---|---|
| [27] | DRIVE | 100 | 150 | 768 × 584 pixels | 250 |
| [29] | DiaRetDB0 | 80 | 80 | 1152 × 1500 pixels | 160 |
| Private | Pak Eyes Hospitals | 2100 | 3490 | 1125 × 1264 pixels | 5590 |
| Private | Imam-HR | 1130 | 2040 | 1125 × 1264 pixels | 3170 |
| 3410 | 5760 | Downsizing: 700 × 600 pixels | 9170 |
| Techniques for Augmentation | Value |
|---|---|
| Rotation range | 15 |
| Width shift range | 0.2 |
| Shear range | 0.2 |
| Zoom range | 0.2 |
| Crop | Ture |
| Horizontal flip | True |
| Vertical flip | False |
| Fill mood | Nearest |
| Techniques for augmentation | Values |
| Rotation range | 15 |
| Hypertensive Type | SE | SP | ACC | AUC | Error |
|---|---|---|---|---|---|
| HR | 98% | 99% | 99% | 0.99 | 0.01 |
| No-HR | 99% | 98% | 99% | 0.99 | 0.01 |
| Average results | 99% | 99% | 99% | 0.99 | 0.01 |
| Methodology | SE | SP | AUC | ACC |
|---|---|---|---|---|
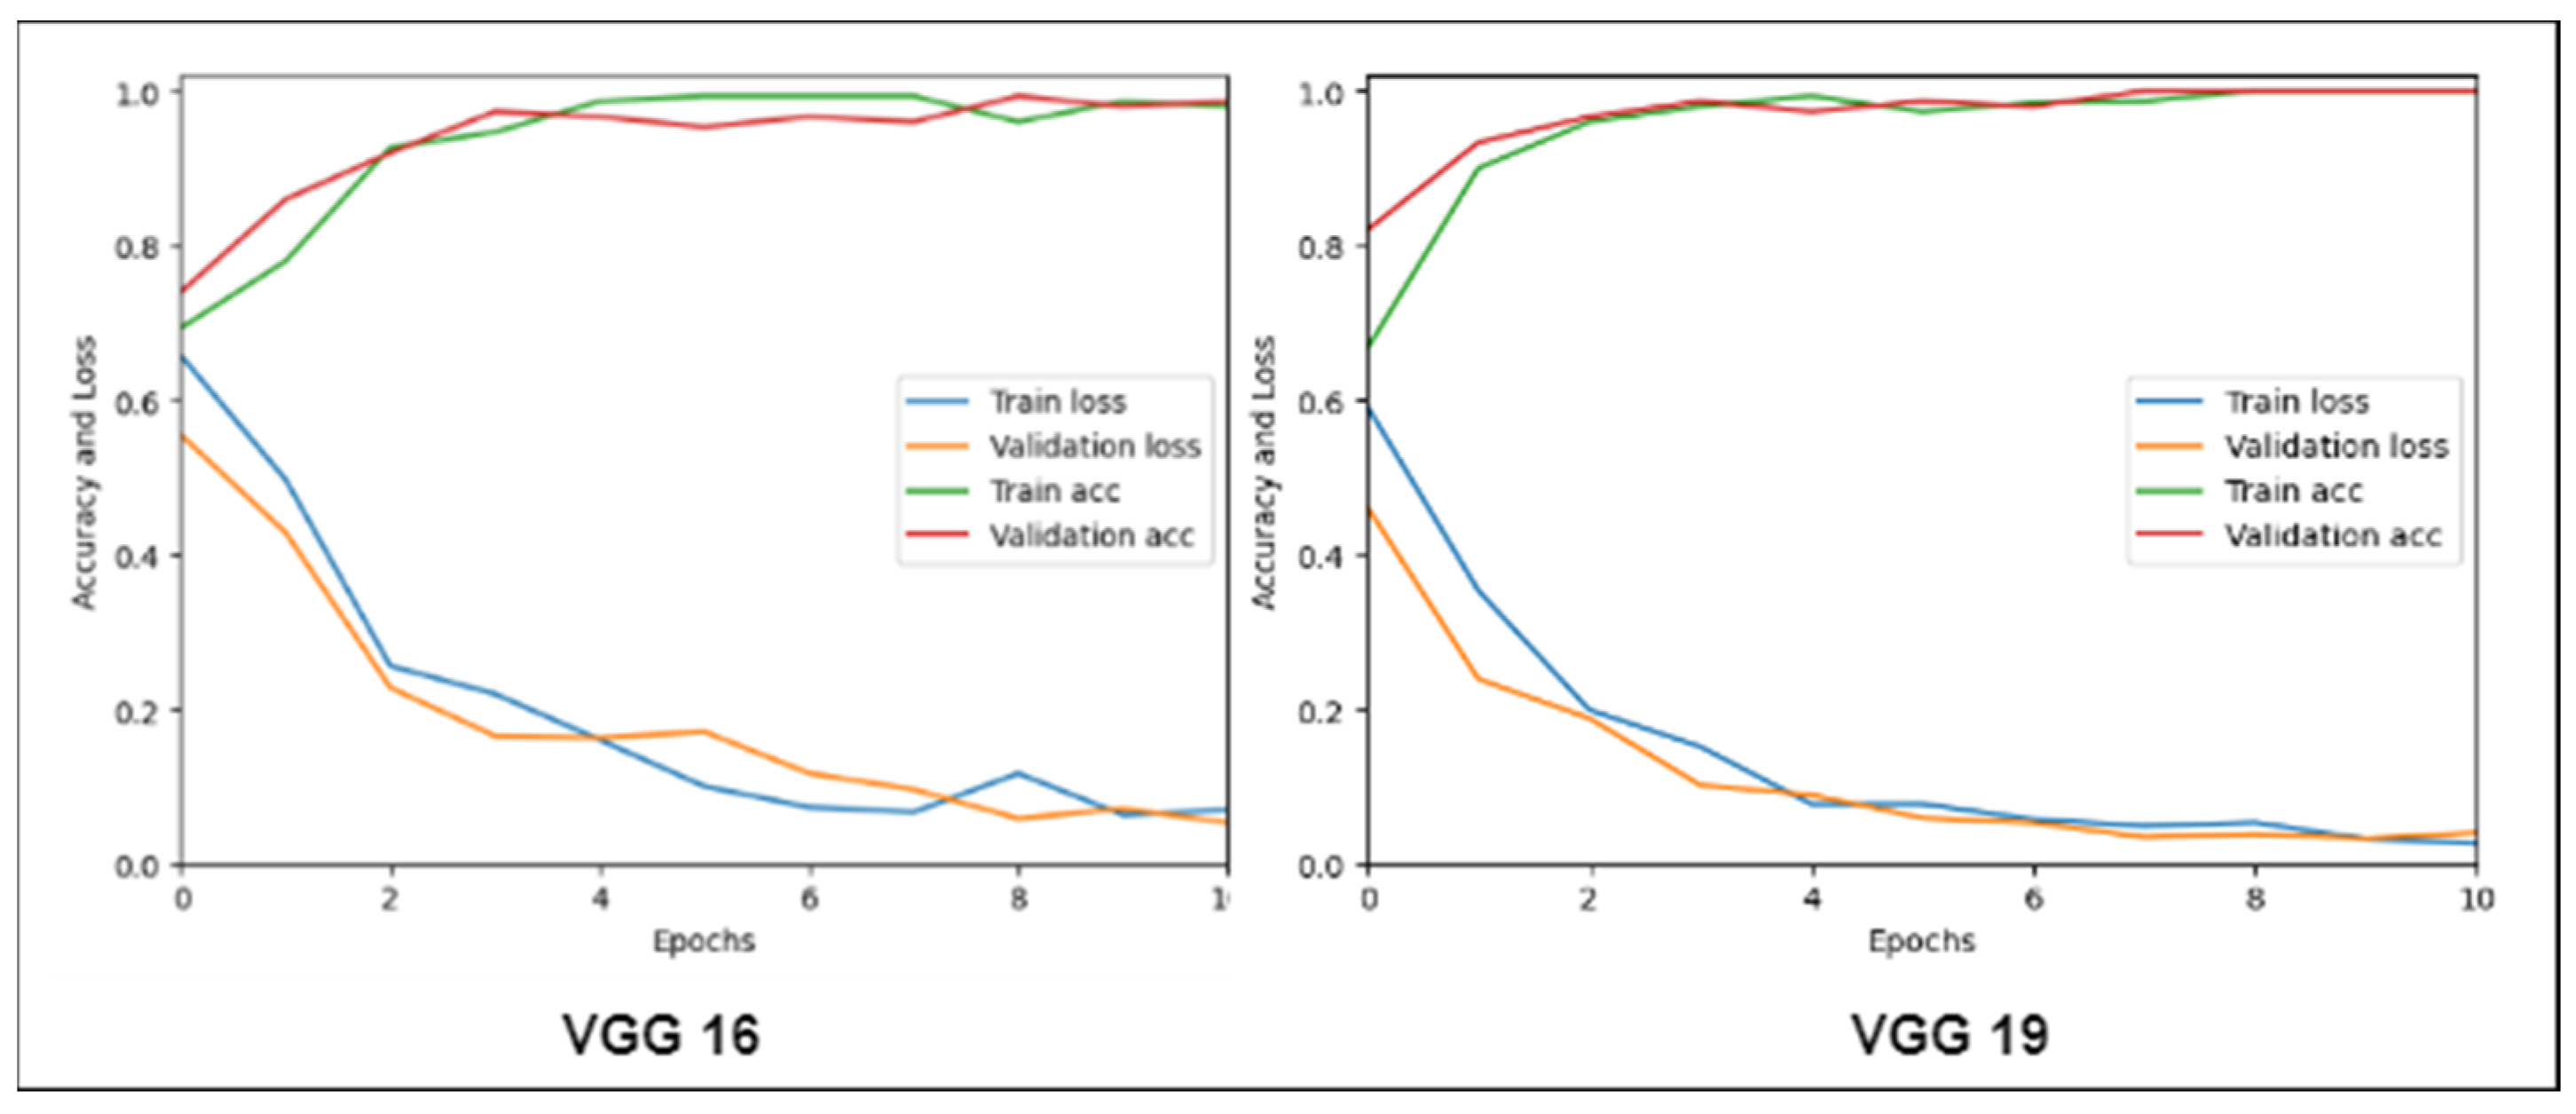
| VGG19 | 87% | 88% | 0.89 | 91% |
| VGG16 | 84% | 87% | 0.87 | 90% |
| Mobile-HR system | 99% | 99% | 0.99 | 99% |
| Method | SE | SP | ACC | AUC |
|---|---|---|---|---|
| Triwijoyo-2017 [29] | 78.5% | 81.5% | 80% | 0.84 |
| CAD-HR [30] | 94% | 96% | 95% | 0.96 |
| Mobile-HR | 99% | 99% | 99% | 0.99 |
| Batch | Number of Epochs | * CPU/TPU/GPU (MS) |
|---|---|---|
| 64 | 40 | 300/500/600 |
| 128 | 60 | 600/500/700 |
| 256 | 80 | 800/600/750 |
| 512 | 100 | 950/600/800 |
| 1024 | 120 | 900/700/800 |
| State-of-the-Art Models | Augment | Epochs | Time (S) | ACC | F1-Score |
|---|---|---|---|---|---|
| Mobile-HR | Yes | 10 | 2.4 | 98.1% | 98.1% |
| CNN | Yes | 40 | 12 | 80.5% | 80.5% |
| AlexNet | Yes | 40 | 17 | 81.9% | 81.9% |
| MobileNet-LSTM | Yes | 40 | 13 | 82.3% | 82.3% |
| DenseNet | Yes | 40 | 15 | 84.8% | 84.8% |
| EfficientNet | Yes | 40 | 18 | 75.4% | 75.4% |
| CNN-Leaky | Yes | 40 | 20 | 76.5% | 76.5% |
| DCNN | Yes | 40 | 22 | 77.9% | 77.9% |
| Cited | Major Finding | Dataset | Results | Limitation |
|---|---|---|---|---|
| Sun et al. [17] | To improve the accuracy of the diabetic retinopathy diagnosis model, a convolutional neural network (CNN) model was merged with a batch normalization (BN) layer. | Electronic Record Data = 301 Patients | ACC = 97.56% | Although the proposed model (BNCNN) outperformed logistic regression in terms of accuracy, it still requires further validation on larger datasets with more diverse samples. |
| Lam et al. [23] | The paper employs convolutional neural networks (CNNs) on color fundus images to perform diabetic retinopathy staging recognition. | Kaggle Dataset = 35,000 Color Fundus Images, Messidor-1 = 1200 Color Fundus Images | SEN = 95% | Errors occurred mostly in misclassifying moderate disease as normal because of the CNNs’ inability to recognize subtle disease signs. |
| Xu et al. [22] | Exploration and application of deep convolutional neural network methodology for automatic diabetic retinopathy classification utilizing color fundus images. | Kaggle Dataset | ACC = 94% | The study’s dataset was limited, which may restrict its generalizability to larger datasets. |
| Narayanan et al. [24] | A novel hybrid machine learning architecture for detecting and classifying DR in retinal images. | Asia Pacific Tele-Ophthalmology Society (APTOS) 2019 Dataset = 3662 Retinal Images | ACC = 98.4% | There was no external validation set used to assess their model’s performance. |
| Hacisoftaoglu et al. [25] | This study uses a DL approach and the ResNet50 network to develop an autonomous detection model for smartphone-based retinal images. | EyePACS = 35,126 Images, Messidor = 1187 Images, Messidor-2 = 1748 Images | ACC = 91% SEN = 92% SPE = 90% | Only a few publicly available datasets were used to train and test the proposed model. |
| Riaz et al. [26] | The authors analyze retinal images using proposed deep and densely connected networks to distinguish between different stages of diabetic retinopathy. | Messidor-2 = 1748 Images, EyePACS = 35,126 Images | SEN = 98% SPE = 98% SEN = 94% SPE = 97% | Although their technology outperforms existing methods, it still has some false positives, which could lead to unnecessary treatments for those who do not have diabetic retinopathy. |
| Pavate et al. [27] | The paper uses MobileNet architecture to solve the problem of predicting diabetic retinopathy. | Aptus 2019 Challenge Dataset = 3662 Images | ACC = 95% PRECISION = 95% RECALL = 98% F1-score = 97% | MobileNet is a lightweight and mobile-friendly classifier, but it still requires significant computational power, which may not be available in resource-constrained environments. |
| Qureshi et al. [28] | The study offers a new computer-aided approach for the early detection and analysis of hypertensive retinopathy, which is connected to high blood pressure. | Imam-HR = 3580 Fundus Image | ACC = 95% SEN = 94% SPE = 96% AUC = 96% | The research does not claim that this approach is generalizable to other datasets. |
| Abbas et al. [29] | This work presents the development of a novel system called DenseHyper that uses deep residual learning approaches to detect hypertensive retinopathy. | Imam-HR = 4270 Fundus Image | ACC = 95% SEN = 93% SPE = 95% AUC = 96% | The proposed method was tested on limited datasets and may require further validation with larger datasets to ensure its generalizability. |
| Wu et al. [15] | The proposed transfer learning-based technique for diabetic retinopathy detection can automatically classify DR images with significant value. | Kaggle Dataset = 35,000 | ACC = 60% | This study mainly focuses on categorizing DR images into five groups based on the severity of lesions; however, depending on severity levels, there may be more subcategories to examine. |
| Arsalan et al. [31] | The proposed Vess-Net method for automatic retinal image segmentation is useful in computer-assisted medical image analysis for the identification of disorders, such as hypertension, diabetes and hypertensive retinopathy, and arteriosclerosis. | DRIVE Dataset = 40 RGB Fundus Images | ACC = 96% SEN = 80.2% SPE = 98.1% AUC = 98.2% | It is still a deep learning approach that necessitates large computational resources for training and inference. |
| Sun et al. [16] | Machine learning methods used to diagnose DR. | Electronic Record Data = 301 Patients | ACC = 92% | This study only focuses on diagnosing diabetic retinopathy via electronic health records (her) data; however, it does not offer any treatment options based on this diagnosis. |
| Joseph et al. [20] | The research paper discusses how images of the eye, specifically fundus images, can be used to identify medical issues. | Kaggle = 21,000 Fundus Images | ACC = 86% | They still have their own set of restrictions, such as image quality difficulties that limit accuracy. |
| Arsalan et al. [18] | The study shows a novel approach for the computer-assisted diagnosis of diabetic and hypertensive retinopathy conditions. | DRIVE = 40 Fundus Images, CHASE DB1 = 28 Fundus Images, STARE = 20 Fundus Images | ACC = 82% | Avoiding pre- and post-processing steps can lower system costs, and if used properly, these strategies might even increase segmentation performance. |
Disclaimer/Publisher’s Note: The statements, opinions and data contained in all publications are solely those of the individual author(s) and contributor(s) and not of MDPI and/or the editor(s). MDPI and/or the editor(s) disclaim responsibility for any injury to people or property resulting from any ideas, methods, instructions or products referred to in the content. |
© 2023 by the authors. Licensee MDPI, Basel, Switzerland. This article is an open access article distributed under the terms and conditions of the Creative Commons Attribution (CC BY) license (https://creativecommons.org/licenses/by/4.0/).
Share and Cite
Sajid, M.Z.; Qureshi, I.; Abbas, Q.; Albathan, M.; Shaheed, K.; Youssef, A.; Ferdous, S.; Hussain, A. Mobile-HR: An Ophthalmologic-Based Classification System for Diagnosis of Hypertensive Retinopathy Using Optimized MobileNet Architecture. Diagnostics 2023, 13, 1439. https://0-doi-org.brum.beds.ac.uk/10.3390/diagnostics13081439
Sajid MZ, Qureshi I, Abbas Q, Albathan M, Shaheed K, Youssef A, Ferdous S, Hussain A. Mobile-HR: An Ophthalmologic-Based Classification System for Diagnosis of Hypertensive Retinopathy Using Optimized MobileNet Architecture. Diagnostics. 2023; 13(8):1439. https://0-doi-org.brum.beds.ac.uk/10.3390/diagnostics13081439
Chicago/Turabian StyleSajid, Muhammad Zaheer, Imran Qureshi, Qaisar Abbas, Mubarak Albathan, Kashif Shaheed, Ayman Youssef, Sehrish Ferdous, and Ayyaz Hussain. 2023. "Mobile-HR: An Ophthalmologic-Based Classification System for Diagnosis of Hypertensive Retinopathy Using Optimized MobileNet Architecture" Diagnostics 13, no. 8: 1439. https://0-doi-org.brum.beds.ac.uk/10.3390/diagnostics13081439