Phospholipids are A Potentially Important Source of Tissue Biomarkers for Hepatocellular Carcinoma: Results of a Pilot Study Involving Targeted Metabolomics

 , , , and
Abstract
:1. Introduction
2. Materials and Methods
2.1. Patients
2.2. Chemical Reagents
2.3. Sample Preparation and Analysis
2.4. Bile Acid Profiling (UPLC-MS)
2.5. Fatty Acid and Small Molecule Profiling (GC-TOFMS)
2.6. Lipid Profiling (UPLC-MS)
2.7. Data Processing/Analysis
2.8. Biomarker and Statistical Analysis
3. Results
4. Discussion
5. Conclusions
Supplementary Materials
Author Contributions
Funding
Conflicts of Interest
References
- Marrero, J.A.; Kulik, L.M.; Sirlin, C.B.; Zhu, A.X.; Finn, R.S.; Abecassis, M.M.; Roberts, L.R.; Heimbach, J.K. Diagnosis, Staging, and Management of Hepatocellular Carcinoma: 2018 Practice Guidance by the American Association for the Study of Liver Diseases. Hepatology 2018, 68, 723–750. [Google Scholar] [CrossRef] [PubMed] [Green Version]
- Vander Heiden, M.G.; DeBerardinis, R.J. Understanding the Intersections between Metabolism and Cancer Biology. Cell 2017, 168, 657–669. [Google Scholar] [CrossRef] [PubMed] [Green Version]
- Wei, R.; Wang, J.; Wang, X.; Xie, G.; Wang, Y.; Zhang, H.; Peng, C.-Y.; Rajani, C.; Kwee, S.; Liu, P.; et al. Clinical prediction of HBV and HCV related hepatic fibrosis using machine learning. EBioMedicine 2018, 35, 124–132. [Google Scholar] [CrossRef] [PubMed] [Green Version]
- Xie, G.; Wang, Y.; Wang, X.; Zhao, A.; Chen, T.; Ni, Y.; Wong, L.; Zhang, H.; Zhang, J.; Liu, C.; et al. Profiling of serum bile acids in a healthy Chinese population using UPLC-MS/MS. J. Proteome Res. 2015, 14, 850–859. [Google Scholar] [CrossRef]
- Xie, G.; Zhong, W.; Li, H.; Qiu, Y.; Zheng, X.; Chen, H.; Chen, H.; Zhao, X.; Zhang, S.; Zhou, Z.; et al. Alteration of bile acid metabolism in the rat induced by chronic ethanol consumption. FASEB J. 2013, 27, 3583–3593. [Google Scholar] [CrossRef] [Green Version]
- Garcia-Canaveras, J.C.; Donato, M.T.; Castell, J.V.; Lahoz, A. Targeted profiling of circulating and hepatic bile acids in human, mouse, and rat using a UPLC-MRM-MS-validated method. J. Lipid Res. 2012, 53, 2231–2241. [Google Scholar] [CrossRef] [Green Version]
- Zhao, L.; Ni, Y.; Su, M.; Li, H.; Dong, F.; Chen, W.; Wei, R.; Zhang, L.; Guiraud, S.P.; Marten, F.-P.; et al. High Throughput and Quantitative Measurement of Microbial Metabolome by Gas Chromatography/Mass Spectrometry Using Automated Alkyl Chloroformate Derivatization. Anal. Chem. 2017, 89, 5565–5577. [Google Scholar] [CrossRef] [Green Version]
- Qiu, Y.; Zhou, B.; Su, M.; Bxter, S.; Zheng, X.; Zhao, X.; Yen, Y.; Jia, W. Mass spectrometry-based quantitative metabolomics revealed a distinct lipid profile in breast cancer patients. Int. J. Mol. Sci. 2013, 14, 8047–8061. [Google Scholar] [CrossRef]
- Ni, Y.; Qiu, Y.; Jiang, W.; Suttlemyre, K.; Su, M.; Zhang, W.; Jia, W.; Du, X. ADAP-GC 2.0: Deconvolution of coeluting metabolites from GC/TOF-MS data for metabolomics studies. Anal. Chem. 2012, 84, 6619–6629. [Google Scholar] [CrossRef]
- Chong, J.; Soufan, O.; Li, C.; Caraus, L.; Li, S.; Bourque, G.; Wishart, D.S.; Xia, J. MetaboAnalyst 4.0: Towards more transparent and integrative metabolomics analysis. Nucleic Acids Res. 2018, 46, W486–W494. [Google Scholar] [CrossRef]
- Chong, J.; Xia, J. MetaboAnalystR: An R package for flexible and reproducible analysis of metabolomics data. Bioinformatics 2018, 34, 4313–4314. [Google Scholar] [CrossRef] [PubMed]
- Chong, J.; Yamamoto, M.; Yamamoto, M.; Xia, J. MetaboAnalystR 2.0: From Raw Spectra to Biological Insights. Metabolites 2019, 9, 57. [Google Scholar] [CrossRef] [PubMed]
- Zhang, X.; Lu, X.; Shi, Q.; Xu, X.; Leung, H.-C.E.; Harris, L.N.; Iglehart, J.D.; Miron, A.; Liu, J.S.; Wong, W.H. Recursive SVM feature selection and sample classification for mass-spectrometry and microarray data. BMC Bioinform. 2006, 7, 197. [Google Scholar] [CrossRef] [PubMed]
- Xia, J.; Psychogios, N.; Young, N.; Wishart, D.S. MetaboAnalyst: A web server for metabolomic data analysis and interpretation. Nucleic Acids Res. 2009, 37, W652–W660. [Google Scholar] [CrossRef] [PubMed]
- Roberts, L.R.; Sirlin, C.B.; Zaiem, F.; Almasri, J.; Prokop, L.J.; Heimbach, J.K.; Murad, M.H.; Mohammed, K. Imaging for the diagnosis of hepatocellular carcinoma: A systematic review and meta-analysis. Hepatology 2018, 67, 401–421. [Google Scholar] [CrossRef]
- Calderaro, J.; Ziol, M.; Paradis, V.; Zucman-Rossi, J. Molecular and histological correlations in liver cancer. J. Hepatol. 2019, 71, 616–630. [Google Scholar] [CrossRef] [Green Version]
- Kwee, S.A.; Tiirikainen, M.; Sato, M.M.; Acoba, J.D.; Wei, R.; Jia, W.; Marchand, L.L.; Wong, L.L. Transcriptomics Associates Molecular Features with (18)F-Fluorocholine PET/CT Imaging Phenotype and Its Potential Relationship to Survival in Hepatocellular Carcinoma. Cancer Res. 2019, 79, 1696–1704. [Google Scholar] [CrossRef]
- Statnikov, A.; Wang, L.; Aliferis, C.F. A comprehensive comparison of random forests and support vector machines for microarray-based cancer classification. BMC Bioinform. 2008, 9, 319. [Google Scholar] [CrossRef]
- Beyoglu, D.; Imbeaud, S.; Maurhofer, O.; Bioulac-Sage, P.; Zucman-Rossi, J.; Dufour, J.-F.; Idle, J.R. Tissue metabolomics of hepatocellular carcinoma: Tumor energy metabolism and the role of transcriptomic classification. Hepatology 2013, 58, 229–238. [Google Scholar] [CrossRef] [Green Version]
- Budhu, A.; Roessler, S.; Zhao, X.; Yu, Z.; Forgues, M.; Ji, J.; Karoly, E.; Qin, L.-X.; Ye, Q.-H.; Jia, H.-L.; et al. Integrated metabolite and gene expression profiles identify lipid biomarkers associated with progression of hepatocellular carcinoma and patient outcomes. Gastroenterology 2013, 144, 1066–1075. [Google Scholar] [CrossRef]
- Guo, W.; Tan, H.Y.; Wang, N.; Wang, X.; Feng, Y. Deciphering hepatocellular carcinoma through metabolomics: From biomarker discovery to therapy evaluation. Cancer Manag. Res. 2018, 10, 715–734. [Google Scholar] [CrossRef] [PubMed]
- Palm, W.; Thompson, C.B. Nutrient acquisition strategies of mammalian cells. Nature 2017, 546, 234–242. [Google Scholar] [CrossRef] [PubMed]
- Jia, W.; Xie, G.; Jia, W. Bile acid-microbiota crosstalk in gastrointestinal inflammation and carcinogenesis. Nat. Rev. Gastroenterol. Hepatol. 2018, 15, 111–128. [Google Scholar] [CrossRef] [PubMed]
- Adamson, E.B.; Ludwig, K.D.; Mummy, D.G.; Fain, S.B. Magnetic resonance imaging with hyperpolarized agents: Methods and applications. Phys. Med. Biol. 2017, 62, R81–R123. [Google Scholar] [CrossRef]
- McIntyre, D.J.; Madhu, B.; Lee, S.H.; Griffiths, J.R. Magnetic resonance spectroscopy of cancer metabolism and response to therapy. Radiat. Res. 2012, 177, 398–435. [Google Scholar] [CrossRef]
- Gallagher, F.A.; Kettunen, M.I.; Hu, D.-E.; Jensen, P.R.; Zandt, R.; Karlsson, M.; Gisselsson, A.; Nelson, S.K.; Witney, T.H.; Bohndiek, S.E.; et al. Production of hyperpolarized [1,4-13C2]malate from [1,4-13C2]fumarate is a marker of cell necrosis and treatment response in tumors. Proc. Natl. Acad. Sci. USA 2009, 106, 19801–19806. [Google Scholar] [CrossRef]
- Darpolor, M.M.; Yen, Y.-F.; Chua, M.-S.; Xing, L.; Clarke-Katzenberg, R.H.; Shi, W.; Mayer, D.; Josan, S.; Hurd, R.; Pfefferbaum, A.; et al. In vivo MRSI of hyperpolarized [1-(13)C]pyruvate metabolism in rat hepatocellular carcinoma. NMR Biomed. 2011, 24, 506–513. [Google Scholar] [CrossRef]
- Currie, E.; Schulze, A.; Zechner, R.; Walther, T.C.; Farese, R.V. Cellular fatty acid metabolism and cancer. Cell Metab. 2013, 18, 153–161. [Google Scholar] [CrossRef]
- Calvisi, D.F.; Wang, C.; Ho, C.; Ladu, S.; Lee, S.A.; Mattu, S.; Destefanis, G.; Delogu, S.; Zimmermann, A.; Ericsson, J.; et al. Increased lipogenesis, induced by AKT-mTORC1-RPS6 signaling, promotes development of human hepatocellular carcinoma. Gastroenterology 2011, 140, 1071–1083. [Google Scholar] [CrossRef]
- Deford-Watts, L.M.; Mintz, A.; Kridel, S.J. The potential of (1)(1)C-acetate PET for monitoring the Fatty acid synthesis pathway in Tumors. Curr. Pharm. Biotechnol. 2013, 14, 300–312. [Google Scholar] [CrossRef]
- Li, L.; Che, L.; Wang, C.; Blecha, J.E.; Li, X.; VanBrocklin, H.F.; Calvisi, D.F.; Puchowicz, M.; Chen, X.; Seo, Y. [(11)C]acetate PET Imaging is not Always Associated with Increased Lipogenesis in Hepatocellular Carcinoma in Mice. Mol. Imaging Biol. 2016, 18, 360–367. [Google Scholar] [CrossRef] [PubMed]
- DeGrado, T.R.; Bhattacharyya, F.; Pandey, M.K.; Belanger, A.P.; Wang, S. Synthesis and preliminary evaluation of 18-(18)F-fluoro-4-thia-oleate as a PET probe of fatty acid oxidation. J. Nucl. Med. 2010, 51, 1310–1317. [Google Scholar] [CrossRef] [PubMed]
- DeGrado, T.R.; Kitapci, M.T.; Wang, S.; Ying, J.; Lopaschuk, G.D. Validation of 18F-fluoro-4-thia-palmitate as a PET probe for myocardial fatty acid oxidation: Effects of hypoxia and composition of exogenous fatty acids. J. Nucl. Med. 2006, 47, 173–181. [Google Scholar] [PubMed]
- DeGrado, T.R.; Wang, S.; Rockey, D.C. Preliminary evaluation of 15-[18F]fluoro-3-oxa-pentadecanoate as a PET tracer of hepatic fatty acid oxidation. J. Nucl. Med. 2000, 41, 1727–1736. [Google Scholar] [PubMed]
- Kinlaw, W.B.; Baures, P.W.; Lupien, L.E.; Davis, W.L.; Kuemmerle, N.B. Fatty Acids and Breast Cancer: Make Them on Site or Have Them Delivered. J. Cell Physiol. 2016, 231, 2128–2141. [Google Scholar] [CrossRef] [PubMed] [Green Version]
- Hu, X.; Wang, X.; Jia, F.; Tanaka, N.; Kimura, T.; Nakajima, T.; Sato, Y.; Moriya, K.; Koike, K.; Gonzalez, F.J.; et al. A trans-fatty acid-rich diet promotes liver tumorigenesis in HCV core gene transgenic mice. Carcinogenesis 2019. [Google Scholar] [CrossRef] [PubMed]
- Peck, B.; Schug, Z.T.; Zhang, Q.; Dankworth, B.; Jones, D.T.; Smethurst, E.; Patel, R.; Mason, S.; Jiang, M.; Saunders, R.; et al. Inhibition of fatty acid desaturation is detrimental to cancer cell survival in metabolically compromised environments. Cancer Metab. 2016, 4, 6. [Google Scholar] [CrossRef]
- Peck, B.; Schulze, A. Lipid desaturation—The next step in targeting lipogenesis in cancer? FEBS J. 2016, 283, 2767–2778. [Google Scholar] [CrossRef]
- Viallon, M.; Leporq, B.; Drinda, S.; de Toledo, F.W.; Galusca, B.; Ratiney, H.; Croisille, P. Chemical-Shift-Encoded Magnetic Resonance Imaging and Spectroscopy to Reveal Immediate and Long-Term Multi-Organs Composition Changes of a 14-Days Periodic Fasting Intervention: A Technological and Case Report. Front. Nutr. 2019, 6, 5. [Google Scholar] [CrossRef] [Green Version]
- Xie, G.; Wang, X.; Huang, F.; Zhao, A.; Chen, W.; Yan, J.; Zhang, Y.; Lei, S.; Ge, K.; Zheng, X.; et al. Dysregulated hepatic bile acids collaboratively promote liver carcinogenesis. Int. J. Cancer 2016, 139, 1764–1775. [Google Scholar] [CrossRef]
- Lagana, S.M.; Salomao, M.; Remotti, H.E.; Knisely, A.S.; Moreira, R.K. Bile salt export pump: A sensitive and specific immunohistochemical marker of hepatocellular carcinoma. Histopathology 2015, 66, 598–602. [Google Scholar] [CrossRef] [PubMed]
- Chen, T.; Xie, G.; Wang, X.; Fan, J.; Qiu, Y.; Zheng, X.; Qi, X.; Cao, Y.; Su, M.; Wang, X.; et al. Serum and urine metabolite profiling reveals potential biomarkers of human hepatocellular carcinoma. Mol. Cell Proteom. 2011, 10, M110–004945. [Google Scholar] [CrossRef]
- Talbot, J.N.; Fartoux, L.; Balogova, S.; Nataf, V.; Kerrou, K.; Gutman, F.; Huchet, V.; Ancel, D.; Grange, J.D.; Rosmorduc, O. Detection of hepatocellular carcinoma with PET/CT: A prospective comparison of 18F-fluorocholine and 18F-FDG in patients with cirrhosis or chronic liver disease. J. Nucl. Med. 2010, 51, 1699–1706. [Google Scholar] [CrossRef] [PubMed]
- Gougelet, A.; Sartor, C.; Senni, N.; Calderaro, J.; Fartoux, L.; Lequoy, M.; Wendum, D.; Talbot, J.N.; Prignon, A.; Chalaye, J.; et al. Hepatocellular Carcinomas With Mutational Activation of Beta-Catenin Require Choline and Can Be Detected by Positron Emission Tomography. Gastroenterology 2019, 157, 807–822. [Google Scholar] [CrossRef] [Green Version]
- Talbot, J.N.; Gutman, F.; Fartoux, L.; Grange, J.D.; Ganne, N.; Kerrou, K.; Grahek, D.; Montravers, F.; Poupon, R.; Rosmorduc, O. PET/CT in patients with hepatocellular carcinoma using [(18)F]fluorocholine: Preliminary comparison with [(18)F]FDG PET/CT. Eur. J. Nucl. Med. Mol. Imaging 2006, 33, 1285–1289. [Google Scholar] [CrossRef]
- Kwee, S.A.; Wong, L.L.; Hernandez, B.Y.; Chan, O.T.M.; Sato, M.M.; Tsai, N. Chronic Liver Disease and the Detection of Hepatocellular Carcinoma by [(18)F]fluorocholine PET/CT. Diagnostics 2015, 5, 189–199. [Google Scholar] [CrossRef]
- Wong, C.M.; Fan, S.T.; Ng, I.O. beta-Catenin mutation and overexpression in hepatocellular carcinoma: Clinicopathologic and prognostic significance. Cancer 2001, 92, 136–145. [Google Scholar] [CrossRef]
- Senni, N.; Savall, M.; Cabrerizo Granados, D.; Alves-Guerra, M.C.; Sartor, C.; Lagoutte, I.; Gougelet, A.; Terris, B.; Gilgenkrantz, H.; Perret, C.; et al. beta-catenin-activated hepatocellular carcinomas are addicted to fatty acids. Gut 2019, 68, 322–334. [Google Scholar] [CrossRef]
- Gromski, P.S.; Muhamadali, H.; Ellis, D.I.; Xu, Y.; Correa, E.; Turner, M.L.; Goodacre, R. A tutorial review: Metabolomics and partial least squares-discriminant analysis—A marriage of convenience or a shotgun wedding. Anal. Chim Acta 2015, 879, 10–23. [Google Scholar] [CrossRef]


| Females (n = 12) | Males (n = 36) | p-Value | |
|---|---|---|---|
| Age, years, mean (SD) | 61.58 (13.14) | 62.78 (10.32) | 0.747 |
| HBV Infected, number (%) | 3 (25.0) | 10 (27.8) | 1.00 |
| HCV Infected, number (%) | 3 (25.0) | 18 (50.0) | 0.240 |
| Tumor Grade, number (%) | 0.259 | ||
| G1 | 2 (16.7) | 2 (5.6) | |
| G2 | 3 (25.0) | 20 (55.6) | |
| G3 | 5 (41.7) | 11 (30.6) | |
| G4 | 2 (16.7) | 3 (8.3) | |
| AFP level, ng/dL, mean (SD) | 2409.2 (3897.3) | 886.8 (3281.8) | 0.191 |
| Child-Pugh Score, mean (SD) | 5.50 (0.67) | 5.53 (1.08) | 0.934 |
| MELD Score, mean (SD) | 8.00 (1.41) | 8.82 (2.52) | 0.296 |
| Metabolite Class | Number of Metabolites in Signature | Area Under Curve (AUC) | Lower Bound 95% CI | Upper Bound 95% CI |
|---|---|---|---|---|
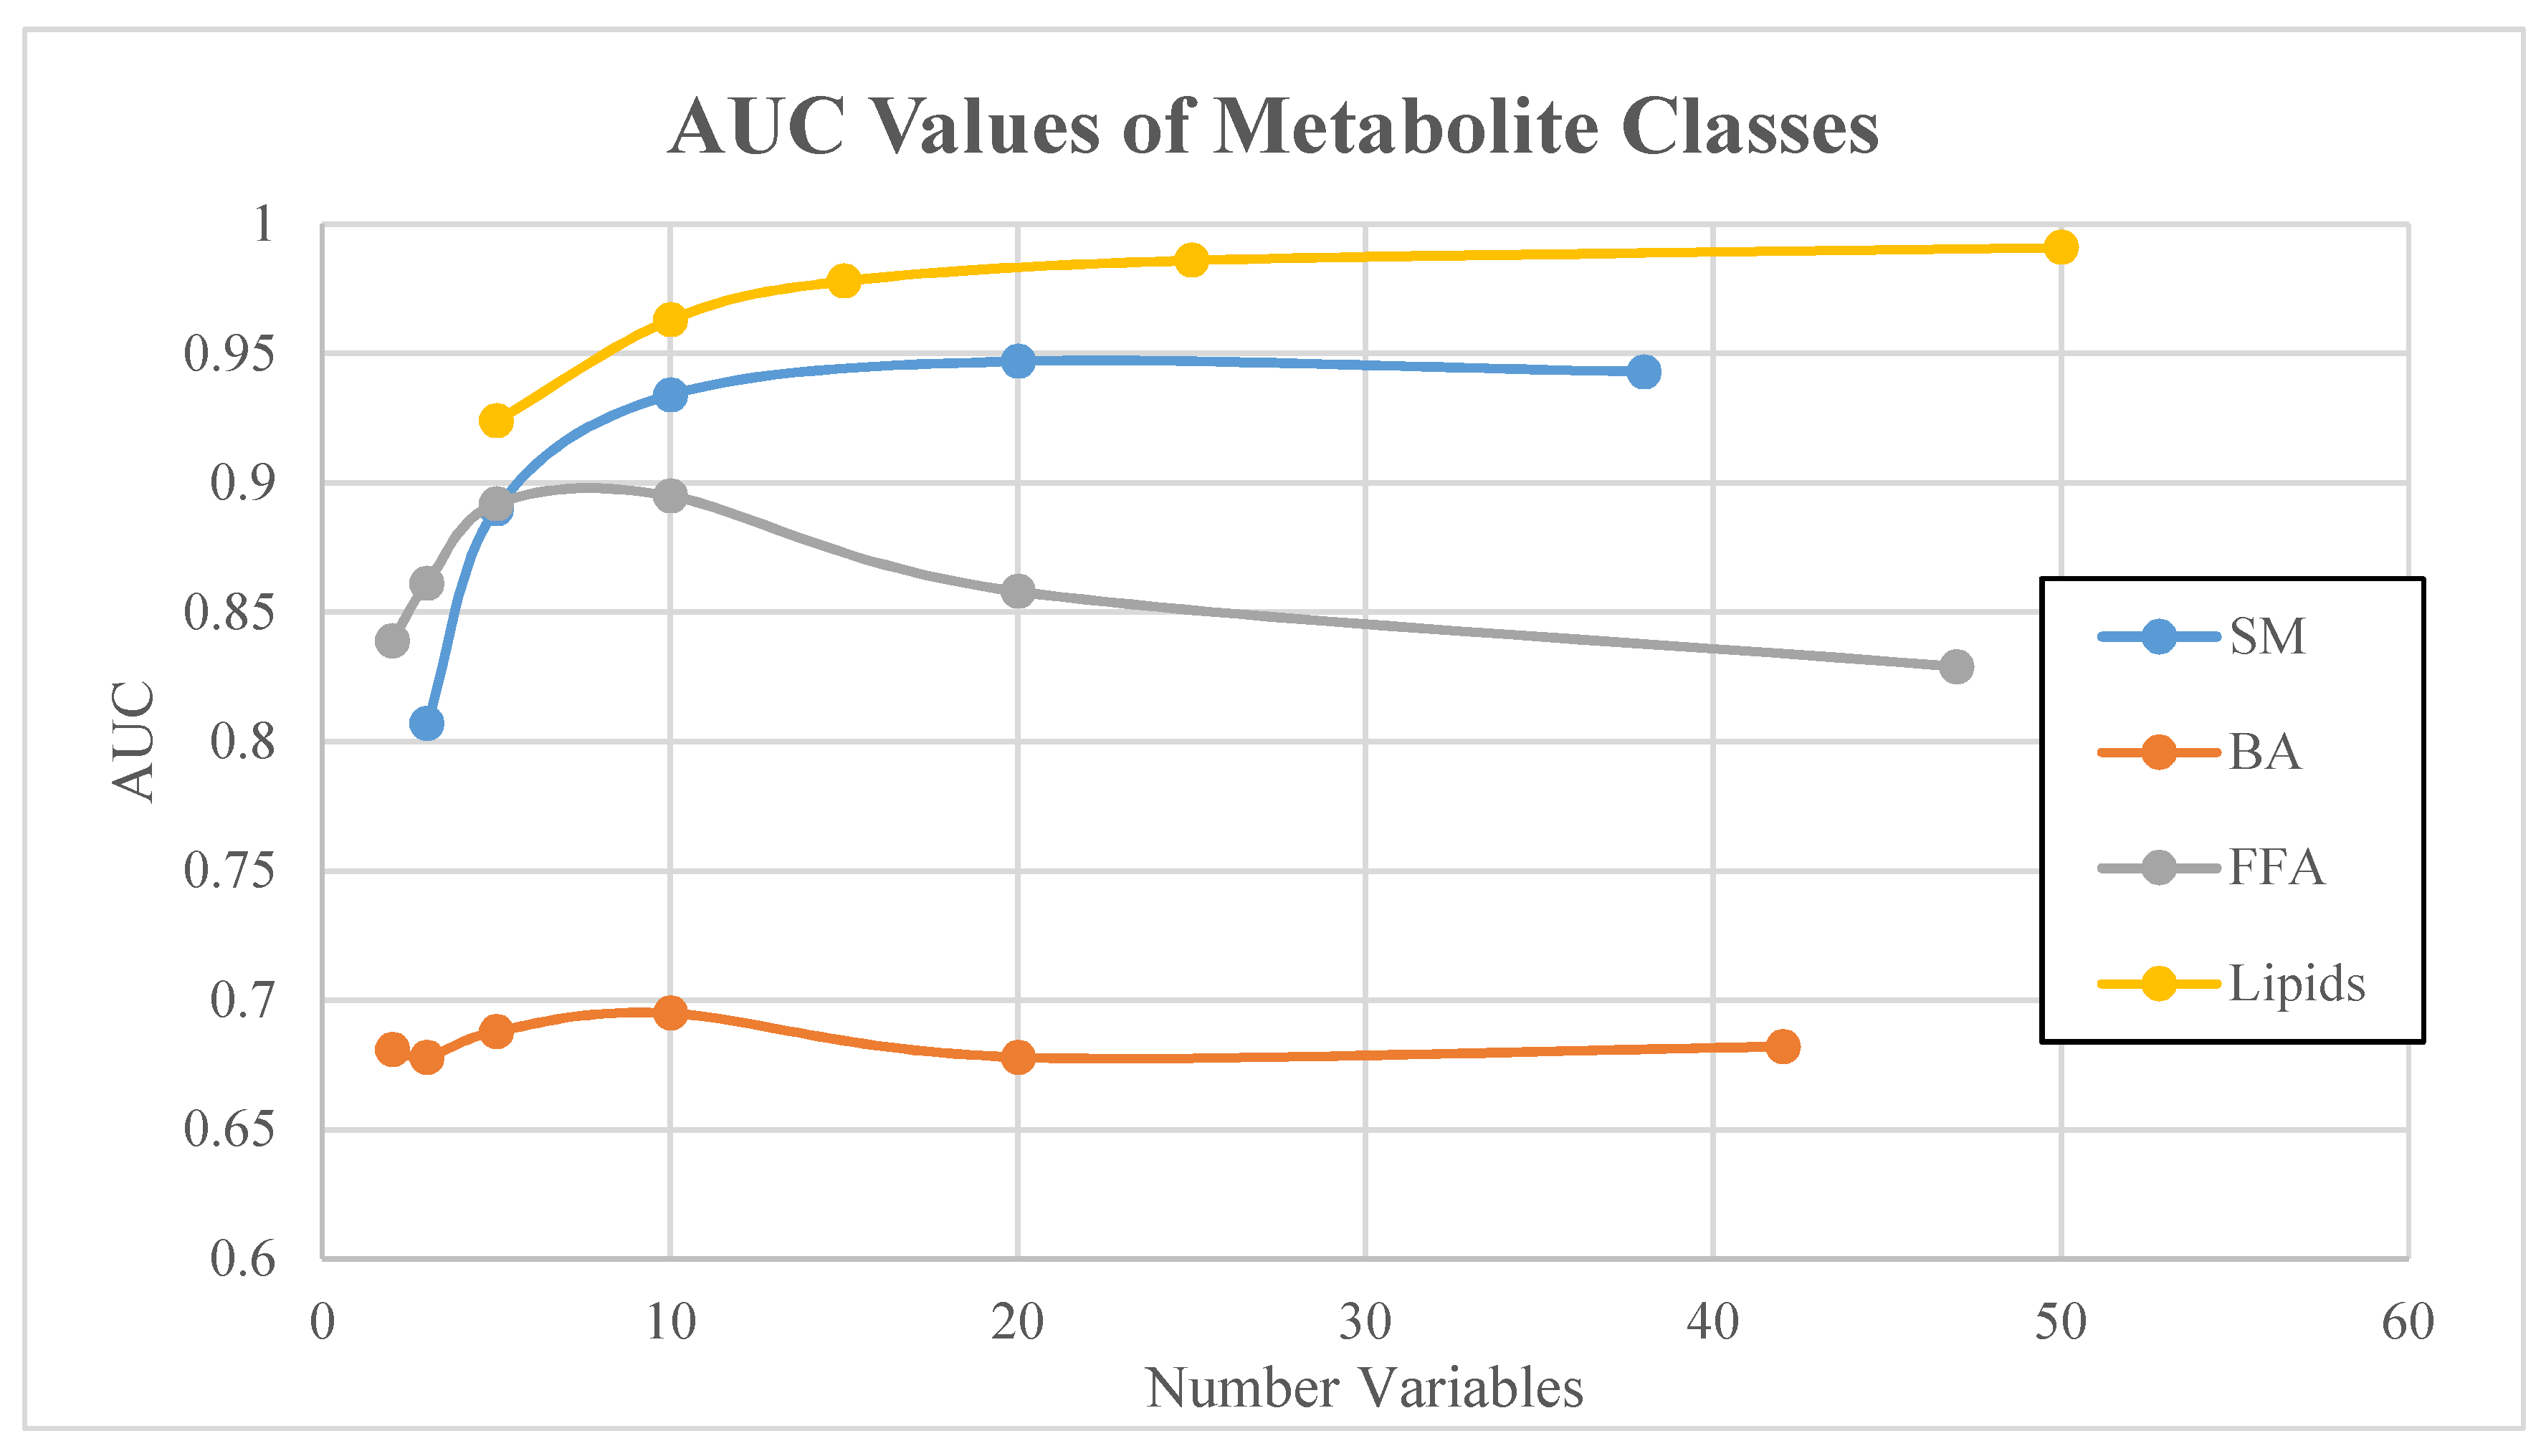
| Small molecules | 3 | 0.807 | 0.669 | 0.922 |
| 5 | 0.89 | 0.752 | 0.989 | |
| 10 | 0.934 | 0.843 | 0.991 | |
| 20 | 0.947 | 0.838 | 1 | |
| 38 | 0.943 | 0.839 | 1 | |
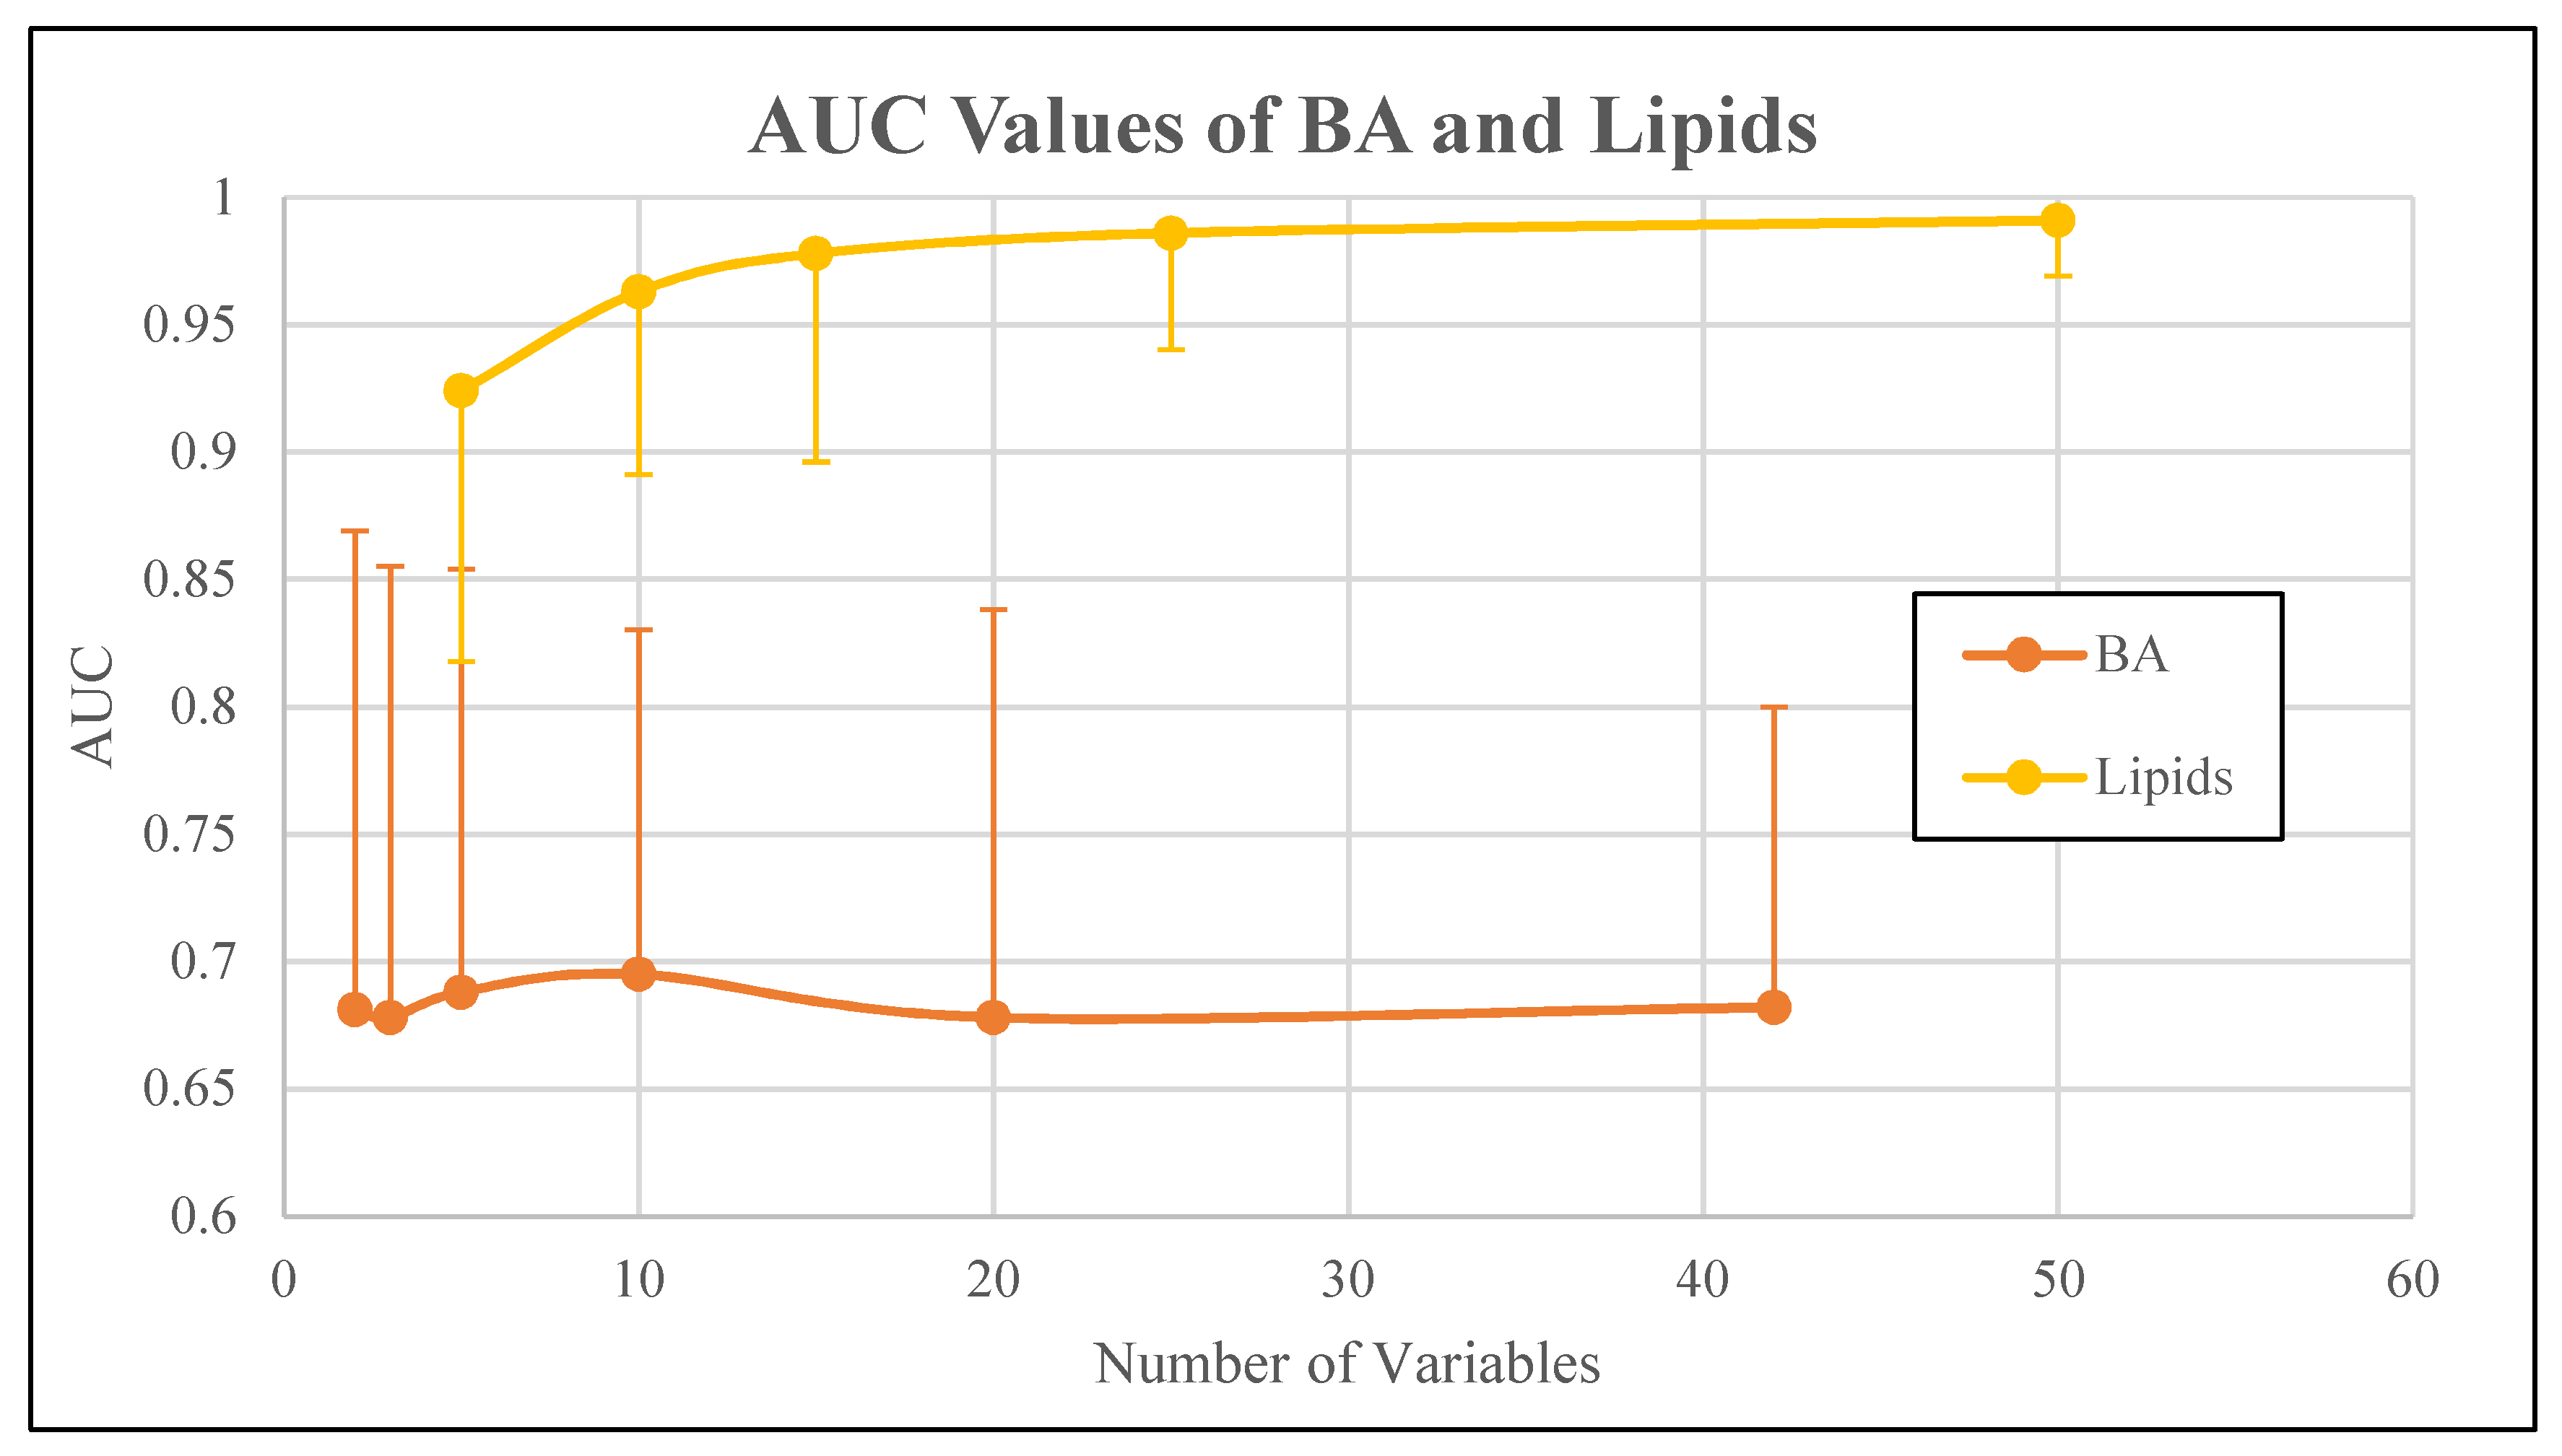
| Bile acids | 2 | 0.681 | 0.44 | 0.869 |
| 3 | 0.678 | 0.448 | 0.855 | |
| 5 | 0.688 | 0.446 | 0.854 | |
| 10 | 0.695 | 0.51 | 0.83 | |
| 20 | 0.678 | 0.498 | 0.838 | |
| 42 | 0.682 | 0.514 | 0.8 | |
| Free fatty acids | 2 | 0.839 | 0.63 | 0.975 |
| 3 | 0.861 | 0.593 | 0.979 | |
| 5 | 0.892 | 0.676 | 0.977 | |
| 10 | 0.895 | 0.779 | 0.969 | |
| 20 | 0.858 | 0.731 | 0.953 | |
| 47 | 0.829 | 0.712 | 0.927 | |
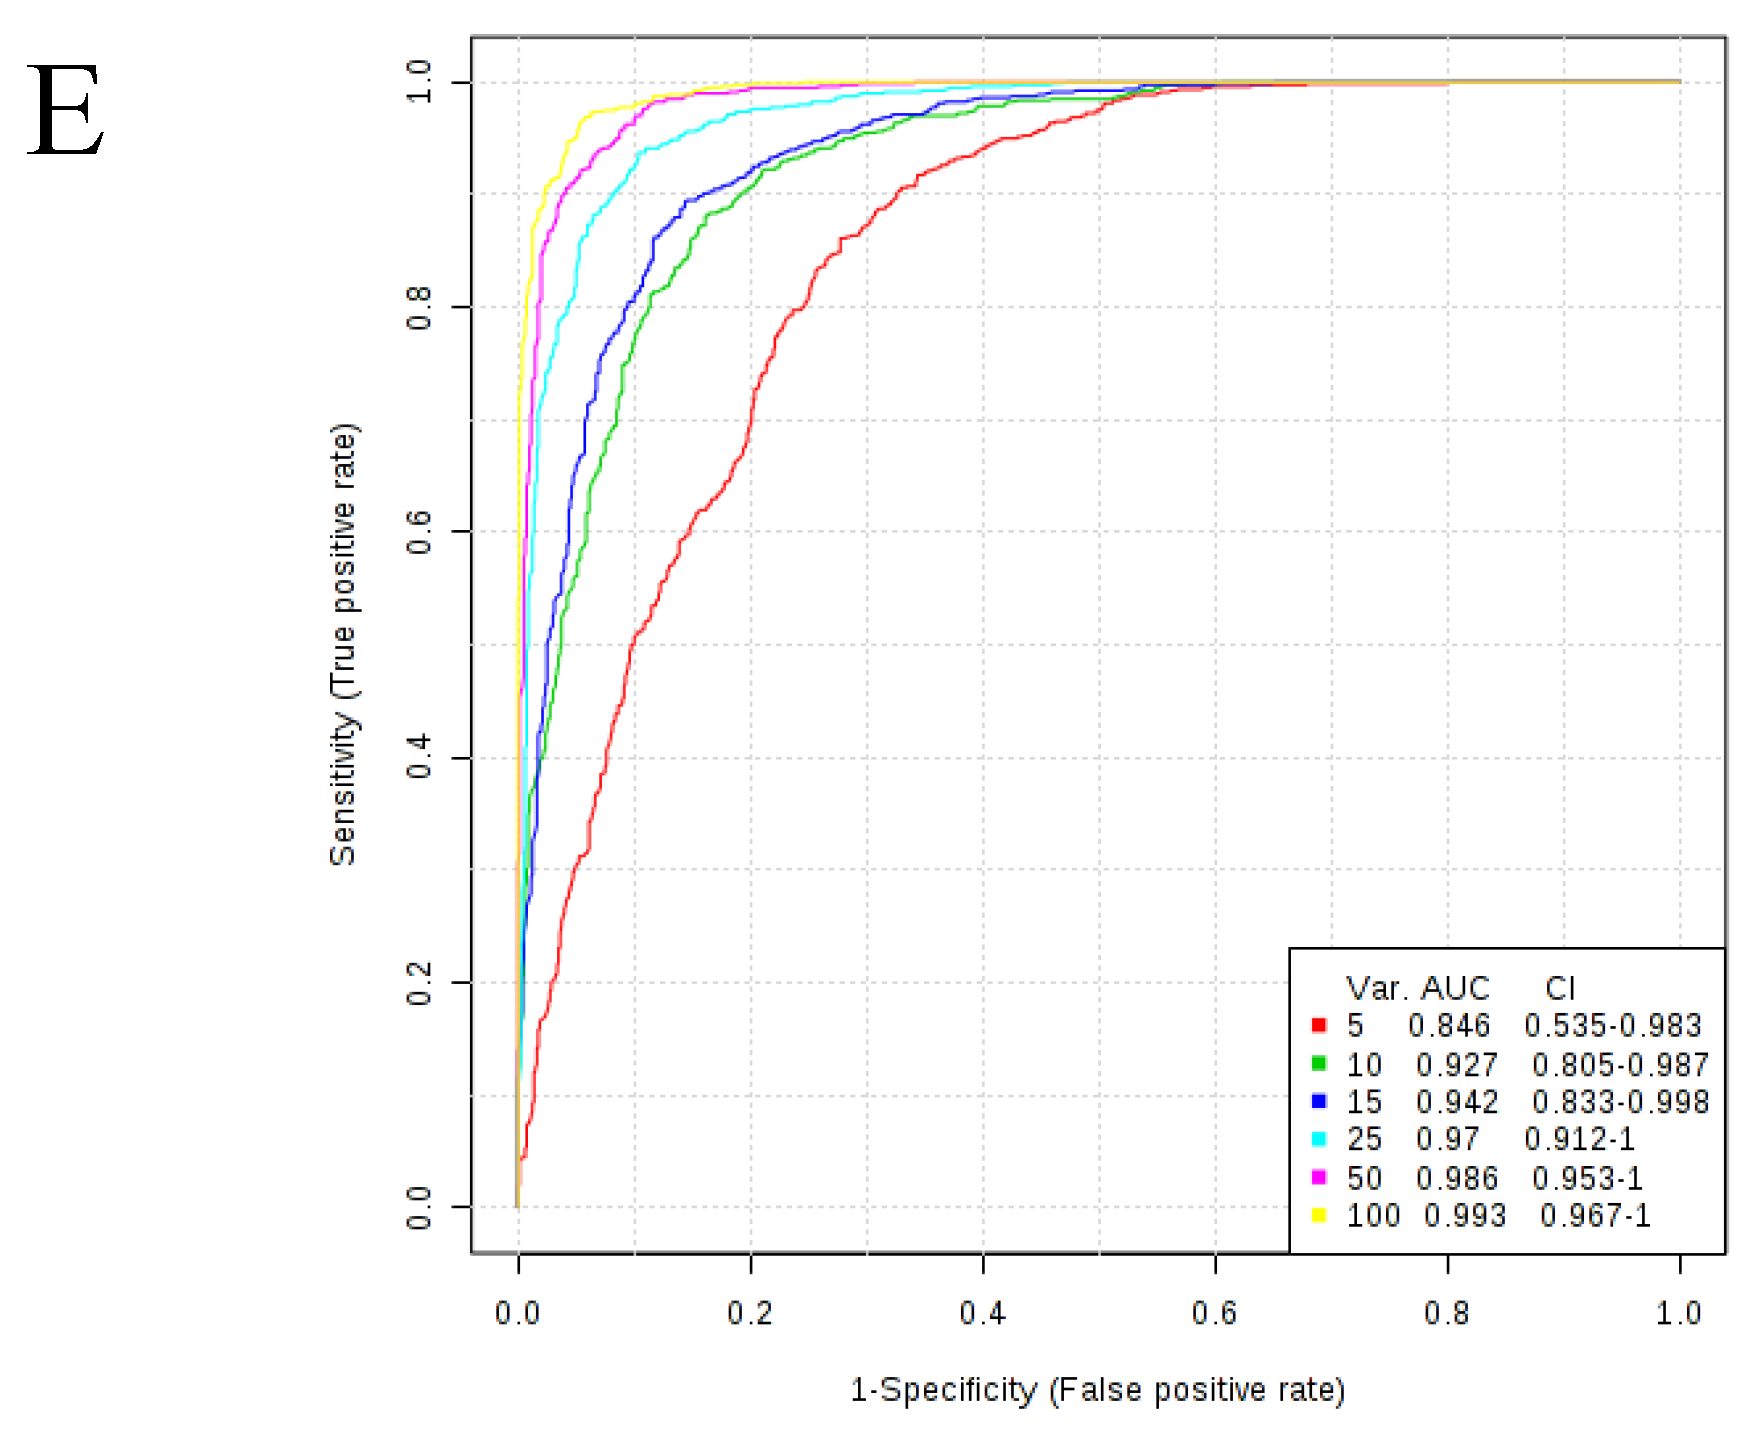
| Lipids | 5 | 0.924 | 0.818 | 0.979 |
| 10 | 0.963 | 0.891 | 0.999 | |
| 15 | 0.978 | 0.896 | 1 | |
| 25 | 0.986 | 0.94 | 1 | |
| 50 | 0.991 | 0.969 | 1 |
| Small Molecules | |||||
| Rank | Metabolite | Fold Change | AUC | p-Value | FDR |
| 1 | Dimethylglycine | 0.63 | 0.74 | 1.59 × 10−05 | 2.41 × 10−04 |
| 2 | 6-Phosphogluconic acid | 0.518 | 0.689 | 1.51 × 10−03 | 8.18 × 10−03 |
| 3 | Pyruvic acid | 2.131 | 0.755 | 3.75 × 10−06 | 7.13 × 10−05 |
| 4 | D-2-Hydroxyglutaric acid | 2.273 | 0.721 | 1.30 × 10−03 | 7.58 × 10−03 |
| 5 | L-alpha-aminobutyric acid | 0.652 | 0.692 | 2.22 × 10−03 | 9.92 × 10−03 |
| 6 | Glycerophosphocholine | 0.764 | 0.696 | 1.03 × 10−03 | 7.11 × 10−03 |
| 7 | Glyceric acid | 1.291 | 0.144 | 4.66 × 10−01 | 6.65 × 10−01 |
| 8 | N-Acetylornithine | 1.223 | 0.22 | 9.46 × 10−02 | 2.24 × 10−01 |
| 9 | Creatine | 0.644 | 0.771 | 9.07 × 10−07 | 2.30 × 10−05 |
| 10 | Malic acid | 0.478 | 0.834 | 3.27 × 10−08 | 2.49 × 10−06 |
| Free Fatty Acids | |||||
| Rank | Metabolite | Fold Change | AUC | p-Value | FDR |
| 1 | Alpha-Linolenic acid | 0.364 | 0.783 | 2.83 × 10−07 | 1.33 × 10−05 |
| 2 | Palmitelaidic acid | 1.749 | 0.738 | 1.84 × 10−05 | 3.61 × 10−04 |
| 3 | Butyric acid | 1.79 | 0.72 | 3.07 × 10−05 | 3.61 × 10−04 |
| 4 | 3-Hydroxybutyric acid | 0.626 | 0.571 | 1.08 × 10−01 | 2.55 × 10−01 |
| 5 | 10Z-Heptadecenoic acid | 1.395 | 0.689 | 1.02 × 10−03 | 9.56 × 10−03 |
| 6 | Gamma-Linolenic acid | 0.989 | 0.552 | 5.25 × 10−01 | 7.47 × 10−01 |
| 7 | 8,11,14-Eicosatrienoic acid | 1.853 | 0.736 | 2.47 × 10−05 | 3.61 × 10−04 |
| 8 | Valeric acid | 1.478 | 0.609 | 7.48 × 10−02 | 1.95 × 10−01 |
| 9 | Undecanoic acid | 0.837 | 0.6 | 5.93 × 10−02 | 1.86 × 10−01 |
| 10 | Docosahexaenoic acid | 1.105 | 0.527 | 8.73 × 10−01 | 9.33 × 10−01 |
| Bile Acids | |||||
| Rank | Metabolite | Fold Change | AUC | p-Value | FDR |
| 1 | Chenodeoxycholic acid | 4.57 | 0.752 | 2.93 × 10−05 | 6.16 × 10−04 |
| 2 | Glycholic acid | 0.627 | 0.735 | 1.67 × 10−05 | 6.16 × 10−04 |
| 3 | Dihydroxycholestanoic acid | 1.339 | 0.544 | 5.90 × 10−01 | 8.54 × 10−01 |
| 4 | 7-ketolithocholic acid | 1.603 | 0.608 | 3.12 × 10−02 | 1.09 × 10−01 |
| 5 | Cholestenoic acid | 1.057 | 0.631 | 3.98 × 10−01 | 7.36 × 10−01 |
| 6 | 6,7-diketolithocholic acid | 0.91 | 0.577 | 1.49 × 10−01 | 4.48 × 10−01 |
| 7 | Deoxycholic acid | 5.751 | 0.578 | 3.12 × 10−02 | 1.09 × 10−01 |
| 8 | Tauroursodeoxycholic acid | 1.552 | 0.681 | 8.26 × 10−01 | 9.84 × 10−01 |
| 9 | Chenodeoxycholic acid 24-glucuronide | 1.388 | 0.553 | 7.96 × 10−01 | 9.84 × 10−01 |
| 10 | Lithocholic acid 3-sulfate | 1.177 | 0.614 | 2.02 × 10−02 | 1.03 × 10−01 |
| Phospholipids | |||||
| Rank | Metabolite | Fold Change | AUC | p-Value | FDR |
| 1 | PC aa C26:0 | 0.603 | 0.782 | 6.62 × 10−07 | 6.44 × 10−06 |
| 2 | PC ae C34:0 | 3.037 | 0.873 | 5.43 × 10⁻¹² | 2.90 × 10⁻¹⁰ |
| 3 | PC ae C34:2 | 0.836 | 0.658 | 3.93 × 10−04 | 1.31 × 10−03 |
| 4 | PC aa C32:0 | 1.312 | 0.653 | 1.46 × 10−02 | 2.95 × 10−02 |
| 5 | PC aa C38:6 | 0.473 | 0.918 | 1.37 × 10⁻¹³ | 1.46 × 10⁻¹¹ |
| 6 | PC aa C42:2 | 1.386 | 0.818 | 4.78 × 10−06 | 2.56 × 10−05 |
| 7 | PC aa C40:5 | 0.808 | 0.722 | 1.80 × 10−04 | 6.41 × 10−04 |
| 8 | PC aa C34:3 | 0.687 | 0.741 | 8.23 × 10−06 | 4.19 × 10−05 |
| 9 | PC ae C32:2 | 1.673 | 0.703 | 1.72 × 10−04 | 6.33 × 10−04 |
| 10 | PC ae C44:3 | 1.49 | 0.803 | 3.13 × 10−08 | 5.58 × 10−07 |
© 2019 by the authors. Licensee MDPI, Basel, Switzerland. This article is an open access article distributed under the terms and conditions of the Creative Commons Attribution (CC BY) license (http://creativecommons.org/licenses/by/4.0/).
Share and Cite
Evangelista, E.B.; Kwee, S.A.; Sato, M.M.; Wang, L.; Rettenmeier, C.; Xie, G.; Jia, W.; Wong, L.L. Phospholipids are A Potentially Important Source of Tissue Biomarkers for Hepatocellular Carcinoma: Results of a Pilot Study Involving Targeted Metabolomics. Diagnostics 2019, 9, 167. https://0-doi-org.brum.beds.ac.uk/10.3390/diagnostics9040167
Evangelista EB, Kwee SA, Sato MM, Wang L, Rettenmeier C, Xie G, Jia W, Wong LL. Phospholipids are A Potentially Important Source of Tissue Biomarkers for Hepatocellular Carcinoma: Results of a Pilot Study Involving Targeted Metabolomics. Diagnostics. 2019; 9(4):167. https://0-doi-org.brum.beds.ac.uk/10.3390/diagnostics9040167
Chicago/Turabian StyleEvangelista, Erin B., Sandi A. Kwee, Miles M. Sato, Lu Wang, Christoph Rettenmeier, Guoxiang Xie, Wei Jia, and Linda L. Wong. 2019. "Phospholipids are A Potentially Important Source of Tissue Biomarkers for Hepatocellular Carcinoma: Results of a Pilot Study Involving Targeted Metabolomics" Diagnostics 9, no. 4: 167. https://0-doi-org.brum.beds.ac.uk/10.3390/diagnostics9040167