
Alignment of Qx100/Qx200 Droplet Digital (Bio-Rad) and QuantStudio 3D (Thermofisher) Digital PCR for Quantification of BCR-ABL1 in Ph+ Chronic Myeloid Leukemia

 ,
, 
 ,
,  ,
,  , ,
, , 
Abstract
:1. Introduction
2. Materials and Methods
2.1. Sample Characteristics, RNA Extraction and cDNA Synthesis
2.2. Digital PCR Platforms and Analysis
2.2.1. Lab1: Qx100/Qx200 Droplet Digital PCR System
2.2.2. Lab2: QuantStudio 3D Digital PCR System
2.3. Statistical Analysis
3. Results
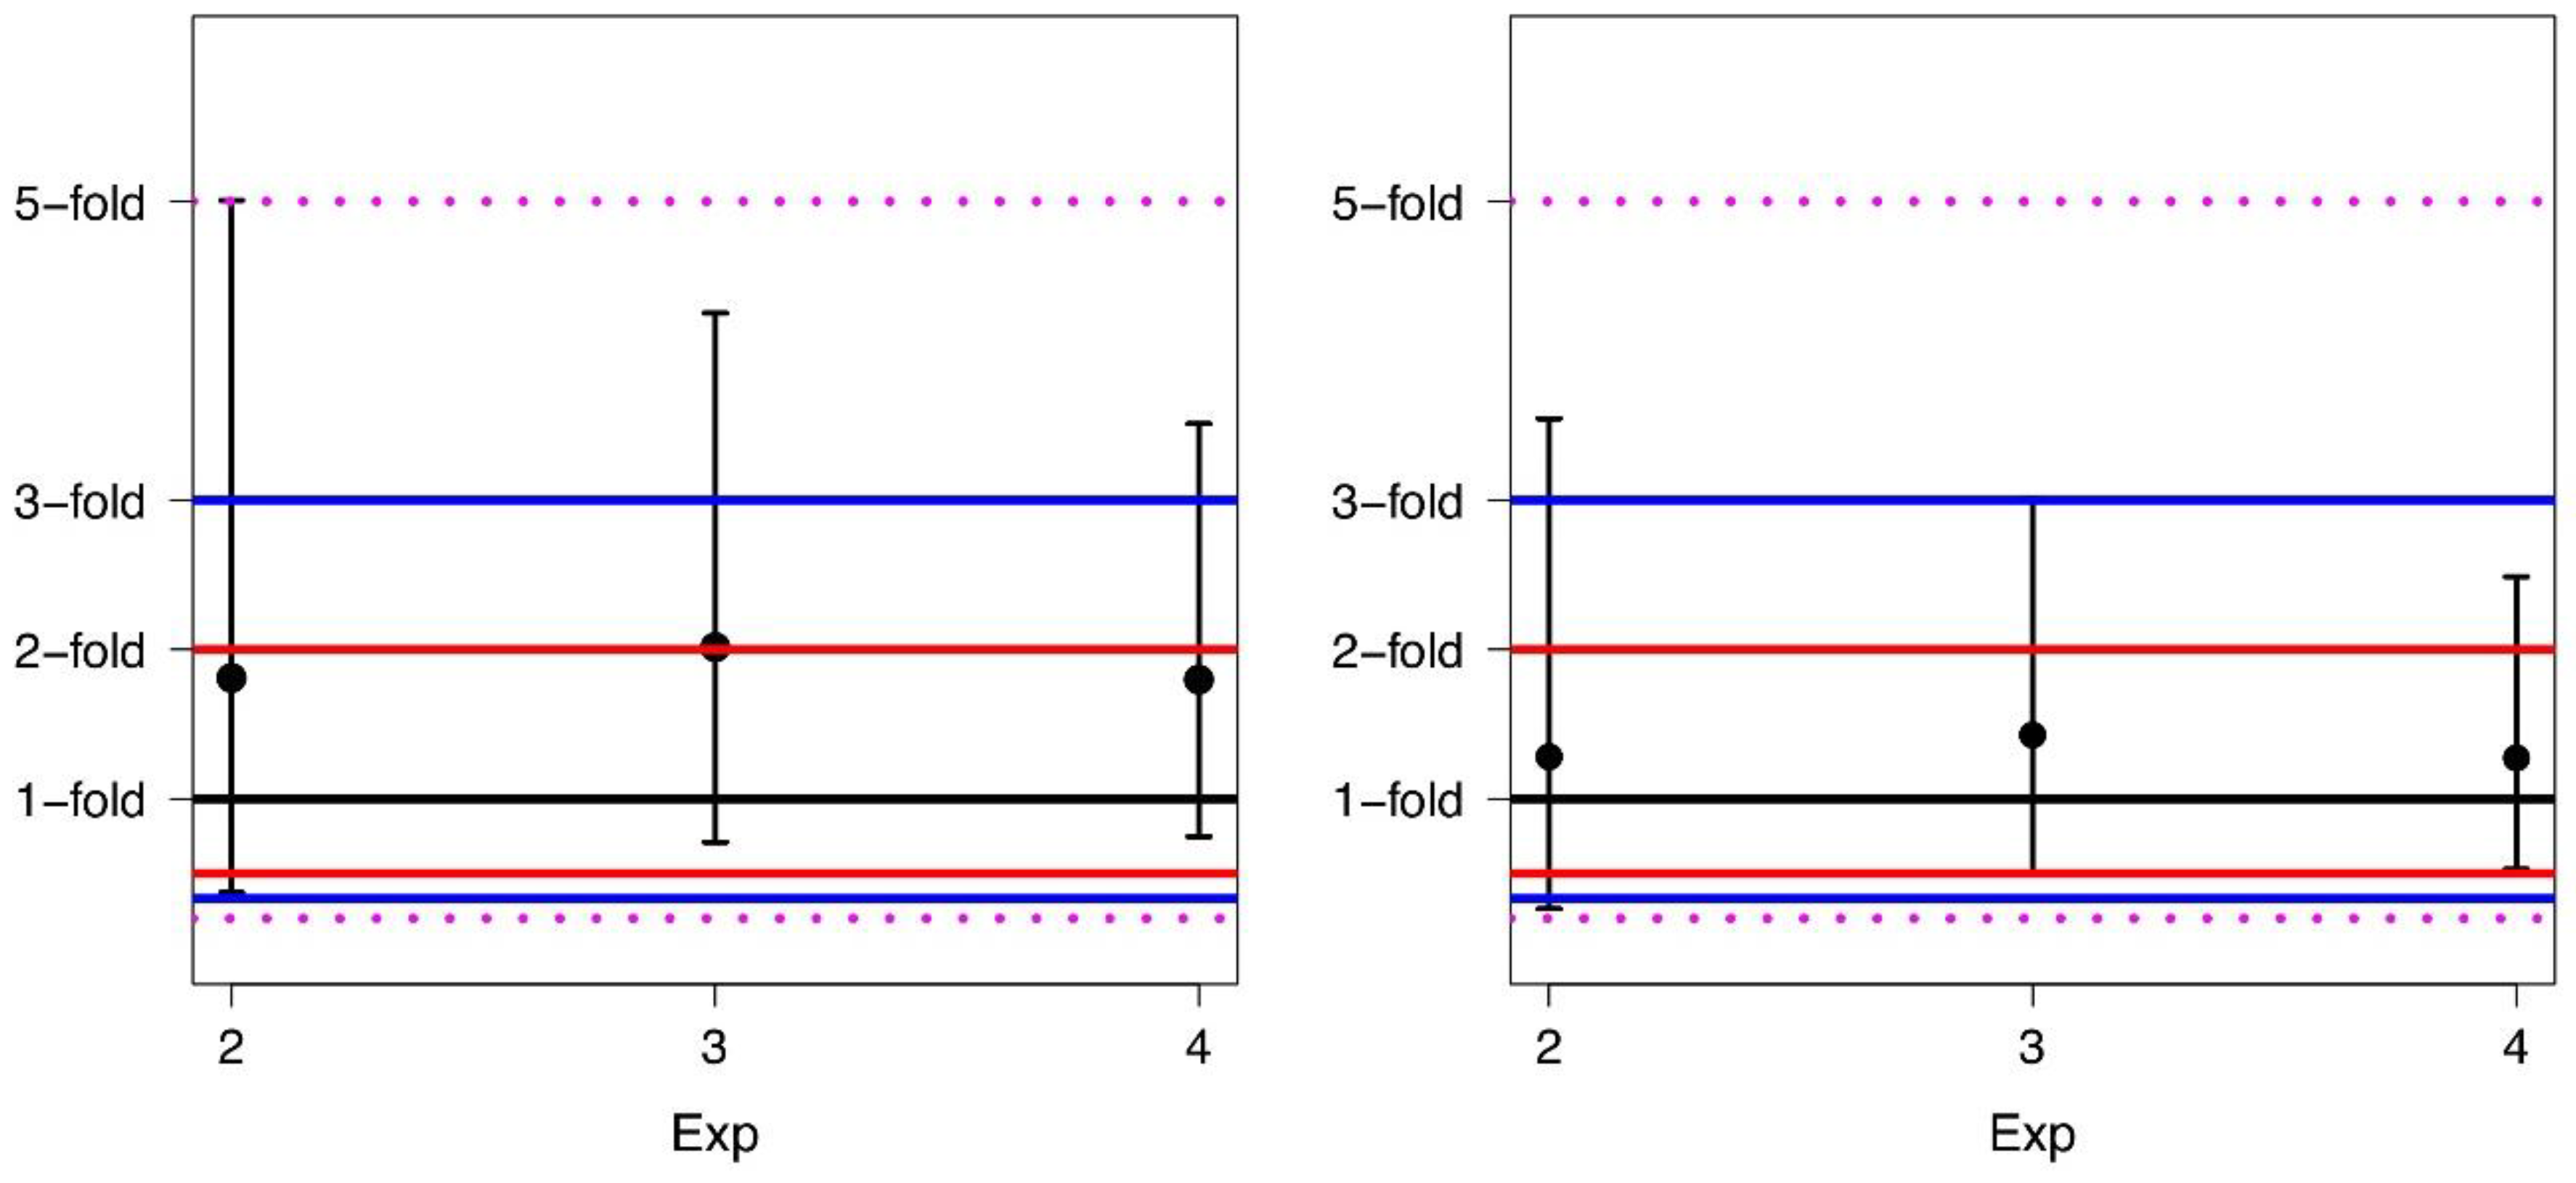
- (a)
- more than 50% of the values lie within a 2-fold range;
- (b)
- more than 75% of the values lie within a 3-fold range;
- (c)
- more than 90% of the values lie within a 5-fold range.
4. Discussion
Supplementary Materials
Author Contributions
Funding
Institutional Review Board Statement
Informed Consent Statement
Data Availability Statement
Conflicts of Interest
References
- Kantarjian, H.; O’Brien, S.; Jabbour, E.; Garcia-Manero, G.; Quintas-Cardama, A.; Shan, J.; Rios, M.B.; Ravandi, F.; Faderl, S.; Kadia, T.; et al. Improved survival in chronic myeloid leukemia since the introduction of imatinib therapy: A single-institution historical experience. Blood 2012, 119, 1981–1987. [Google Scholar] [CrossRef]
- Bower, H.; Björkholm, M.; Dickman, P.W.; Höglund, M.; Lambert, P.C.; Andersson, T.M.-L. Life Expectancy of Patients With Chronic Myeloid Leukemia Approaches the Life Expectancy of the General Population. J. Clin. Oncol. 2016, 34, 2851–2857. [Google Scholar] [CrossRef] [PubMed] [Green Version]
- Hehlmann, R.; Hochhaus, A.; Baccarani, M. Chronic myeloid leukaemia. Lancet 2007, 370, 342–350. [Google Scholar] [CrossRef]
- Cross, N.C.P.; White, H.; Colomer, D.; Ehrencrona, H.; Foroni, L.; Gottardi, E.; Lange, T.; Lion, T.; Polakova, K.M.; Dulucq, S.; et al. Laboratory recommendations for scoring deep molecular responses following treatment for chronic myeloid leukemia. Leuk. 2015, 29, 999–1003. [Google Scholar] [CrossRef] [PubMed] [Green Version]
- Baccarani, M.; Deininger, M.W.; Rosti, G.; Hochhaus, A.; Soverini, S.; Apperley, J.F.; Cervantes, F.; Clark, R.E.; Cortes, J.E.; Guilhot, F.; et al. European LeukemiaNet recommendations for the management of chronic myeloid leukemia: 2013. Blood 2013, 122, 872–884. [Google Scholar] [CrossRef] [PubMed]
- Baccarani, M.; Castagnetti, F.; Gugliotta, G.; Rosti, G. A review of the European LeukemiaNet recommendations for the management of CML. Ann. Hematol. 2015, 94, 141–147. [Google Scholar] [CrossRef] [PubMed]
- Mahon, F.-X. Discontinuation of tyrosine kinase therapy in CML. Ann. Hematol. 2015, 94, 187–193. [Google Scholar] [CrossRef] [PubMed]
- Huggett, J.F.; Cowen, S.; Foy, C.A. Considerations for Digital PCR as an Accurate Molecular Diagnostic Tool. Clin. Chem. 2015, 61, 79–88. [Google Scholar] [CrossRef] [Green Version]
- Cao, L.; Cui, X.; Hu, J.; Li, Z.; Choi, J.R.; Yang, Q.; Lin, M.; Hui, L.Y.; Xu, F. Advances in digital polymerase chain reaction (dPCR) and its emerging biomedical applications. Biosens. Bioelectron. 2017, 90, 459–474. [Google Scholar] [CrossRef]
- Goh, H.-G.; Lin, M.; Fukushima, T.; Saglio, G.; Kim, D.; Choi, S.-Y.; Kim, S.-H.; Lee, J.; Lee, Y.-S.; Oh, S.-M.; et al. Sensitive quantitation of minimal residual disease in chronic myeloid leukemia using nanofluidic digital polymerase chain reaction assay. Leuk. Lymphoma 2011, 52, 896–904. [Google Scholar] [CrossRef]
- Bhat, S.; Herrmann, J.; Armishaw, P.; Corbisier, P.; Emslie, K.R. Single molecule detection in nanofluidic digital array enables accurate measurement of DNA copy number. Anal. Bioanal. Chem. 2009, 394, 457–467. [Google Scholar] [CrossRef] [PubMed]
- Pinheiro, L.B.; Coleman, V.A.; Hindson, C.M.; Herrmann, J.; Hindson, B.J.; Bhat, S.; Emslie, K.R. Evaluation of a Droplet Digital Polymerase Chain Reaction Format for DNA Copy Number Quantification. Anal. Chem. 2011, 84, 1003–1011. [Google Scholar] [CrossRef] [PubMed]
- Jennings, L.J.; George, D.; Czech, J.; Yu, M.; Joseph, L. Detection and Quantification of BCR-ABL1 Fusion Transcripts by Droplet Digital PCR. J. Mol. Diagn. 2014, 16, 174–179. [Google Scholar] [CrossRef] [PubMed]
- Dongngam, C.; Chareonsirisuthigul, T.; Limsuwanachot, N. Development of highly sensitive detection for BCR-ABL transcripts in chronic myeloid leukemia by droplet digital PCR. Thai J. Genet. 2015, 8, 150–159. [Google Scholar]
- Mori, S.; Vagge, E.; Le Coutre, P.; Abruzzese, E.; Martino, B.; Pungolino, E.; Elena, C.; Pierri, I.; Assouline, S.; D’Emilio, A.; et al. Age and dPCR can predict relapse in CML patients who discontinued imatinib: The ISAV study. Am. J. Hematol. 2015, 90, 910–914. [Google Scholar] [CrossRef]
- Bernardi, S.; Ruggieri, G.; Malagola, M.; Cancelli, V.; Cattina, F.; Polverelli, N.; Zanaglio, C.; Perucca, S.; Re, F.; Montanelli, A.; et al. Digital PCR (Dpcr) a Step Forward to Detection and Quantification of Minimal Residual Disease (MRD) in Ph+/BCR-ABL1 Chronic Myeloid Leukemia (CML). J. Mol. Biomarkers Diagn. 2017, 8, 1–3. [Google Scholar] [CrossRef] [Green Version]
- Fava, C.; Varotto, M.; Berchialla, P.; Gottardi, E.; Daraio, F.; Lorenzatti, R.; Giugliano, E.; Barberio, D.; Iurlo, A.; Orlandi, E.; et al. Dropled Digital PCR May Have a Prognostic Value for Predicting Relapse after Imatinib Discontinuation. Clin. Lymphoma Myeloma Leuk. 2016, 16, S62–S63. [Google Scholar] [CrossRef]
- Diral, E.; Mori, S.; Antolini, L.; Abruzzese, E.; Le Coutre, P.; Martino, B.; Pungolino, E.; Elena, C.; Bergamaschi, M.; Assouline, S.; et al. Increased tumor burden in patients with chronic myeloid leukemia after 36 months of imatinib discontinuation. Blood 2020, 136, 2237–2240. [Google Scholar] [CrossRef]
- Shrivastava, A.; Gupta, V.B. Methods for the determination of limit of detection and limit of quantitation of the analytical methods. Chronicles Young-Sci. 2011, 2, 21. [Google Scholar] [CrossRef]
- Branford, S.; Fletcher, L.; Cross, N.C.P.; Müller, M.C.; Hochhaus, A.; Kim, D.-W.; Radich, J.P.; Saglio, G.; Pane, F.; Kamel-Reid, S.; et al. Desirable performance characteristics for BCR-ABL measurement on an international reporting scale to allow consistent interpretation of individual patient response and comparison of response rates between clinical trials. Blood 2008, 112, 3330–3338. [Google Scholar] [CrossRef] [PubMed]
- Bland, J.M.; Altman, D.G. Statistical methods for assessing agreement between two methods of clinical measurement. Lancet 1986, 1, 307–310. [Google Scholar] [CrossRef]
- Bland, J.M.; Altman, D.G. Measuring agreement in method comparison studies. Stat. Methods Med. Res. 1999, 8, 135–160. [Google Scholar] [CrossRef] [PubMed]
- Müller, M.C.; Cross, N.C.P.; Erben, P.; Schenk, T.; Hanfstein, B.; Ernst, T.; Hehlmann, R.; Branford, S.; Saglio, G.; Hochhaus, A. Harmonization of molecular monitoring of CML therapy in Europe. Leuk. 2009, 23, 1957–1963. [Google Scholar] [CrossRef] [PubMed] [Green Version]
- Hughes, T.P.; Kaeda, J.; Branford, S.; Rudzki, Z.; Hochhaus, A.; Hensley, M.L.; Gathmann, I.; Bolton, A.E.; Van Hoomissen, I.C.; Goldman, J.M.; et al. Frequency of Major Molecular Responses to Imatinib or Interferon Alfa plus Cytarabine in Newly Diagnosed Chronic Myeloid Leukemia. New Engl. J. Med. 2003, 349, 1423–1432. [Google Scholar] [CrossRef] [PubMed]
- White, H.E.; Matejtschuk, P.; Rigsby, P.; Gabert, J.; Lin, F.; Wang, Y.L.; Branford, S.; Müller, M.C.; Beaufils, N.; Beillard, E.; et al. Establishment of the first World Health Organization International Genetic Reference Panel for quantitation of BCR-ABL mRNA. Blood 2010, 116, e111–e117. [Google Scholar] [CrossRef] [PubMed] [Green Version]
- Cross, N.C.P.N.; White, H.; Ernst, T.; Welden, L.; Dietz, C.; Saglio, G.; Mahon, F.-X.; Wong, C.C.; Zheng, D.; Wong, S.; et al. Development and evaluation of a secondary reference panel for BCR-ABL1 quantification on the International Scale. Leuk. 2016, 30, 1844–1852. [Google Scholar] [CrossRef]
- Jovanovski, A.; Petiti, J.; Giugliano, E.; Gottardi, E.M.; Saglio, G.; Cilloni, D.; Fava, C. Standardization of BCR-ABL1 p210 Monitoring: From Nested to Digital PCR. Cancers 2020, 12, 3287. [Google Scholar] [CrossRef]
- Alikian, M.; Whale, A.S.; Akiki, S.; Piechocki, K.; Torrado, C.; Myint, T.; Cowen, S.; Griffiths, M.; Reid, A.G.; Apperley, J. RT-qPCR and RT-Digital PCR: A Comparison of Different Platforms for the Evaluation of Residual Disease in Chronic Myeloid Leukemia. Clin. Chem. 2017, 63, 525–531. [Google Scholar] [CrossRef] [Green Version]
- Hochhaus, A.; O’brien, S.G.; Guilhot, F.; Druker, B.J.; Branford, S.; Foroni, L.; Goldman, J.M.; Müller, M.C.; Radich, J.P.; Rudoltz, M.; et al. IRIS Investigators, Six-year follow-up of patients receiving imatinib for the first-line treatment of chronic myeloid leukemia. Leukemia 2009, 23, 1054–1061. [Google Scholar] [CrossRef] [Green Version]
- Gambacorti-Passerini, C.; Antolini, L.; Mahon, F.-X.; Guilhot, F.; Deininger, M.; Fava, C.; Nagler, A.; Della Casa, C.M.; Morra, E.; Abruzzese, E.; et al. Multicenter Independent Assessment of Outcomes in Chronic Myeloid Leukemia Patients Treated With Imatinib. J. Natl. Cancer Inst. 2011, 103, 553–561. [Google Scholar] [CrossRef]
- Hehlmann, R.; Lauseker, M.; Jung-Munkwitz, S.; Leitner, A.; Müller, M.C.; Pletsch, N.; Proetel, U.; Haferlach, C.; Schlegelberger, B.; Balleisen, L.; et al. Tolerability-Adapted Imatinib 800 mg/d Versus 400 mg/d Versus 400 mg/d Plus Interferon-α in Newly Diagnosed Chronic Myeloid Leukemia. J. Clin. Oncol. 2011, 29, 1634–1642. [Google Scholar] [CrossRef]
- Hoffmann, V.S.; Baccarani, M.; Hasford, J.; Lindoerfer, D.; Burgstaller, S.; Sertic, D.; Costeas, P.; Mayer, J.; Indrák, K.; Everaus, H.; et al. The EUTOS population-based registry: Incidence and clinical characteristics of 2904 CML patients in 20 European Countries. Leuk. 2015, 29, 1336–1343. [Google Scholar] [CrossRef] [PubMed]
- Saussele, S.; Richter, J.; Guilhot, J.; Gruber, F.X.; Hjorth-Hansen, H.; Almeida, A.; Janssen, J.J.W.M.; Mayer, J.; Koskenvesa, P.; Panayiotidis, P.; et al. Discontinuation of tyrosine kinase inhibitor therapy in chronic myeloid leukaemia (EURO-SKI): A prespecified interim analysis of a prospective, multicentre, non-randomised, trial. Lancet Oncol. 2018, 19, 747–757. [Google Scholar] [CrossRef] [Green Version]
- Chamoun, K.; Kantarjian, H.; Atallah, R.; Gonzalez, G.N.; Issa, G.C.; Rios, M.B.; Garcia-Manero, G.; Borthakur, G.; Ravandi, F.; Jain, N.; et al. Tyrosine kinase inhibitor discontinuation in patients with chronic myeloid leukemia: A single-institution experience. J. Hematol. Oncol. 2019, 12, 1–10. [Google Scholar] [CrossRef] [PubMed] [Green Version]
- Cilloni, D.; Petiti, J.; Rosso, V.; Andreani, G.; Dragani, M.; Fava, C.; Saglio, G. Digital PCR in Myeloid Malignancies: Ready to Replace Quantitative PCR? Int. J. Mol. Sci. 2019, 20, 2249. [Google Scholar] [CrossRef] [PubMed] [Green Version]
- Alikian, M.; Gale, R.P.; Apperley, J.F.; Foroni, L. Molecular techniques for the personalised management of patients with chronic myeloid leukaemia. Biomol. Detect. Quantif. 2017, 11, 4–20. [Google Scholar] [CrossRef] [PubMed]
- Bernardi, S.; Malagola, M.; Zanaglio, C.; Polverelli, N.; Eke, E.D.; D’Adda, M.; Farina, M.; Bucelli, C.; Scaffidi, L.; Toffoletti, E.; et al. Digital PCR improves the quantitation of DMR and the selection of CML candidates to TKIs discontinuation. Cancer Med. 2019, 8, 2041–2055. [Google Scholar] [CrossRef] [PubMed]
- Zanaglio, C.; Bernardi, S.; Gandolfi, L.; Farina, M.; Re, F.; Polverelli, N.; Zollner, T.; Turra, A.; Morello, E.; Malagola, M.; et al. RT-qPCR versus Digital PCR: How Do They Impact Differently on Clinical Management of Chronic Mye-loid Leukemia Patients? Case Rep. Oncol. 2020, 13, 1263–1269. [Google Scholar] [CrossRef] [PubMed]
- Bernardi, S.; Bonifacio, M.; Iurlo, A.; Zanaglio, C.; Tiribelli, M.; Binotto, G.; Abruzzese, E.; Russo, D. “Variant-specific discrepancy when quantitating BCR-ABL1 e13a2 and e14a2 transcripts using the Europe Against Cancer qPCR assay.” Is dPCR the key? Eur. J. Haematol. 2019, 103, 272–273. [Google Scholar] [CrossRef] [Green Version]


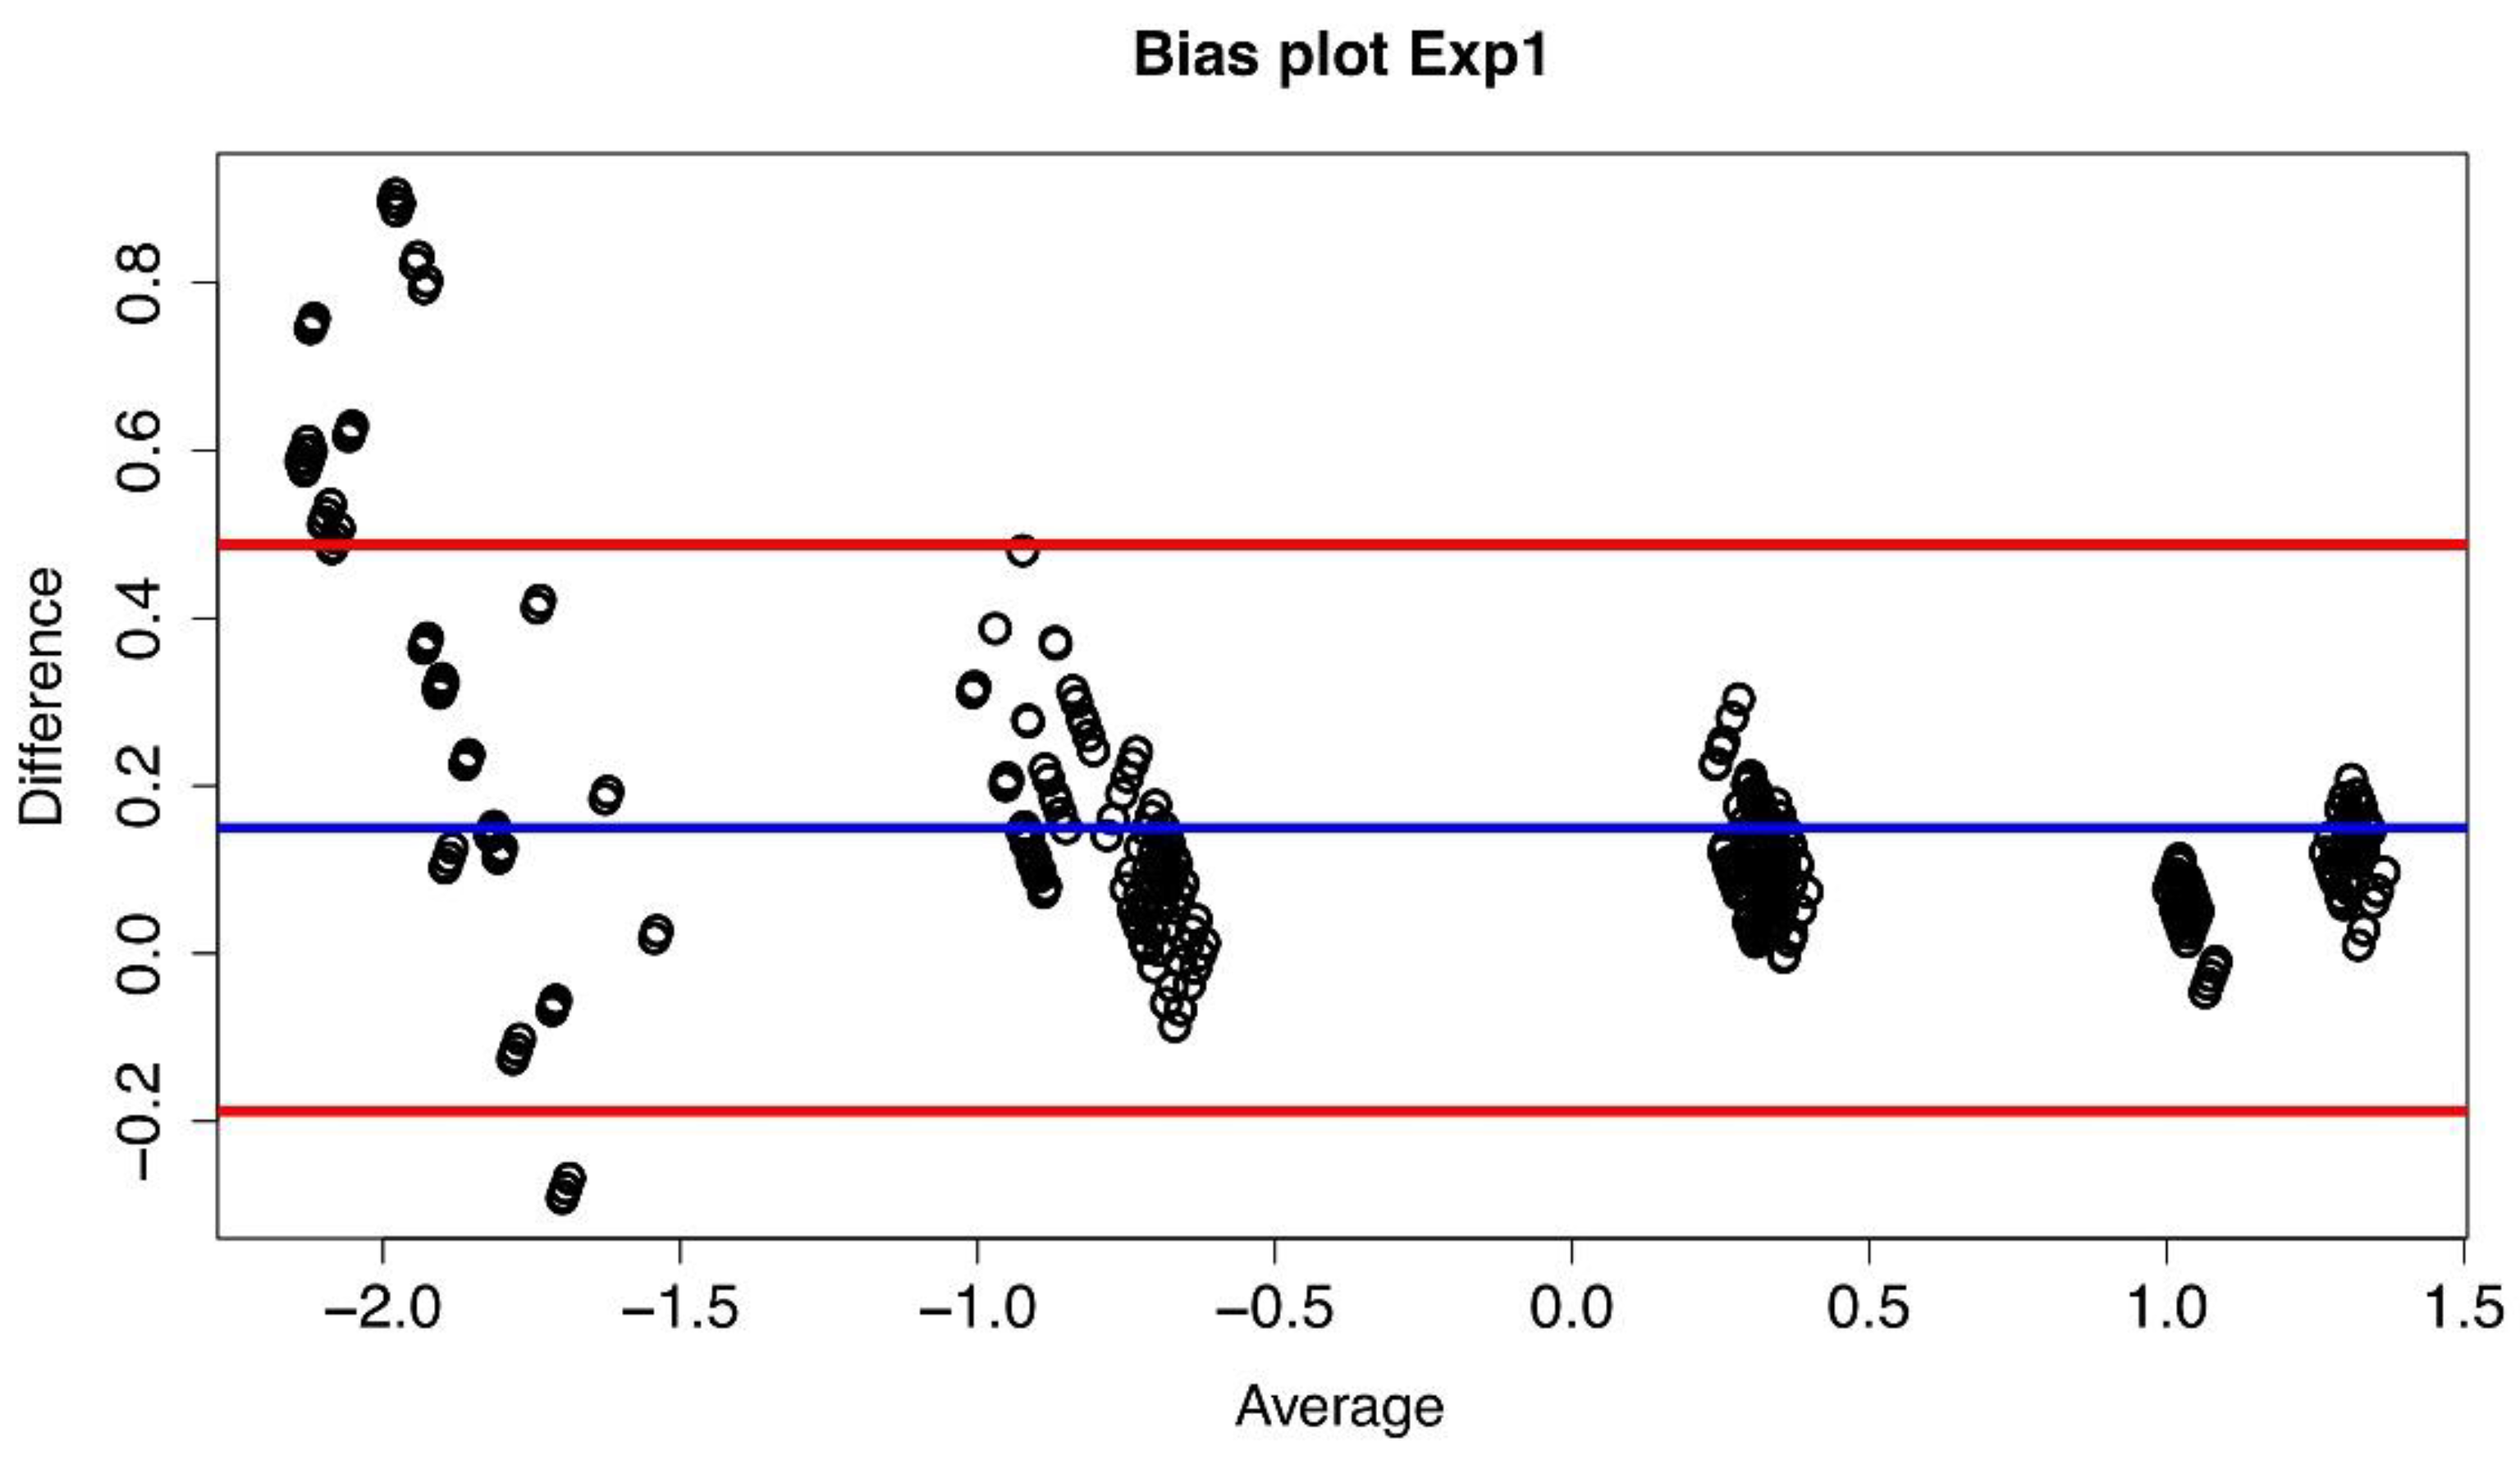
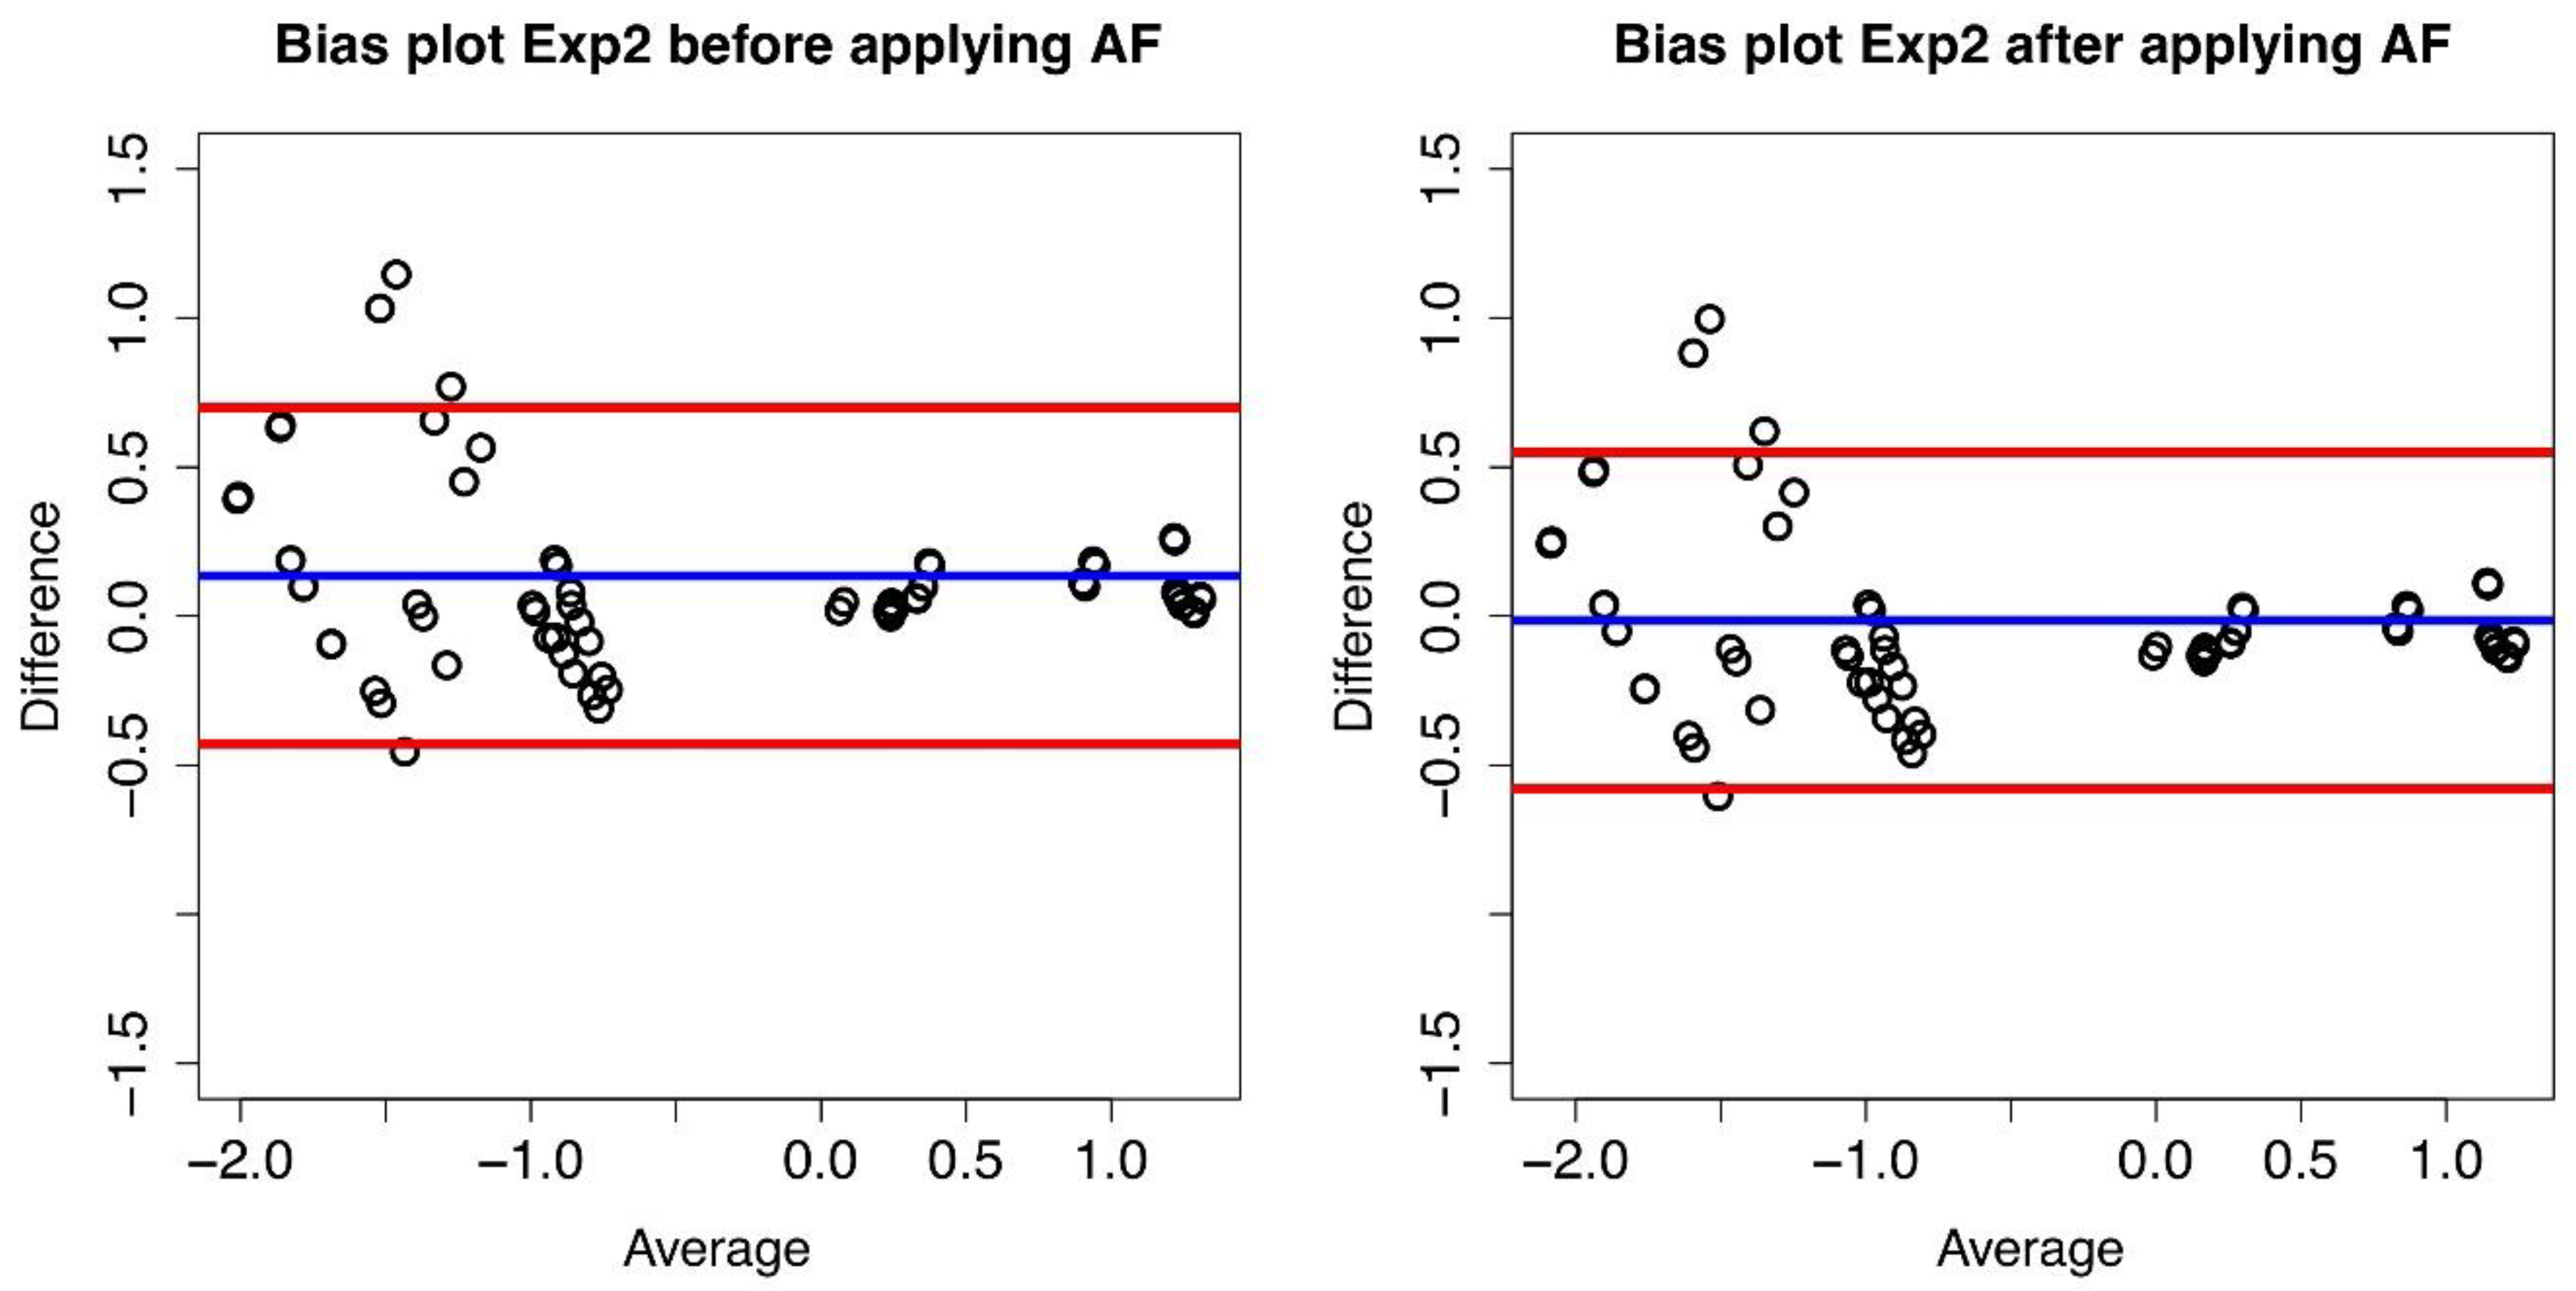
| Standard Deviation (σ) | d before AF | d after AF | |
|---|---|---|---|
| Exp 1 | 0.17 | 0.150 | 0.000 |
| Exp 2 | 0.29 | 0.135 | –0.014 |
| Exp 3 | 0.20 | 0.240 | 0.090 |
| Exp 4 | 0.17 | 0.209 | 0.060 |
| (A) | |||
| Exp 2 | 2-Fold | 3-Fold | 5-Fold |
| Before conversion | 79.1 | 87.2 | 96.5 |
| After conversion | 74.4 | 87.2 | 97.7 |
| (B) | |||
| Exp 3 | 2-Fold | 3-Fold | 5-Fold |
| Before conversion | 78.6 | 94.0 | 95.2 |
| After conversion | 91.7 | 95.2 | 96.4 |
| (C) | |||
| Exp 4 | 2-Fold | 3-Fold | 5-Fold |
| Before conversion | 80.7 | 95.4 | 96.6 |
| After conversion | 95.4 | 95.4 | 97.7 |
| (A) | |||
| Mean | 95% Limits of Agreement | Median | |
| Exp 2 | 1.81 | 0.37–5.01 | 1.16 |
| Exp 3 | 2.01 | 0.71–4.25 | 1.69 |
| Exp 4 | 1.80 | 0.74–3.51 | 1.40 |
| (B) | |||
| Mean | 95% Limits of Agreement | Median | |
| Exp 2 | 1.28 | 0.26–3.54 | 0.82 |
| Exp 3 | 1.43 | 0.50–3.01 | 1.20 |
| Exp 4 | 1.27 | 0.53–2.49 | 0.99 |
Publisher’s Note: MDPI stays neutral with regard to jurisdictional claims in published maps and institutional affiliations. |
© 2021 by the authors. Licensee MDPI, Basel, Switzerland. This article is an open access article distributed under the terms and conditions of the Creative Commons Attribution (CC BY) license (https://creativecommons.org/licenses/by/4.0/).
Share and Cite
Fava, C.; Bernardi, S.; Gottardi, E.M.; Lorenzatti, R.; Galeotti, L.; Ceccherini, F.; Cordoni, F.; Daraio, F.; Giugliano, E.; Jovanovski, A.; et al. Alignment of Qx100/Qx200 Droplet Digital (Bio-Rad) and QuantStudio 3D (Thermofisher) Digital PCR for Quantification of BCR-ABL1 in Ph+ Chronic Myeloid Leukemia. Diseases 2021, 9, 35. https://0-doi-org.brum.beds.ac.uk/10.3390/diseases9020035
Fava C, Bernardi S, Gottardi EM, Lorenzatti R, Galeotti L, Ceccherini F, Cordoni F, Daraio F, Giugliano E, Jovanovski A, et al. Alignment of Qx100/Qx200 Droplet Digital (Bio-Rad) and QuantStudio 3D (Thermofisher) Digital PCR for Quantification of BCR-ABL1 in Ph+ Chronic Myeloid Leukemia. Diseases. 2021; 9(2):35. https://0-doi-org.brum.beds.ac.uk/10.3390/diseases9020035
Chicago/Turabian StyleFava, Carmen, Simona Bernardi, Enrico Marco Gottardi, Roberta Lorenzatti, Laura Galeotti, Francesco Ceccherini, Francesco Cordoni, Filomena Daraio, Emilia Giugliano, Aleksandar Jovanovski, and et al. 2021. "Alignment of Qx100/Qx200 Droplet Digital (Bio-Rad) and QuantStudio 3D (Thermofisher) Digital PCR for Quantification of BCR-ABL1 in Ph+ Chronic Myeloid Leukemia" Diseases 9, no. 2: 35. https://0-doi-org.brum.beds.ac.uk/10.3390/diseases9020035