Article

Multispectral, Aerial Disease Detection for Myrtle Rust (Austropuccinia psidii) on a Lemon Myrtle Plantation

1
Biodiversity, Ecology and Evolution of Plants, Institute of Plant Science and Microbiology, University of Hamburg, 22609 Hamburg, Germany
2
Department of Biological Sciences, Macquarie University, Sydney, NSW 2109, Australia
3
Joint Remote Sensing Research Program, School of Earth and Environmental Sciences, University of Queensland, Brisbane, QLD 4072, Australia
4
Forest Science, Department of Primary Industries - Forestry, Parramatta, NSW 2150, Australia
5
Occupational Hygiene, Environment and Chemistry Centre, Simtars, Redbank, QLD 4301, Australia
*
Author to whom correspondence should be addressed.
Submission received: 1 February 2019 / Revised: 26 February 2019 / Accepted: 1 March 2019 / Published: 7 March 2019
(This article belongs to the Special Issue UAV/Drones for Agriculture and Forestry)

Abstract

:
Disease management in agriculture often assumes that pathogens are spread homogeneously across crops. In practice, pathogens can manifest in patches. Currently, disease detection is predominantly carried out by human assessors, which can be slow and expensive. A remote sensing approach holds promise. Current satellite sensors are not suitable to spatially resolve individual plants or lack temporal resolution to monitor pathogenesis. Here, we used multispectral imaging and unmanned aerial systems (UAS) to explore whether myrtle rust (Austropuccinia psidii) could be detected on a lemon myrtle (Backhousia citriodora) plantation. Multispectral aerial imagery was collected from fungicide treated and untreated tree canopies, the fungicide being used to control myrtle rust. Spectral vegetation indices and single spectral bands were used to train a random forest classifier. Treated and untreated trees could be classified with high accuracy (95%). Important predictors for the classifier were the near-infrared (NIR) and red edge (RE) spectral band. Taking some limitations into account, that are discussedherein, our work suggests potential for mapping myrtle rust-related symptoms from aerial multispectral images. Similar studies could focus on pinpointing disease hotspots to adjust management strategies and to feed epidemiological models.

1. Introduction

Sustaining human food demands in a world with a global population growing toward 10 billion has been identified as a major challenge [1,2]. The implementation of technologies to increase food supply through intensification rather than expansion is regarded as a sensible approach to tackle this challenge [2]. Precision agriculture comprises a set of technologies that combines sensors and information systems to inform management decisions for optimizing farm inputs by accounting for variability and uncertainties within agricultural systems [3]. Satellite imagery is often used to study variations in crop and soil conditions. However, the availability, limited resolution (temporal and spatial) and sometimes prohibitive costs of satellite imagery limits its universal application in precision agriculture. Unmanned aerial systems (UAS, also known as drones) are now commercially available to anyone and can be equipped with a wide range of sensors (e.g., thermal or spectral). Thus, they offer a cost-effective alternative to satellite systems while providing a higher spatial and temporal resolution [4,5].
In agriculture, UAS have been used for estimating drought stress, weed frequency or nutrient status [6]. Various other applications were reviewed by Mulla [5] and Maes and Steppe [6]. One of these applications is sensor-guided disease detection [7]. Plant diseases can cause tremendous damage to agricultural production as has been shown recently when a new strain of wheat rust destroyed tens of thousands of hectares of crops in Italy [8]. Traditional disease management practices often assume that pathogens are spread homogeneously over cultivation areas [9]. Pesticide use by farmers can often be untargeted and sub-optimal [10]. By contrast, targeted use of pesticides is likely to reduce amounts required for application and therefore reduce costs and ecological impact in agricultural crop production systems [3]. Sensors with a spatial resolution of >1 m (e.g., satellite-borne sensors) are unsuitable for detecting disease hotspots to allow optimum pesticide application. Often, hand-held sensors are preferred as they allow for high (>10 cm) spatial resolution as they can be applied in close proximity to the object of interest [11]. Nowadays, the same high spatial resolution can be achieved by camera systems mounted on UASs [12]. Compared to hand-held sensors, UAS allow for disease screening at larger scales and at higher frequencies [4]. As an example, Calderón et al. [13] acquired airborne thermal and multi-spectral imagery using an UAS to detect downy mildew (caused by Peronospora arborescens) on opium poppy (Papaver somniferum). The following spectral regions were useful to detect infections: the visible (VIS, 400–700 nm) and red-edge (RE, 670–750 nm) spectral region, due to the necrotic and chlorotic lesions caused by chlorophyll degradation; the near-infrared region (NIR, beyond 800 nm), due to changes in canopy density and leaf area; and the thermal-infrared regions because of the changes in the transpiration rate that affect canopy temperature. It was further demonstrated that the green/red ratio (R550/R670) was related to physiological stress caused by downy mildew infection.
The rust fungus Austropuccinia psidii (myrtle rust) is now regarded as a globally invasive pathogen and became established in Australia during 2010 [14]. It is affecting growing shoots, fruits and flowers of a wide range of species in Myrtaceae resulting in leaf and shoot distortion, dieback and—in severe cases—tree mortality [15,16]. Infection of young foliage results in discoloration (chlorosis and reddening), development of yellow uredinia (pustules) and ultimately necrosis [15]. In contrast to other rust diseases, which are mostly restricted to few host species, myrtle rust has the potential to infect hundreds of different hosts, escalating the potential consequences for Australia’s natural landscapes which are dominated by Myrtaceae [17]. Horticultural industries that rely heavily on Myrtaceae have also been affected by myrtle rust through losses of commercial varieties, trade restrictions, and increased dependency on fungicides [18]. In Australia, an expanding lemon myrtle (Backhousia citriodora) industry has been particularly affected [18]. Leaves of lemon myrtle are commercially harvested to produce lemon-flavored herbal teas, culinary herbs, and lemon-scented essential oils used for food flavoring and personal care products. The farm gate value of this market has been estimated to be 5.3–17.5 million USD annually [19]. Cultivars of B. citriodora that are currently in use are moderately to highly susceptible to myrtle rust [20]. Rust-affected leaves of B. citriodora are unsuitable for use, and the application of fungicides to control the disease is undesirable as the market demands a clean and “certified organic” product [20]. Therefore, industries reliant on lemon myrtle are in urgent need of rust-resistant cultivars or measures to reduce the use of fungicides.
In a previous study [21] we showed that it is feasible to use hand-held, narrow-band hyperspectral sensors to discriminate fungicide treated and untreated lemon myrtle leaves with high accuracy (95%). Here we deployed a UAS carrying a broad-band multispectral sensor, seeking to test if it would be possible to accurately discriminate fungicide-treated and untreated sunlit plants at canopy-level, at this lower spectral resolution. This was indeed the case. Thus, we also compared the classification power of this approach (based on five spectral bands) with that of four “off the shelf” vegetation indices commonly used to detect stress in plants.

2. Materials and Methods

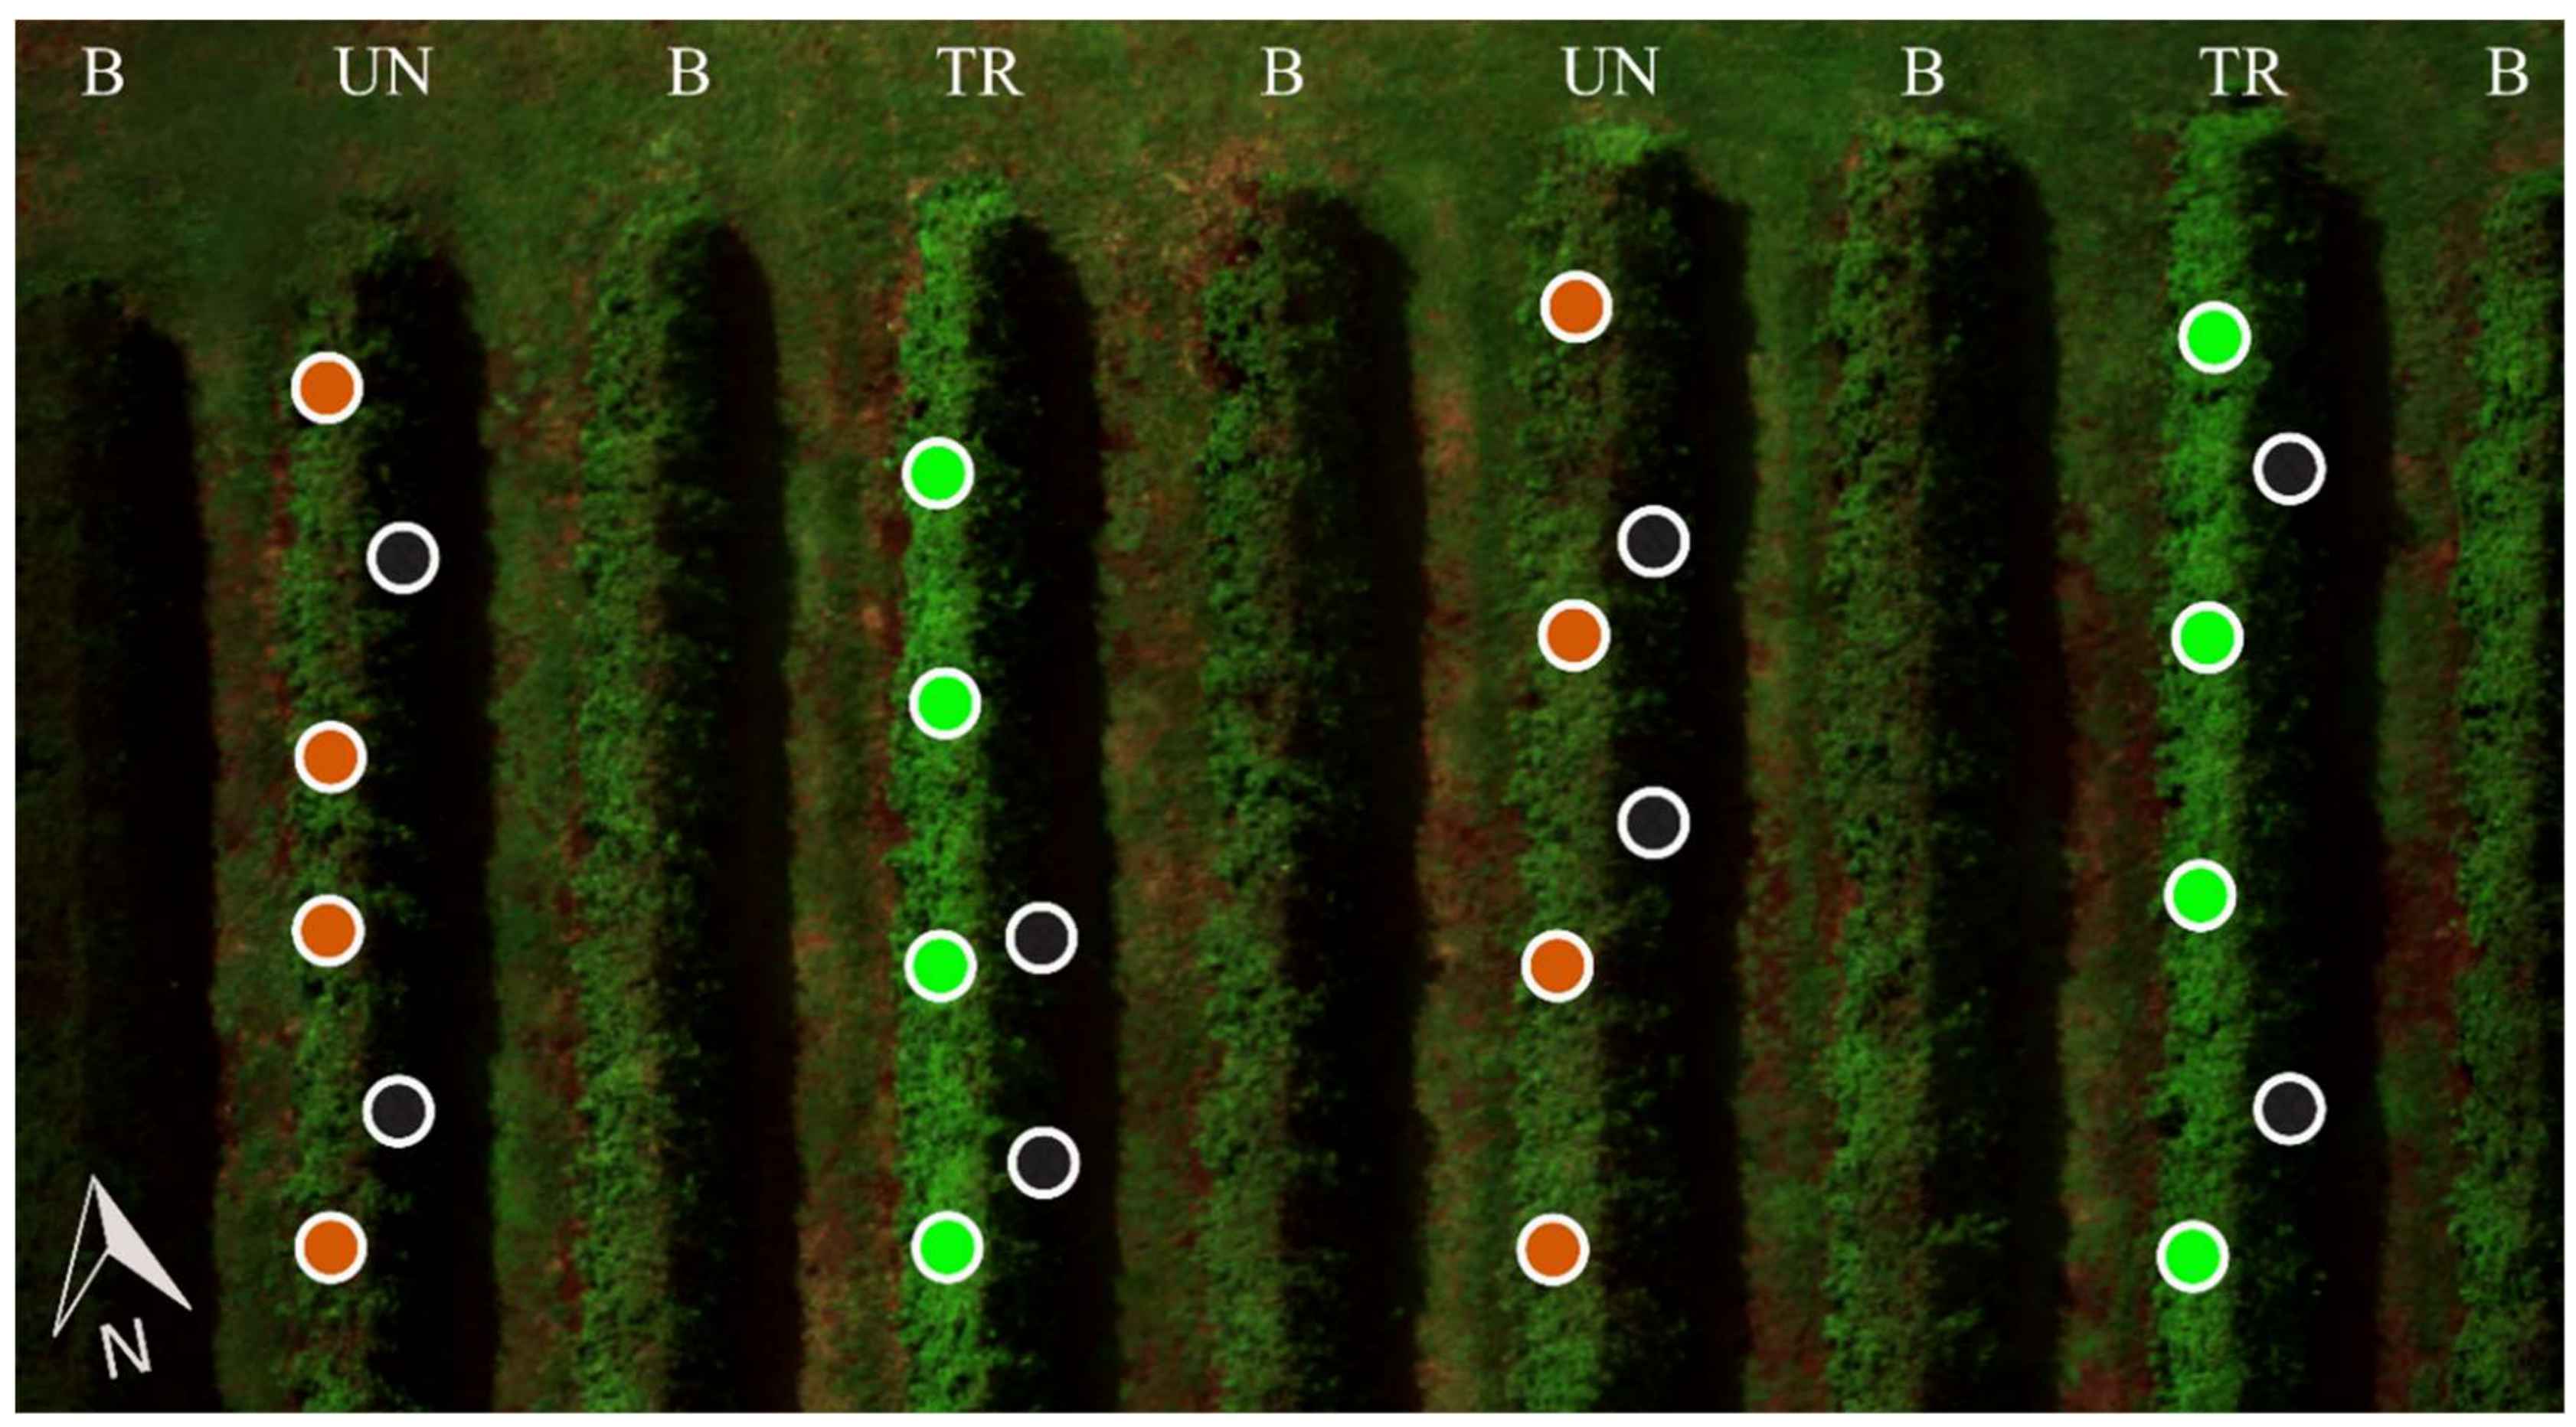
2.1. Study Site and Spectral Data

Multispectral aerial images of lemon myrtle trees (Backhousia citriodora) were collected on a commercial lemon myrtle plantation in northern New South Wales, subtropical eastern Australia (latitude −28.691055, longitude 153.295510). Mean annual temperature at that location is 19.4 °C and mean annual rainfall 1343 mm [22]. A five-band multispectral camera (blue = B = 475 ± 20 nm, green = G = 560 ± 20 nm, red = R = 668 ± 10 nm, near-infrared = NIR = 840 ± 40 nm and red-edge = RE = 717 ± 10 nm; RedEdge 3, MicaSense, Inc., Seattle, WA, U.S.) was mounted on an Inspire-1 quadcopter UAS (DJI Inc., Shenzhen, China). The camera had a focal length of 5.5 mm and captured images at a resolution of 1280 × 960. Images were captured with a forward overlap of 70%, a lateral overlap of 80%, a flight speed of 3 m/s (10.8 km/h) and a flight altitude of 40 m above ground on average. Considering the tree height (~180 cm), the mentioned settings achieved a ground sampling distance of approximately 2.8 cm per pixel. At the plantation, we took advantage of an existing experiment in which the impact of fungicide was being assessed on lemon myrtle trees affected by myrtle rust (Lancaster et al., in preparation) utilizing fungicide shown to be effective at controlling myrtle rust [23]. We recorded aerial multispectral images from trees that were free of active disease, having had fungicide successfully applied to them (“treated”), and trees showing symptoms of active myrtle rust infection (“untreated”). Leaves from treated trees showed mostly no signs of A. psidii infection, although some had small purple spots, likely due to infection occurring prior to fungicide application. We exclude the influence of other biotic agents as no other serious pest or pathogen on lemon myrtle was known prior to A. psidii (Manager Gary Mazzorana, Australian Rainforest Products, Lismore, Australia, personal communication). The experimental design consisted of two treated and two untreated rows of trees, separated by rows of trees designated as “buffer” trees to avoid accidental treatment of trees intended to be untreated (Figure 1).

2.2. Image Processing

Aerial images were processed in Agisoft PhotoScan Professional (Version: 1.4.2 build 6205, 64 bit, Agisoft LLC, St. Petersburg, Russia). Spectral reflectance for each band was calibrated and normalized using images and the appropriate correction factors of a white reference panel (RP02-1543031-SC). Images were aligned by matching tie points across all adjacent images using “high accuracy” settings. Such tie points are reference points that can be clearly identified by the software in two or more images and used to reconstruct the entire scene. Subsequently, images were optimized by fitting the reconstruction uncertainty and the projection accuracy. High reconstruction uncertainty is often caused by noisy points reconstructed from nearby images. The projection accuracy was used to filter out projected points that were below an error threshold of three. The reprojection error determines the distance between reconstructed projection and the original projection and was reduced to 0.35 by removing bad points due to pixel residual error. Image post-processing was guided by recommendations of the United States Geological Survey scientific agency [24]. Then, a dense point cloud was generated and cropped to the extent of our sample area (Figure 1). Further, the dense point cloud was categorized in tree-points-only (T) and tree-ground-points (TG). Therefore, we tuned the ground point classification tool in Agisoft PhotoScan Professional. The categorization was done to remove all areas classified as being “ground,” yielding an image only displaying the relevant lemon myrtle trees. This image was useful to apply our classification model and create a risk map (see Results). Without the categorization, non-relevant ground points would have been included in the prediction model. Eventually, both dense point clouds (TG and T) were exported as orthophotos (an ortho-rectified image is free of distortion and shows a uniform scale over its entire surface).
Our radiometric calibration was not optimal as we had to fly under sporadically cloudy conditions (S1). Therefore, our aerial multispectral data is not suitable for temporal variation analysis or comparisons between sensors [25]. However, in our study we only compare classification accuracies based on self-contained datasets and therefore the relative relationships between treated and untreated spectra should not be affected. To avoid radiometric calibration problems when the flight mission must be performed on a day with scattered clouds, it might be useful to repeat the white balance calibration more often between changing conditions.
For more details on the processing with Agisoft PhotoScan Professional, please refer to the log file (S2) or the Agisoft PhotoScan User Manual Professional Edition, Version 1.4 (http://www.agisoft.com/pdf/photoscan-pro_1_4_en.pdf).

2.3. Data Preparation

To yield numerical data from our images to train our classification model, we used the open-source software QGIS (version 3.4.1) [26] and drew circular shaped polygons as pixel sample areas onto the TG orthophoto (Figure 1). We created eight sample areas for each class (shadow = SHD, treated = TR, untreated = UN). The class “SHD” was specified to discriminate areas where trees were overcast by shadows. As shadows cannot be avoided in a natural landscape, we compared three options for handling them. First, we included them as a separate class. Second, we excluded them entirely, as if they were not present in the landscape. Third, we mixed treated and untreated pixels with their respective shadows. In the main text we present the results of the first option only, as shadows are part of the landscape and therefore should ideally be included as a classification group. However, classification and feature selection results for the other two options are provided as Supplementary data. For the second option we removed the shadow class from our data table. For the third option we created a new set of sample areas that included the east-facing shadow pixels of each treatment. Pixel samples were extracted for each class and polygon, using our own code and the ‘raster’ package [27] within the R environment (version 3.4.3) [28]. The full analysis can be reproduced by re-running our stored data and code (https://github.com/ReneHeim/MR_Drone, doi: 10.5281/zenodo.2583880).
The pixel data extraction process yielded a dataset containing 14,438 observations, nine predictor variables (see below) and a response column containing the classes (SHD, TR, UN). We ran a random forest classification on these data to explore whether it would be possible to discriminate treated and untreated myrtle rust trees based on multispectral, aerial imagery. The nine predictor variables consisted of five spectral bands native to the MicaSense RedEdge camera (B, G, R, RE, NIR) and four vegetation indices (Table 1). The indices were chosen based on their capability to reflect plant biophysical and physiological parameters, likely to be altered by infection through A. psidii. For instance, we observed red discolorations (Figure 2C,D) during A. psidii infection [15]. It is likely that this was caused by anthocyanin pigments responsible for most red and purple discolorations in plants [29]. Consequently, we chose the anthocyanin reflectance index (ARI, [30]) as one of the vegetation indices that had potential to differentiate between treated and untreated trees. Chlorotic lesions have also been observed during A. psidii infection [31]. As chlorophyll breakdown and reduction in photosynthesis rate has been associated with other biotrophic pathogens and especially rusts [32], we assumed that chlorophyll content and regulation were also affected. Consequently, we also calculated the green/red ratio, a simple ratio index that has been applied by Calderon [13] to detect downy mildew in poppy seed and has been found to be related to changes in chlorophyll content. Yellow/orange pigments in A. psidii urediniospores (Figure 2D) have been speculated to provide UV protection and to resist desiccation [33]. As carotenoids are known to provide UV protection and being present in other rusts [34], we also assume changes in carotenoid content caused by A. psidii. We thus applied the structure insensitive pigment index (SIPI, [35]), which is known to be related to changes in carotenoid content. Regarding biophysical parameters, it is known that A. psidii hyphae enter the mesophyll layer [36], therefore it is likely that mesophyll cell integrity is lowered. Hyphae entering mesophyll cells is likely to cause plant stress, therefore we selected the NDVI (normalized difference vegetation index). The NDVI [37] has been used in numerous studies to detect stress in vegetation [12,13,38].

2.4. Random Forest Classification

We used a non-parametric random forest classifier [39] to produce our classification model. This approach reduces classification variance by evaluating accuracy across multiple independent decision trees [40]. Random forests and their various importance measures are widely used in many contexts and can successfully handle multicollinear data of high dimensionality. In addition, they are less sensitive to overfitting than other machine learning classifiers, and do not require as high quality training samples [41]. This is due to the large number of decision trees produced and by randomly selecting a subset of training samples and a subset of variables for splitting at each tree node [41]. For our model, we first optimized the chosen number of randomly selected predictors at each split (mtry) by iterating over a sequence of ascending mtry-values and selected mtry = 5. Secondly, the number of trees generated to gain a full ensemble (n-tree) was optimized. The data were initially split 75:25 into training (10,380 observations) and test data (3608 observations). The model was trained by drawing 100 bootstrap samples from the training data. For each bootstrap sample, an individual and independent decision tree was constructed. Then, from each bootstrap sample, another subsample (an “out-of-bag sample”) was set aside. The out-of-bag sample is passed down each of the 100 decision trees to estimate an unbiased training classification error. To assess the importance of each contributing variable for each tree we applied a random-forest-based feature selection [42]. The method is suitable for regular, high-dimensional and correlated data [43].

2.5. Accuracy Assessment

We quantified the accuracy of the classification using three standard remote sensing metrics: overall accuracy (OA), producer accuracy (PA) and user accuracy (UA). While, OA reflects the agreement between reference and predicted classes and has the most direct interpretation, PA and UA [44] are class-specific accuracy measures. PA is the number of correctly classified references for a class divided by the total number of references of that class and, thus, represents the accuracy of the classification for a specific class. UA divides the number of correct classifications (predictions) for a class by the total number of classifications (predictions) for that class. A high UA means that spectra within that class can be reliably classified as belonging to that class. UA is often termed to be a measure of reliability, which can be also interpreted as the agreement between repeated measurements within a class.

3. Results

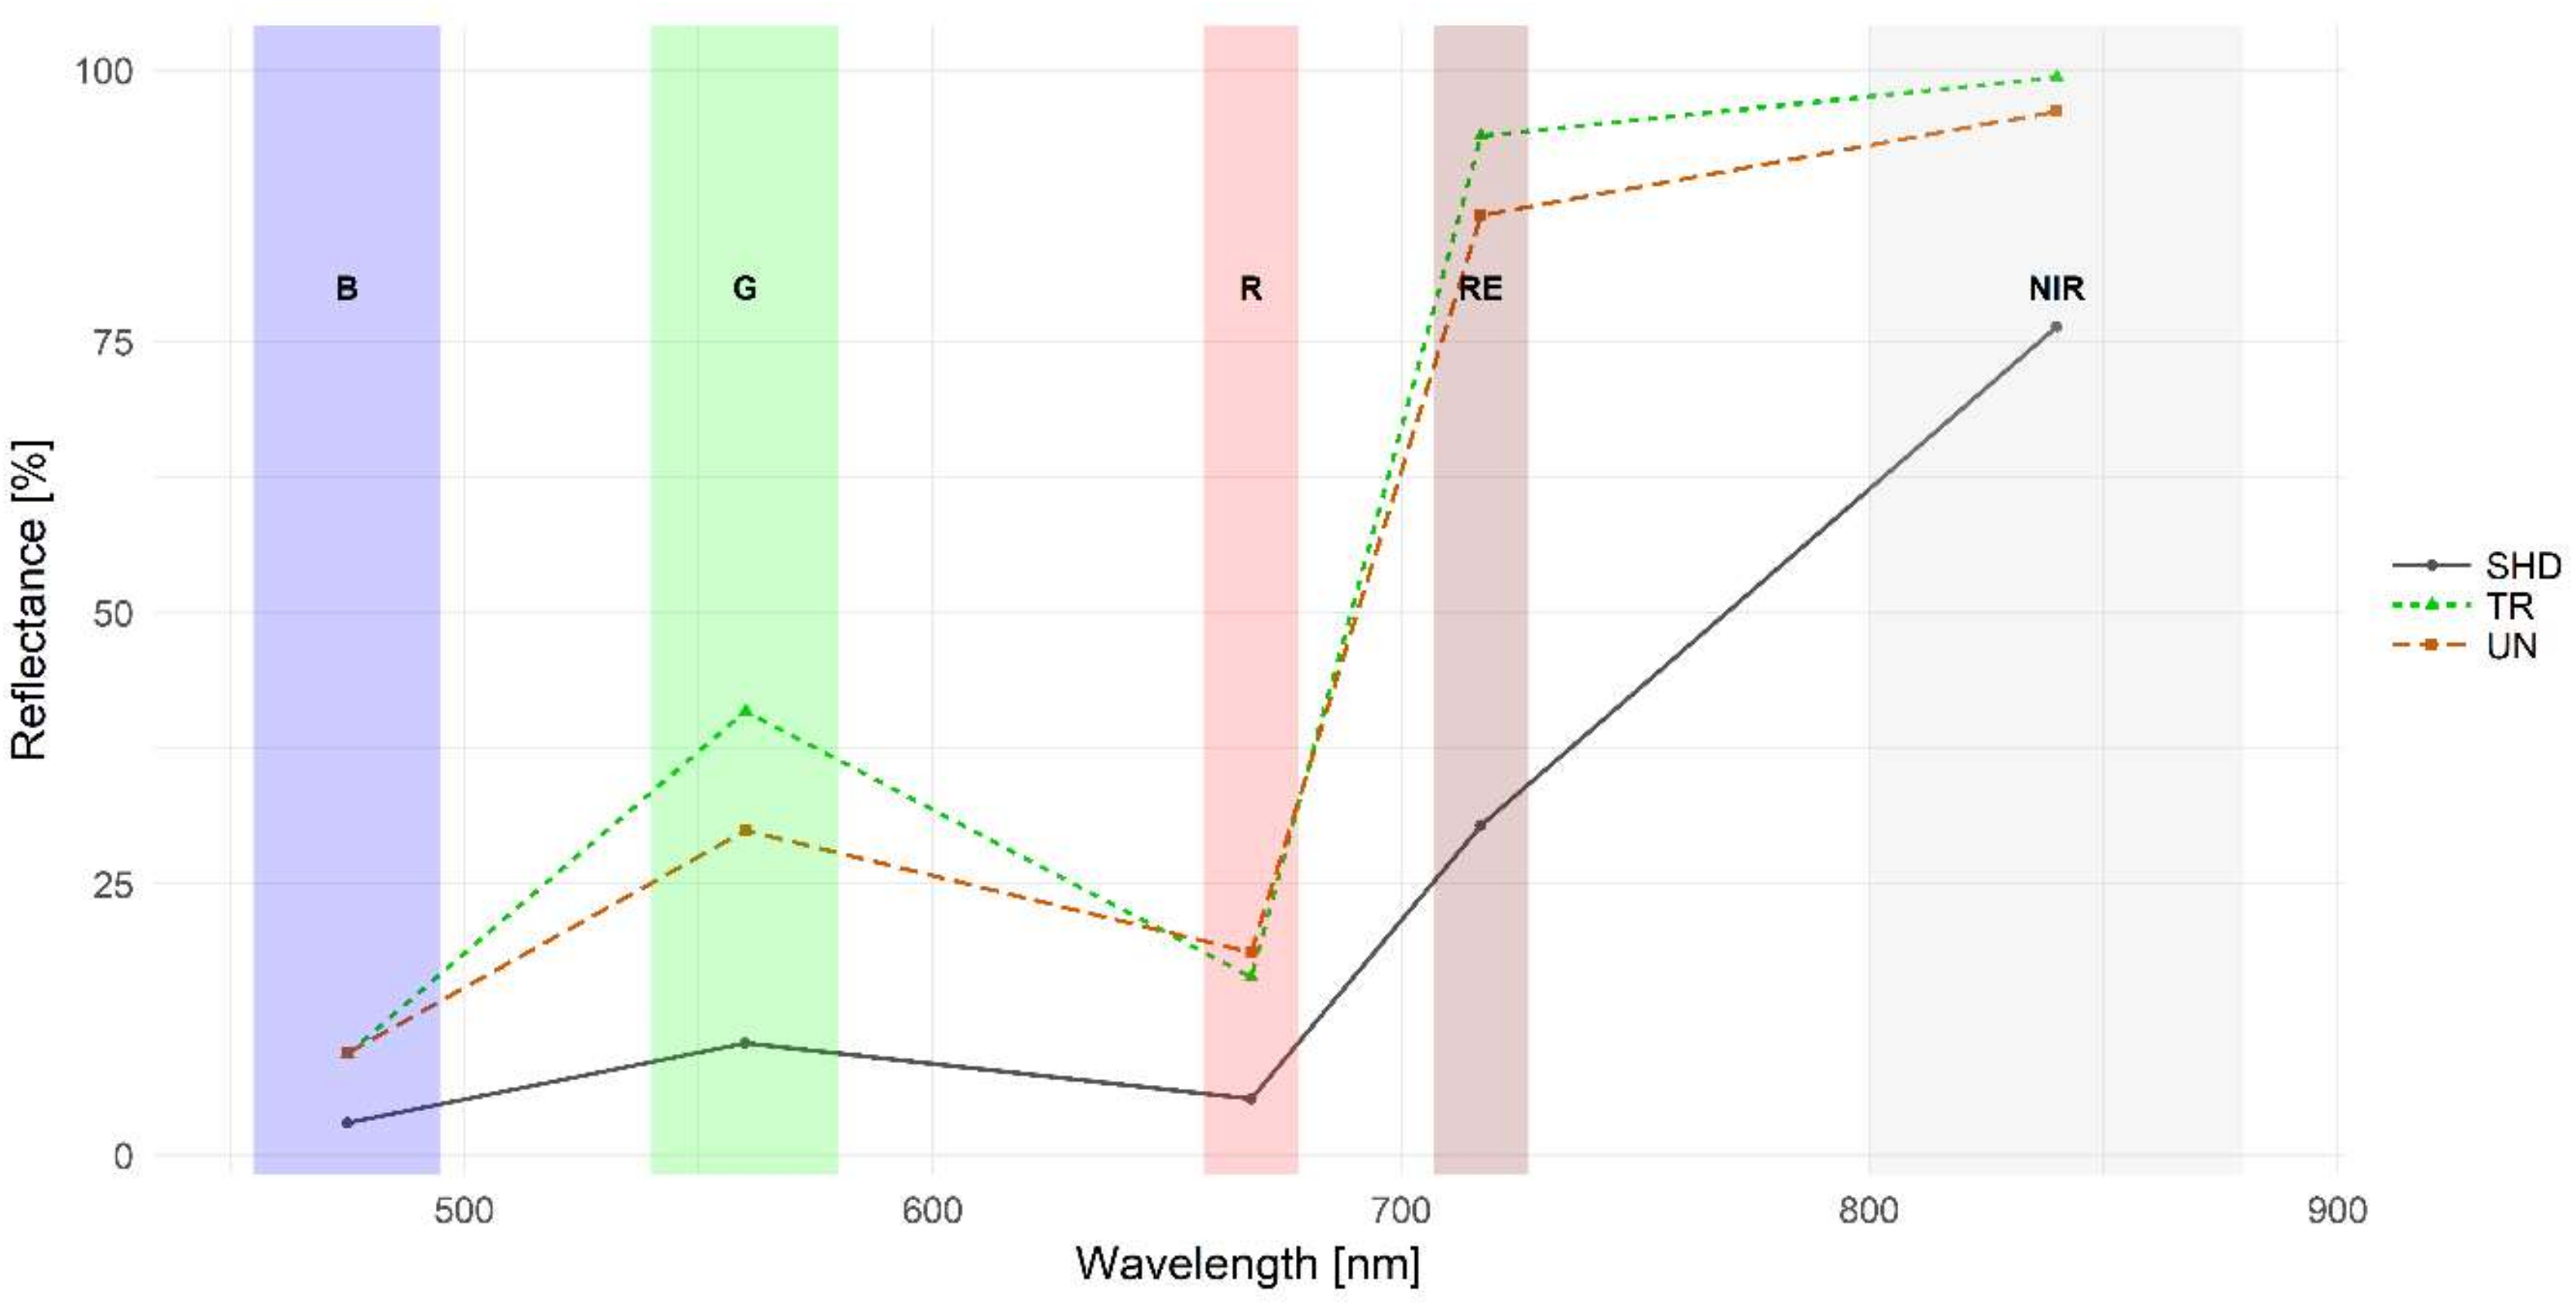
3.1. Multispectral Reflectance Signatures
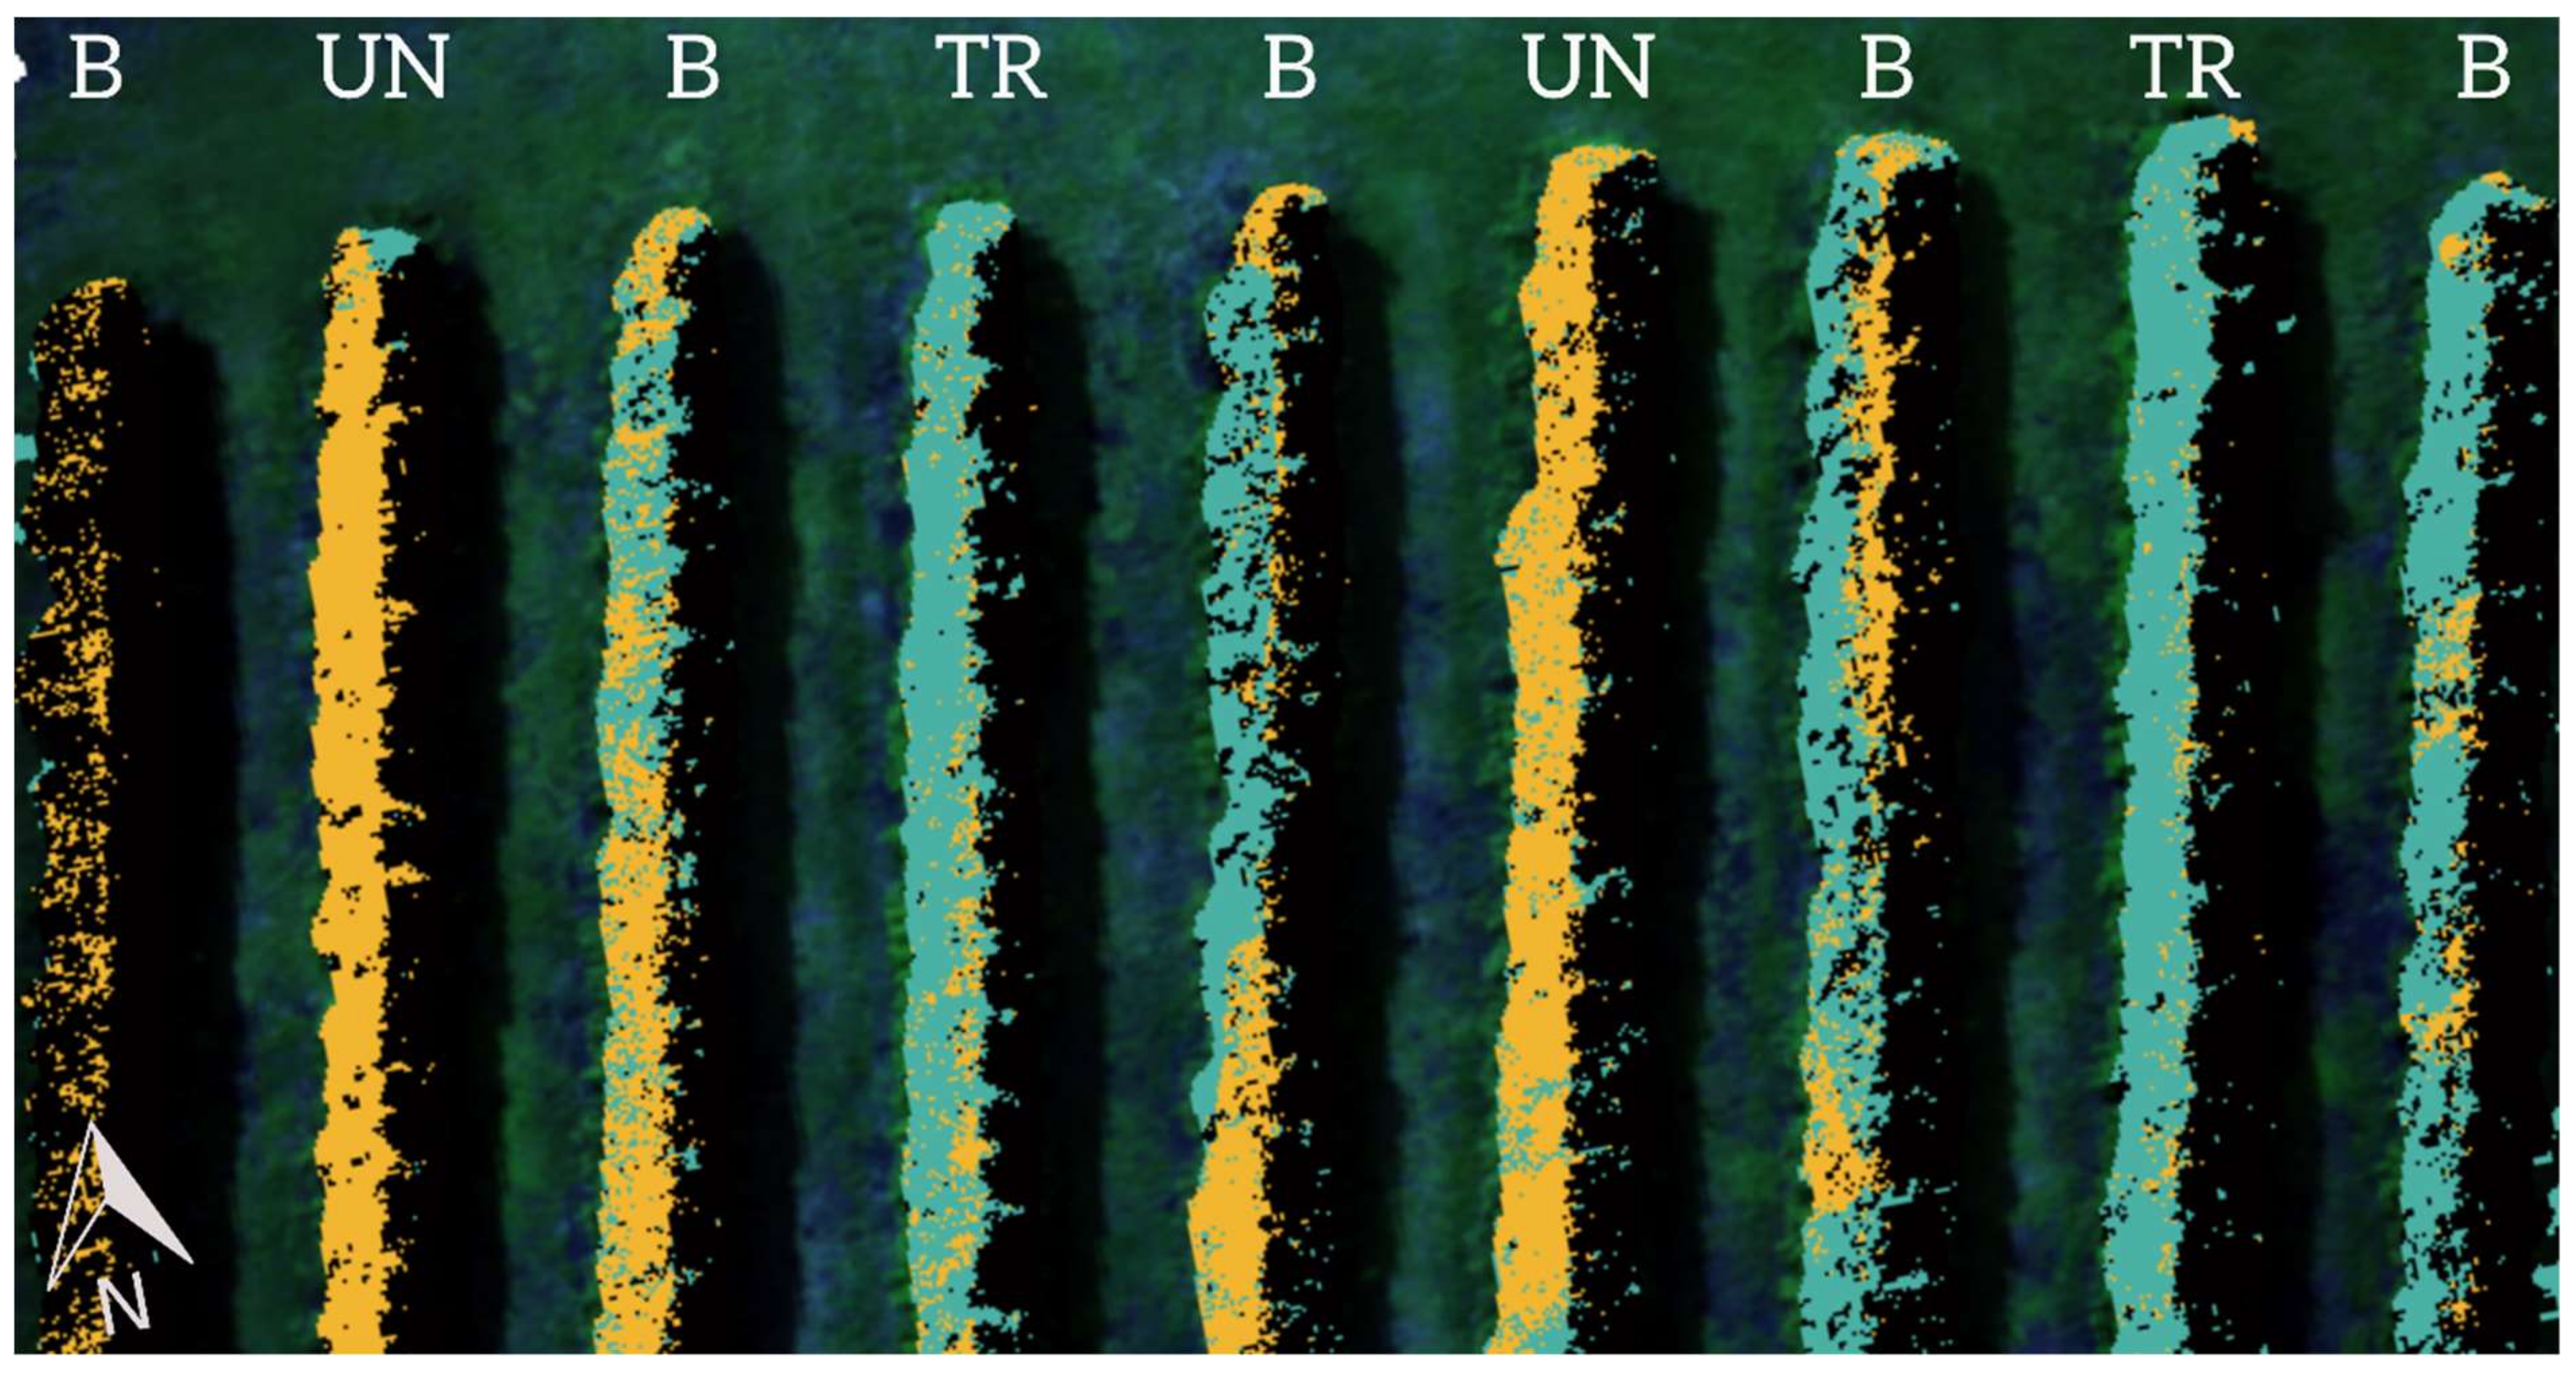
The extraction of pixel numerical values from the aerial imagery and their transformation into spectral reflectance yielded spectral signatures of each class (shadow = SHD, treated = TR, untreated = UN) which were averaged and plotted (Figure 3). The reflectance signatures of each class could be clearly differentiated from each other by the naked eye. The camera that was used in our study could only capture spectral reflectance in broad bands (Figure 3B, G, R, RE, NIR). Clear differences in reflectance can be observed in the green band, red-edge band and near-infrared band.

3.2. Classification

The random forest classification, discriminating between spectral signatures from fungicide-treated and untreated lemon myrtle trees, resulted in an overall accuracy of test data of 95% (Table 2). Evaluating the class “Shadow” from the perspective of a person sampling the reference data, 1202 pixels were extracted from trees and were assigned to the class “Shadow” (Table 2—Reference, columns) but of those only 1158 were actually belonging to the class “Shadow.” The classifier slightly disagreed with our observation and suggested that 14 shadow pixels should have been labelled as “Treated” and 30 as “Untreated” (Producer Accuracy = 96.3%, columns). When changing this to the perspective of the classifier (Table 2—Prediction, rows), the model considered 1201 pixels as being the class “Shadow.” However, from those pixels we initially labelled 19 belonging to the class “Treated” and 24 to the class “Untreated.” In 96.4% of cases our labels confirmed the prediction for that class (User Accuracy). When evaluating the remaining classes, the agreement between our labels and the classifier’s predictions was high from both perspectives. Mixing treated and untreated pixels with shadow pixels (east-facing tree sides, Figure 1) lowered the classification accuracy by 11% (S3) as shadow areas are much darker than sample areas from sunlit canopies. When shadows were excluded, the classification accuracy slightly increased to 96.2% (S4).
To emphasize the high accuracy of our prediction, we applied our model to an aerial image of the experimental site to predict whether a pixel could be classified as being a shadow, a treated or untreated lemon myrtle tree canopy. We created a risk map, using the orthophoto where all ground pixels were removed (point cloud T, see Materials and Methods 2.2 Image processing), that could be used to pinpoint areas of potential incidence of myrtle rust (Figure 4).

3.3. Important Classification Features

We aimed to assess the importance of the spectral bands (blue = B, green = G, red = R, red-edge = RE and near-infrared = NIR) and the vegetation indices (NDVI, SIPI, ARI, G/R) for the classification. The importance is given in absolute values, as provided by the selection algorithm, and as normalized, relative values between 0 and 1 (Table 3). As for spectral bands, the RE (Table 3—Rank 1) and NIR (Table 3—Rank 2) showed high relative importance for the classification. By visually assessing the spectral reflectance signatures (Figure 3), the G band (Rank 6) seems to be more important than the R band (Rank 3). However, our algorithm selected the R band to be more relevant for the classification. The most important index, the simple G/R ratio, ranked 4th place. Mixing treated and untreated pixels with shadow pixels changed the ranking of relevant features (S5). Only slight changes could be observed in the first three ranks (NIR, GR and RE). The R band was far less important now (Rank 8). When shadows were not part of the classification (S6), the R band did not change in importance (Rank 8). The first two ranks were occupied by the NIR and GR predictor. The ARI slightly increased in importance (Rank 3 instead of 5). Overall, the NIR, GR and RE predictor always ranked among the top four.

4. Discussion

In recent years, the rust fungus Austropuccinia psidii has caused tremendous damage globally and especially in Australia, where it is affecting plant industries and native vegetation [18]. Just recently, in 2017, A. psidii was detected in New Zealand and it is now threatening naïve Myrtaceae populations important for industries and ecosystems in New Zealand [18,45]. While the extent of damage in Australia has been projected [17], it can be assumed that all or most Myrtaceae species in New Zealand are also at risk and the impacts could be devastating [46]. Developing a rapid measure to detect and monitor the impact of A. psidii on plantations could make it possible to optimize management strategies.

4.1. Overall Accuracy

Given this context, the primary goal of this study was to explore whether it would be possible to spectrally discriminate healthy and infected lemon myrtle tree canopies on a plantation. At this level, detection and monitoring could be carried out by UAS to facilitate a rapid and versatile surveillance strategy. Instead of using an expensive hyperspectral sensor, we used an affordable lightweight (150 g) UAS-borne multispectral sensor with a coarser spectral resolution and successfully classified treated, untreated and shaded trees with an accuracy of 95%. Another framework to detect A. psidii was recently published by Sandino et al. [47] for paperbark tea trees (Melaleuca quinquenervia), similarly using treated and untreated trees. Instead of using a multispectral camera, as we did, they used a hyperspectral camera at 20 m above the ground, resulting in a ground sample distances of 4.7 cm/pixel. In a natural landscape, healthy paperbark trees were detected at rates of 97.24% and affected trees at 94.72%. Sandino et al. [47] emphasized that future studies should focus on monitoring disease progression and link specific biophysiological parameters with spectral responses caused by infection through A. psidii. We agree with their suggestion as such links would allow differentiating A. psidii signals from other pathogens or stress-causing agents. Differentiating stress signals using optical sensors is a complex task as multiple biophysical and biochemical parameters in plants can be altered by pathogens [48]. As we could largely exclude the presence of other stress-causing agents on our sample-site, we can conclude that multispectral sensors are generally capable of detecting A. psidii symptoms on Backhousia citriodora in a managed landscape. However, we do not know if this would still be possible if multiple pathogens or abiotic stressors were present in the examined area. We suggest that future studies test whether accurate classification is still possible when the stress signal is more complex and not exclusively caused by A. psidii.

4.2. Feature Selection

To facilitate a future multispectral detection approach, we selected relevant multispectral features and evaluated the discriminatory power of various multispectral vegetation indices. It has been suggested that the combination of multiple vegetation indices, derived from multispectral sensors, can be a feasible approach to accurately discriminate healthy and disease plants by means of optical sensor data and classification approaches [49]. In our study, we found the NIR and RE band to be relevant for an accurate classification (Table 3, Tables S5 and S6). Further, the anthocyanin reflectance index (ARI) and the G/R index contained more discriminatory power than other tested predictors (Table 3, Tables S5 and S6). Similar to our study, Albetis et al. [50] used UAS multispectral imagery to detect Flavescence dorée, a phytoplasma-borne plant disease, on red and white grapevine cultivars. Red cultivars could be classified more accurately (90%–100%) than white cultivars (70%–80%) based on multispectral bands (B, G, R, RE, NIR), a suite of multispectral vegetation indices (NDVI, ARI, SAVI and others), and biophysical parameters (e.g., chlorophyll and anthocyanin content) that were estimated based on inverted canopy reflectance models. Albetis et al. [50] found that the near-infrared band (NIR), the green/red ratio (G/R), and the anthocyanin content were good predictors for symptomatic leaves. Another study by Calderon et al. [13], successfully applied the green/red ratio index on aerial multispectral data for the detection of physiological stress in opium poppy infected with downy mildew. The fact that both studies found similar important predictor variables for the classification of different diseases suggests that these predictors are useful to detect pathogen-related stress in general, but they are unlikely to be suitable to discriminate among different stress origins specifically. It is known that plant pigments, such as chlorophyll, carotenes, and xanthophylls absorb radiation at 445 nm (blue band), but only chlorophyll absorbs near 645 nm (red band). Therefore, healthy green leaves show low reflectance values in the blue and red bands. An increase in reflectance in these two wavebands may signal a stress condition [51]. The RE position is also linked with general stress symptoms as it is closely related to chlorophyll content [52] and the NIR plateau can either be raised or lowered depending on the internal leaf cellular structures [53]. In summary, the important predictors found in our study are reasonable as they are well known to reflect plant stress. In our case, we could exclude other stress-causing agents, therefore the selected predictors are likely to be related to infections caused by A. psidii. As the data was collected on an actively managed plantation, we could not select a specific point in time during pathogenesis for our data collection. Thus, our selected predictors reflect A. psidii related stress for multiple stages during pathogenesis and are probably not useful when stress signals are caused by multiple biotic or abiotic agents.

4.3. Hyperspectral versus Multispectral Sensors for Disease Detection

While new multispectral sensors are affordable and light-weight, they only provide low spectral resolution and range (compare Figure 3). They usually resolve spectral bands broader that 20 nm and do not detect regions of the electromagnetic spectrum beyond ~1000 nm. By contrast, modern hyperspectral sensors provide data with high dimensionality, covering a spectral range of up to 350 to 2500 nm and often provide a spectral resolution as narrow as 1 nm [48]. In a previous study [21], using a hyperspectral sensor at leaf-level, we could show that multiple spectral features, spread across the VIS (e.g., 545, 555, and 715 nm), NIR (e.g., 725 and 745 nm) and SWIR (e.g., 1455 , 1485 and 2145 nm) regions, were relevant to accurately discriminate healthy and diseased plants. Unfortunately, we did not attempt to link those features with specific biochemical or biophysical changes caused by A. psidii. It is known that biochemical or biophysical changes are often reflected in very narrow spectral bands. For instance, Kokaly and Skidmore [54] observed across multiple plant species, that phenolic compounds cause spectral variation at 1660 nm. This exact feature could not be detected by using a multispectral sensor as they neither cover the SWIR region (1300–2500 nm) nor are they capable of resolving this narrow signal. The wide range of narrow and relevant features for the discrimination of healthy and A. psidii infected plants, reported in our previous study [21], suggests that spectral reflectance signatures of A. psidii and B. citriodora are of complex nature. If the goal is to establish specific links between spectral features and A. psidii related plant physiological alterations, it would be recommendable to use hyperspectral sensors for such studies.

4.4. Processing Shadow Areas in Land Cover Classification Problems

No matter what sensor is used for these types of studies the occurrence of shadow areas is difficult to avoid, as was the case in the presented study. Because shadows impair classification accuracies, as we could show in an additional classification where we mixed shadow pixels into the classification (S3), it is widely accepted to exclude shadows from a classification approach [55]. However, often shadows contribute in large parts to the collected data and therefore including them as an additional class seems practical. In the future, it would be useful to test techniques that compensate for shadow areas [56]. Unfortunately, the influence of such techniques on spectral reflectance properties in disease detection and other disciplines is not yet adequately tested. Another suggestion we can provide is performing several flights per day: one could overlay the collected images and potentially obtain a map without shadows. This approach would require very precise georeferencing to accurately stack the images. This, in turn, could be achieved by using multiple, custom-built spatial reference targets [25]. While the useful inclusion of shadow data into classification models is desirable, we currently lack sufficiently tested methods. For the present study, we could still show that sunlit lemon myrtle trees can be accurately classified at canopy-level.

5. Conclusions

By using an unmanned aerial system (UAS) and a multispectral camera, we were able to discriminate fungicide treated and untreated lemon myrtle trees at canopy-level with high accuracy (95%). Our study revealed multispectral wavebands (red-edge and near-infrared) and spectral vegetation indices (e.g., green/red ratio) as being relevant for an accurate classification. As those relevant features are known to be good predictors for general stress detection in plants it seems likely that our selected variables are valid. However, they are unlikely to be specific for A. psidii and only useful when other stress causing agents can be excluded by suitable management strategies. Our experiment was performed in a plantation where no other damage agents are known and management strategies are aimed at optimal plant growth. Thus, our identified spectral stress indicators are likely to be associated with A. psidii. For future experiments, we recommend the use of hyperspectral sensors, as the detection of symptoms while they are still imperceptible to visual screening may be a worthwhile goal. Additionally, the estimation of disease severity, the discrimination of biotic and abiotic stress and the differentiation among diseases might be valuable research objectives. In all these cases, hyperspectral sensors are more suitable as they reflect physiological and structural changes caused by pathogens on a finer spectral scale than multispectral sensors. Eventually, the inclusion of thermal, fluorescence and plant biochemical/physiological parameters can be recommended as such data could potentially be linked with A. psidii infections.

Supplementary Materials

The following material is available online at https://0-www-mdpi-com.brum.beds.ac.uk/2504-446X/3/1/25/s1, S1: S1_cloudcover.mov; S2: S2_Agisoft_PhotoScan_Log.txt; S3: S3_mixshadows_errormat.docx; S4: S4_noshadows_errormat.docx; S5: S5_mixshadows_features.docx; S6: S6_noshadows_features.docx.

Author Contributions

Conceptualization, J.O., I.J.W. and R.H.J.H.; Methodology, J.O., I.J.W. and R.H.J.H.; Formal Analysis, R.H.J.H.; Investigation, R.H.J.H.; Resources, R.H.J.H., D.T.; Data Curation, R.H.J.H.; Writing—Original Draft Preparation, R.H.J.H; Writing—Review & Editing, J.O., I.J.W., R.H.J.H., P.S., A.J.C. and D.T.; Visualization, R.H.J.H.; Supervision, J.O., I.J.W. and A.J.C.; Project Administration, R.H.J.H; Funding Acquisition, R.H.J.H. In addition, all authors approve the submitted version; and agree to be personally accountable for the submitted contributions and further ensure that questions related to the accuracy or integrity of any part of the work, even ones in which the author was not personally involved, are appropriately investigated, resolved, and documented in the literature.

Funding

R.H.J.H. was funded by the Macquarie University Research Excellence Scholarship.

Acknowledgments

The authors thank Gary Mazzorana from Australian Rainforest Products for access to his plantation. We also thank Emily Lancaster for access to her experimental setup.

Conflicts of Interest

The authors declare no conflict of interest.

References

  1. Foley, J.A.; Ramankutty, N.; Brauman, K.A.; Cassidy, E.S.; Gerber, J.S.; Johnston, M.; Mueller, N.D.; O’Connell, C.; Ray, D.K.; West, P.C.; et al. Solutions for a cultivated planet. Nature 2011, 478, 337–342. [Google Scholar] [CrossRef] [PubMed] [Green Version]
  2. Crist, E.; Mora, C.; Engelman, R. The interaction of human population, food production, and biodiversity protection. Science 2017, 356, 260–264. [Google Scholar] [CrossRef] [PubMed]
  3. Gebbers, R.; Adamchuk, V.I. Precision Agriculture and Food Security. Science 2010, 327, 828–831. [Google Scholar] [CrossRef] [PubMed]
  4. Zhang, C.; Kovacs, J.M. The application of small unmanned aerial systems for precision agriculture: A review. Precis. Agric. 2012, 13, 693–712. [Google Scholar] [CrossRef]
  5. Mulla, D.J. Twenty five years of remote sensing in precision agriculture: Key advances and remaining knowledge gaps. Biosyst. Eng. 2013, 114, 358–371. [Google Scholar] [CrossRef]
  6. Maes, W.H.; Steppe, K. Perspectives for Remote Sensing with Unmanned Aerial Vehicles in Precision Agriculture. Trends Plant Sci. 2018, 1–13. [Google Scholar] [CrossRef] [PubMed]
  7. West, J.S.; Bravo, C.; Oberti, R.; Lemaire, D.; Moshou, D.; McCartney, H.A. The potential of optical canopy measurement for targeted control of field crop diseases. Annu. Rev. Phytopathol. 2003, 41, 593–614. [Google Scholar] [CrossRef] [PubMed]
  8. Bhattacharya, S. Deadly new wheat disease threatens Europe’s crops. Nature 2017, 542, 145–146. [Google Scholar] [CrossRef] [PubMed] [Green Version]
  9. Mahlein, A.-K. Plant Disease Detection by Imaging Sensors – Parallels and Specific Demands for Precision Agriculture and Plant Phenotyping. Plant Dis. 2016, 100, 241–251. [Google Scholar] [CrossRef] [PubMed]
  10. Lechenet, M.; Dessaint, F.; Py, G.; Makowski, D.; Munier-Jolain, N. Reducing pesticide use while preserving crop productivity and profitability on arable farms. Nat. Plants 2017, 3, 1–6. [Google Scholar] [CrossRef] [PubMed]
  11. Oerke, E.-C.; Mahlein, A.-K.; Steiner, U. Detection and Diagnostics of Plant Pathogens, 5th ed.; Gullino, M.L., Bonants, P.J.M., Eds.; Springer: Dordrecht, The Netherlands, 2014; ISBN 978-94-017-9019-2. [Google Scholar]
  12. Dash, J.P.; Watt, M.S.; Pearse, G.D.; Heaphy, M.; Dungey, H.S. Assessing very high resolution UAV imagery for monitoring forest health during a simulated disease outbreak. ISPRS J. Photogramm. Remote Sens. 2017, 131, 1–14. [Google Scholar] [CrossRef]
  13. Calderón, R.; Montes-Borrego, M.; Landa, B.B.; Navas-Cortés, J.A.; Zarco-Tejada, P.J. Detection of downy mildew of opium poppy using high-resolution multi-spectral and thermal imagery acquired with an unmanned aerial vehicle. Precis. Agric. 2014, 15, 639–661. [Google Scholar] [CrossRef] [Green Version]
  14. Carnegie, A.J.; Lidbetter, J.R.; Walker, J.; Horwood, M.A.; Tesoriero, L.; Glen, M.; Priest, M.J. Uredo rangelii, a taxon in the guava rust complex, newly recorded on Myrtaceae in Australia. Australas. Plant Pathol. 2010, 39, 463–466. [Google Scholar] [CrossRef]
  15. Glen, M.; Alfenas, A.C.; Zauza, E.A.V.; Wingfield, M.J.; Mohammed, C. Puccinia psidii: A threat to the Australian environment and economy—A review. Australas. Plant Pathol. 2007, 36, 1–16. [Google Scholar] [CrossRef]
  16. Carnegie, A.J.; Kathuria, A.; Pegg, G.S.; Entwistle, P.; Nagel, M.; Giblin, F.R. Impact of the invasive rust Puccinia psidii (myrtle rust) on native Myrtaceae in natural ecosystems in Australia. Biol. Invasions 2016, 18, 127–144. [Google Scholar] [CrossRef]
  17. Berthon, K.; Esperon-Rodriguez, M.; Beaumont, L.J.; Carnegie, A.J.; Leishman, M.R. Assessment and prioritisation of plant species at risk from myrtle rust (Austropuccinia psidii) under current and future climates in Australia. Biol. Conserv. 2018, 218, 154–162. [Google Scholar] [CrossRef]
  18. Carnegie, A.J.; Pegg, G.S. Lessons from the Incursion of Myrtle Rust in Australia. Annu. Rev. Phytopathol. 2018, 56, 457–478. [Google Scholar] [CrossRef] [PubMed]
  19. Clarke, M. Australian Native Food Industry Stocktake; Rural Industries Research and Development Corporation: Barton, Australia, 2012; ISBN 9781742544090. [Google Scholar]
  20. Doran, J.; Lea, D.; Bush, D. Assessing Myrtle Rust in a Lemon Myrtle Provenance Trial; Rural Industries Research and Development Corporation: Barton, Australia, 2012; ISBN 9781742544403. [Google Scholar]
  21. Heim, R.H.J.; Wright, I.J.; Chang, H.-C.; Carnegie, A.J.; Pegg, G.S.; Lancaster, E.K.; Falster, D.S.; Oldeland, J. Detecting myrtle rust (Austropuccinia psidii) on lemon myrtle trees using spectral signatures and machine learning. Plant Pathol. 2018, 67, 1114–1121. [Google Scholar] [CrossRef]
  22. Bureau of Meteorology Climate Data Online. Available online: http://www.bom.gov.au/climate/data/index.shtml (accessed on 1 August 2018).
  23. Horwood, M.; Carnegie, A.; Park, R. Gathering Efficacy Data to Indentify the Most Effective Chemicals for Controlling Myrtle Rust (Uredo Rangelii); Plant Health Australia: Canberra, Australia, 2013. [Google Scholar]
  24. USGS National UAS Project Office. Unmanned Aircraft Systems Data Post-Processing; U.S. Geological Survey (USGS) National Unmanned Aircraft Systems (UAS) Project Office (NUPO): Lakewood, CO, USA, 2017. [Google Scholar]
  25. Wang, C.; Myint, S.W. A Simplified Empirical Line Method of Radiometric Calibration for Small Unmanned Aircraft Systems-Based Remote Sensing. IEEE J. Sel. Top. Appl. Earth Obs. Remote Sens. 2015, 8, 1876–1885. [Google Scholar] [CrossRef]
  26. QGIS Geographic Information System, Open Source Geospatial Foundation. 2009. Available online: http://qgis.osgeo.org (accessed on 7 March 2019).
  27. Hijmans, R.J. raster: Geographic Data Analysis and Modeling; 2017. R package version 2.6-7. 2017. Available online: https://CRAN.R-project.org/package=raster (accessed on 7 March 2019).
  28. R Core Team. R: A Language and Environment for Statistical Computing; R Foundation for Statistical Computing: Vienna, Austria, 2017. [Google Scholar]
  29. Davies, K. Plant Pigments and their Manipulation, 1st ed.; Davies, K., Ed.; Blackwell: Oxford, UK, 2004; Volume 14, ISBN 0849323509. [Google Scholar]
  30. Gitelson, A.A.; Merzlyak, M.N.; Chivkunova, O.B. Optical Properties and Nondestructive Estimation of Anthocyanin Content in Plant Leaves. Photochem. Photobiol. 2007, 74, 38–45. [Google Scholar] [CrossRef]
  31. Lee, D.; Brawner, J.; Pegg, G. Screening Eucalyptus cloeziana and E. argophloia populations for resistance to Puccinia psidii. Plant Dis. 2014, 99, 71–79. [Google Scholar] [CrossRef] [PubMed]
  32. Walters, D.R.; McRoberts, N. Plants and biotrophs: A pivotal role for cytokinins? Trends Plant Sci. 2006, 11, 581–586. [Google Scholar] [CrossRef] [PubMed]
  33. Ramsfield, T.; Dick, M.; Bulman, L.; Ganley, R. Briefing Document on Myrtle Rust, a Member of the Guava Rust Complex, and the Risk To New Zealand; SCION Next generation biomaterials: Rotorua, New Zealand, 2010. [Google Scholar]
  34. Wang, E.; Dong, C.; Park, R.F.; Roberts, T.H. Carotenoid pigments in rust fungi: Extraction, separation, quantification and characterisation. Fungal Biol. Rev. 2018, 32, 166–180. [Google Scholar] [CrossRef]
  35. Penuelas, J.; Baret, F.; Filella, I. Semi-empirical indices to assess carotenoids/chlorophyll a ratio from leaf spectral reflectance. Photosynthetica 1995, 31, 221–230. [Google Scholar]
  36. Morin, L.; Talbot, M.J.; Glen, M. Quest to elucidate the life cycle of Puccinia psidii sensu lato. Fungal Biol. 2014, 118, 253–263. [Google Scholar] [CrossRef] [PubMed]
  37. Rouse, J.W.; Hass, R.H.; Schell, J.A.; Deering, D.W. Monitoring vegetation systems in the great plains with ERTS. In Proceedings of the Third Earth Resources Technology Satellite Symposium, Washington, DC, USA, 10–14 December 1973; Volume 1, pp. 309–317. [Google Scholar]
  38. Di Gennaro, S.F.; Battiston, E.; Di Marco, S.; Facini, O.; Matese, A. Unmanned Aerial Vehicle (UAV)-based remote sensing to monitor grapevine leaf stripe disease within a vineyard affected by esca complex. Phytopathol. Mediterr. 2016, 55, 262–275. [Google Scholar] [CrossRef]
  39. Breiman, L. Random Forests. Mach. Learn. 2001, 45, 5–32. [Google Scholar] [CrossRef] [Green Version]
  40. Hastie, T.; Tibshirani, R.; Friedman, J. The Elements of Statistical Learning, 2nd ed.; Springer Series in Statistics; Springer: New York, NY, USA, 2009; ISBN 978-0-387-84857-0. [Google Scholar]
  41. Belgiu, M.; Drăgu, L. Random forest in remote sensing: A review of applications and future directions. ISPRS J. Photogramm. Remote Sens. 2016, 114, 24–31. [Google Scholar] [CrossRef]
  42. Genuer, R.; Poggi, J.-M.; Tuleau-Malot, C. VSURF: An R Package for Variable Selection Using Random Forests. R J. 2015, 7, 19–33. [Google Scholar] [CrossRef]
  43. Genuer, R.; Poggi, J.; Tuleau-Malot, C. Variable selection using random forests. Pattern Recognit. Lett. 2010, 31, 2225–2236. [Google Scholar] [CrossRef] [Green Version]
  44. Story, M.; Congalton, R.G. Accuracy assessment: A user’s perspective. Photogramm. Eng. Remote Sens. 1986, 52, 397–399. [Google Scholar] [CrossRef]
  45. Government New Zealand Protection and Response: Myrtle Rust. Available online: https://www.mpi.govt.nz/protection-and-response/responding/alerts/myrtle-rust (accessed on 10 September 2018).
  46. Lambert, S.; Waipara, N.; Black, A.; Mark-Shadbolt, M.; Wood, W. Indigenous Biosecurity: Māori Responses to Kauri Dieback and Myrtle Rust in Aotearoa New Zealand. In The Human Dimensions of Forest and Tree Health; Springer International Publishing: Cham, Switzerland, 2018; pp. 109–137. [Google Scholar] [Green Version]
  47. Sandino, J.; Pegg, G.; Gonzalez, F.; Smith, G. Aerial Mapping of Forests Affected by Pathogens Using UAVs, Hyperspectral Sensors, and Artificial Intelligence. Sensors 2018, 18, 944. [Google Scholar] [CrossRef] [PubMed]
  48. Mahlein, A.-K.; Kuska, M.T.; Behmann, J.; Polder, G.; Walter, A. Hyperspectral Sensors and Imaging Technologies in Phytopathology: State of the Art. Annu. Rev. Phytopathol. 2018, 56, 535–558. [Google Scholar] [CrossRef] [PubMed]
  49. Mahlein, A.K.; Steiner, U.; Dehne, H.W.; Oerke, E.C. Spectral signatures of sugar beet leaves for the detection and differentiation of diseases. Precis. Agric. 2010, 11, 413–431. [Google Scholar] [CrossRef]
  50. Albetis, J.; Duthoit, S.; Guttler, F.; Jacquin, A.; Goulard, M.; Poilvé, H.; Féret, J.B.; Dedieu, G. Detection of Flavescence dorée grapevine disease using Unmanned Aerial Vehicle (UAV) multispectral imagery. Remote Sens. 2017, 9, 1–20. [Google Scholar] [CrossRef]
  51. Gates, D.M.; Keegan, H.J.; Schleter, J.C.; Weidner, V.R. Spectral Properties of Plants. Appl. Opt. 1965, 4, 11. [Google Scholar] [CrossRef]
  52. Gitelson, A.A.; Merzlyak, M.N.; Lichtenthaler, H.K. Detection of Red Edge Position and Chlorophyll Content by Reflectance Measurements Near 700 nm. J. Plant Physiol. 1996, 148, 501–508. [Google Scholar] [CrossRef]
  53. Knipling, E.B. Physical and Physiological Basis for the Reflectance of Visible and Near Infrared Radiation from Vegetation. Remote Sens. Environ. 1970, 1, 155–159. [Google Scholar] [CrossRef]
  54. Kokaly, R.F.; Skidmore, A.K. Plant phenolics and absorption features in vegetation reflectance spectra near 1.66 μm. Int. J. Appl. Earth Obs. Geoinf. 2015, 43, 55–83. [Google Scholar] [CrossRef]
  55. Lopatin, J.; Dolos, K.; Kattenborn, T.; Fassnacht, F.E. How canopy shadow affects invasive plant species classification in high spatial resolution remote sensing. Remote Sens. Ecol. Conserv. 2019, 1–16. [Google Scholar] [CrossRef]
  56. Mostafa, Y. A Review on Various Shadow Detection and Compensation Techniques in Remote Sensing Images. Can. J. Remote Sens. 2017, 43, 545–562. [Google Scholar] [CrossRef]
Figure 1. Aerial view of the experimental setup. For each of the three classes (TR = treated, UN = untreated, SHD = shadow) eight equally sized polygons were drawn and representatively distributed across the lemon myrtle trees. In our analysis, these circular areas were used to sample pixels from each class. These pixel samples were used to train our random forest classification model. UN = brown/orange, TR = green, SHD = black.
Drones 03 00025 g001
Figure 2. The sampled lemon myrtle trees (A) are grown in rows on the plantation. Trees without fungicide treatment can show various symptoms depending on the phase of pathogenesis. The upper right image (B) shows treated mature leaves that are not actively infected and thus show only old necrotic lesions caused by infections when those leaves were still young. Examples of active infections are found in image (C) and (D) where yellow urediniospores cause symptoms on untreated younger leaves. Surrounding those infections sites, red halos can be observed.
Drones 03 00025 g002
Figure 3. Reflectance signatures derived from our aerial imagery for each lemon myrtle tree class present on the ground (Shadow = SHD, Treated = TR and Untreated = UN). Colored areas are indicating broad spectral bands that can be captured by the utilized Micasense RedEdge 3 camera.
Drones 03 00025 g003
Figure 4. Experimental site from an aerial view. Each fungicide treated (TR) row of trees was separated by a buffer row (B) from untreated (UN) trees. Buffer rows were interspersed to avoid unintentional fungicide treatment of untreated trees. All trees have been colored according to the predictions of our classification model. Treated rows are expected to be healthy (green) and were mostly predicted as such. Rows without fungicide treatment are likely to be infected (orange) and were also predicted with high accuracy. East-facing shadows (black; compare Figure 1) were added to the prediction to avoid confusion between shadows of treated trees and untreated trees. Shadows were also predicted with high accuracy.
Drones 03 00025 g004
Table 1. Spectral vegetation indices included as predictor variables in our classification models. NIR = near-infrared, R = red, B = blue, G = green, RE = red-edge.
Spectral Vegetation Index (SVI)SVI AbbreviationFormulaReference
Normalized Difference Vegetation IndexNDVI N D V I = N I R R N I R + R [37]
Structure Insensitive Pigment IndexSIPI S I P I =   N I R B N I R R [35]
Anthocyanin Reflectance IndexARI A R I = 1 G 1 R E [30]
Green/Red Simple Ratio IndexG/R G R I n d e x = G R [13]
Table 2. Classification metrics for the classification when shadows were included as a separate class. The lower right cell contains the overall accuracy (95.0%). Class specific accuracies can be found in the lower marginal row (producer accuracy, PA) and outer right marginal column (user accuracy, UA). Values shown in diagonal cells contain correctly classified pixel samples for each class and the total number of pixel samples (3608).
Error MatrixReference
ShadowTreatedUntreatedTotalUA
PredictionShadow11581924120196.4%
Treated14112837117995.7%
Untreated30561142122893.0%
Total1202120312033608
PA96.3%93.8%94.9% 95.0%
Table 3. Important predictors for the classification when shadows were included as a separate class. The absolute and relative importance is provided. The first row indicates the overall rank for each predictor.
Rank123456789
BandRENIRRG/RARIGNDVIBSIPI
Abs. Imp.0.30.260.130.130.110.090.090.070.04
Rel. Imp.10.850.360.340.260.210.170.130

