Article

Monitoring Dynamic Braided River Habitats: Applicability and Efficacy of Aerial Photogrammetry from Manned Aircraft versus Unmanned Aerial Systems

1
Zoology Department, Otago University, Dunedin 9016, New Zealand
2
School of Geography, Otago University, Dunedin 9016, New Zealand
3
Department of Conservation, Dunedin 9016, New Zealand
*
Author to whom correspondence should be addressed.
Submission received: 30 March 2021 / Revised: 10 May 2021 / Accepted: 14 May 2021 / Published: 17 May 2021
(This article belongs to the Special Issue Feature Papers of Drones)

Abstract

:
Despite growing interest in using lightweight unmanned aerial systems (UASs) for ecological research and conservation, review of the operational aspects of these evolving technologies is limited in the scientific literature. To derive an objective framework for choosing among technologies we calculated efficiency measures and conducted a data envelopment productivity frontier analysis (DEA) to compare the efficacy of using manned aircraft (Cessna with Aviatrix triggered image capture using a 50 mm lens) and UAS (Mavic Pro 2) for photogrammetric monitoring of restoration efforts in dynamic braided rivers in Southern New Zealand. Efficacy assessment was based on the technological, logistical, administrative, and economic requirements of pre (planning), peri (image acquiring) and post (image processing) phases. The results reveal that the technological and logistic aspects of UASs were more efficient than manned aircraft flights. Administratively, the first deployment of UASs is less efficient but was very flexible for subsequent deployment. Manned aircraft flights were more productive in terms of the number of acquired images, but the ground resolution of those images was lower compared with those from UASs. Frontier analysis confirmed that UASs would be economical for regular monitoring of habitats—and even more so if research personnel are trained to fly the UASs.

1. Introduction

The use of digital aerial imagery for habitat monitoring is an evolving technology [1]. Increasing computational power, the availability of low-cost unmanned aerial systems (UASs), and the development of software for image analysis have made aerial imagery using UASs a tool of growing interest among conservation researchers and practitioners [2]. Since these technologies are relatively new, there is only a handful of scientific papers discussing their operational complexities [3]. It will be useful to have a comparative summary of available technology with information about their applicability and efficiency for a given purpose such as habitat monitoring [4,5,6], wildlife monitoring [7,8,9], vegetation change analysis [10,11], forest inventory [12], monitoring agricultural productivity [13,14] etc.
Braided rivers are one of the most dynamic ecosystems of the world [15]. The unique geomorphology and hydrological regime give rise to a range of habitats along the braided riverbeds [16]. These diverse microhabitats are often endangered due to the growing threat of habitat modifications induced by the upstream hydrological change and invasion by introduced flora and fauna [15]. Monitoring the consequences of these impacts is important for conserving the unique and often endemic flora and fauna of these habitats [17]. Braided river systems are prone to changes, as the complex spatial and fluvial arrangements are easily altered by fluctuations in the upstream flow regime [15]. The dynamic nature of the braided river ecosystem makes habitat monitoring challenging as changes often happen within a short period following local weather events, such as high precipitation in the catchments. Lack of accessibility, logistics, and resources can be additional challenges. Remote sensing methods are being increasingly used in such situations [6].
There are many candidate remote sensing technologies to choose from, ranging from satellite imagery to lightweight unmanned aerial vehicles (UASs) [18], as well as aerial photographs using flights with manned aircraft [19]. Unmanned aerial systems are also referred to as unmanned aerial vehicles (UAVs). The term “unmanned” is sometimes argued as not being gender-neutral and “unoccupied” is suggested as an alternative [20]. However, we have persisted with the terms “manned” and “unmanned” as these are widely used. Each of these remote sensing methods have a wide range of features to choose from. For example, UASs vary in flying technology from fixed-wing or multi-rotor [21] and can be equipped with various sensors including RGB [11], infra-red [22], thermal bands [9], or even laser scanners [23]. Reviews of different UAS technologies are available in the literature [21], but the technology is ever-evolving and new choices are added to the mix relatively frequently. There are also varying options for flight planning, operating, image acquisition, and image processing software [24]. However, there is a lack in the scientific literature of objective comparison of technological alternatives for a given application [1]. Cost-based decision making often underestimates logistical, administrative, and other technological challenges [3]. There is need for a comprehensive framework that can incorporate these different aspects and can still objectively compare different technologies and assess their efficiencies for a given purpose. In this study, we assess the applicability of aerial photogrammetry for monitoring changes in the habitat features of the Aparima River, a braided river in Southern New Zealand, and compare the efficacy of using manned aircraft versus unmanned aerial vehicles (UASs).

2. Materials and Methods
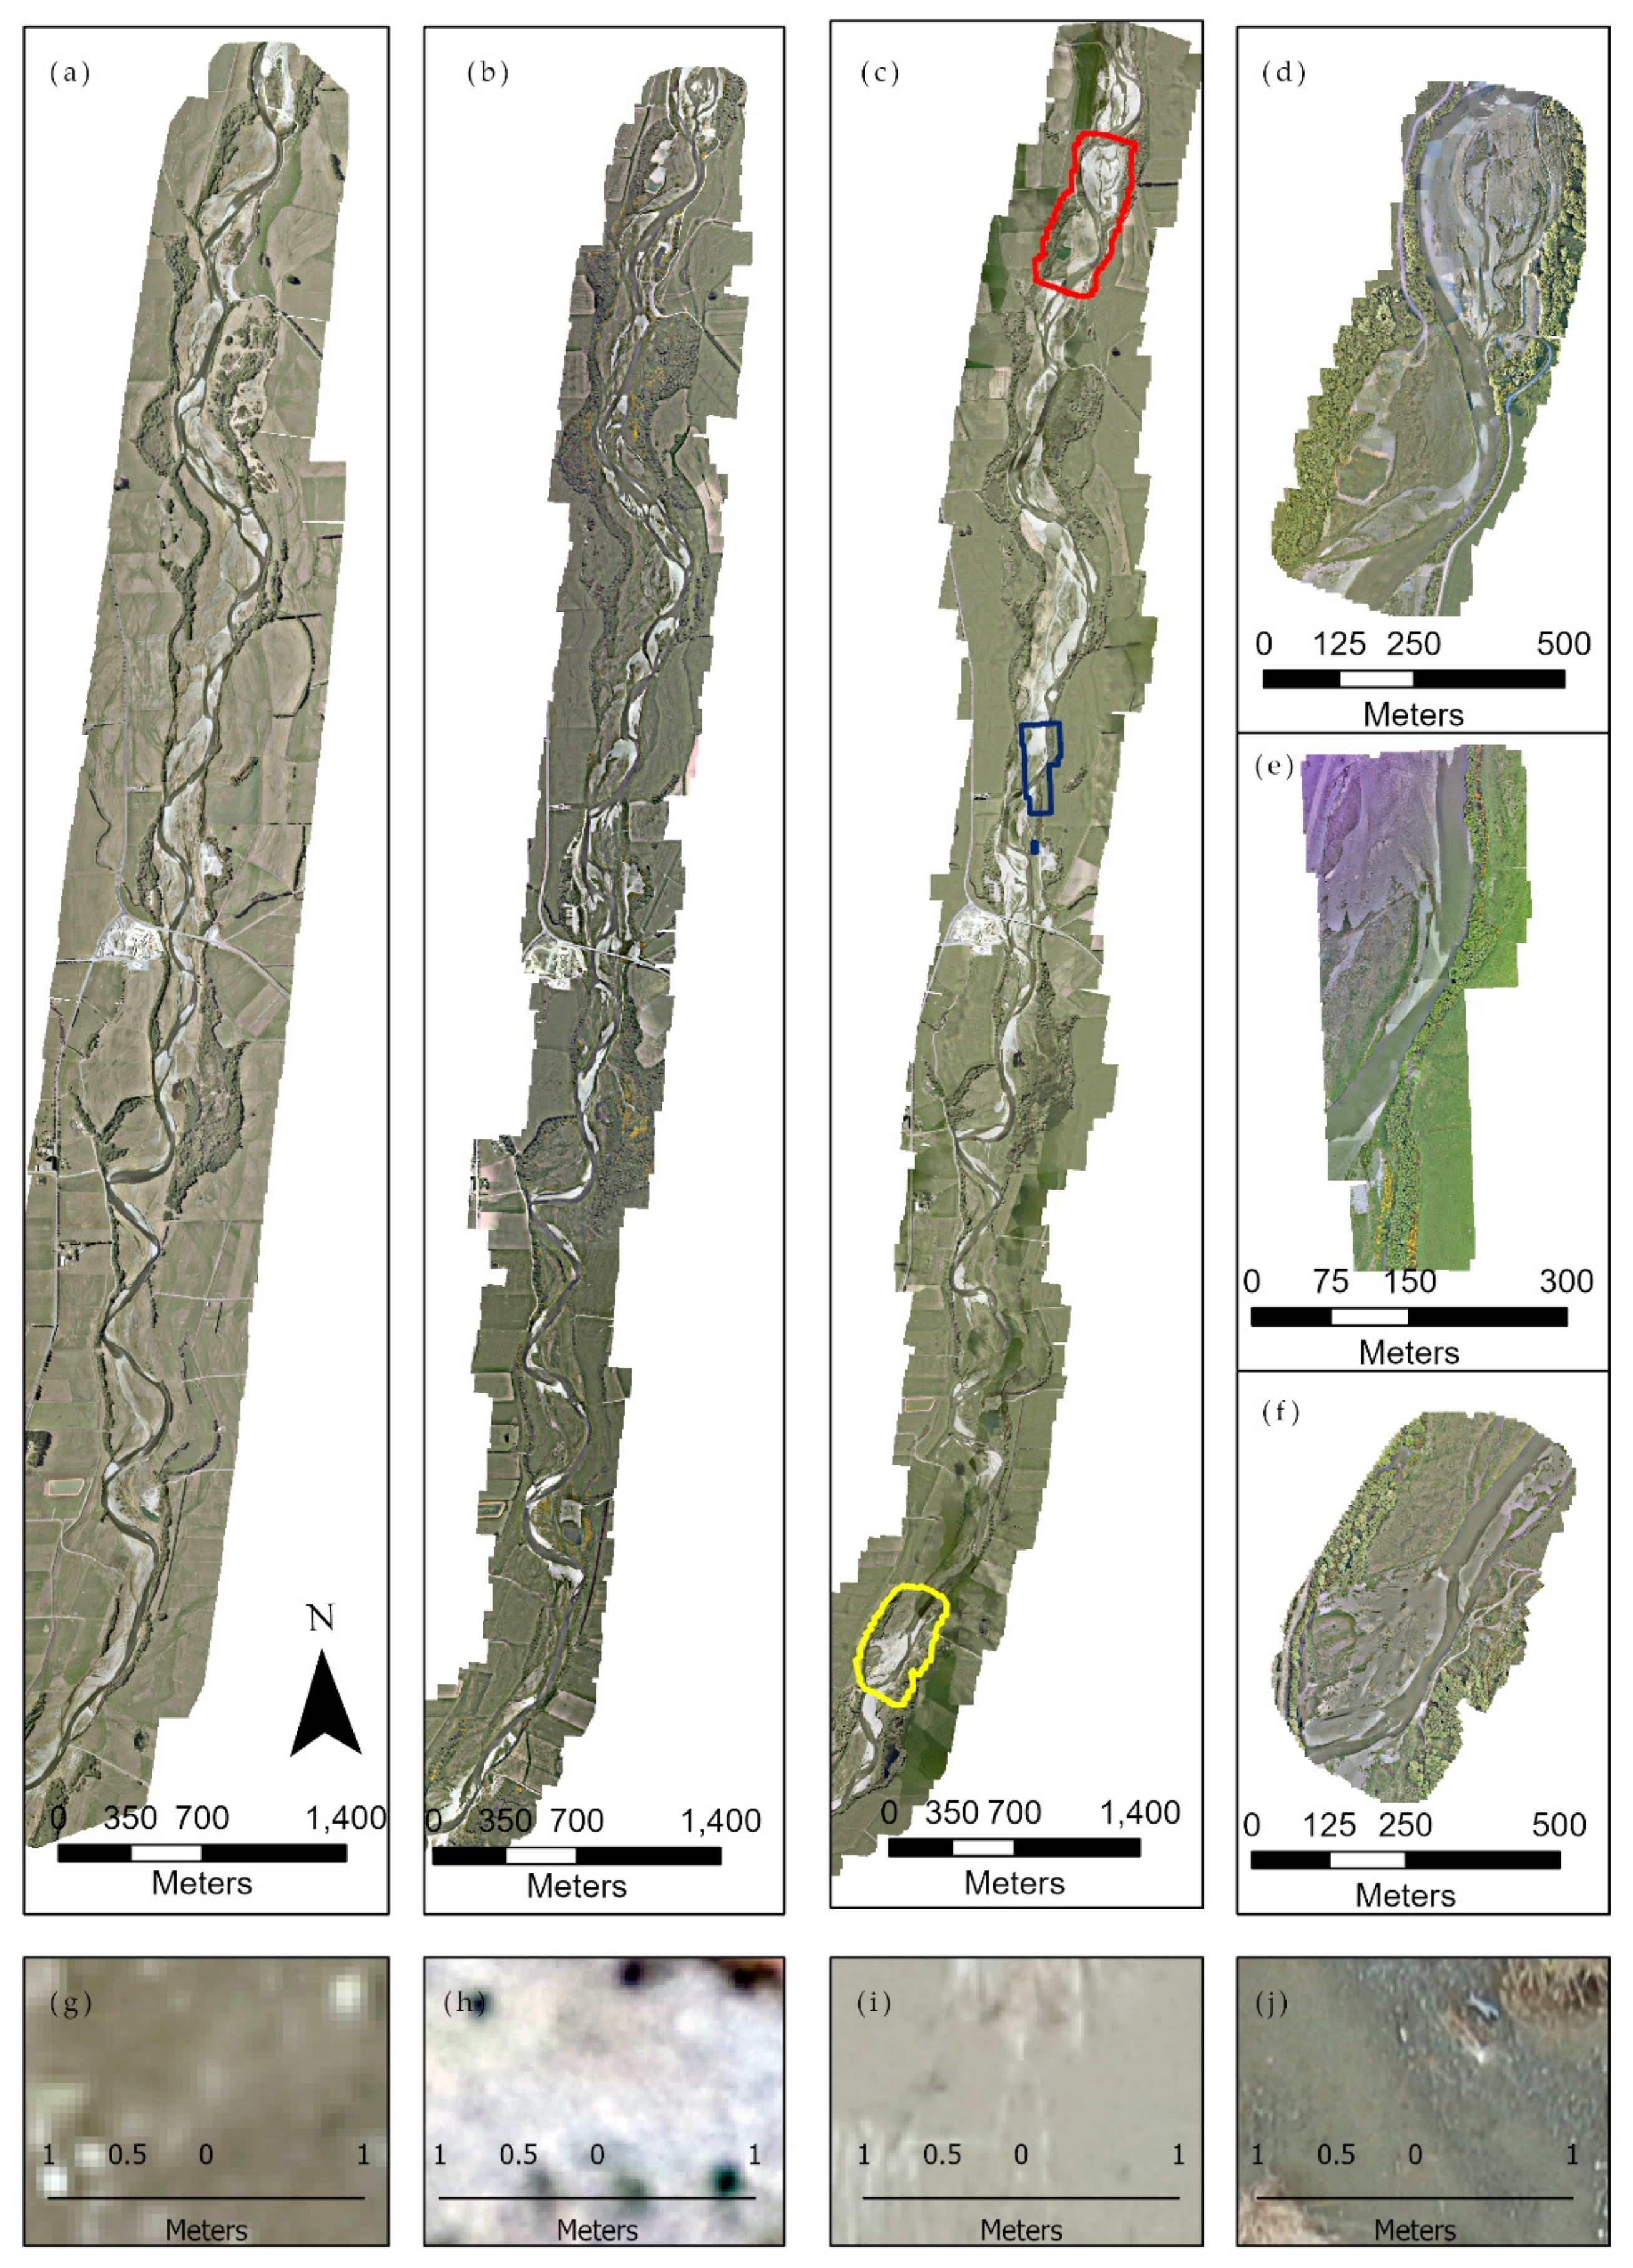
2.1. Study Site

A 10 km stretch of the Aparima River (46.0003° S, 168.1095° E) is being monitored for changes in habitat features due to ongoing commercial gravel extraction from the riverbed. The goal of the monitoring is to assess the changes and inform habitat management solutions to maintain habitat suitability for a range of native species. In this research, manned aircraft and unmanned aerial photogrammetry tools are compared in order to select an economically viable and technologically suitable remote sensing monitoring system.

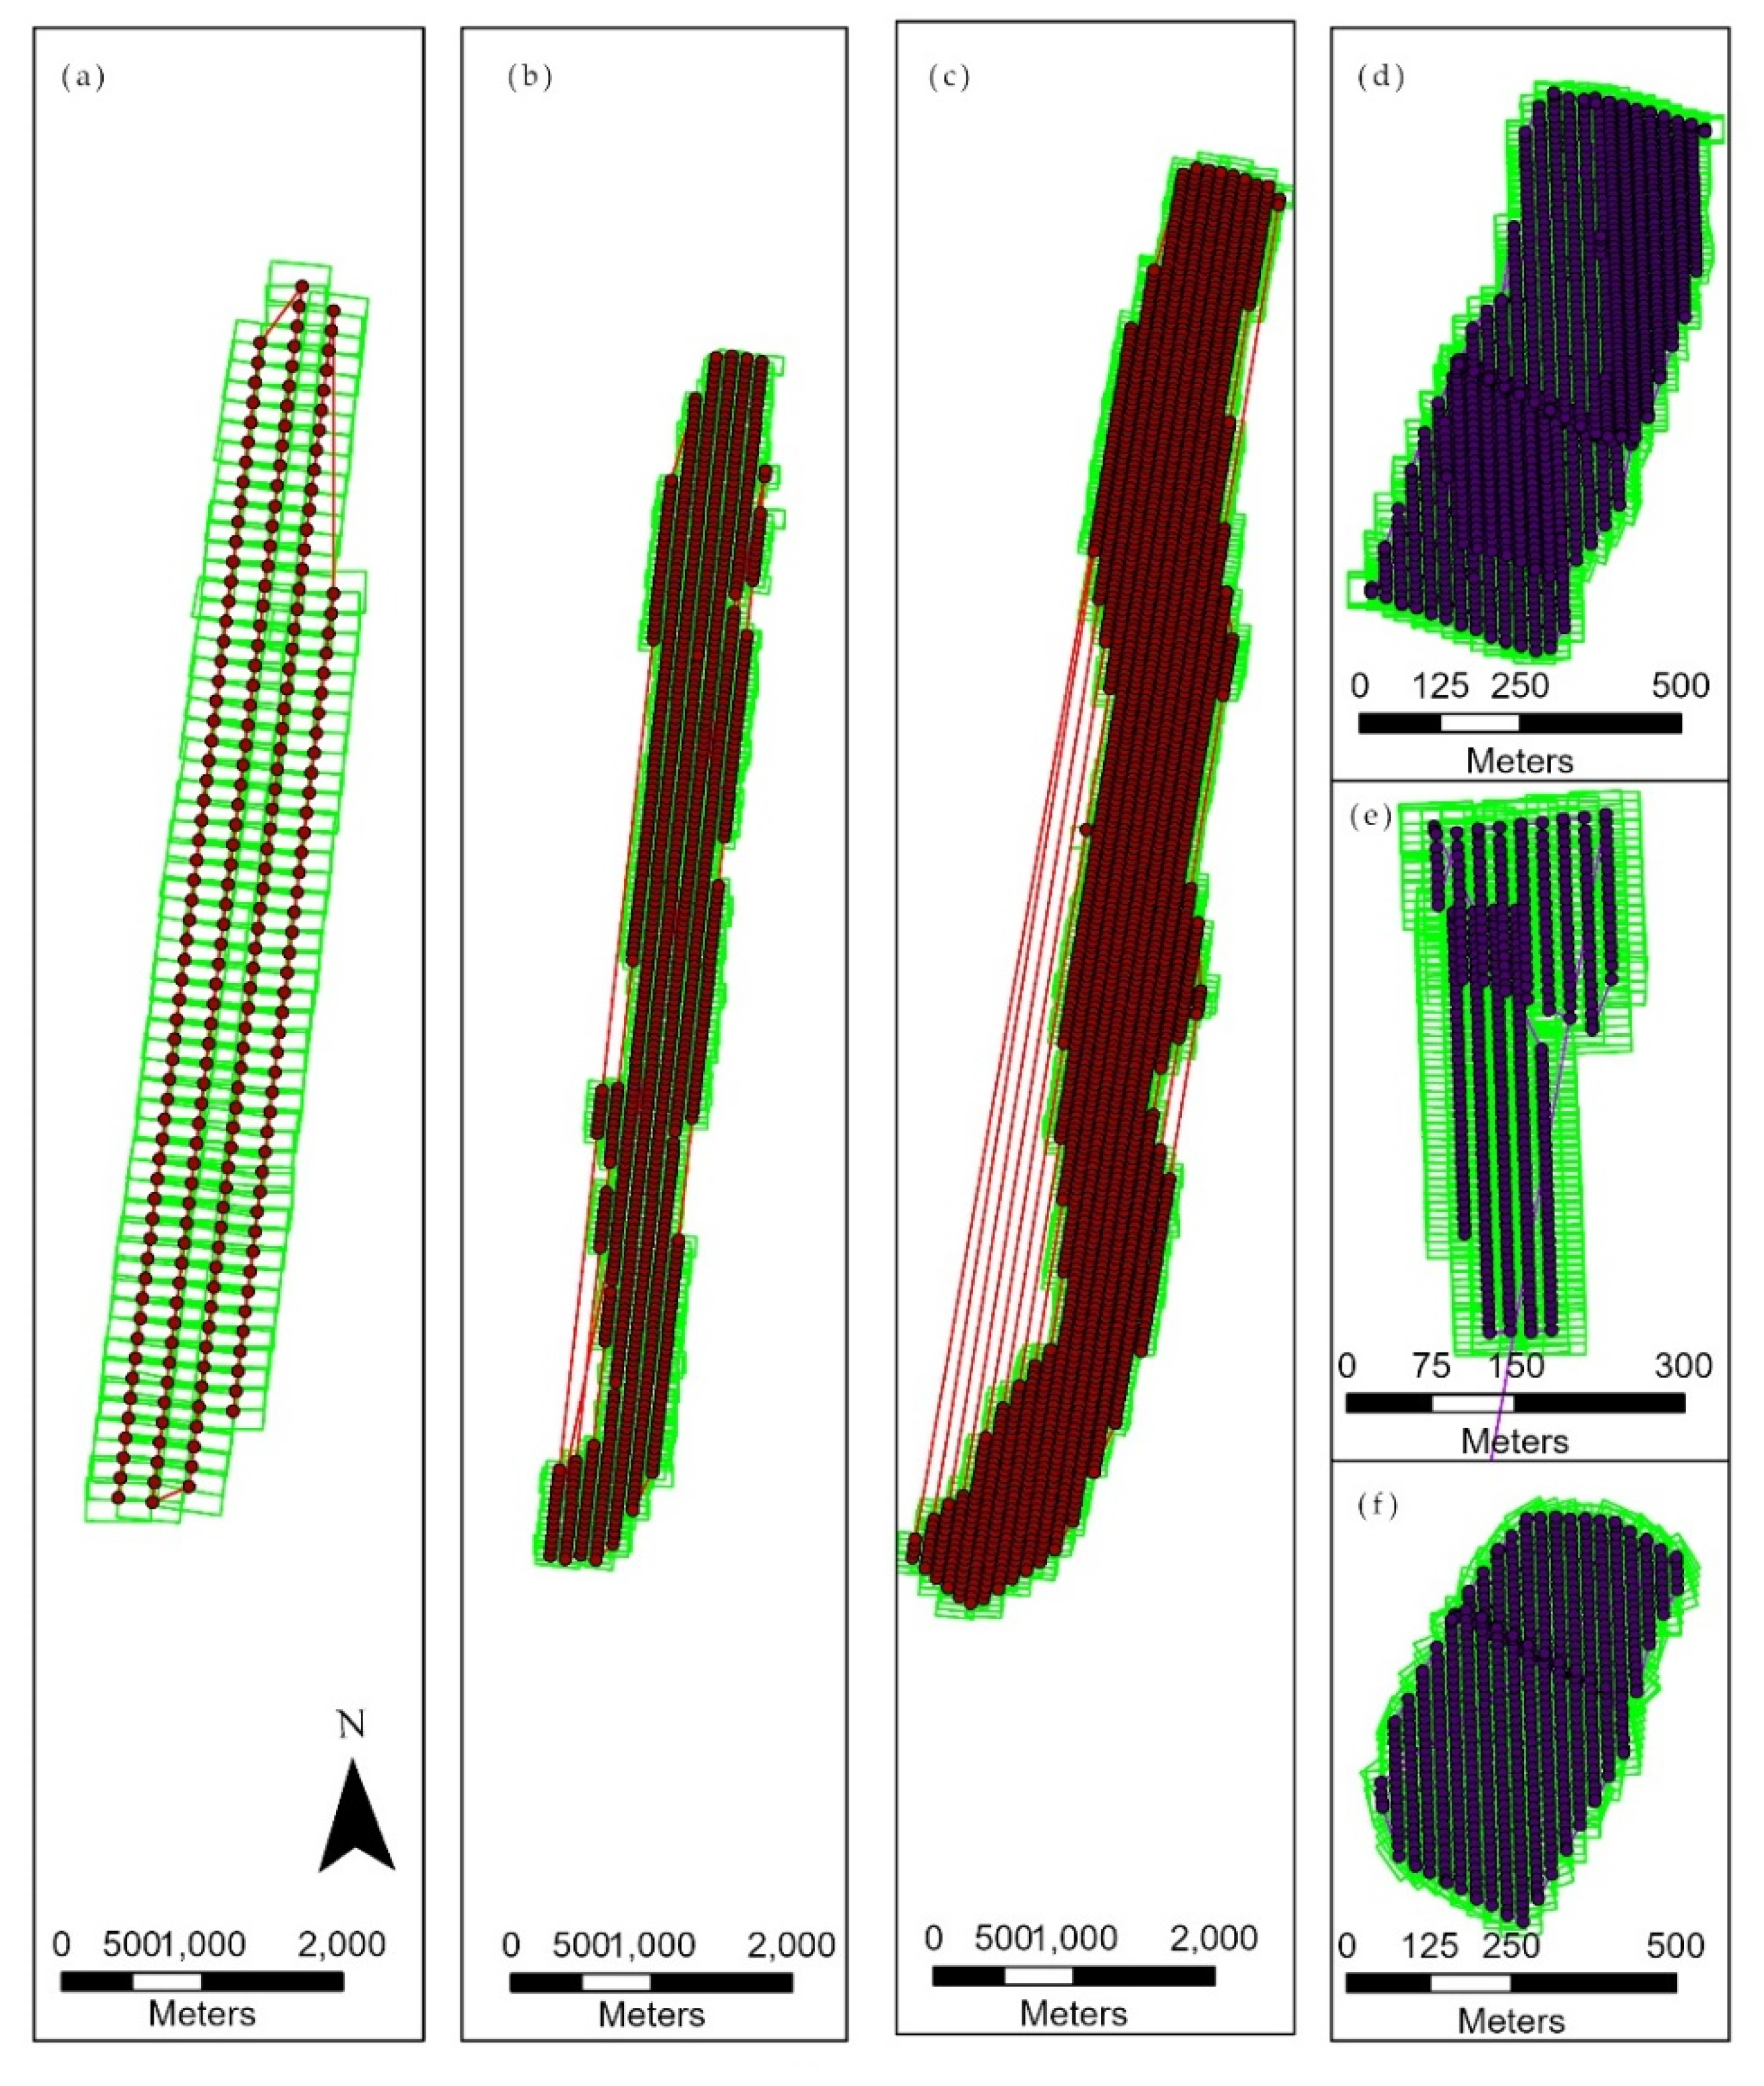
2.2. Manned Aircraft and Unmanned Flight Missions

The manned aircraft flights were performed with a Cessna 180 customized to carry aerial photogrammetry equipment [19]. Onboard was an Aviatrix aerial photography system capable of triggering photographs at pre-fixed points along the planned flight lines. Altitude above ground level, and image resolution and the number of flight lines was also pre-set. The camera used was a Canon EOS 5DS r with a Sigma 50 mm lens. The flight planning was carried out in Flight Planner Pro software from Aeroscientific (Adelaide, Australia), licensed through the Department of Conservation. The image sizes were 8688 × 5792 pixels with 50% sidewise and 68% forward overlaps. Three manned aircraft flight missions were carried out in February 2018, December 2019, and October 2020 at 608 m, 518 m, and 304 m altitude above ground level (AGL), respectively. All manned aircraft flights were performed at a speed of 166.70 km/h.
The unmanned flights were carried out with a commercially available Mavic2 pro quadcopter (DJI, China) carrying a 20 MP Hasselblad camera with a 28 mm equivalent focal length. The image sizes for unmanned flights were 5472 × 3648 pixels with 70% overlaps. Flight planning for UASs was carried out with Pix4D software (Prilly, Switzerland) and the same software was used to fly the UAS with DJI control on a Samsung A10 mobile phone. The unmanned flights took place in October 2020 and November 2020. One site at the Northern end of the study area was performed on both the October and November missions, before and after a flood event of the riverbed habitat induced by high precipitation in late October. The flooding event possibly triggered the abandonment of colony exploration by white fronted terns (Sterna striata) in that site. The abandonment was a potential indicator of changes in habitat features. The re-deployment of the UAS within this short period was carried out to search for the changes in the habitat due to the flooding event. The average speed of UAS flights was 16.80 km/h and all were performed at 50 m altitude AGL. No ground control points (GCPs) were used for manned aircraft or UAS flights.
The manned aircraft flights covered the whole 10 km stretch of the Aparima River study area covering on average 863 ha. The unmanned flights covered three subsections of this larger area, comprising Northern and Southern ends, and a central area, a total of more than 83 ha (Figure 1). When necessary, the manned aircraft flight image geotags were updated using ExifTool software (Kingston, ON, Canada) [25] by syncing with the aviatrix trigger time log. All image processing analyses, including image mosaicking, were carried out in ESRI ArcGIS Pro 2.5, Redlands, CA, USA.

2.3. Input Resource Assessment

For a better insight into the aerial imaging technology, we have separated aerial photography operations into pre-, peri-, and post-flying phases. The pre-flying phase includes flight planning and mobilizing resources for the flying operation. The peri-flying phase includes the actual flight operation and image acquisition. The post-flying phase includes image sorting, storage, and various image analysis techniques. For ease of comparison, we have considered orthophoto mosaicking of the acquired images as the minimum step to be completed in the image processing phase.
Each of these three phases has technological, logistical, administrative, and economic aspects to assess. Technological resource assessment includes software and hardware availability, the required operating system or platform, and the trained personnel to operate these tools. Logistics refers to organizing the required resources for the operation. The administrative aspect is considered separately from logistics as it deals with compliance with various rules and guidelines for undertaking flight missions for aerial photography.

2.3.1. Technological Aspects

Technological complexity is subjective depending on the previous experience of the user. For a more objective assessment, the days of training required for someone who is generally enthusiastic about the technology is used as a proxy for the training needs. The data are generated from available formal training manuals, and the least number of days needed for basic functional engagement with the technology is considered. For example, for drone flying, diploma courses of a few months are available. However, for basic engagement, a two-day course and some hands-on flying experience is a basic necessity. Consequently, 30 days is considered as a proxy for drone flying training needs. For manned aircraft flight, however, flying the plane and managing the aerial imagery tools (Aviatrix system) are two distinct sets of skills. In our case, it was the same person who was the pilot who simultaneously managed the Aviatrix system on board. However, for resource assessment, we have considered the requirement as two trained skillsets. Any time requirement is rounded up to the next full day.

2.3.2. Administrative Aspects

For the administrative assessment, we considered the number of days required to secure the consent of all relevant stakeholders as an indicator of operational requirement. Stakeholders were selected based on the rules and guidelines in place for flying airplanes and drones. The stakeholders included air traffic control authorities, local councils, government organizations, and private owners. The time required for consent was considered as a whole, as the consent process could move simultaneously once initial communication had been established.

2.3.3. Economic Assessment

For the economic assessment, the cost of procuring all the services and equipment was considered. This includes the overall time required in technological, administrative, and logistical fronts for the different flying phases. For recurring monitoring missions, we included the establishment cost in the first mission and only included the resources that were required for any subsequent mission. For a manned aircraft flight, the cost of customization required to equip the airplane for aerial imaging is available from the reporting by the New Zealand Department of Conservation [19]. The lead time required for the customization of the manned aircraft flight is included as the logistics organization time for the first flight as a required investment. The cost of a drone flight is taken from the advertised price of the drone available for sales in New Zealand [26]. For our case, we borrowed the drone from the Department of Conservation’s Maukahuka project [27]. The communication required to organize the drone is taken as a substitute for the time required for procuring a drone from the market. No customization was required for the drone itself.
Apart from the quantitative assessments, we used information synthesis on different operational complexities as a qualitative assessment. For example, this would include an assessment of the particular software, which has restricted access or limitations on being used in the field because of the unavailability of a portable platform. Where possible, we have directly compared the resource requirement for the two technologies. The analytical frame used for these analyses is presented in Table 1.

2.4. Efficiency Measurements and Data Envelopment Analysis (DEA)

For quantitative efficiency assessment, we used Farrell efficiency within the data envelopment assessment (DEA) framework [28,29]. Farrell measures of efficiency are based on proportional changes to input or output, i.e., how much input can proportionally be reduced while maintaining the same output (input efficiency), and with the same amount of input how much can we proportionally increase the productivity (output efficiency) [11]. The input–based Farrell efficiency or just input efficiency, for a technology where input is x and output is y, is defined as
E f f i c i e n c y   ( I n p u t ) ,   E i = m i n   {   E i > 0   |   ( E i x ;   y ) }
In other words, it is the maximum proportional reduction of all inputs x that still can produce y amount. An input efficiency measure of 0:7 would indicate that the technology can save 30% off all inputs while producing the same outputs. Similarly, output–based Farrell efficiency or output efficiency is defined as
E f f i c i e n c y   ( O u t p u t ) ,   E o = m a x   {   E o > 0   |   ( x ;   E o y ) }
In other words, the maximal proportional increment of all outputs y that is possible for a given inputs x. An output efficiency measure of 1:2 suggests that the output can be increased by 20% without any additional input [28]. Simply put, the input efficiency is the actual input divided by the minimum input required, while the output efficiency is the actual output divided by expected output [28]. Again, in general terms, efficiency is measured by output divided by inputs. However, for a set of observed productivity scenario, the efficiency is scaled to the different input sets. The efficiency measure reported here is adjusted through the parameters used in the benchmarking procedure such as free disposability hull, variable returns to scale, decreasing returns to scale, etc. The reported efficiencies here are on a scale of 0 to 1, with 1 being the optimum effi-ciency [28,29,30].
The non-parametric DEA analysis is a widely used method for comparing produc-tion efficiency among different firms using varying technologies [29,31,32,33]. The chosen frontier type for DEA analysis was FDH+, which is a combination of free disposability hull (FDH) and constant return to scale [28,30]. FDH is a stair-way shaped frontier and the least restrictive on input data [28]. The free disposability implies that increased input results in the same or in higher productivity. The choice of these efficiency measures and frontier analysis is inspired by it being able to be used with low data availability, while being non-parametric requires the least amount of data transformation. The key productivity indicator (KPI) used for efficiency analysis is the number of the image acquired or processed. Area coverage and the desired ground resolution of those images were also included for discussing different aspects of efficiency. Since coarser (numerically higher) ground resolution means lower productivity, multiplicative inverse, or reciprocal of ground resolution, i.e., 1/ground resolution in cm was used in a quantitative analysis of efficiency. To make the fractions an integer, the reciprocal was normalized by multiplying by 100. We used the R package benchmarking [30] for all efficiency measurements and DEA production frontier analysis.

3. Results

3.1. Resource Assessment and Efficiency Measures

3.1.1. Technological

For manned aircraft flight, flight planner pro software was used. The software is licensed to the Department of Conservation. A demonstration version is available only by contacting the company and they also provide orientation and training sessions for the software as needed for any potential customer. Even though this is useful, there are certain challenges to accessing the service, as one must prove genuine intent as a potential buyer. The flight planner is available on PC and can be taken on board the flight with the Aviatrix system. An Aviatrix trigger box is available on order through aero scientific, which is a more restrictive accessibility than for other platforms available off the shelf.
For UAS, Pix4D software suite was used for flight planning and control of the drone during flight. The suite has software for flight planning and has extensions for operating flights on various platforms. Most of the drone flight planning and flying control interface comes as an application (app) to be used on Android mobiles and Apple iOS. This is convenient during field operation as adjustments and modifications can be easily accommodated. Similar software can be used for image analysis of both manned aircraft and unmanned flights. However, the images that were taken through manned aircraft flights needed to go through GPS geotagging correction as camera GPS tags are not always able to keep up with the image capture rate, and often record the same GPS location for multiple images.
Technologically, manned aircraft and unmanned flights have similar personnel requirements. For the peri-flying phase, the manned aircraft flight would need people trained with two distinct skill sets, whereas unmanned flights can be undertaken by one trained person and one supporting person (Supplementary Materials Table S1) to keep the UAS under constant manual viewing. However, the training needs for the peri-flying phase is much higher for manned aircraft flights than for unmanned flights (Table 2).
Whereas the manned aircraft flights generally have more outputs in terms of images captured or processed (Table 3), the image quality as indicated by ground resolution is higher for UASs (Table 3; Figure 2).
These findings are reflected in the efficiency measures (Table 4) where under technological efficiency, on average, manned aircraft flights are estimated to be about 90% efficient compared to the efficiency of unmanned flights through different flying phases (Table 4). The overall efficiency of the technological aspect for manned aircraft flights was about 76% that of the unmanned flights. The detailed efficiency measures for all the flight missions are included in Supplementary Materials Table S2.

3.1.2. Logistical

The logistics requirement is the highest for the peri-flying phase for both manned aircraft and unmanned flights. However, the logistical requirement, both in terms of time and cost, for manned aircraft flights is noticeably higher than for unmanned flights (Table 4). In terms of efficiency, overall, the manned aircraft flights are on an average 33% less efficient than unmanned flights (Table 4). For the pre- and post-flying phase, the logistics requirements for manned aircraft flights are still higher than for unmanned flights. The lower logistics requirement for UAS makes this more flexible, especially for re-deployments.

3.1.3. Administrative

The administrative input requirement for unmanned flights is higher than for manned aircraft flights, especially for the pre-flying phase (Table 2; Supplementary Materials Table S1). The unmanned flights require consent from any private landowners that have private land within the flight range. This adds to the time required for both planning and flying phases for unmanned flights (Supplementary Materials Table S1). Since flight planning could bypass the subsequent consent requirement, unmanned flights still perform more efficiently than manned aircraft flights on average for the pre-flying phase (Table 4). However, since consent is required each time an unmanned mission is performed it becomes less efficient than a manned aircraft flight. Overall, the administrative efficiency of manned aircraft flights was higher (Table 4).

3.1.4. Economic

From the economic aspect, unmanned flights required considerably lower inputs in terms of time and money throughout all flying phases (Table 2). The same trend is reflected in efficiency measures, and overall, the manned aircraft flights, on average, were about 39% efficient, whereas unmanned flights were 73% efficient (Table 4).

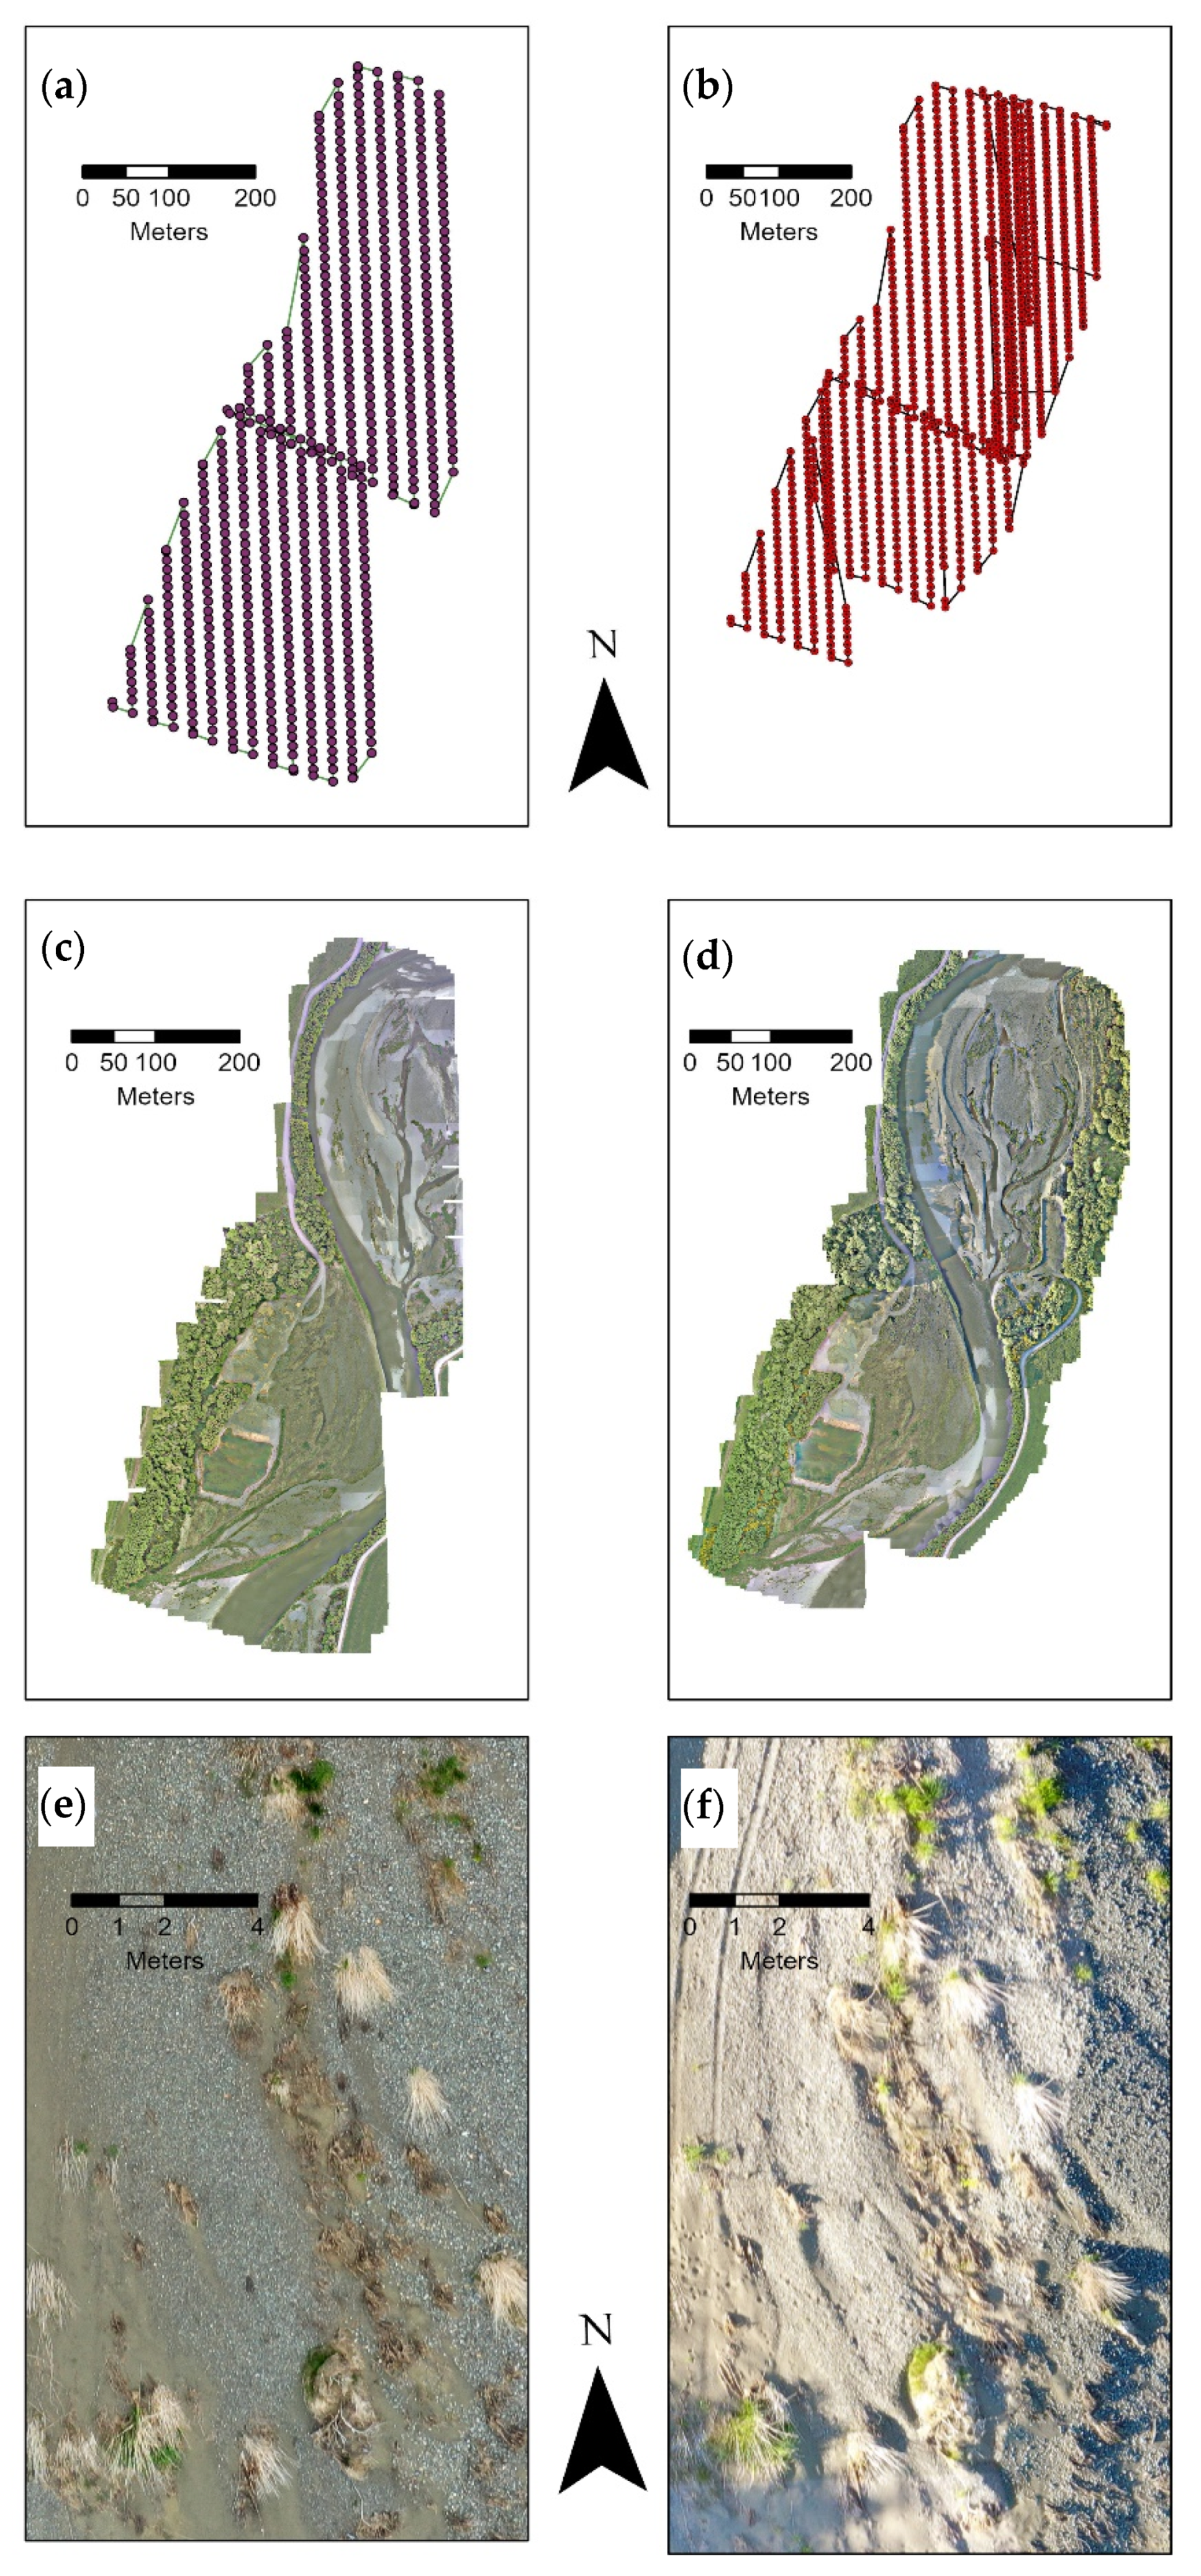
3.2. Re-Deployment of Unmanned Aerial Vehicles (UASs) Following a Flooding Event of the Riverbed

The Aparima River experienced a flooding event in late October 2020. It was immediately after the second UAS mission for acquiring photographs of the Northern end of the project site (Figure 2). Before the weather event, white fronted terns (S. striata) were exploring the site for potential colony establishment with an estimated 70 individuals observed in that site for few weeks spanning from September to October, 2020. However, after the weather event, the terns abandoned the site and did not return that summer. This was a good opportunity to assess the changes in the habitat due to the weather event within two weeks of the flooding event in early November. Although detailed image analysis (Figure 3) remains outside the scope of this article, a quick visual inspection reveals erosion of the sandy site as floodwater forced through the riverbed (Figure 3e,f). The ability to rapidly deploy a UAS enabled documentation of the sudden changes in habitat features. This would not have been possible with a manned aircraft flight, given the long period required for logistic requirements.

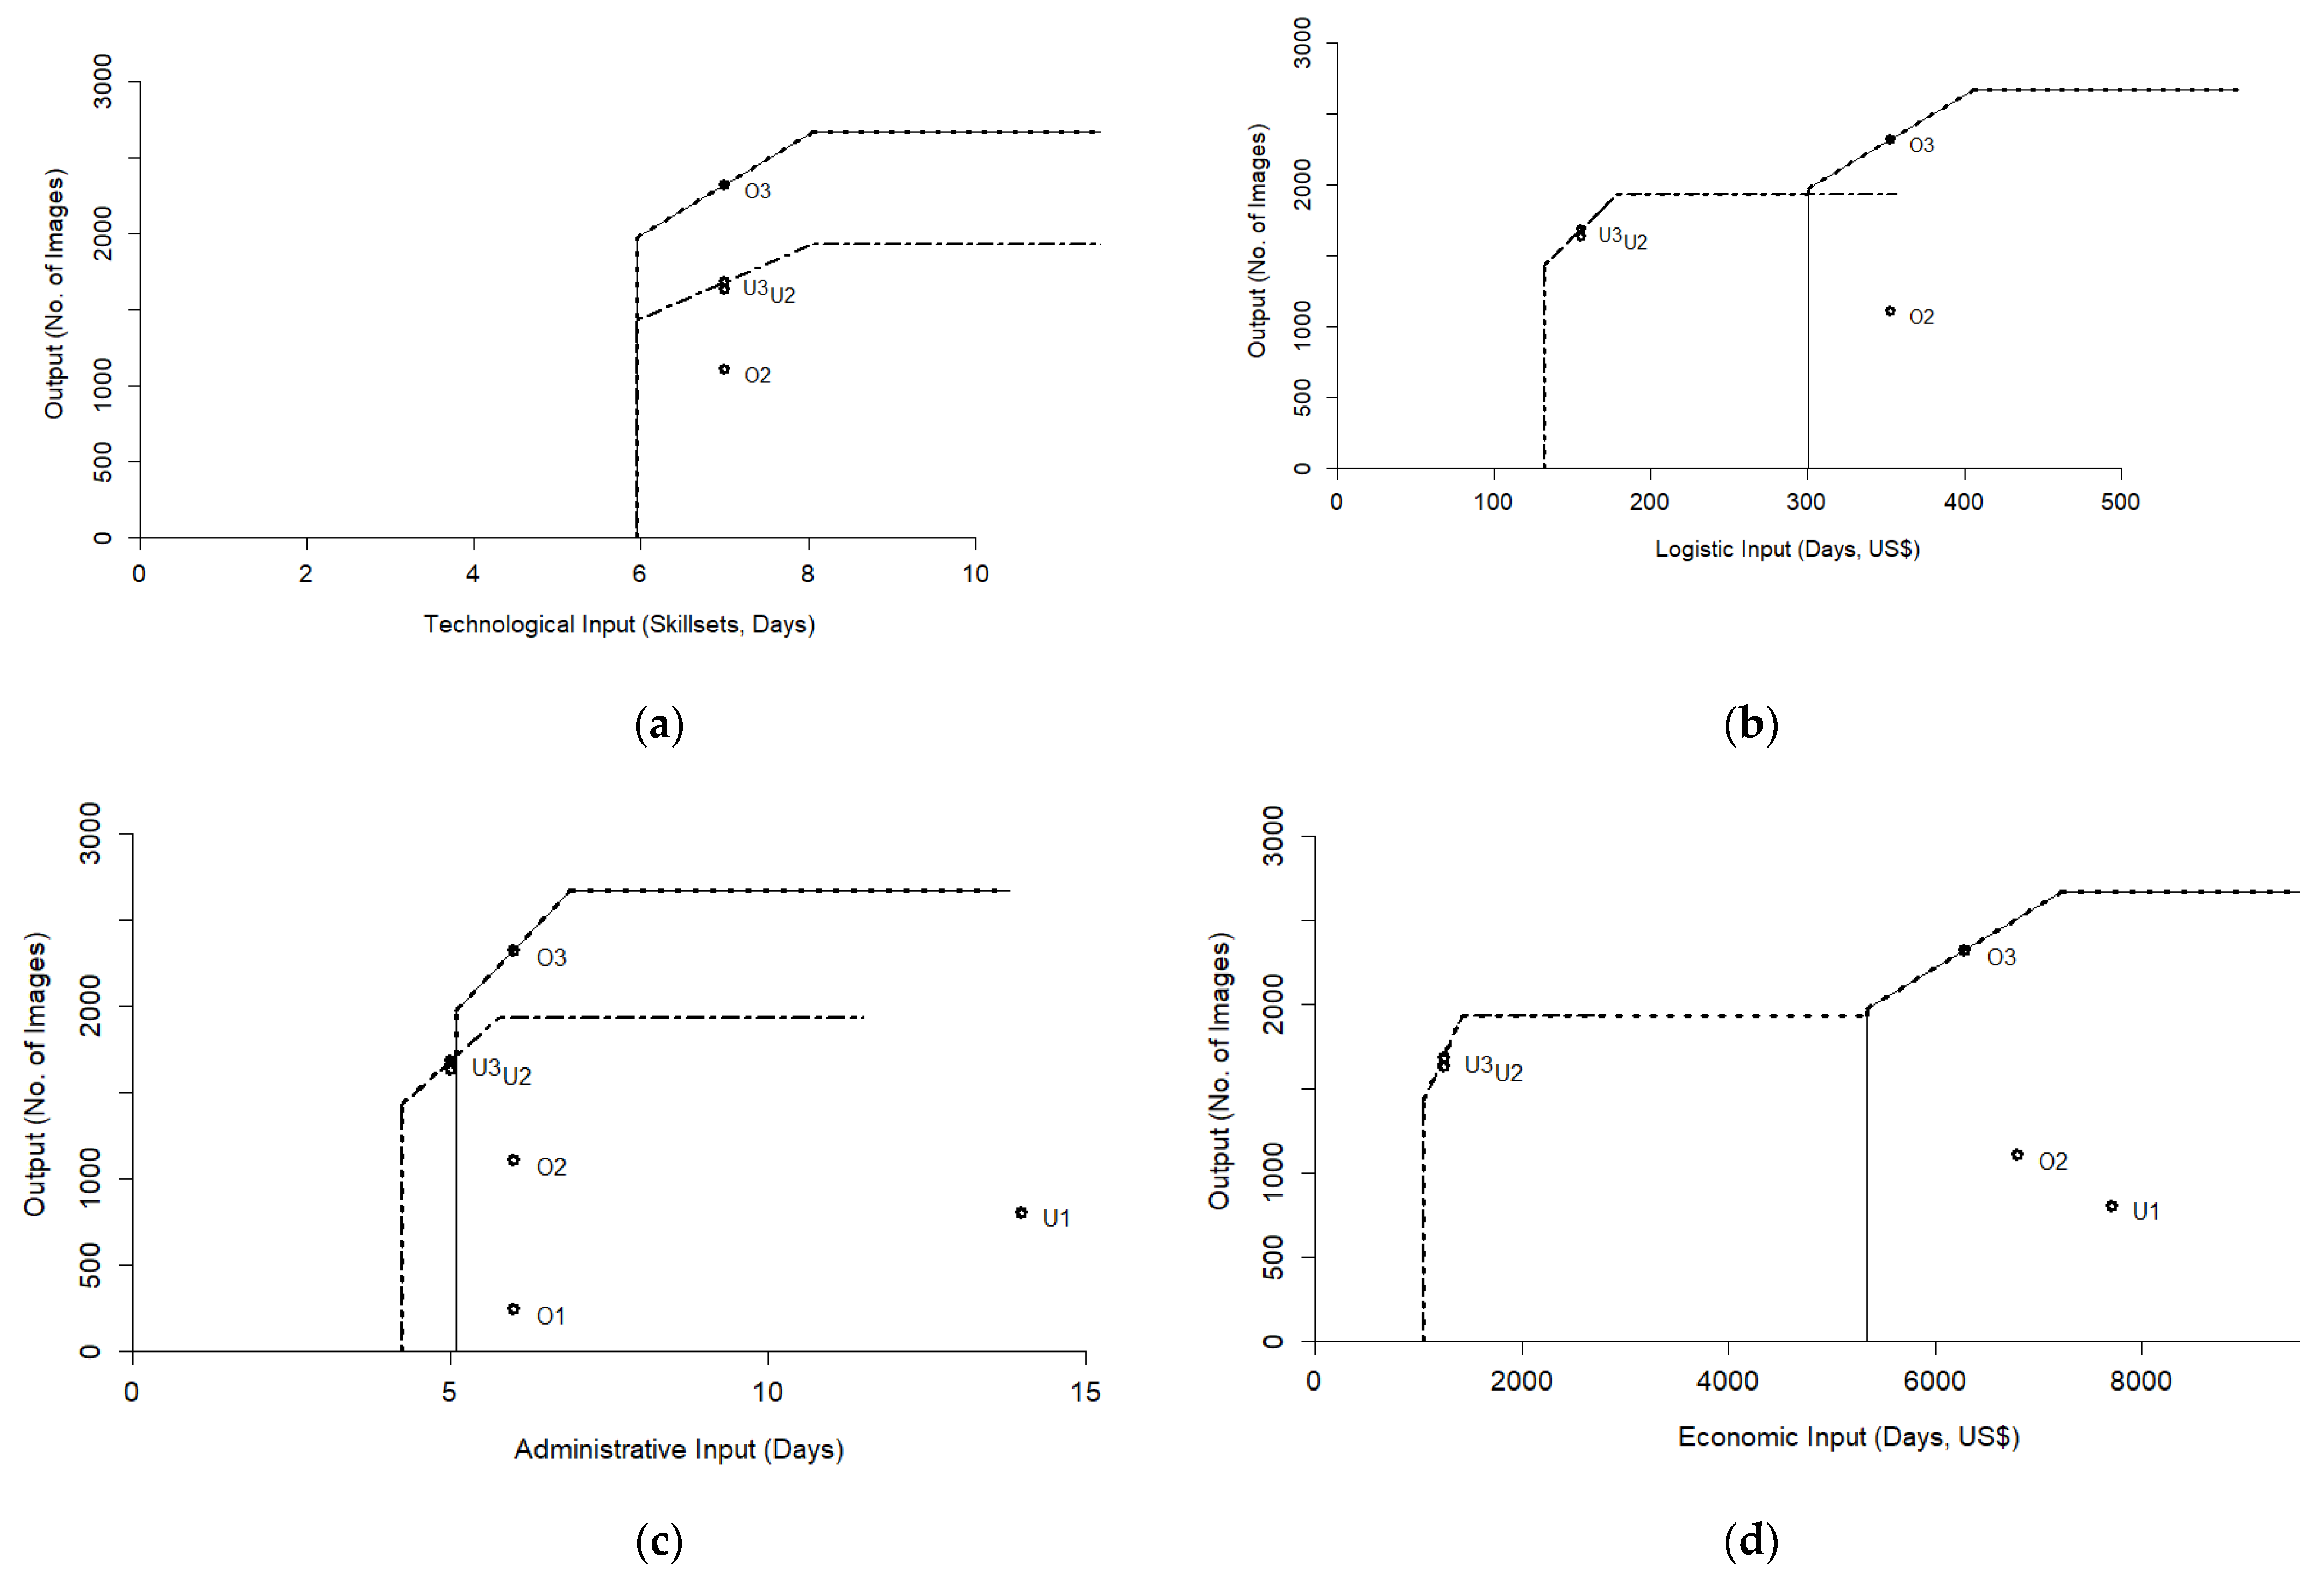
3.3. Comparison of Manned Aircraft and Unmanned Flights Through Data Envelopment Productivity Frontier Analysis (DEA)

The DEA frontier analysis shows that across all four aspects of aerial imaging, manned aircraft flights (Figure 4, solid lines) missions had higher productivity potential, i.e., higher output efficiency over unmanned flights (Figure 4, dashed lines). The unmanned flights have lower input requirements indicating the input efficiency of the unmanned flights (Figure 4).
Technologically, the manned aircraft and unmanned flights have similar minimum input requirements and manned aircraft flights will have higher productivity given the same inputs (Figure 4a). Unmanned flights need lower inputs for administrative, logistical, and economic components (Figure 2c,d and Figure 4b). However, it is the minimum input requirement (where the frontier crosses the x-axis representing inputs) that clearly shows that unmanned flights had much less initial investment and less time required for flight deployments.

4. Discussion

The results indicate that UASs have higher input efficiency, as minimum resource requirement for deploying UASs are lower than that for manned aircraft flights. Results also re-affirm that manned aircraft flights have higher output efficiency in acquiring more images and area coverage than UASs. However, UASs, are performed at a lower height, and usually have improved ground resolution of acquired images. More importantly, UAS missions are much more flexible than manned aircraft flights for subsequent deployment for monitoring dynamic habitats.

4.1. UASs Have Higher Input Efficiency Than Manned Aircraft Flights

The cost of arranging for UAS flights was much lower than for the manned aircraft flights. Moreover, the manned aircraft flights needed further customization to fit cameras and other accessories and therefore required approval from the Civil Aviation Authority [8]. Commercial aerial survey flights usually have these arrangements in place and are not included in the cost-only analysis. However, these requirements added to the pre-flying phase input, especially for the first fight mission of the manned aircraft flights, both in terms of time and money. These inputs are indicative of the technological complexities of the manned aircraft flights.
The manned aircraft flight operation is also much more training intensive than UASs. Flying a manned aircraft flight for aerial photography, where one needs to fly along a pre-planned flight line at a fixed speed, requires a long-term commitment for training and accumulation of flying experience. On the contrary, UAS operations are much easier to learn and implement. With only relatively brief training, project personnel can readily operate a UAS to obtain aerial photographs of the area of interest.
The lower cost of UAS-based aerial photography for a small area is considered one of the reasons for the growing use of UASs in various remote sensing operations [34], including aerial photography for monitoring conservation projects [2]. Apart from investment, UASs are considered safer as there is a lower risk to life and property in an event of an accident [35]. The critical public concern for drone usage is privacy [18] and this is reflected in UAS flying and usage guidelines mandating that consent must be secured from all private landowners and people present within the UAS flying zone. Even though manned aircraft flights could capture high-resolution images of the same area and people, there is no legal requirement for specific consent for image acquisition [36]. Securing flight consent is one notable feature, falling within the administrative category of flight operations, where the input requirements for UASs are higher than for manned aircraft flights. The other aspect where higher input is required for UAS operation is the need for arranging logistics on the ground including finding a secure launching and landing site near the flight path [3]. In all other aspects, UASs have higher input efficiency than manned aircraft flight missions for aerial photography.

4.2. Output Efficiency of Manned Aircraft Flights Are Higher Than UASs for Aerial Photography

Manned aircraft flights have the potential to acquire more images and over a larger area than the UASs during flying missions, because the UASs are restricted by speed and battery power. The ability to acquire and process more images can be translated into larger area coverage or improved ground resolution or to cover the same area in fewer images.
The need for UASs to be always visible to the pilot and co-observer also limits the extent of the flying area from each launching site [3]. The area coverage of manned aircraft flights was significantly higher than the UASs for all three flight missions (Table 3). Accordingly, the average overall cost of manned aircraft flights (US$18.75/ha) was much lower than for UASs (US$104.28). However, for image quantity, the average cost is reversed as the manned aircraft flights cost (US$ 66.81/image) is much higher than for UASs (US$2.97/image). On the other hand, the ground resolution of aerial images taken from UASs is finer (0.8 cm) than that of manned aircraft flights (average 4.3 cm, Table 3). These contrasting figures highlight the importance of a holistic analysis for comparing new technologies.
The area coverage and ground resolution can be adjusted by flying at different heights according to the intended end use of the aerial images. It is the number of acquired and processed images that is independent of the user’s choice or requirement. Therefore, the number of images was considered a key performance indicator (KPI) for frontier analysis. As noted earlier, ground resolution of images acquired from manned aircraft flights can be improved by flying at a lower height. However, there are administrative restrictions on flight heights. For manned aircraft flights in New Zealand, the lowest flight height is set at 304 m above ground level for settlements and 152 m for other areas. A flight plan with lower altitude AGL will need special approval from the Civil Aviation Authority (CAA), New Zealand [37]. Ground resolution of the resultant image can also be lowered or by using a lens of higher focal length. In either case, the field of view for such images will be reduced [8], necessitating more images to be taken to cover the area of interest. Maintaining the image triggering sequence with a shorter time interval between photocentres is challenging, and the potential for missing images also increases. Correcting the GPS tags of these photos can also become challenging as the image timing sequence will likely be shorter than a second and thereby difficult to align with triggering time. On the other hand, the flight restriction for UASs is at the higher height. The highest UASs are permitted to fly in New Zealand is 122 m [38], and there are similar regulations for flying UASs in many countries of the world [39]. Additionally, the safety concern and reaction of wildlife such as birds can limit how low a UAS can be performed [40], putting a cap on the image ground resolution for a given camera setting. In any case, despite the lower ground resolution, the output efficiency of manned aircraft flights remains higher than for UASs in terms of the number of images acquired and by having higher ground coverage.

4.3. High UAS Flexibility for Monitoring Dynamic Ecosystems

The productivity frontier analysis indicates that deploying UASs requires much less time and money than commissioning a manned aircraft flight for an aerial image mission (Figure 4). This input efficiency provides UAS missions with very high flexibility in arranging aerial image missions at short notice. The low cost of procuring a UAS would make the hardware accessible at all times, even at a project level. In contrast, along with the maintenance and other associated costs, procuring a manned aircraft flight on short notice would likely be unrealistic at a project level. As the manned aircraft flights are specialized, even outsourcing the services needs a considerable lead time to secure a slot for the mission. This is a key constraint for monitoring dynamic ecosystems such as braided rivers, where weather events might rapidly change flow regimes and necessitate that monitoring takes place within only a few days, as demonstrated in the case of the Aprima river weather event in October 2020 (Figure 3). UASs have been used for detecting temporal changes in both biotic and abiotic habitat features such as detecting spring phenomenon [18], erosion monitoring [41], etc. The high temporal resolution of image sequences using UASs can also be a key to detecting vegetation changes [42]. Overall, flexibility in re-deployment is key to the temporal flexibility of UASs is a positive attribute of UASs for monitoring dynamic habitats.
Even technologically, drone operations are more flexible than manned aircraft flights, especially for pre- and peri-flying phases. The flexibility comes from the availability of flight planning and operating software suites such as Pix4D, which can be used through everyday platforms such as mobile smartphones. It is also useful to be able to adjust flight plans according to changing field conditions. For our second unmanned mission, due to high winds, we adjusted our mission by slightly reducing the area to conserve the battery power used to stabilize the drone against the wind. Such flexibility for adjusting flight missions in response to local conditions is limited for manned aircraft flight missions.

4.4. Use of Frontier Analysis in Future Research

It would be interesting to assess the efficiency of varying aerial flight mission settings (flight height, camera, and focal length of manned aircraft flights and UASs) through a scenario analysis. In this article, we demonstrated efficiency measure using the number of images as a performance indicator. However, it is possible to use other performance indicators such as ground resolution or area, which are used as outputs. The DEA productivity analytical framework can be used for any such analysis. The productivity frontier draws a general threshold for productivity (minimum input requirement and maximum possible output) and the free disposability allows the input-output observations to move proportionately along that frontier [28,30]. If a mission setting falls under the curve, it is operating at a lower efficiency. Additionally, the frontier analysis is considered better able to handle the difference in scale issue than some other analyses and is used for technological comparison in other fields [29]. With this, researchers and project managers can make use of the DEA productivity frontier analysis for selecting technology and setting for aerial photography missions, including flexibility of re-deployment for frequent monitoring.

5. Conclusions

Management of dynamic ecosystems such as braided riverbeds typically requires monitoring at high frequencies over large spatial extents. We applied an established and easy-to-use method for comparing two aerial imaging technologies to be used for monitoring dynamic braided river habitats. This provides some insight into the field operations of both manned aircraft and unmanned aerial image flight missions and demonstrates a way to make technological choices in research and conservation practice.
We assessed the applicability of aerial photogrammetry for monitoring habitat restoration efforts in the Aparima River, a braided river in Southern New Zealand, and compared the efficacy of using manned aircraft and unmanned aerial vehicles. We found that technologically manned aircraft and unmanned flights have similar efficiency. Even though manned aircraft flights have the potential to cover a larger area, manned aircraft flights are constrained by the need for high initial investment both in terms of money and personnel training. Outsourcing from specialized aerial photography aviation companies can also be costly and will have limited availability due to demands elsewhere. UASs require much less initial investment and it is relatively easy to train project personnel to fly UASs for aerial photography missions. The low lead time required for UAS flying makes them flexible for deployment, which is very critical for monitoring the dynamic braided river habitats.

Supplementary Materials

The following are available online at https://0-www-mdpi-com.brum.beds.ac.uk/article/10.3390/drones5020039/s1, Tables S1 and S2.

Author Contributions

Conceptualization, P.J.S., R.F.M. and M.S.I.K.; Methodology, M.S.I.K.; formal analysis, M.S.I.K.; data curation, M.S.I.K.; writing—original draft preparation, M.K.; writing—review and editing, R.O., R.F.M. and P.J.S.; visualization, M.S.I.K.; supervision, P.J.S.; funding acquisition, R.F.M. All authors have read and agreed to the published version of the manuscript.

Funding

This research was partially (manned aircraft flights and on-field operations) funded from the Aparima River Habitat Enhancement Project funded through the Department of Conservation.

Institutional Review Board Statement

Not applicable.

Informed Consent Statement

Not applicable.

Data Availability Statement

Data used for analysis and results presented in this manuscript are available as Supplementary Materials Table S1 of this manuscript.

Acknowledgments

We are grateful to Simone Cleland and Terry Green for helping with manned aircraft flight planning and operations. We are also grateful to the Maukahuka project of the Department of Conservation, New Zealand for providing the Mavic 2 Pro drone. We would like to thank Ann de Schutter for providing hands-on orientation on flying the Mavic 2 Pro drone and Ella Sussex for helping as a ground observer for the UAS flights. Clement Lagrue coordinated the UAS flights including ensuring the consents of the different stakeholders involved. We would also like to thank Grant McGregor and Wreys Bush Concrete for support and facilitating groundwork including communication with local landowners. Special thanks to Hugh Robertson and Canterbury Aviation for their services in conducting the manned aircraft flight missions. We are also thankful for the contributions of the three anonymous reviewers and academic editor whose comments have significantly improved the content of this manuscript.

Conflicts of Interest

The authors declare no conflict of interest.

References

  1. Coops, N.C.; Goodbody, T.R.H.; Cao, L. Four Steps to Extend Drone Use in Research. Nature 2019, 572, 433–435. [Google Scholar] [CrossRef] [PubMed]
  2. Koh, L.P.; Wich, S.A. Dawn of Drone Ecology: Low-Cost Autonomous Aerial Vehicles for Conservation. Trop. Conserv. Sci. 2012, 5, 121–132. [Google Scholar] [CrossRef] [Green Version]
  3. Duffy, J.P.; Cunliffe, A.M.; DeBell, L.; Sandbrook, C.; Wich, S.A.; Shutler, J.D.; Myers-Smith, I.H.; Varela, M.R.; Anderson, K. Location, Location, Location: Considerations When Using Lightweight Drones in Challenging Environments. Remote Sens. Ecol. Conserv. 2018, 4, 7–19. [Google Scholar] [CrossRef]
  4. Ventura, D.; Bonifazi, A.; Gravina, M.F.; Ardizzone, G.D. Unmanned Aerial Systems (Uass) for Environmental Monitoring: A Review with Applications in Coastal Habitats. Aer. Robots Aerodyn. Control Appl. 2017. [CrossRef] [Green Version]
  5. Carlson, B.Z.; Hébert, M.; Van Reeth, C.; Bison, M.; Laigle, I.; Delestrade, A. Monitoring the Seasonal Hydrology of Alpine Wetlands in Response to Snow Cover Dynamics and Summer Climate: A Novel Approach with Sentinel-2. Remote Sens. 2020, 12, 1959. [Google Scholar] [CrossRef]
  6. Long, N.; Millescamps, B.; Guillot, B.; Pouget, F.; Bertin, X. Monitoring the Topography of a Dynamic Tidal Inlet Using UAV Imagery. Remote Sens. 2016, 8, 387. [Google Scholar] [CrossRef] [Green Version]
  7. Francis, R.J.; Lyons, M.B.; Kingsford, R.T.; Brandis, K.J. Counting Mixed Breeding Aggregations of Animal Species Using Drones: Lessons from Waterbirds on Semi-Automation. Remote Sens. 2020, 12, 1185. [Google Scholar] [CrossRef] [Green Version]
  8. Burke, C.; Rashman, M.; Wich, S.; Symons, A.; Theron, C.; Longmore, S. Optimizing Observing Strategies for Monitoring Animals Using Drone-Mounted Thermal Infrared Cameras. Int. J. Remote Sens. 2019, 40, 439–467. [Google Scholar] [CrossRef] [Green Version]
  9. Scholten, C.N.; Kamphuis, A.J.; Vredevoogd, K.J.; Lee-Strydhorst, K.G.; Atma, J.L.; Shea, C.B.; Lamberg, O.N.; Proppe, D.S. Real-Time Thermal Imagery from an Unmanned Aerial Vehicle Can Locate Ground Nests of a Grassland Songbird at Rates Similar to Traditional Methods. Biol. Conserv. 2019, 233, 241–246. [Google Scholar] [CrossRef]
  10. Havrilla, C.A.; Villarreal, M.L.; DiBiase, J.L.; Duniway, M.C.; Barger, N.N. Ultra-High-Resolution Mapping of Biocrusts with Unmanned Aerial Systems. Remote Sens. Ecol. Conserv. 2020, 6, 441–456. [Google Scholar] [CrossRef]
  11. Agapiou, A. Vegetation Extraction Using Visible-Bands from Openly Licensed Unmanned Aerial Vehicle Imagery. Drones 2020, 4, 27. [Google Scholar] [CrossRef]
  12. Rahlf, J.; Breidenbach, J.; Solberg, S.; Næsset, E.; Astrup, R. Digital Aerial Photogrammetry Can Efficiently Support Large-Area Forest Inventories in Norway. For. Int. J. For. Res. 2017, 90, 710–718. [Google Scholar] [CrossRef]
  13. Wynn, C.R. Drone Technology: Is It Worth the Investment in Agriculture. Ph.D. Thesis, The University of Nebraska, Lincoln, NE, USA, 2019. [Google Scholar]
  14. López-Granados, F.; Torres-Sánchez, J.; Serrano-Pérez, A.; de Castro, A.I.; Mesas-Carrascosa, F.-J.; Peña, J.-M. Early Season Weed Mapping in Sunflower Using UAV Technology: Variability of Herbicide Treatment Maps against Weed Thresholds. Precis. Agric. 2016, 17, 183–199. [Google Scholar] [CrossRef]
  15. Gray, D.P. Ecological Connectivity in Braided Riverscapes. Ph.D. Thesis, University of Canterbury, Christchurch, New Zealand, 2010. [Google Scholar]
  16. O’Donnell, C.F.J.; Sanders, M.D.; Woolmore, C.B.; Maloney, R. Management and Research Priorities for Conserving Biodiversity on New Zealand’s Braided Rivers; Department of Conservation: Wellington, New Zealand, 2016; ISBN 978-0-478-15097-1. [Google Scholar]
  17. Piégay, H.; Grant, G.; Nakamura, F.; Trustrum, N. Braided River Management: From Assessment of River Behaviour to Improved Sustainable Development. In Braided Rivers; Smith, G.H.S., Best, J.L., Bristow, C.S., Petts, G.E., Eds.; Blackwell Publishing Ltd.: Oxford, UK, 2006; pp. 257–275. ISBN 978-1-4443-0437-4. [Google Scholar]
  18. Berra, E.F.; Gaulton, R.; Barr, S. Assessing Spring Phenology of a Temperate Woodland: A Multiscale Comparison of Ground, Unmanned Aerial Vehicle and Landsat Satellite Observations. Remote Sens. Environ. 2019, 223, 229–242. [Google Scholar] [CrossRef]
  19. Greene, T.C.; Sprague, R.; Schutter, A.D.; Schurink, C.; Briden, K.; Earl, R. Use of Aerial Remote Sensing to Detect Pre-Coning Wilding Conifers in a Dry Grassland Environment; Department of Conservation: Wellington, New Zealand, 2020; ISBN 978-0-9951392-5-1. [Google Scholar]
  20. Joyce, K.E.; Anderson, K.; Bartolo, R.E. Of Course We Fly Unmanned—We’re Women! Drones 2021, 5, 21. [Google Scholar] [CrossRef]
  21. Vergouw, B.; Nagel, H.; Bondt, G.; Custers, B. Drone Technology: Types, Payloads, Applications, Frequency Spectrum Issues and Future Developments. In The Future of Drone Use: Opportunities and Threats from Ethical and Legal Perspectives; Custers, B., Ed.; Information Technology and Law Series; T.M.C. Asser Press: The Hague, The Netherlands, 2016; pp. 21–45. ISBN 978-94-6265-132-6. [Google Scholar]
  22. Lopez-Vicente, M.; Lana-Renault, N.; Maria Garcia-Ruiz, J.; Navas, A. Assessing the Potential Effect of Different Land Cover Management Practices on Sediment Yield from an Abandoned Farmland Catchment in the Spanish Pyrenees. J. Soils Sediments 2011, 11, 1440–1455. [Google Scholar] [CrossRef]
  23. Dash, J.P.; Watt, M.S.; Paul, T.S.H.; Morgenroth, J.; Pearse, G.D. Early Detection of Invasive Exotic Trees Using UAV and Manned Aircraft Multispectral and LiDAR Data. Remote Sens. 2019, 11, 1812. [Google Scholar] [CrossRef] [Green Version]
  24. Lewis, D.; Phinn, S.; Arroyo, L. Cost-Effectiveness of Seven Approaches to Map Vegetation Communities—A Case Study from Northern Australia’s Tropical Savannas. Remote Sens. 2013, 5, 377–414. [Google Scholar] [CrossRef] [Green Version]
  25. Harvey, P. Exiftool Application Documentation. Available online: https://exiftool.org/exiftool_pod.html (accessed on 25 April 2021).
  26. DJI New Zealand—DJI Ferntech Authorised Retail Store in New Zealand. Available online: https://www.ferntech.co.nz/ (accessed on 30 March 2021).
  27. Department of Conservation, N.Z. Maukahuka Project Updates. Available online: https://www.doc.govt.nz/our-work/maukahuka-pest-free-auckland-island/maukahuka-updates/ (accessed on 30 March 2021).
  28. Bogetoft, P.; Otto, L. Benchmarking with DEA, SFA, and R; International Series in Operations Research & Management Science; Springer: New York, NY, USA, 2011; ISBN 978-1-4419-7960-5. [Google Scholar]
  29. Battese, G.E.; Rao, D.S.P.; O’Donnell, C.J. A Metafrontier Production Function for Estimation of Technical Efficiencies and Technology Gaps for Firms Operating under Different Technologies. J. Product. Anal. 2004, 21, 91–103. [Google Scholar] [CrossRef]
  30. Otto, P.B.; Otto, L. Benchmarking: Benchmark and Frontier Analysis Using DEA and SFA; 2020. R package version 0.29. Available online: https://cran.r-project.org/web/packages/Benchmarking/Benchmarking.pdf (accessed on 30 March 2021).
  31. Daraio, C.; Kerstens, K.H.J.; Nepomuceno, T.C.C.; Sickles, R. Productivity and Efficiency Analysis Software: An Exploratory Bibliographical Survey of the Options. J. Econ. Surv. 2019, 33, 85–100. [Google Scholar] [CrossRef]
  32. Bogetoft, P. Performance Benchmarking: Measuring and Managing Performance; Management for Professionals; Springer: New York, NY, USA, 2012; ISBN 978-1-4614-6042-8. [Google Scholar]
  33. Stroobants, J.; Bouckaert, G. Benchmarking Local Public Libraries Using Non-Parametric Frontier Methods: A Case Study of Flanders. Libr. Inf. Sci. Res. 2014, 36, 211–224. [Google Scholar] [CrossRef] [Green Version]
  34. Boucher, P. Domesticating the Drone: The Demilitarisation of Unmanned Aircraft for Civil Markets. Sci. Eng. Ethics 2015, 21, 1393–1412. [Google Scholar] [CrossRef] [PubMed] [Green Version]
  35. Sandbrook, C. The Social Implications of Using Drones for Biodiversity Conservation. Ambio 2015, 44, 636–647. [Google Scholar] [CrossRef] [Green Version]
  36. AskUs|Article|Are Aerial Photographs of My Property a Privacy Issue?|Office of the Privacy Commissioner. Available online: https://privacy.org.nz/tools/knowledge-base/view/489 (accessed on 25 March 2021).
  37. Aviation Concerns|Aviation.Govt.Nz. Available online: https://www.aviation.govt.nz/safety/aviation-concerns/ (accessed on 30 March 2021).
  38. Intro to Part 101 Rules for Unmanned Aircraft|Aviation.Govt.Nz. Available online: https://www.aviation.govt.nz/drones/rules-and-regulations-for-drones-in-new-zealand/part-101-rules-for-drones/ (accessed on 30 March 2021).
  39. Stöcker, C.; Bennett, R.; Nex, F.; Gerke, M.; Zevenbergen, J. Review of the Current State of UAV Regulations. Remote Sens. 2017, 9, 459. [Google Scholar] [CrossRef] [Green Version]
  40. Mulero-Pázmány, M.; Jenni-Eiermann, S.; Strebel, N.; Sattler, T.; Negro, J.J.; Tablado, Z. Unmanned Aircraft Systems as A New Source of Disturbance for Wildlife: A Systematic Review. PLoS ONE 2017, 12, e0178448. [Google Scholar] [CrossRef] [Green Version]
  41. Meinen, B.U.; Robinson, D.T. Agricultural Erosion Modelling: Evaluating Usle and Wepp Field-Scale Erosion Estimates Using Uav Time-Series Data. Environ. Model. Softw. 2021, 137, 104962. [Google Scholar] [CrossRef]
  42. Van Iersel, W.; Straatsma, M.; Addink, E.; Middelkoop, H. Monitoring Height and Greenness of Non-Woody Floodplain Vegetation with UAV Time Series. ISPRS J. Photogramm. Remote Sens. 2018, 141, 112–123. [Google Scholar] [CrossRef]
Figure 1. Flight plans and image footprints of flight missions over the Aparima River (a) Manned aircraft flight 2018, (b) Manned aircraft flight 2019, (c) Manned aircraft flight 2020, (d) unmanned flight 2020 over the Northern end, (e) unmanned flight 2020 over the central area, (f) unmanned flight 2020 over the Southern end of the manned aircraft flights. The image mosaics of these areas are included in Figure 2.
Drones 05 00039 g001
Figure 2. Output image mosaics from different manned aircraft and unmanned flight missions over the Aparima River: (a) Manned aircraft flight 2018, (b) Manned aircraft flight 2019, (c) Manned aircraft flight 2020, (d) unmanned flight 2020 over the Northern end, (e) unmanned flight 2020 over the central area, (f) unmanned flight 2020 over the Southern end, (g) zoomed in subsection of manned aircraft flight 2018, (h) zoomed in subsection of manned aircraft flight 2019, (i) zoomed in subsection of manned aircraft flight 2020, (j) zoomed in subsection of unmanned flight 2020 over the Northern end. Red, blue, and yellow polygons on 1e delineates the Northern, central and Southern sections performed with UASs. The zoomed in subsections (1g,1h,1i,1j) showcases the ground resolution difference among the flight missions.
Drones 05 00039 g002
Figure 3. Image mosaics of same site at the Aprima River, New Zealand, before and after a flooding event. Images were acquired with unmanned aerial system (UAS): (a,b) show flight path and photo centres of flight missions, respectively, in October 2020 and November 2020; (c,d) show the image mosaics; and (e,f) are zoomed in subsections of the same area before and after the flooding event occurred in late October 2020 at the site.
Drones 05 00039 g003
Figure 4. Frontier analysis for different aspects efficiency to compare manned aircraft and unmanned aerial imaging techniques for different flying phases: (a) Technological, (b) administrative, (c) logistical and (d) economic; the solid line represents manned aircraft flight production frontier, the dashed line represents unmanned flight production frontier and the dotted line represents the combination of manned aircraft and unmanned flight production frontier. Where the frontier lines cross the x-axis indicates the minimum input required for any productivity to occur and the highest y-values the lines reach represents the highest production possible. O1, O2, and O3 are the first, second, and third manned aircraft flights where U1, U2, and U3 are unmanned flights in the same sequence.
Drones 05 00039 g004
Table 1. Analytical framework for comparing manned aircraft and unmanned flying technologies for aerial photography.
AspectsCriteriaData DefinitionAnalysisNotes
TechnologicalSoftwareAvailability, accessibility, and complexityQualitative analysis: information synthesisData envelopment analysis (DEA) production frontier analysis is carried out for all aspects
Hardware
Human resourcesNo. of personnel;days required to become trainedDescriptive statistics and Efficiency measuresIncludes trained and untrained personnel required for operation
LogisticsAcquiring and organizing resourcesCost (USD) Descriptive statistics and efficiency measuresIncludes the cost of ground operations
TimeDays Time required for organizing ground operation
AdministrativeApproval/consentsDaysDescriptive statistics and Efficiency measuresConsent stakeholders include organizations and private owners
EconomicalTimeTotal number of daysDescriptive statistics and Efficiency measuresIncludes both preparedness and operational time and money
Money Total money (USD)
Table 2. Average input across manned aircraft and unmanned aerial missions through their different phases of flying.
Flying PhaseFlight TypeTechnologicalLogisticalAdministrativeOperationalEconomical
Skillsets (No)Training (Days)DaysCost (US$)(Days)Cost (US$)Execution (Days)Total DaysTotal Cost (US$)
PreManned1.005.673.00490.003.007002.0013.671190.00
Unmanned1.003.001.67140.004.6725.671.0010.33165.67
PeriManned2.00117.33166.6711,946.672.0037101.00287.0015,656.67
Unmanned2.0010.675.00956.672.337001.0019.001656.67
PostManned1.0010.673.67490.001.0070.0020.0035.33560.00
Unmanned1.0010.671.33490.001.0032.672.3315.33522.67
OverallManned4.00133.67172.6712,926.676.00448023.00335.3317,406.67
Unmanned4.0024.336.001586.678.00758.334.3342.672345.00
Table 3. Outputs and key performance indicators (KPI) for different manned aircraft and unmanned flight missions over the Aparima River.
Flight MissionsFlight TypeFlying TimeArea Coverage (ha)Ground Resolution: Reciprocal Normalized (Planned cm)Image Processed (No)
FirstManned February 2018974.4817 (5.8 cm)223
Unmanned (South)October 202020.60125 (0.8 cm)682
SecondManned December 2019615.6323 (4.3 cm)1087
Unmanned (Central, North)November 202032.18125 (0.8 cm)1509
ThirdManned October 2020999.2436 (2.8 cm)2287
Unmanned (North)November 202030.81125 (0.8 cm)1559
Overall (Average)Manned 2018–2020863.1225.331199.00
Unmanned202027.86125.001250.00
Table 4. Average efficiency of manned and unmanned flights through different flying phases over the Aparima River.
Flying PhaseFlight TypeAverage Efficiency
TechnologicalLogisticalAdministrativeEconomic
PreManned 0.900.660.710.59
Unmanned1.000.780.730.75
PeriManned 0.900.480.900.39
Unmanned1.001.000.890.74
PostManned 0.900.670.900.49
Unmanned1.000.831.000.71
OverallManned 0.760.550.810.39
Unmanned1.000.880.790.73
Publisher’s Note: MDPI stays neutral with regard to jurisdictional claims in published maps and institutional affiliations.

