Review

Drone-Based Non-Destructive Inspection of Industrial Sites: A Review and Case Studies

by
Parham Nooralishahi
1,
Clemente Ibarra-Castanedo
1,*,
Shakeb Deane
2,
Fernando López
3,
Shashank Pant
4,
Marc Genest
4,
Nicolas P. Avdelidis
1,2 and
Xavier P. V. Maldague
1
1
Department of Electrical and Computer Engineering, Laval University, Quebec City, QC G1V 0A6, Canada
2
School of Aerospace, Transport and Manufacturing, Cranfield University, Cranfield MK43 0AL, UK
3
TORNGATS, Quebec City, QC G2E 5V9, Canada
4
National Research Council Canada, Ottawa, ON K1A 0R6, Canada
*
Author to whom correspondence should be addressed.
Submission received: 23 June 2021 / Revised: 16 September 2021 / Accepted: 21 September 2021 / Published: 29 September 2021
(This article belongs to the Special Issue Advances in Civil Applications of Unmanned Aircraft Systems)

Abstract

:
Using aerial platforms for Non-Destructive Inspection (NDI) of large and complex structures is a growing field of interest in various industries. Infrastructures such as: buildings, bridges, oil and gas, etc. refineries require regular and extensive inspections. The inspection reports are used to plan and perform required maintenance, ensuring their structural health and the safety of the workers. However, performing these inspections can be challenging due to the size of the facility, the lack of easy access, the health risks for the inspectors, or several other reasons, which has convinced companies to invest more in drones as an alternative solution to overcome these challenges. The autonomous nature of drones can assist companies in reducing inspection time and cost. Moreover, the employment of drones can lower the number of required personnel for inspection and can increase personnel safety. Finally, drones can provide a safe and reliable solution for inspecting hard-to-reach or hazardous areas. Despite the recent developments in drone-based NDI to reliably detect defects, several limitations and challenges still need to be addressed. In this paper, a brief review of the history of unmanned aerial vehicles, along with a comprehensive review of studies focused on UAV-based NDI of industrial and commercial facilities, are provided. Moreover, the benefits of using drones in inspections as an alternative to conventional methods are discussed, along with the challenges and open problems of employing drones in industrial inspections, are explored. Finally, some of our case studies conducted in different industrial fields in the field of Non-Destructive Inspection are presented.

1. Introduction

In recent decades, diverse industries are progressively employing larger structures, working coherently to perform specific jobs. So, the production cost, operational safety, and the production capacity of these facilities depend on their continuous operation. Thus, the inspection and assessment of these infrastructures are essential for the early detection of possible complications with minimum interruption in operation. Non-Destructive Inspection (NDI) solutions can handle such assessments. NDI can be defined as a method for inspecting specimens to detect possible abnormalities or changes in characteristics without adversely affecting the specimen [1].
Thermography is one of the most common methods for the inspection of industrial components using thermal imaging systems. Thermography is based on measuring the emitted thermal radiation from the surface of an object of interest [2]. This technique is commonly used for detecting defects such as cracks, voids, delaminations, structural damage, and corrosion, by observing the component’s thermal radiation patterns.
Thermal NDI methods can be categorized into two main groups: active and passive methods. In active thermography, an energy source produces the required emission to identify the abnormalities, by enhancing the contrast between the region of interest and the background. In passive thermography, the feature of interest (e.g., a subsurface defect) is naturally at a lower or higher temperature than the background (i.e., the core material). As stated in [1], the main concern in using passive thermography is due to the occasional presence of abnormal temperature profiles and temperature differences commonly called hotspots (or coldspots, in some cases). Overall, the thermographic survey is a complex process, due to the existence of three modes of energy transfer, as explained in [3]: (a) reflection, in which energy is delivered to an object from the same side that the camera is located; (b) transmission, in which energy is supplied from the opposite side where the camera is located; (c) internal, in which heat is generated internally.
Visual inspection is another type of inspection, where inspectors use cameras or their eyes to detect and localize possible defects. Although this type of inspection may not require special equipment, it does require special training and expertise to distinguish detected abnormalities and to assess their severity. Remote visual inspection (RVI) is the type of visual inspection that allows inspectors to acquire imagery data remotely without the need for physical access to the site, such as drone inspection, installed cameras on the site, or the employment of robotic platforms. Visual inspection is widely used in various industries, such as industrial boiler tubes [4], bridges [5], wind turbines [6] inspections, etc.
During the past decade, several industrial sectors have started using drones to perform a wide range of NDT inspections. Many studies investigated the use of drones for the visual or thermal inspection of industrial and construction sites. The remote nature of the drone inspection, the high maneuvering flexibility provided by aerial platforms, and the availability of advanced sensing payloads have motivated companies to consider drone-based NDI as an alternative solution. Drone-based platforms can significantly decrease the cost of inspection, as well as, inspection time, while increasing the reliability and consistency of acquired data. Additionally, the reduced downtime assists industries to continue operation for an extended period, resulting in increased revenue. In the case of hazardous or difficult-to-access areas, drones can even make the inspection feasible in terms of operational risk, cost, and conceivability. Besides the visual and thermal inspections, many studies have focused on providing the required technologies to perform other types of inspection. For example, Matter and Kalai introduced a wall-sticking tri-copter drone equipped with an ultrasonic probe for inspecting metallic structures. They used the combination of electromagnetic units and thrust force to provide the wall-sticking feature [7]. Rossi et al. proposed a drone-enabled fully autonomous gas sensing system using metal oxide sensors to detect and localize gas leaks [8]. They installed the system on a DJI hexacopter to evaluate the performance of the sensing platform in the presence of air turbulence generated by the drone’s propellers.
The primary goal of this paper is to provide a review of the aerial inspection of industrial infrastructures along with case studies, discuss challenges faced by drone-based inspection, and suggest ways to address those challenges. Section 3 explains the conventional NDI approach and how drones can improve the reliability and effectiveness of such inspections.
The paper is organized such that Section 2 provides a brief review of open literature related to drones and drone-based NDI. Section 4 extensively discuss the challenges of drone-based inspection. Finally, case studies are described in Section 5.

2. Literature Review

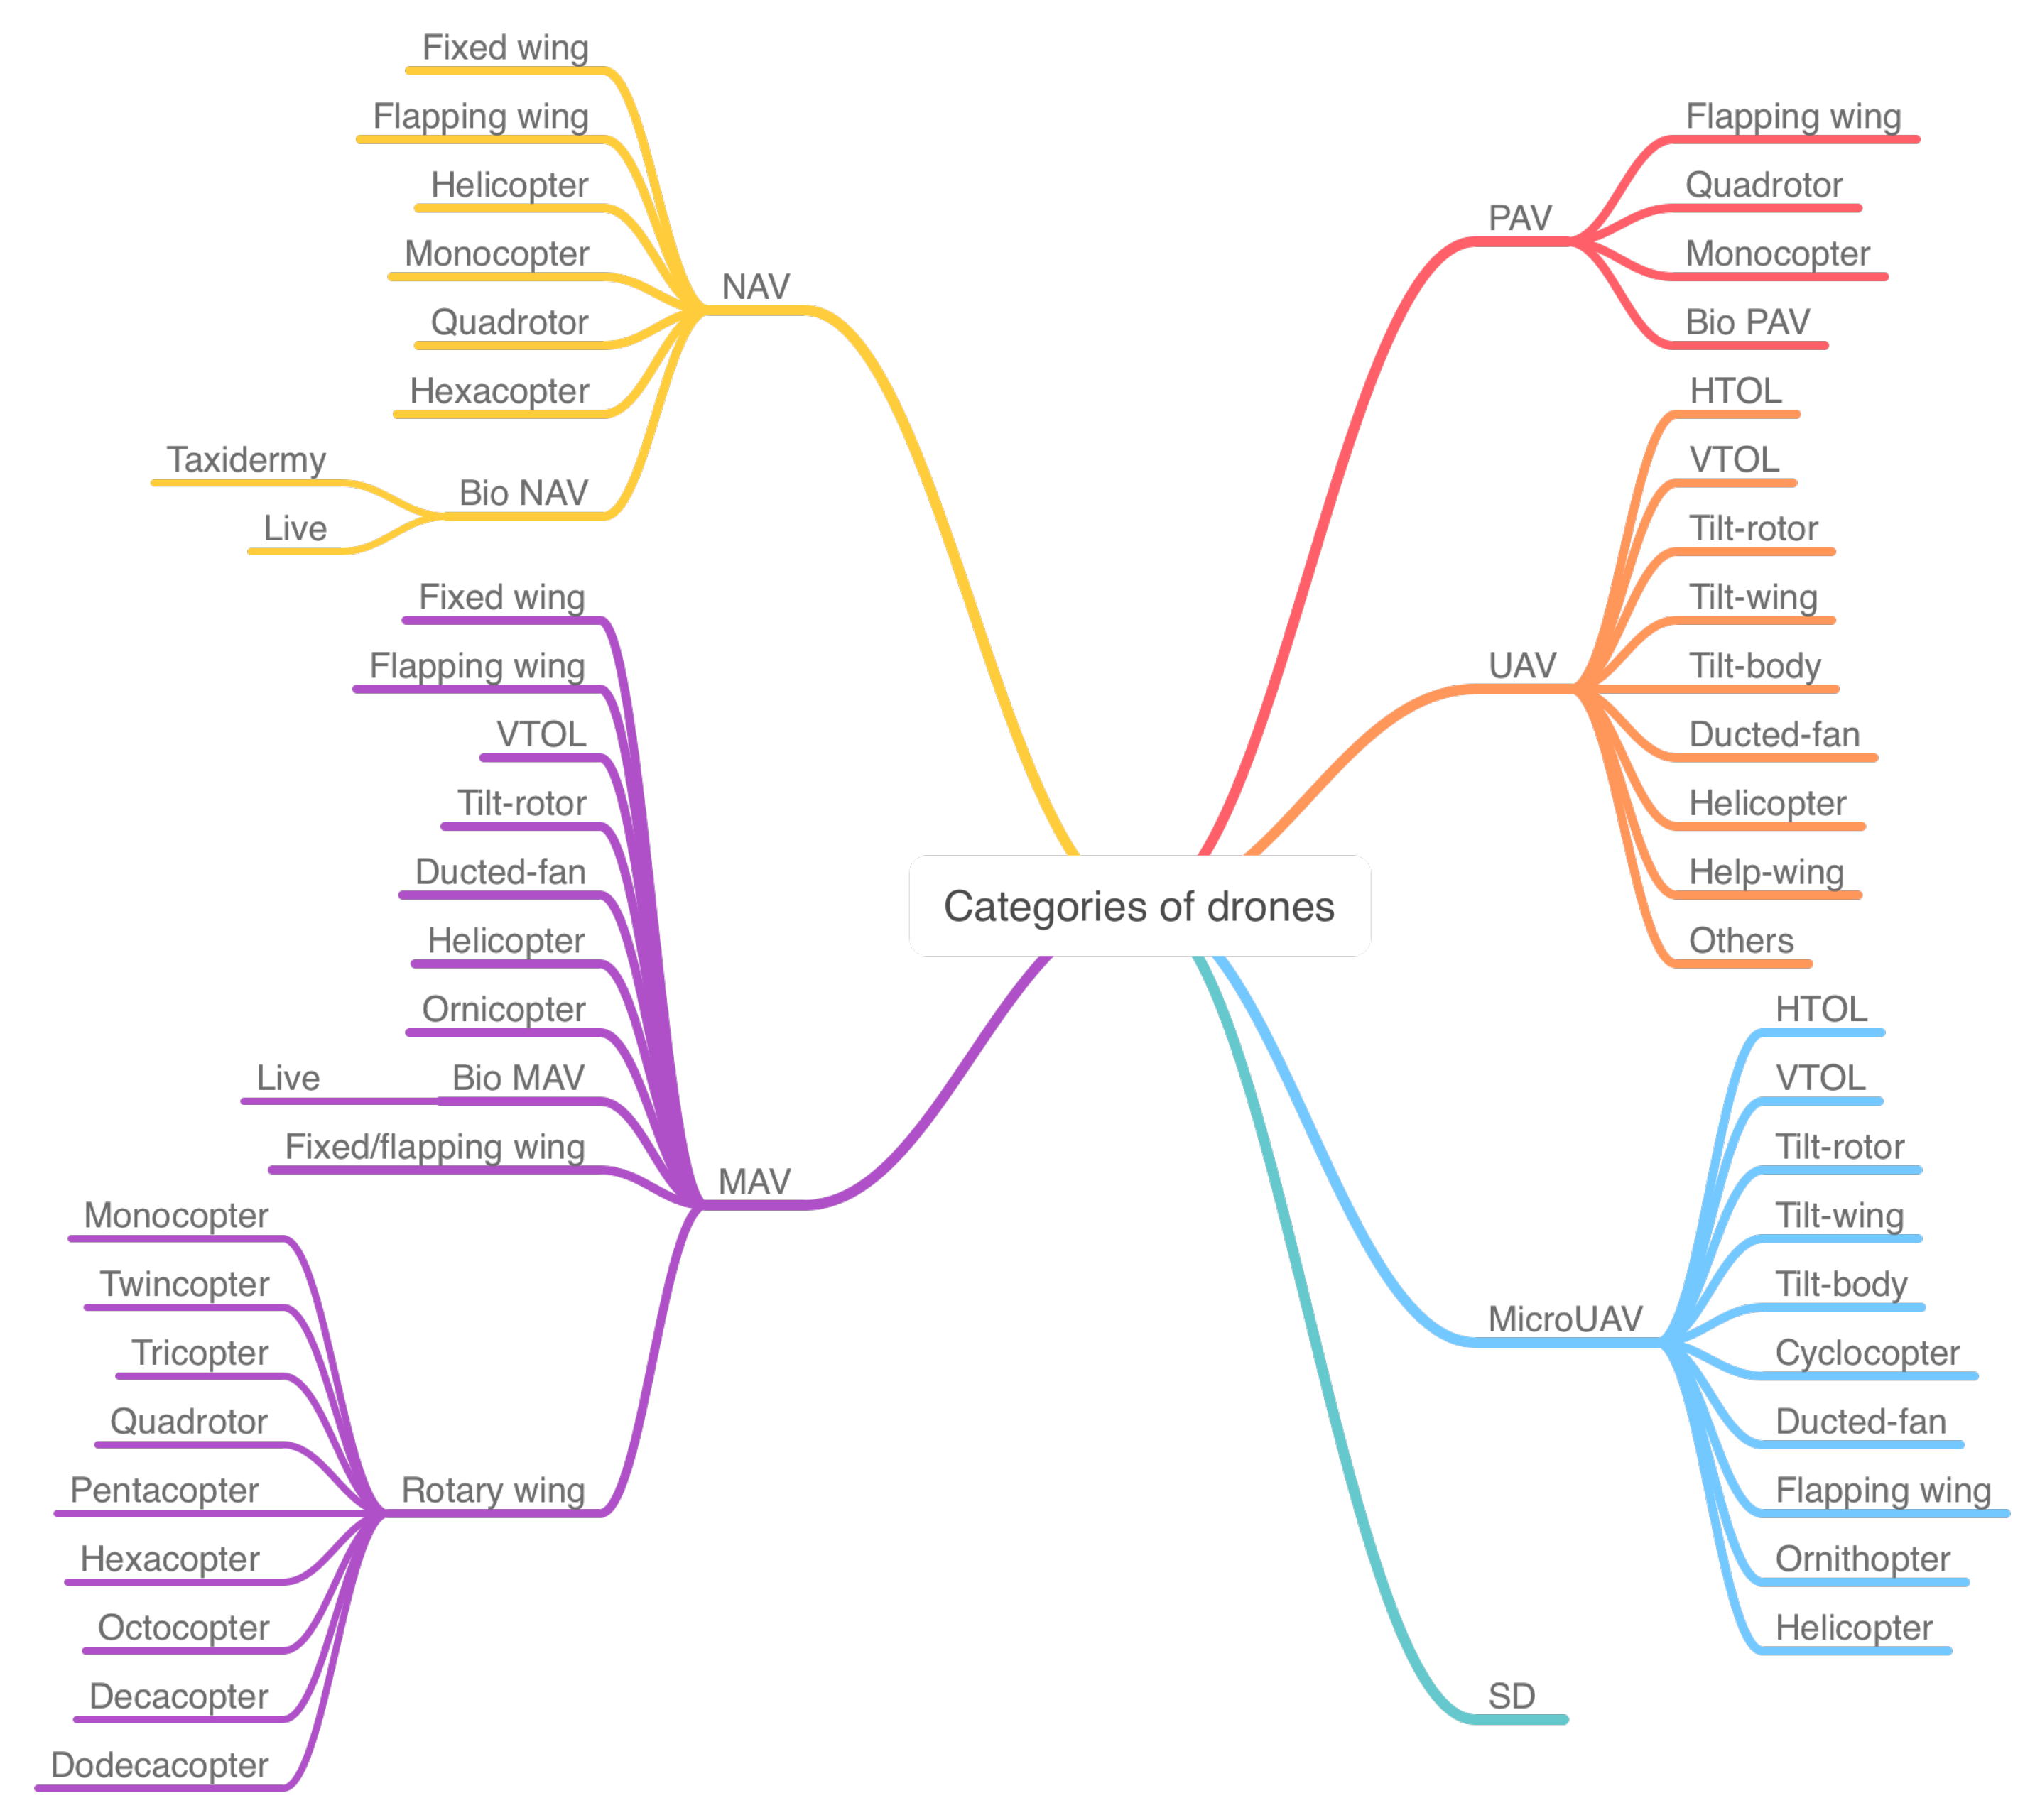
2.1. Unmanned Aerial Vehicles

Unmanned vehicles, as stated in the literature, are vehicles without on-board operators. These vehicles are commonly controlled autonomously using the on-board sensors and control systems, or remotely by an operator in a control station. Unmanned vehicles can be sorted into five different groups based on their operating environment [9]: (a) Unmanned Aerial Vehicle (UAV) [10,11], (b) Unmanned Surface Vehicles (USV), (c) Unmanned Underwater Vehicle (UUV), (d) Unmanned Ground Vehicle (UGV), (e) Unmanned Spacecraft (US).
Different organizations and researchers have categorized drones based on weight, wing span, operating altitude, etc. For example, the U.S. Department of Defense has categorized drones into five main categories, as summarized in Table 1. Arjomandi et al. in [12], have categorized drones based on their weight as shown in Table 2. Whereas, in [13], the drones were categorized based on wingspan and weight, as shown in Table 3.
There have been tremendous developments in drone-based technologies during the past few decades. Several designs/configurations have been developed based on different applications, and can be grouped together, as shown in Figure 1 [13].
The history of drones goes back to 1839, during the first Italian war of independence, where first attempts to use the drones were made. During the war, Austrian soldiers utilized unmanned balloons filled with explosives to attack and destroy Venice. Later, during the American Civil War and the Spanish–American War in 1898, kites and hot-air balloons were utilized for exploration and information gathering missions. In 1903, pigeons wearing breast-mounted cameras were used for photography [15]. The first radio-controlled drone was developed based on Nikola Tesla’s design in 1898 [16]. In 1900, the Wright Brothers tested their famous Kitty Hawk, and sixteen years later, in 1916, Great Britain developed the first winged aircraft named “Ruston Proctor Aerial Target” [17]. Furthermore, the Kettering bug was another experimental aerial system developed by Dayton-Wright as a flying bomb for United States Army in 1918. RP-1 was a nine-foot radio control model airplane developed by Reginald Denny Industries in 1936 [18]. OQ-2 drone was the first mass-produced drone in the U.S. designed by Walter Righter and manufactured by the Radioplane company in 1939. The modern era of drones began in 1960, promoted by the Soviet Union’s shoot-down incident of U-2 aircraft. Moreover, the U.S. Air Force started a highly classified UAV research program under the code name “Red Wagon” to develop a drone capable of photographic surveillance mission. Later, in 2001, the U.S. government began the Predator program as a military combat drone [16].
In 2006, Frank Wang established DJI Technology with his friends and colleagues at the Hong Kong University of Science and Technology. Since then, DJI has been grown to become a leading commercial drone company [19]. Later, in 2010, the DJI competitor, the French company Parrot, released the first quadcopter controlled by a smartphone. In 2012, the U.S. Congress passed the Federal Aviation Administration (FAA) Modernization Act to require the FAA to integrate small drones into the airspace by 2015. Soon after the modernization act was passed, Amazon announced its plans to deliver products with a drone task force. Facebook Aquila conducted its first successful flight in 2016. It was a solar-powered drone designed as an atmospheric satellite to provide Internet access to remote areas. PaintCopter was another significant drone designed in 2018 to perform the spray-painting of 3D surfaces in industrial sites [20].

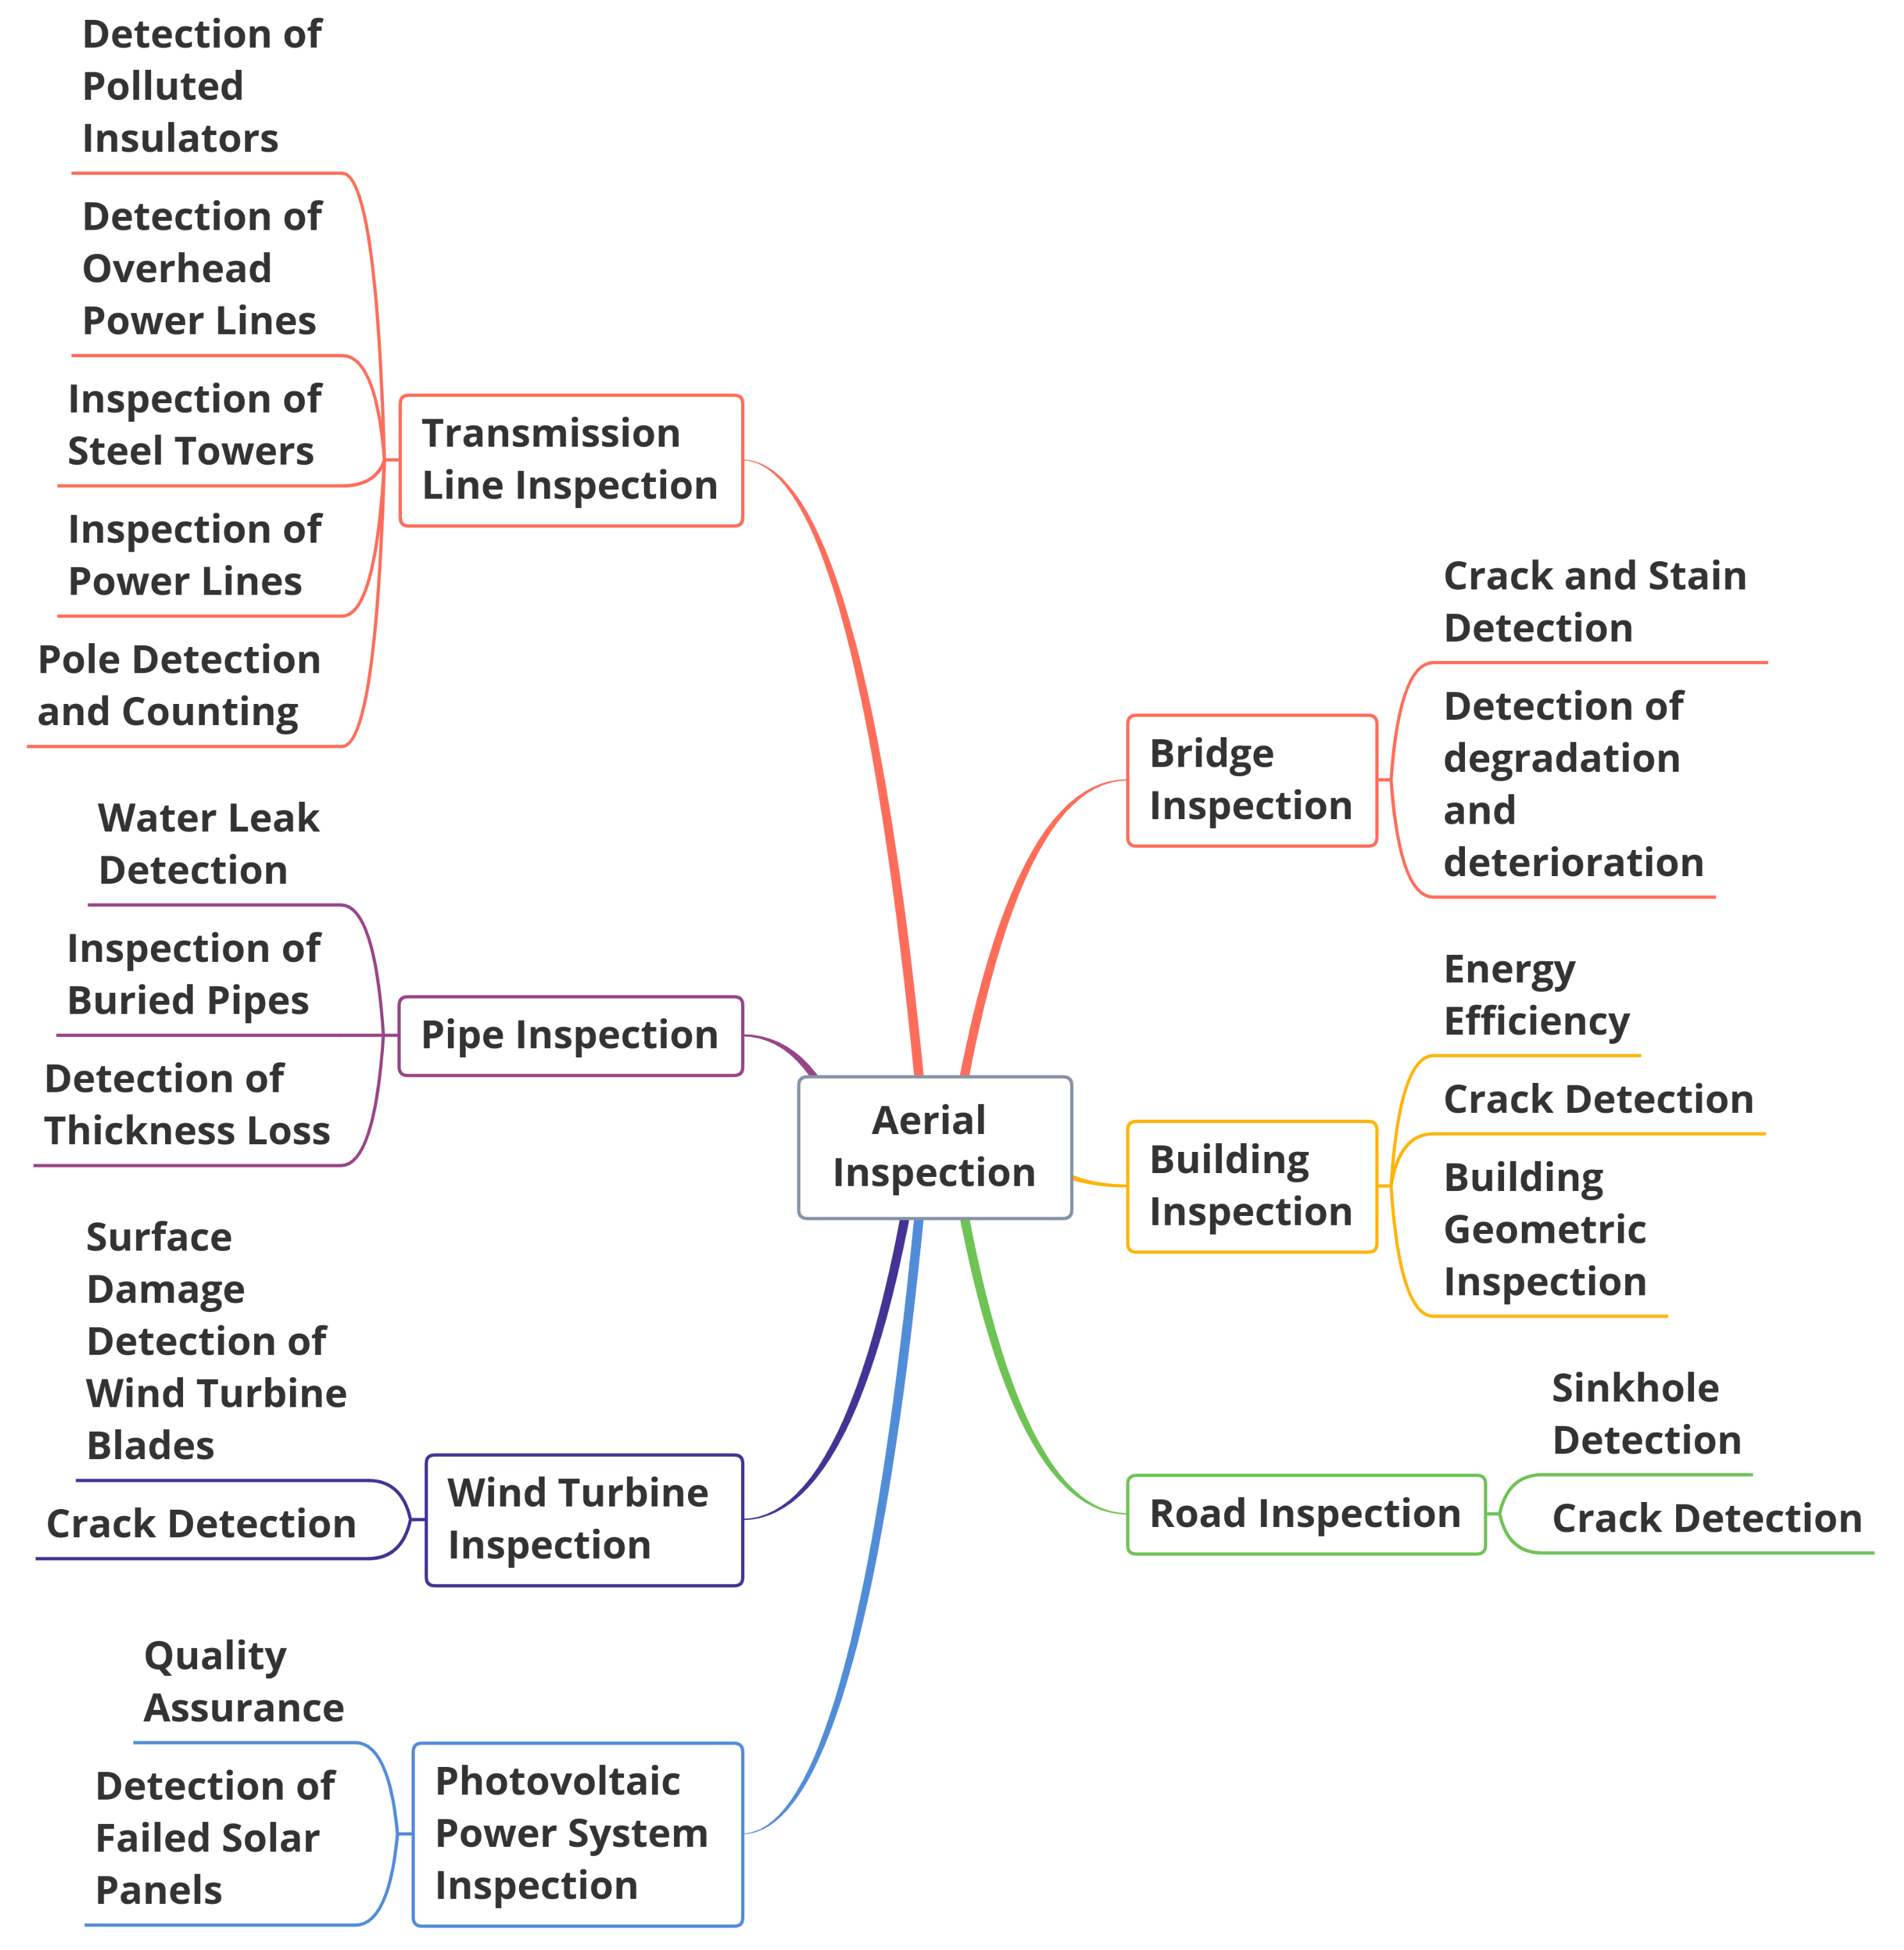
2.2. Drone-Based Inspection

The use of aerial platforms for performing non-destructive inspection has been growing due to the benefits offered by drones, as shown in Figure 2. As stated in [21] before 2014, approximately 45 % of the unmanned aerial system market was involved in the use of drones in areas such as: inspection and monitoring of power infrastructure [22], monitoring buildings and urban planning [23,24], monitoring archaeological and cultural heritage sites [25], agriculture [26], oil and gas [27,28], construction [29], mining [30], telecommunication towers [31], etc.

2.2.1. Inspection of Photovoltaic (PV) Power Systems

The initial step to facilitate the transition between conventional and drone-based inspections of large-scale PV plants is to investigate the comparability between these two approaches in regards to reliability and effectiveness. Teubner et al. compared a thermal-measurement aerial system named aIR-PV-check [32] with a monitoring system on module level named SunSniffer, to investigate their capabilities in identifying abnormalities in solar panels [33]. The study demonstrated that there is a quantitative correlation between irregular temperature patterns on PV modules and significant power loss. Moreover, the relationship between lower relative module power and higher module temperature difference was observed, which allows one to quantify a module’s power loss with an uncertainty of less than 10 percent. Finally, it was concluded that the drone-based thermal inspection can be an alternative to inspecting a large PV plant.
As discussed in [34], the possible defects on Photovoltaic modules can be categorized into six groups: (a) mismatch defects, which often occur when electrical and physical properties of one cell are altered considerably compared to the other cells [35]. Mismatches and faulty bypass diodes may cause burn marks, browning, and in more severe cases, lead to fire [36,37]. (b) cracks, which are the most frequent type of defect in PV modules can have different lengths and orientations. (c) discoloration of cells, which can cause a significant decrease in the quantity of sunlight penetrating cells [38]. (d) soiling, which is the existing dirt on the surface of PV modules, caused dust, pollution, or bird droppings [39]. (e) delaminations, which are defects that result from imperfections in the lamination process or outdoor conditions [40]. (f) snail trails, which are defined as the gray discoloration on a crystalline silicon surface. This defect often occurs along cell edges or micro-cracks [41], and can decrease the electrical PV output of the module by more than 20% [42].
Drone-based thermal inspection of solar panels is a common approach in the renewable and sustainable energy market. As investigated in [43], drones can decrease the time of inspection significantly and increase the coverage area. To ensure the maximum financial and energy return of Photovoltaic modules, the quality assessment of the modules is an essential factor. Conventionally, electrical tests, like the I-V curve test (current-voltage characteristic curve) and manual thermographic inspection, are used to locate the faulty modules. However, they are very costly and extremely time-consuming techniques. Furthermore, the increasing growth of solar power capacity can increase the time and effort required for the inspection and cause operation and maintenance activities to become one of the most costly parts of PV plants operation [44]. Thus, many studies are focused on finding more innovative and efficient alternative ways for inspecting a Photovoltaic plant, like using aerial inspection [42,45,46,47]. A comparative study conducted by Buerhop et al. in [48] showed that, for a 1000 kWp PV site, the drone-based inspection took approximately 5–8 min, which is significantly less than the required time when using traditional solutions. Koch et al. conducted another comparative analysis on two inspection schemas: (a) manual ground-level inspection using electroluminescence imaging, and (b) drone-based aerial inspection using thermography [49]. They investigated the feasibility of using drones for the quality assurance of crystalline PV modules. They concluded that the drone-based inspection shows great potential for the inspection of large PV plants.
The condition and guidelines for an adequate inspection of solar plants are other areas that are worth investigating. Aghaei et al. [50] presented the findings of a drone-based thermal inspection in a 3 MWp PV plant located in Tubarao, Brazil, where a meteorological tsunami in October 2016 had damaged the plant. The inspection focused on the detection of possible damages without any interruption to power generation. In [50,51], the main issues were identified, and several solutions were proposed to achieve the most reliable and effective inspection as: (a) the thermal imaging system should be aimed perpendicularly relative to the PV modules; (b) the vertical distance of five meters should be maintained to avoid the drone’s self-shading; (c) inspection should be performed on a sunny, cloudless, and bright day. The studies also mentioned that the wind speed should not exceed 4 m/s to avoid drone vibration and sudden movement caused by air turbulence, and (d) the inspection should be done at noon or before the afternoon, because of the sun’s position.
Aerial platforms can also be utilized to provide a thermal map of the inspected area, which can be used to create a more detailed description of the plant for locating and identifying the problematic PV modules. Aghaei et al. proposed a technique to use a stream of infrared images to assemble them into a mosaic map of the inspected area [52]. They further used a method based on edge detection techniques to count the number of PV modules in the mosaic map, and a binary model for separating hot and cold parts of the PV string.
In addition to the drone-based thermal inspection of PV modules, multi-modal systems can also assist in providing more effective solutions. Alsafasfeh et al. [53] proposed a method to effectively detect faulty modules, while reducing the associated hazards, using the combination of a thermal camera and a CCD camera. Moreover, Lee et al. used a paired RGB and thermal camera to detect faulty panels. The array of PV panels was located using RGB images, while the faulty ones were identified using thermal footage [54]. Zefri et al. employed thermal and visible imagery sensors installed on a drone for the inspection of PV plant installations. They acquired required data by a mission in Rabat, Morocco, and used an available dataset collected in Switzerland [34].

2.2.2. Inspection of Power Lines

Electrical power companies regularly evaluate the status of transmission lines using thermal cameras installed on helicopters. Although a helicopter can effectively be used in such inspections, it is very costly and dangerous, especially for hard-to-reach areas. Thus, companies are investing in alternative solutions, such as by using aerial platforms. Deng et al. introduced a multi-platform aerial system and a communication system for the inspection of power lines in China [31]. Their objective was to increase efficiency by using multiple drones. In [55], researchers introduced a cost-effective inspection system involving a thermal camera installed on a DJI Phantom 4 Pro to assess and detect overheated power lines.
Hydro-Québec is a public organization in charge of generating, transmitting, and distributing electricity in the Province of Quebec, Canada. During recent years, the company invested extensively in a novel drone-based platform for the inspection of power lines, which is called LineDrone [56]. The platform uses LiDAR and monocular sensors to compute the drone pose relative to the power line. Hamelin et al. extended the LineDrone platform by introducing a discrete-time control algorithm for tracking power lines and assisted landing [57].
Drones can be employed to facilitate the inspection of hard-to-reach areas. In South Korea, due to the lack of access to power transmission components as they are placed in mountainous areas and vulnerability to natural disasters, have motivated companies to invest in drones for inspection purposes. Therefore, KEPCO Research Institute has proposed an aerial platform to automatically survey the power lines, based on a predefined flight path using visible and thermal cameras [58]. Wang et al. introduced a drone system named SmartCopter based on an Unmanned Autonomous Helicopter (UAH) for inspecting power transmission components using thermal and visible cameras [59]. Their aerial platform consisted of onboard and ground subsystems. The onboard system records and transmits the sensory data, while the ground system performs the data analysis. Wang and his team were able to detect visible faults on electrical components using visible images, while overheating and defects were detected using thermal images.

2.2.3. Inspection of Construction and Mining Sites

Drones can be used in mining sites to conduct quick inspections for an urgent situation or hazard identification using multiple sensors [60]. Lee and Choi categorized the applications of drones in mining into three main groups: (a) surface mine: mine operation, 3D mapping, slope stability, mine safety, construction monitoring, and facility management. (b) underground mines: rock-size distribution, gas detection, mine rescue mission. (c) abandoned mines: recultivation, gas storage detection, acid drainage monitoring, and landscape mapping [30].
The detection of hazardous gas in underground mines is one of the applications where drones can be beneficial. Lucila and Masami employed a drone for gas detection in an underground coal mine [61]. They installed a gas sensor on a DJI S1000 as an alternative approach for measuring coal fire gases.
In the mining industries, a Belt Conveyor System (BCS) is one of the main components used to support the belt carrying the extracted materials. Although the inspection and assessment of a single roller are easy, the task, however, becomes very time-consuming when two hundred thousand rollers are distributed over a large area [62]. Additionally, the use of skilled labor, as well as health and safety issues, are other problems associated with manual inspection. Carvalho et al. proposed a drone-based framework for automated thermal inspection to identify roller failures in the mining industry [62]. They used a DJI Zenmuse XT thermal camera installed on a DJI Inspire I drone for data acquisition. The areas of BCs in thermal footage were determined by aligning the recorded drone’s position with known georeferencing data of the installed BCs. The conditions of BCs were then determined by analyzing the temporal thermal data.
In recent years, several studies were focused on actively monitoring the construction sites using aerial platforms. The effective monitoring and reviewing of construction projects can reduce the cost of repairs, especially for large infrastructures, bridges, and dams. Traditional approaches like visual assessments are technically challenging, expensive, and very time-consuming. Moreover, in many cases, customized equipment is required for the mission, such as cranes and climbing gears [63]. For instance, the land survey is one of the areas that are essential for all land development projects at the beginning of the construction phase [29]. Siebert and Teizer conducted a comparative analysis of manual ground-based real-time GPS survey and drone-based photogrammetry survey near the city of Magdeburg, Germany [64]. They covered around 60,000 m 2 of land during data acquisition with both methods. In the drone-based survey, the images were collected with the overlapping rate of 60% longitudinal and 40% lateral. Based on their result, the inspection time of the GPS survey was three times longer than the inspection time of the drone-based approach, which was around 205 min. Furthermore, the number of extracted points with the GPS survey method was 1800, which provides 0.03 points/m 2 point density, while the drone-based method generated 5,500,000 points and 92 points/m 2 point density. Hence, they concluded that the use of an aerial platform for surveying a land reduced the survey time to one-third, and increased the point density by more than 3000 times [64].
Drones can be very beneficial in managing construction logistics, where they can be used to locate equipment and materials [29]. Hubbard et al. introduced a drone-based system to detect, identify, track the location of materials tagged with GPS, and Radio Frequency Identification (RFI) [65]. Fang et al. developed a hybrid approach using point cloud and visible images to track the location of construction assets. In this study, a Structure From Motion (SfM) method was used to generate 3D models, based on 2D aerial images [66]. Additionally, they investigated the use of point clouds to track moving assets.
Building Information Modeling (BIM) is another area where an aerial platform can be very beneficial [67]. Drones can significantly reduce human involvement and provide an effective and reliable solution for project monitoring and quality control purposes [68]. Wang et al. presented a solution for construction quality control based on BIM and Light Detection and Ranging (LiDAR) [69]. In this study, an integrated system of BIM and LiDAR was used for collecting and processing the real-time quality information using an aerial platform.

2.2.4. Inspection of Wind Turbines

In recent years, the drone-based inspections of wind turbines for exterior and interior structures have gained considerable attention. Wind turbines are machines used since 1887 that convert wind power into electricity [70,71]. In the last few decades, the use of wind turbines has increased significantly. For example, in the U.S. alone, the share of wind turbines was 10% in 2020, and is estimated to grow close to 20% by 2030 [72]. Despite the inherent benefits of using wind turbines, maintenance is still a challenging topic. Blade inspection is particularly complicated, since they are located at the height of around 100–140 m, and the turbine has to be halted during the inspection [73]. Furthermore, as the wind turbine blades are exposed to a very harsh environment, such as: the temperature and humidity variations, corrosion, and variation of loads caused by wind, etc. Therefore, the blades are at great risk of failure [74]. Furthermore, wind turbine’s components can contain manufacturing defects as well as damages during operation by lightning strikes, collision with birds and insects, corrosion, and the accumulation of dirt or ice [72]. Surveys conducted on 700 on-shore wind turbines located in Sweden in 1997–2005 have demonstrated that 13.4% of the failures are related to the rotor blades [74].
Furthermore, based on the report [74], in 2015, among the 700,000 operating turbines, 0.54% of them were failing around the world. Furthermore, significant failures include: (a) the failure of joints, (b) the delamination of the loads, and (c) the rupture or any damage to the laminate. Surveys of 1500 on-shore wind turbines have conducted over fifteen years concluded that the failure of blades is responsible for 7 % of wind turbine failures which are higher than the failure of the gearbox with 4 % [75]. Therefore, the early detection of any surface damage or other problems on wind turbine blades can decrease downtime and operational cost, as well as aid to prevent possible future structural failure.
Any manual inspection of wind turbines is risky and time-consuming. Conventionally, experienced technicians inspect the interior and exterior structures of the wind turbines using ropes, cranes, and other special equipment. Another approach is the installation of sensors for inspecting blades that provides continuous monitoring of the structure [76]. However, these sensors can increase the cost of the blades, based on the size, quantity, and quality of the installed sensors. Additionally, in some cases, like being hit by lightning, the sensors can be damaged along with the blades [77]. Robotic systems are another alternative approach that have been studied extensively during the past years. For instance, Elkmann et al. introduced a conceptual robotic system to move along wind turbine blades [78]. Different NDI techniques are already employed in several studies, such as terahertz inverse synthetic aperture radar, infrared thermography, and X-ray imaging [79,80,81].
Unmanned Aerial Vehicle is an alternative approach for inspecting the interior and exterior structures of wind turbine blades. As stated in [82], an inspection of a wind turbine using a drone can take up to 1.5 h, while the same inspection using a rope access-based approach can take up to 8 h. In addition to the time factor, drones can decrease the risk associated with the inspection, such as fires, explosions, workers falling, high-voltage equipment, and static electricity [72]. Most studies have addressed the use of drones for an exterior inspection of wind turbine blades as an alternative approach to cranes and ropes. On the other hand, the inspection of the interior structure of the blade is very challenging, due to the confined space, the existence of internal structures, and lack of proper illumination [72]. For example, in the case of interior inspection, the cost of the manned inspection is a major factor for companies to invest more in the use of drones as an alternative approach [72]. Poleo et al. studied the economic impact of employing drones for inspecting offshore wind turbines [83]. They evaluated the effect of changing the inspection approach on the overall revenue and operational expenses. Moreover, they investigated the requirement and benefits of using aerial platforms. Furthermore, they estimated the associated costs for drone-based, and rope-accessed inspections of the offshore wind turbines for comparison purposes [83].
Kulsinskas et al. investigated the involved aspects of using remotely controlled drones for the interior wind turbine blade inspection [72]. Murphy et al. presented a drone system for the inspection of wind turbines from outside [84]. However, the introduced drone system has the required capabilities for interior inspection. Pedersen proposed a drone-based system equipped with required sensors for navigation, data acquisition, and real-time communication with the ground station, for the interior inspection of wind turbines [85].
Several studies have addressed the automation of the data analysis of wind turbine inspection using machine learning techniques, which can further decrease the inspection time and cost. Shihavuddin et al. introduced an automated damage detection system based on a deep learning technique with the help of manually annotated data [6]. They used a dataset of different wind turbines in Denmark, collected by an RGB camera installed on a drone, to train and test their algorithm. They trained a fast R-CNN deep network with the manually annotated samples, as well as augmented data to detect the defects. The system mainly provided suggestions for the inspectors during the data analysis. In another study, an automated defect detection technique based on a pre-trained CNN-based model was presented for the inspection of wind turbine blades [86].

2.2.5. Inspection of Pavement and Concrete Structures

The inspection of pavement and concrete structures to detect cracks is one of the essential activities to ensure the structural integrity. Numerous studies have investigated the use of drones to increase the coverage rate and reduce the inspection time. Cracks can open the way to corrosive chemicals into an underlying structure like a bridge. Ellenberg et al. introduced a drone-enabled crack detection technique based on edge detection approach [87]. They used GPS data to maintain a fixed distance from the targeted specimen and define flight paths for the inspection.
Moreover, an automated crack detection method deployed on a 3DR Solo drone is presented in [88], which employs an acquired 3D model and recorded images to identify cracks by using histogram analysis. Cracks on concrete structures like towers and bridges are considered as degradations. Kim et al. proposed a method based on morphology techniques to detect cracks and provided measurements like crack length automatically [89]. They presented a morphological link for crack (MorphLink-C) method to extract cracked areas. Later, the detected pixels were analyzed and grouped to measure crack size. Finally, the measured size was converted into millimeters for further analysis.
The detection of sinkholes using an aerial platform on pavement roads is another area investigated by some studies. Lee et al. presented a technique for sinkhole detection on roads using a FLIR A35 thermal camera installed on DJI Inspire 1-V2.0 [90]. They detected sinkholes by looking for cold spots in thermal footage. The cold spots were segmented using an adaptive dual-threshold segmentation technique explained in [91]. Then, some of the foreground pixels were removed by the morphological opening method. Non-circular regions were removed. Finally, the candidate regions were passed through a CNN network to classify them as sinkhole and non-sinkhole classes.
The detection of humidity and water leaks is another area where drones can be of great interest. The inspection of buried pipes to detect water leaks can effectively prevent water loss. The water leaks cause temperature differences in the pipe’s surrounding areas, which can be detected and analyzed using thermal cameras. Shakmak and Al-Habaibeh studied the feasibility of using a thermal camera installed on a drone to detect water leaks. An experimental setup in the Great Man-Made River Project in Libya was chosen due to the dryness level of the desert sand. The analysis of acquired thermal images from low-resolution (IRISYS) and high-resolution (FLIR A310F) cameras has concluded that both cameras could identify the leaks [92].

2.2.6. Inspection of Buildings

As stated in [1], building inspection for energy efficiency is an important topic, and many countries like Canada are persuaded to regulate mandatory energy audits. As stated in [93], buildings are responsible for 40 % of energy consumption and 36 % of CO 2 emissions. Thus, detecting energy loss in large residential and non-residential buildings and other infrastructures can greatly help in energy-saving and de-carbonization.
Thermographic inspection of buildings can be used to identify defects such as heat losses [94], moisture infiltration and water leakage [95], as well as the integrity of concrete walls. Using aerial platforms for inspecting buildings is an alternative approach that was discussed in several studies. De Dios introduced a drone system for automated thermographic inspection of buildings in [96] as part of the HELINSPEC project funded by the Regional Government of Andalusia (Spain). Their approach included: (a) the mapping of thermal information, (b) locating and tracking the regions of interest (ROI), (c) temperature measurement of ROIs, and (d) categorization of selected regions into abnormal or normal.
Moisture is one of the frequent issues in the buildings that can be visible in already advanced stages, which would cause financial losses and damages. A thermographic inspection is an exciting candidate to identify the problematic regions effectively. However, the reliability and applicability of this approach should be verified. Rocha, Santos, and Póvoas conducted a study to investigate the use of thermography for moisture detection [97]. Their study focused on the building with evident signs of moisture, and they experimented during the raining season. The results showed the possibility of locating moisture, but it could not determine the severity. Valente et al. introduced a drone-based system with a low-cost temperature sensor installed for acquiring thermal signatures inside a building to facilitate the detection of heat losses [93]. The proposed system provides the required features for improving energy efficiency in large commercial or industrial buildings.
The inspection of commercial and production buildings is another area of interest when it comes to how drones can increase the reliability and effectiveness of the inspection itself. Ortiz-Sanz et al. [98] investigated the feasibility of using drones for the inspection of traditional wine cellars. They experimented with a semi-buried old building in Northwest Spain, which was used explicitly for small-scale production and storage of wine. In this study, a comparative analysis of pole-mounted and drone-mounted thermal cameras was performed. The two acquisition sessions were conducted simultaneously to ensure similar environmental conditions. The study concluded that the pole-mounted approach was a better alternative for confined spaces, as drone navigation imposed many challenges. However, for the inspection of exterior components, the drone has significant advantages over the pole-mounted approach as it provides access to hard-to-access areas, and the motorized gimbal provides desired field of view [98].
Thermal bridges are the areas with reduced resistance of heat transfer caused by the failures of insulation systems during a building’s operational lifetime. They can be a source of unexpected temperature changes, an increase in overall energy consumption, and if left untreated, they can cause severe damage to the building structure. Ficapal and Mutis presented a method to identify the thermal bridges in facade systems for curtain wall systems, with minimum disturbance for the occupants [99] using a thermal camera installed on a drone.
The inspection of PV systems and thermal shells installed on the buildings is another area of interest. For instance, Entrop and Vasenev presented a protocol for surveying a PV-system and thermal shell of a building [100]. During the experiment, temperature differences between indoor and outdoor, the influence of wind during the flight, and precipitation are also recorded for further analysis.
Another area of interest is the use of 3D models for inspecting buildings. The availability of an accurate 3D map of a building’s surface can significantly enhance the analysis of its energy efficiency by incorporating geometry to energy efficiency [101]. González-Aguilera et al. proposed a multi-sensory image registration algorithm that can generate thermographic 3D models of a region of interest. They resampled and improved the acquired depth data and processed thermal images to correct radial lens distortion using Brown’s model [102]. Later, they introduced a multi-sensory image registration technique to align the depth and thermal images and generate a thermographic 3D model of the inspected area. They continued their work by presenting an automated system for generating 3D thermal models to assess the energy efficiency of the building’s facades [103]. After data acquisition and determining the environmental factors such as ambient temperature, humidity, and the temperature of control points, the features of thermal images were extracted using the ASIFT algorithm [104] and matched accordingly. Finally, matched thermal images were used for dense surface modeling and orthothermography generation. The thermal analysis of already generated orthothermographies was used to identify heat losses on a building’s elements like walls and windows.

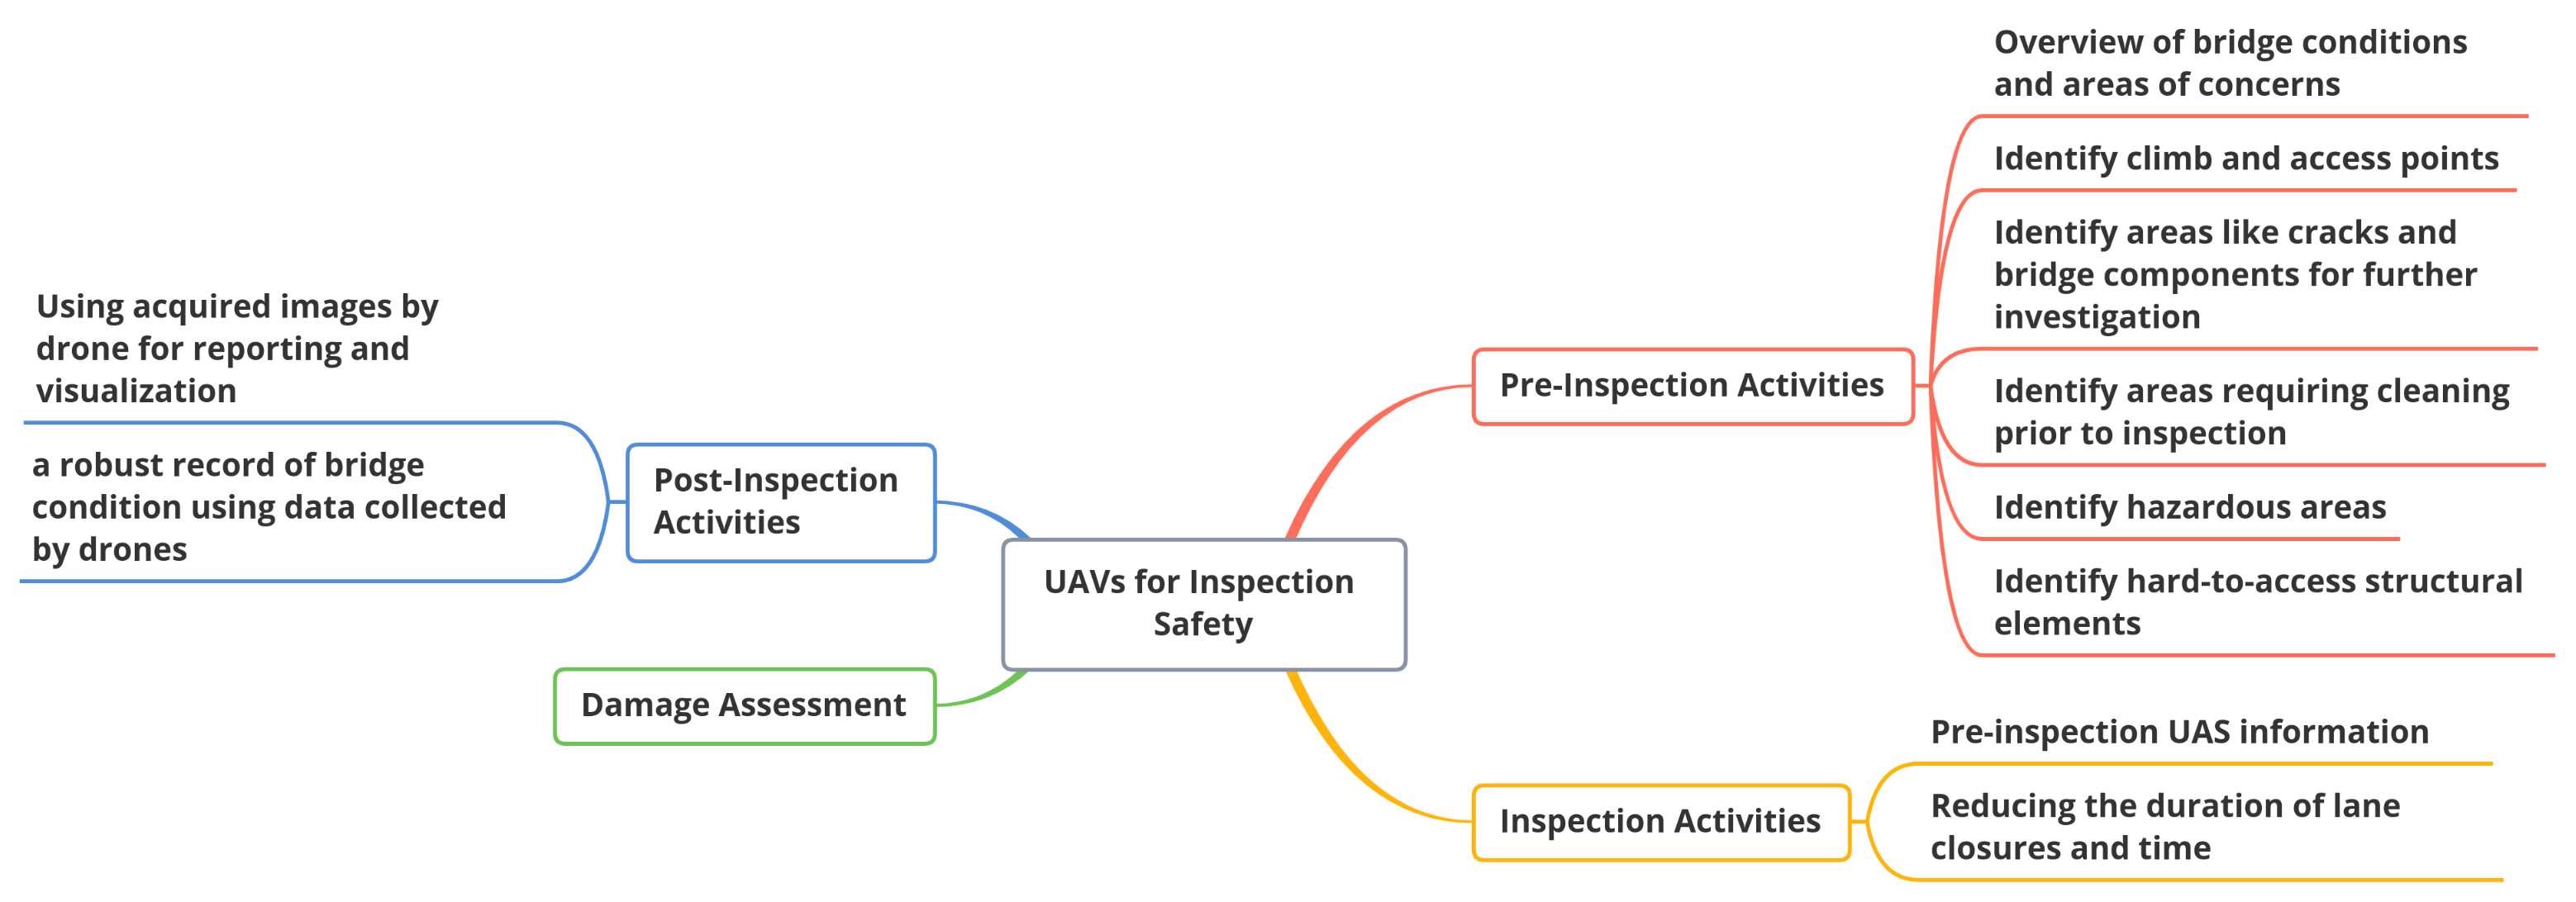
2.2.7. Inspection of Bridges

The deterioration of a bridge structure can be considered as a critical issue for structural safety and serviceability [105]. The visual inspection of bridge structures is the primary method to monitor the bridge’s status and ensure the ongoing serviceability of the structure. Conventionally, trained inspectors and climbers conduct the inspection with specialized equipment, which can be expensive and ineffective at times. Moreover, due to the rapid increase in demands for inspection of deteriorating bridges, the backlogs of inspections have increased, because the traditional methods are time-consuming and not cost-effective [106]. Therefore, companies are motivated to invest in using alternative and more effective solutions, such as UAVs. For example, one of the success stories is the inspection of the Placer River Trail Bridge in the Alaskan Kenai Peninsula [5]. An aerial platform was developed based on a DJI S8000 with a Gyrostabilized Sony NEX-7 and GoPro cameras installed on the platform. Finally, the 3D model of the bridge was generated using the collected images to locate and observe possible damages using the Hierarchical Point Cloud Generation (HPCG) technique.
Unmanned Aerial Vehicles can also be used for ensuring bridge inspection safety. As stated in [107], there are four ways that drones can be employed for assessing inspection safety, as shown in Figure 3: (a) before-inspection activities, (b) during inspection activities, (c) post-inspection activities, and (d) damage assessment.
Jones et al. presented a drone-based method for bridge inspection using a digital camera attached to a DJI Phantom 4 [108]. Their methodology included five stages: (a) review the bridge information, (b) perform site risk assessment, (c) carry out pre-flight setup, (d) conduct the inspection, and (e) identify damages. Additionally, the required conditions for such inspection are also another area that needs to be investigated. In [109], the authors specified the required conditions for bridge inspection. They determined that wind has significant effect on a drone-based close-range inspection. Moreover, they demonstrated the drone’s ability to identify possible damages by conducting a comparative analysis between regular and drone-based inspections.
Furthermore, Chan et al. [110] compared a conventional approach with a drone-based method to investigate the drone’s capabilities for bridge inspection. This investigation concluded that drones could significantly reduce the risk of the inspection and enhance the inspection quality. Murao et al. conducted a feasibility study to investigate the use of drones for the inspection of concrete bridges [106]. They used the YOLO v2.0 deep network for the detection of cracks.
The deterioration of the bridge’s concrete deck is a serious issue that needs to be addressed to ensure the serviceability of a bridge. Deck delaminations that are horizontally debonding in the subsurface of a deck can be considered as a sign of corrosion-induced deterioration [111]. Concrete deck delamination can have various sizes, shapes, and temperature distributions based on weather conditions. Cheng et al. described the challenges to profile delaminations automatically using thermography [112]: (a) the variety of shape and depth in delamination; (b) feature variation of delamination due to environmental factors such as ambient temperature, solar intensity; and (c) surface textures such as cracks, color difference, patching, or paintings. Cheng et al. introduced an encoder–decoder deep learning architecture to segment the delaminated areas in thermal images. Moreover, they presented a novel data augmentation strategy used in the training phase to improve the model’s performance. Finally, a post-processing method based on the conditional random field, is introduced to refine the resulted segmentation [112].

2.2.8. Inspection of Nuclear Sites and Monitoring of Radiological Risks

Nuclear materials can be considered a threat to public health and security in events such as nuclear accidents or radioactive contamination. The concern for such events forced countries to put in place different measures to prevent them. For instance, the European Union launched a treaty named European Atomic Energy Community (EURATOM) to investigate and establish protection and safety policies [113]. In this treaty, each state has committed to continuously monitor radioactivity in air, water, and soil, to ensure compliance with the standards. Pinto et al. proposed a drone-based solution for scouting, monitoring, and inspecting of a targeted region [114]. They explained that drones could be an effective alternative solution to conventional approaches for generating comprehensive and reliable radiological 3D maps using the data acquired by a drone in an outdoor environment. Moreover, they automatically identified hotspots and characterized radionuclides’ signatures [114]. In this study, firstly, a 3D representation of the area of interest was constructed using a LiDAR sensor installed on a drone. Then, Geiger–Müller Counters (GMC) data samples were collected using a drone to generate heatmap and identify hotspots. Finally, they conducted a drone-based inspection to identify spots more closely to detect radionuclides.
Security is another area in which the monitoring of radiological factors can be beneficial. MOISIC is a project funded by Systematic Paris-Region, that studies several solutions for the detection of any nuclear risk, especially in confined spaces [115]. In this project, a Cadmium–Zinc–Telluride (CZT) detector and a gamma camera were installed on a drone capable of indoor flight. Additionally, localization algorithms were added to the aerial platform for navigation and planned route memorization, due to the lack of GPS signals in indoor environments.
A quick survey of a large area is essential in the case of nuclear disasters and radiation leakages. Drones can minimize the time, the number of human resources and protect the operators by performing remote detection. The DRAGoN project presented a compact and mobile system for the safe and fast inspection of nuclear pollution and contamination that can distinguish between neutrons and gamma radiation types [116]. Moreover, Aleotti et al. introduced a Visuo-Haptic Augmented Reality (VHAR) interface, enabling operators to employ a CdZnTe-based spectroscopic gamma-ray detector installed on a drone for the monitoring of an outdoor environment [117]. Okuyama et al. investigated the feasibility of using an unmanned helicopter with a radiation detector and three CCD cameras embedded onboard for monitoring remote radiation [118]. The system is capable of transmitting real-time data analysis in the ground control station. Martin et al. proposed a UAV-based system with an installed gamma radiation mapping unit for the radiological characteristics of mining sites [119]. Furthermore, Sanada and Torii presented a case study for developing an unmanned helicopter to survey the Fukushima Daiichi Nuclear Power Plant (FDNPP) for radiation sources [120]. FDNPP is inspected using the unmanned helicopter flying within a 5 km distance due to the regulations [120].

3. Drone-Enabled Inspection: An Alternative to Conventional Methods

Conventional approaches for the thermal inspection of industrial sites commonly involve the manual survey of the area by experienced inspectors. The inspectors employ thermal imaging systems to acquire thermal images from various fields of view. Later, they analyze the data to detect and characterize possible abnormalities and discontinuities. Despite the advantages of using such techniques, some limitations and challenges have motivated companies to invest in alternative solutions to address inherent limitations like power supply and inspection procedure.
Many studies focused on presenting solutions to address the open challenges in the non-destructive inspection of industrial infrastructures. For instance, some researchers investigated the applicability of using sensors attached to the aerial platform as an alternative approach [106,121,122]. However, the studies demonstrated that supplying the power and the durability of the sensors can provide many challenges [123,124].

3.1. The Production Rate and Size of Inspection Area

Due to the significant rise of demands and production growth in various industries, they constantly expand their production capacities and build new infrastructures to increase market share. Consequently, the inspection and maintenance of these facilities can increase the cost and time of the inspections. For example, in the case of the solar energy market, the production capacity reached 178 GWp worldwide in 2014 [125], and around 45 % of global installations were large-scale PV plants [49]. Thus, the inspection of large PV plants using conventional methods needs a huge amount of resources. Another example is the inspection of transportation infrastructures. For instance, the length of the Canadian highway system reached 38,021 km in 2011 [126]. However, a conventional inspection of these roads requires considerable time and highly experienced inspectors, which has prompted an increase in the search for an alternative solution.
An aerial platform can be considered an effective solution for inspecting a large area in a reasonable time frame. Libra et al. introduced a drone system for a real-time daily inspection of large power plants located in the Czech Republic [127]. Jones et al. presented a drone-based thermal inspection solution to locate crop canopies in the large agricultural fields [128]. López-Fernández et al. studied the employment of drones for the inspection of roof surfaces for solar panel installation [129].

3.2. Inspection of Remote and Inaccessible Locations

For an inspection, experienced personnel and required equipment are deployed to the site; however, in some cases, infrastructures can be located in high-altitude places or hard-to-reach areas. Therefore, companies are require to take precautionary steps, such as insurance and additional safety measures, to ensure safe and successful inspection.
One of the challenges of inspecting hard-to-reach areas is the steps required to transfer equipment and human resources, which can be prohibitive in terms of cost and time. For instance, as stated in [58], steel towers holding the transmission lines in Korea are mostly located in the mountainous regions. Hence, providing access to these facilities are very challenging; this challenge has been addressed by using drones to carry out the inspection to ensure the structural health of the components. Aerial platforms like drones can provide the required mobility in remote and hard to reach areas that makes the inspection feasible.

3.3. Inspection of Hazardous or Dangerous Sites

In some scenarios, inspections can be hazardous and complicated. For instance, working in an environment containing hazardous chemical components can put the staff in hazardous situations [106]. In some infrastructures such as bridges, refinery petrochemical complexes, or wind turbines, access to the targeted components can be challenging and risky. These situations can put staff in danger for the staff and can cause possible damage to the equipment, all of which can have a negative impact on the feasibility of regular inspection [121].
Inspecting nuclear sites is another example of a hazardous environment for the inspection and monitoring of possible radiations. In one study, researchers investigated the use of a radiation imaging system installed on an aerial platform to monitor radiation in nuclear power stations [130].
Human error and an unprecedented incident can lead to property damage or possible injuries. To address these challenges, a drone-based system with proper sensors installed on the platform can significantly prevent possible incidents and provide a more unobstructed view of the site. Moreover, due to the pilotless nature of the drone, using drones can decrease the number of required human resources for the inspection. Moreover, the maneuvering flexibility of drones can provide better access to the targeted areas, which increases the reliability and consistency of acquired data.

3.4. Inspection of Large Specimens

Conventionally, in the case of the inspection of a large infrastructure, multiple inspectors are assigned to different locations within the site to decrease the inspection time. Although, as explained in [122], this approach can complicate maintaining the data consistency, due to the multiplicity of inspectors operating in different locations. Moreover, the inspectors need to document the acquired data, which can cause inconsistency in the documentation.
Another approach for the inspection of large infrastructures is to conduct multiple data acquisition sessions. In this method, inspectors need to set up their equipment at different positions and perform data collection for further analysis. Drone-based systems can be an alternative solution for inspecting large infrastructures, which can lead to more comprehensive, reliable, and consistent data. Moreover, the fixed setup installed on a drone can reduce the required inspection time.

4. Challenges of Drone-Enabled Aerial Inspection

In the last decade, the use of drones to inspect industrial sites has grown significantly due to the aforementioned advantages of aerial platforms compared to conventional methods. Besides the flexibility of maneuver presented by drones, they provide a unique opportunity to transfer the equipment and survey the facility in a relatively short amount of time and cost. Remotely controlled drones can significantly reduce the number of required staff and prevent human injuries. Thus, companies invest in using drones in a variety of applications, such as construction and industrial sites [29,131] and aerospace components [132,133]. However, aerial platforms bring out some limitations, which need to be addressed.
One of the challenges in drone operation is vibration. UAVs are often subjected to various sources of vibrations that can affect the reliability of acquired data: (a) vibrations caused by external sources like strong wind gust, (b) vibrations caused by the maneuvers, (c) vibrations caused by aerodynamic sources like headwinds, (d) vibration caused by the stabilization system itself, and (e) vibration caused by the engines and propellers [63].

4.1. Inspection Time Frame

The specific moment on which an inspection is performed can significantly influence the result’s reliability as some artifacts can be presented in a more or less significant extent. For example, shadows, daylight, weather condition, and solar radiation can have a negative impact by causing a non-homogeneous distribution of temperature, resulting in false-positive or inflated outputs [64].
For the inspection of buildings, Gonzalez-Aguilera et al. studied the best time frame for the thermographic inspection of buildings [103]. They concluded that the time before sunrise and after sunset is optimal for the inspection to avoid possible false positives resulted from the direct reflection of the sun. Entrop and Vasenev stated that for identification of thermal bridges in a building’s facade, the inspection needs to be conducted before sunrise [100]. However, in the case of PV systems installed on buildings, the inspection should be conducted later in the sunnier moment [100]. Colantonio and McIntosh discussed that electrical and mechanical systems should be inspected while they are under maximum load [134].
For land surveying, Lizarazo et al. studied the detection and mapping of land surface elevations using drones. They conducted their experiment in a 650 hectares sandstone quarry located at Zipaquirá in Central Savanna province of Colombia. They conducted data acquisition sessions between 9:00 to 11:00 a.m. to ensure enough solar illumination, to avoid strong winds in the afternoon, and to avoid hotspot effects caused by reflection from sand at noon [135].

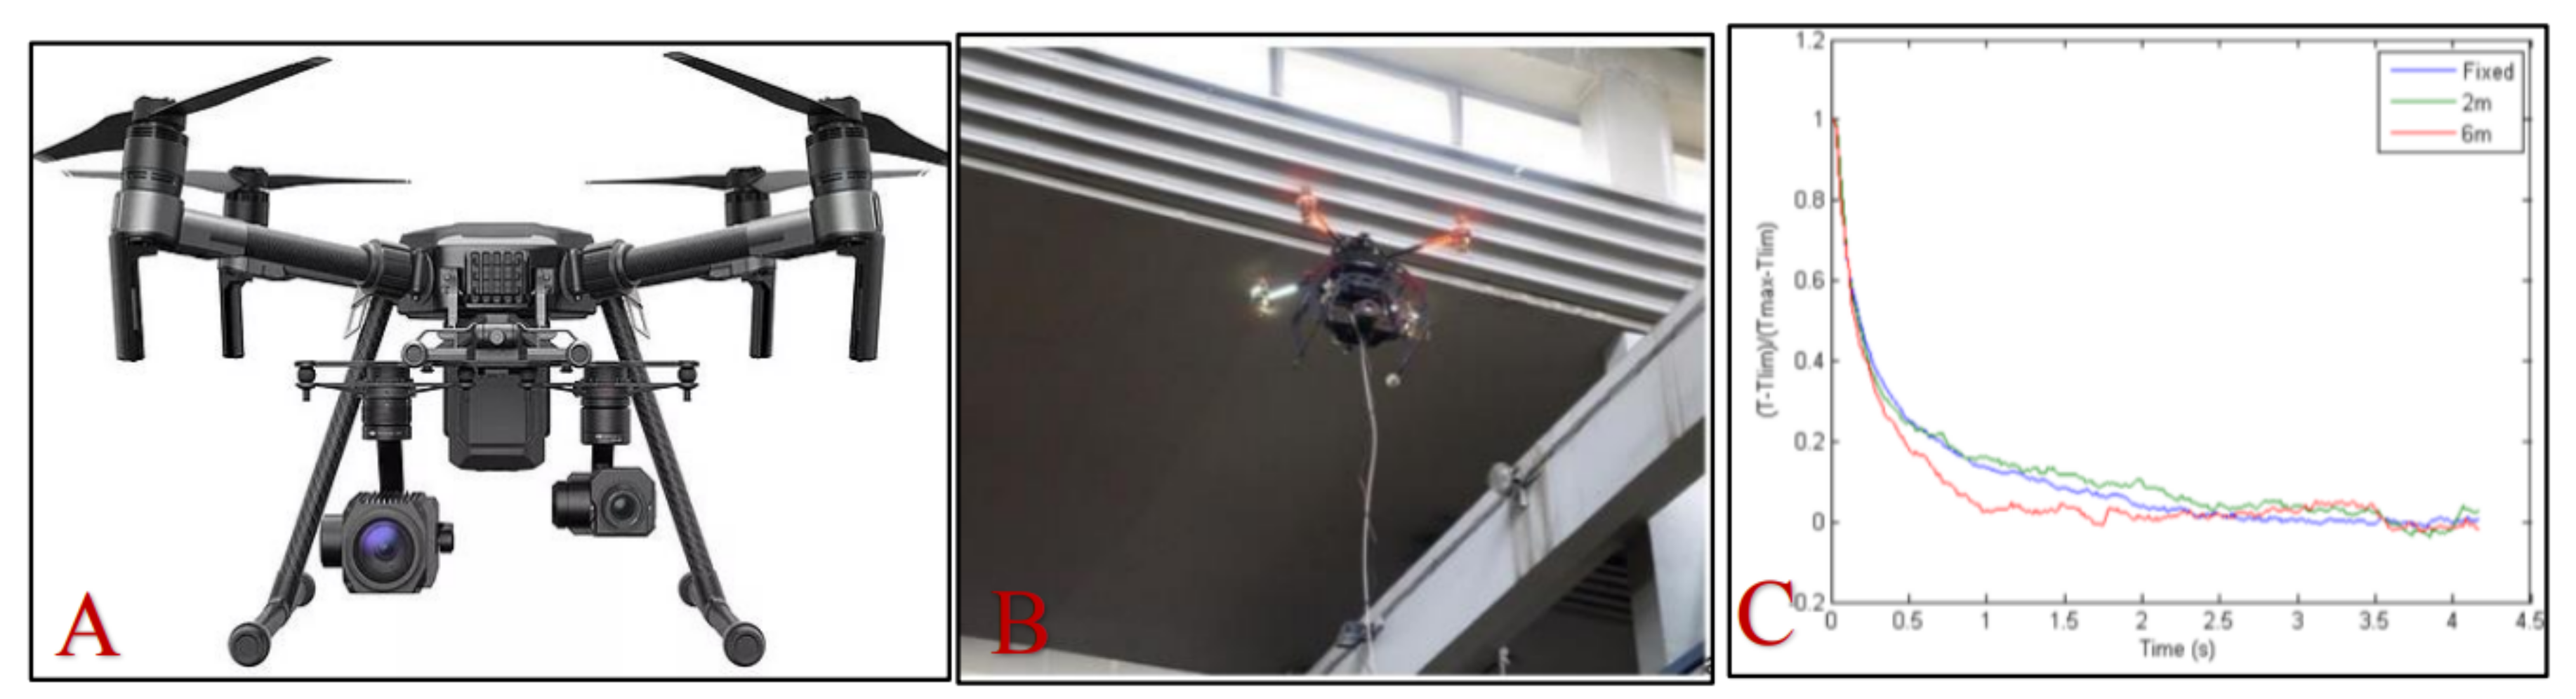
4.2. Distance between Drone and Specimen

One of the open discussions in drone-based inspection is the optimal distance between a drone and targeted specimen, which many studies have tried to address. For instance, one of the characterizations of thermal imaging is that the measured temperature of an object decreases as the distance between the camera and the target increase [136]. In the case of building inspection, Volkmann and Barnes explained that the suitable altitude for a vertical survey of buildings should be around 75 m above the ground and 50 m above the buildings [137,138]. Furthermore, in archaeological surveying sites, one study concluded that an altitude of 30–75 m above ground level is the best option to maximize the coverage. Another example is the study conducted by Gonzalez-Aguilera et al. regarding the inspection of building’s facades [103]. In this study, the drone maintained a 15–20 m distance to acquire thermal images with overlap greater than 70% between consecutive thermal frames for 3D thermal reconstruction purposes using a photogrammetry technique.
The distance from the targeted surface also depends on the objectives of the inspection. Ellenberg et al. [87] suggested a distance of one meter from the surface to ensure the required visibility for the detection of small-scaled cracks in concrete structures. Wang et al. explained that for the inspection of power lines, the distance between the drone and power lines should be determined to ensure the required visibility, as well as for the flight safety [59]. They introduced the SmartCopter, which can fly safely 50 m away from the power lines. However, they concluded that at this distance, the thermal inspection does not meet the required criteria. The altitude or distance of the aerial platform also depends on the attached sensors. For instance, Roca et al. [139] used three to four meters’ distance from the building, as required by the Kinect sensor attached to a drone in order to have the most reliable data.
In other scenarios like the inspection of PV power plants or even road detection, the inspection time can be decreased by increasing the drone’s altitudes. For instance, one study focusing on the detection of sinkholes is investigated in [90]. They determined that the optimal altitude for this inspection is 50 m.
Drone distance is also considered as a safety measure. The drone-generated turbulence can unbalance the flight and drag the drone toward the nearby structures when the drone gets too close to the surface [121]. The optimal distance varies significantly in every case and will depend on the particular application. For instance, in the case of thermal NDI, the drone carrying the camera and the heat source must be as close as possible to the target (several centimeters) to maximize the heating of the surface. On the other hand, in the case of PV monitoring, the drone can fly a considerably larger distance (several meters).

4.3. Effect of the Propellers on Thermal Inspection

As mentioned earlier, thermal NDI is the method to detect and identify possible defects based on the received emitted thermal radiation from the specimen. However, some factors can affect the thermal image, such as (a) surrounding objects, (b) nearby heat sources, (c) ambient temperature, and (d) fog and dust. In aerial thermal inspection, the drone itself can compromise the footage. Drone’s propellers produced forced convection while operating; the airflow intensity depends on factors like engine power, payload, and weather condition. Since thermal inspection studies the specimen’s temperature measurement, this airflow can contribute to the heat transfer process, potentially affecting the thermal equilibrium of the specimen if the drone gets too close to the surface, especially if the camera is positioned vertically for the inspection. Therefore, it is beneficial to investigate the effect of propellers on thermal inspection to standardize the process for each application.

4.4. Reflection of Drones and Surroundings

Another influential factor in aerial thermal inspection is the reflection. In thermal NDI, reflection is one of the factors that an experienced inspector considers during the operation. It can be caused by surrounding objects, or in the case of drone-based inspection, the drone itself. It is a standard practice for inspectors to record thermal images from different fields of view to ensure that the detected abnormalities are not due to reflections. Therefore, in drone-enabled inspections, it is necessary to record data from different FOVs.

4.5. The Lack of Physical Access

Regardless of aerial inspection’s benefits, the absence of physical access to the site can create some challenges. The physical access of experienced inspectors helps them to understand the surrounding area, risk factors, weather, environmental conditions, and other sources of possible data misinterpretation better. Fox et al. [140] discussed that the energy emitted from a component’s surface is significantly under the influence of environmental conditions, the emissivity of the material, camera settings [141], and even the orientation of the object itself. Moreover, the lack of information about emissivity and other influential factors can cause misinterpretations. Consequently, extensive information about the environment, specimen’s geometry, visual features, and surrounding area can help inspectors prepare a better and more reliable report after post-processing.

5. Case Studies

In this section, some of our case studies related to drone-based thermographic inspection are presented.

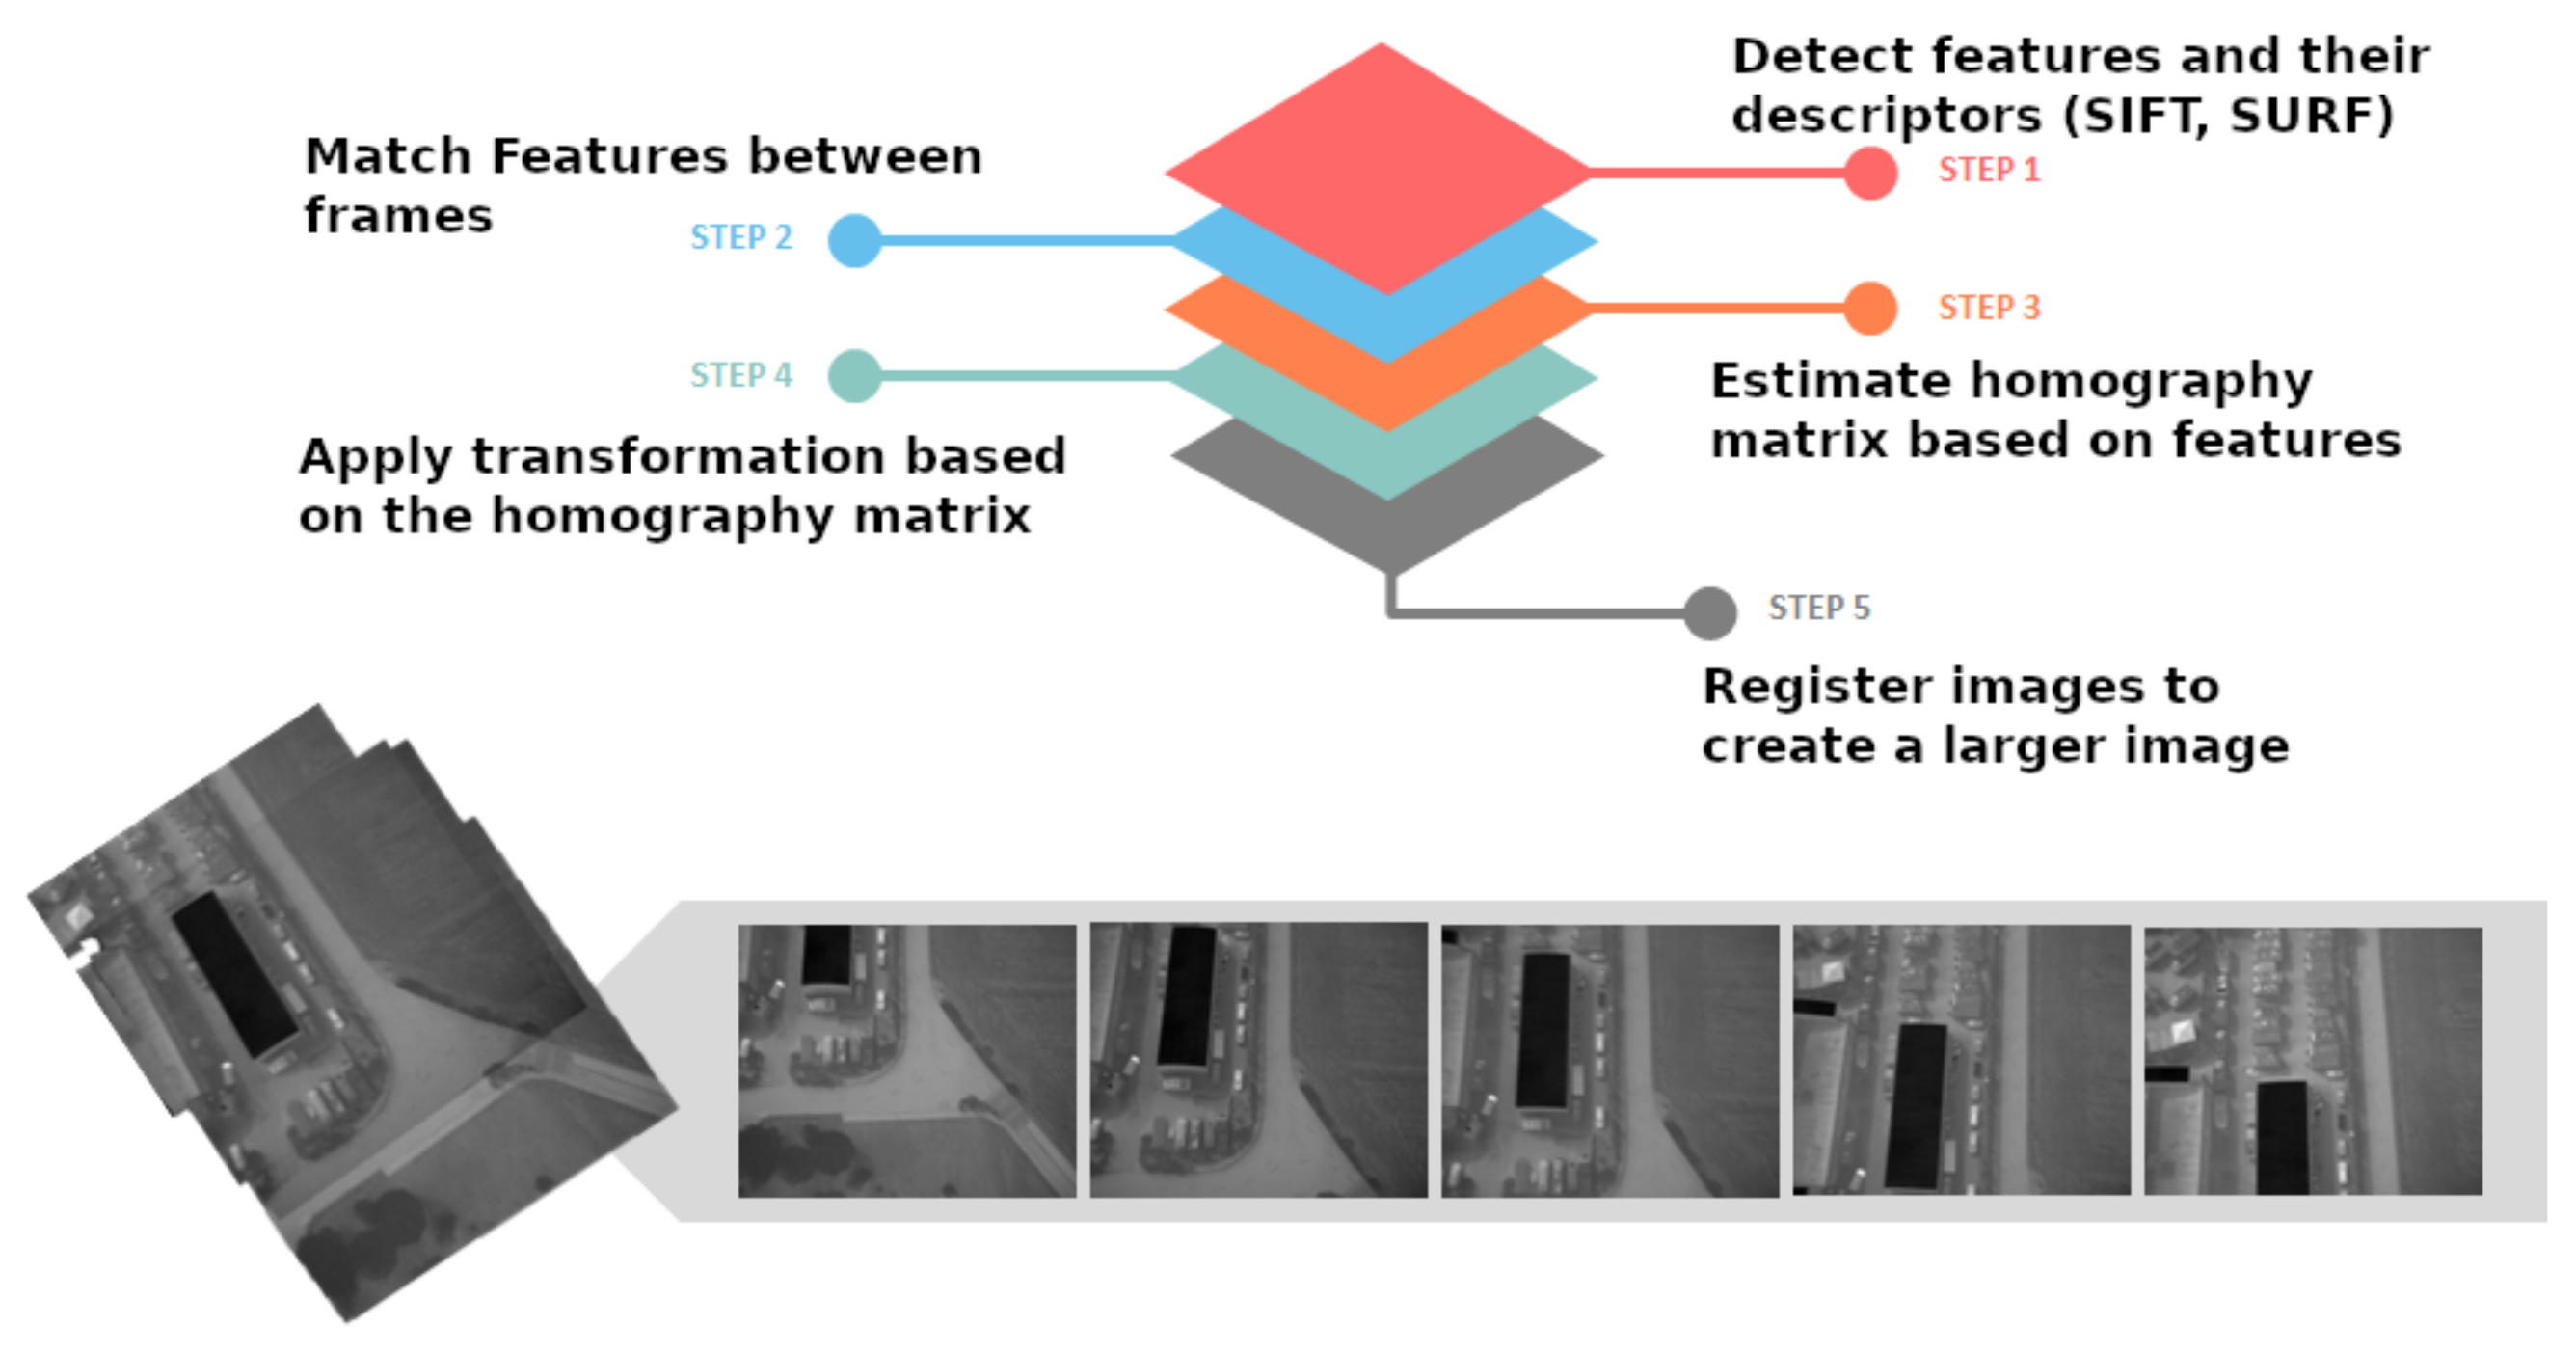
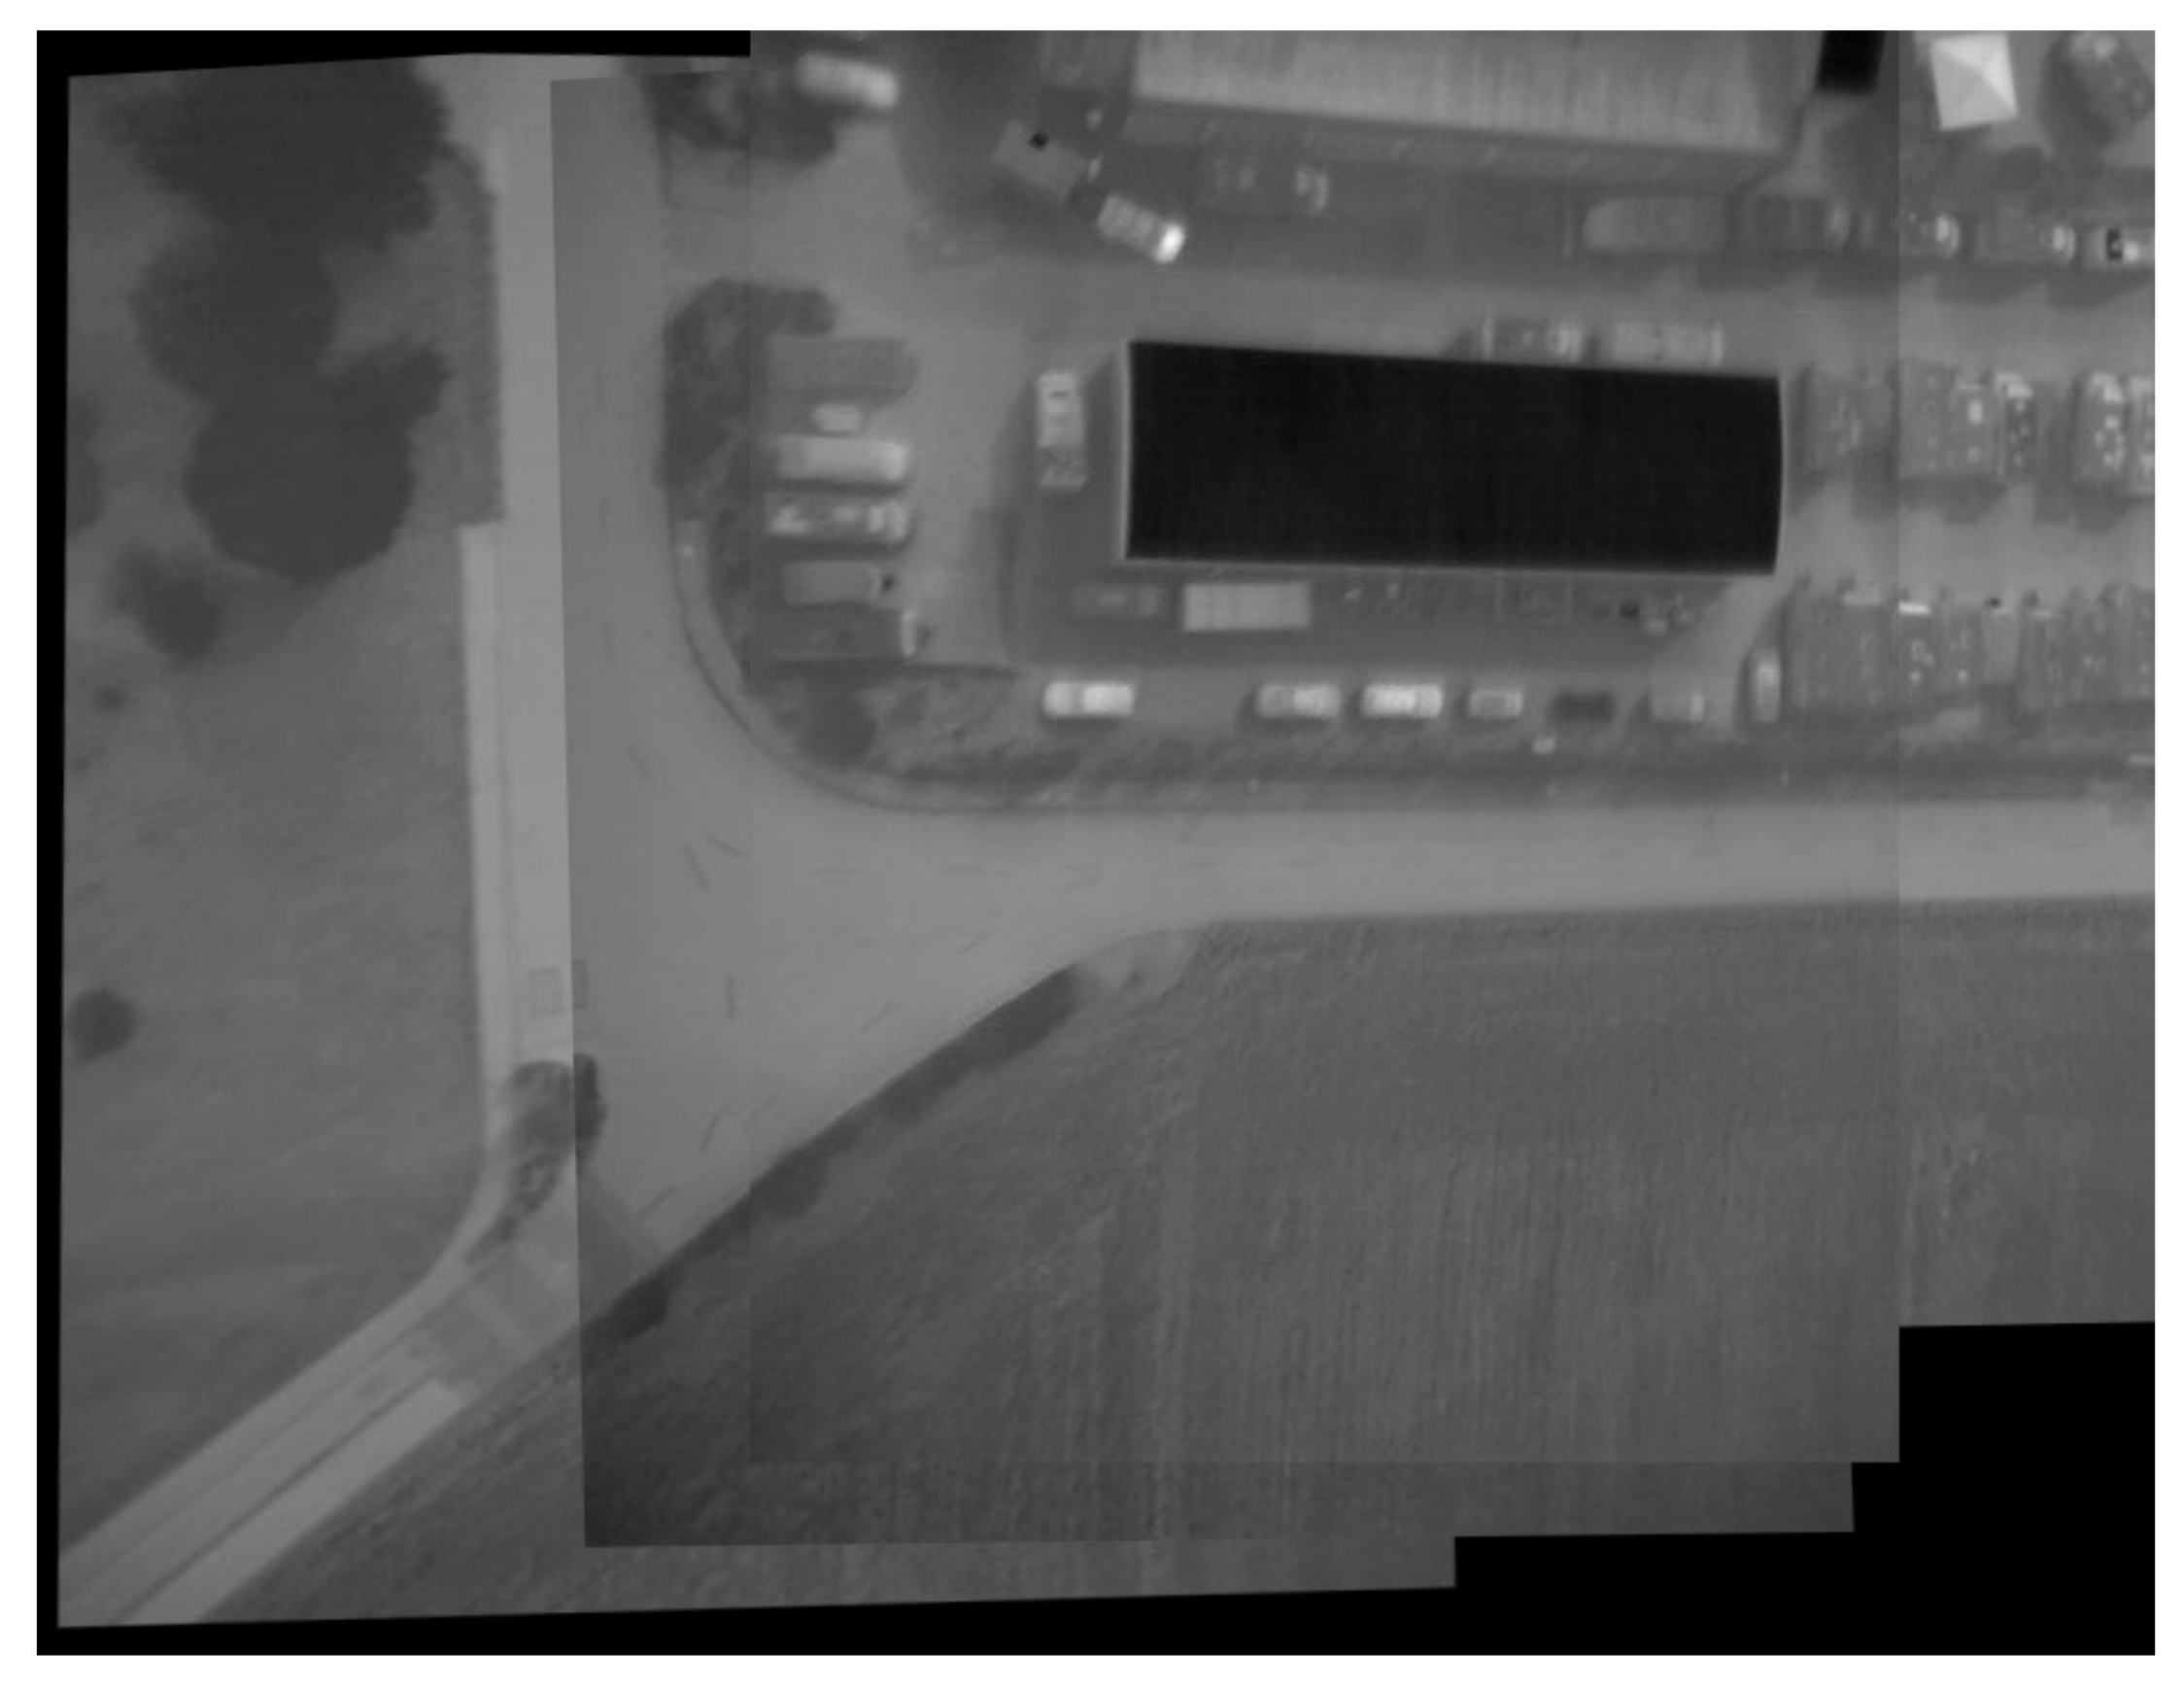
5.1. Aerial Thermographic Image Stitching

Thermographic inspection of large specimens with high structural complexity brings out many challenges. During the operation, inspectors have to carry out multiple data collections from different positions to cover the object from different angles. Therefore, localizing the detected defects for further analysis or possible maintenance is an issue in such scenarios, increasing the inspection time and the possibility of human error. Moreover, it is necessary to analyze each part from different views to avoid any misdetection. Consequently, acquiring a thermal map of the surveyed area can assist inspectors in providing a more efficient and accurate result.
Image stitching is the process of joining overlapping images to form a unified map that covers all the targeted specimens to enlarge the camera’s FOV. One of the main applications of image stitching is to increase the FOV using the image stream received back from the aerial system. Moreover, the limitation of the camera’s lens weight and required bandwidth for capturing larger images can lead to cost increases and technical difficulties. Image stitching can assist companies in easing up these issues and keep the region of interest in view for a longer time.
In this study, the applications and benefits of image stitching for aerial inspection were investigated. The acquired image stream from a UAV is processed to detect and extract Speeded-Up Robust Features (SURF) features, as explained in [142], to be tracked during the process. Then, two consecutive image frames are compared and matched based on the extracted features using Brute–Force schema [143]. Later, the Random Sample Consensus (RANSAC) algorithm is employed to estimate a homography matrix using the already-matched features. Finally, a warping transformation is applied using the homography matrix to create the resulted image. The steps are depicted in Figure 4. Furthermore, a sample result of the process is presented in Figure 5.
This study uses the SenseFly dataset containing thermal images of an industrial site located in Switzerland. An eBee X fixed-wing drone equipped with a SenseFly Duet T thermal mapping camera is employed for acquiring the SenseFly dataset. Details of the dataset are explained in Table 4.

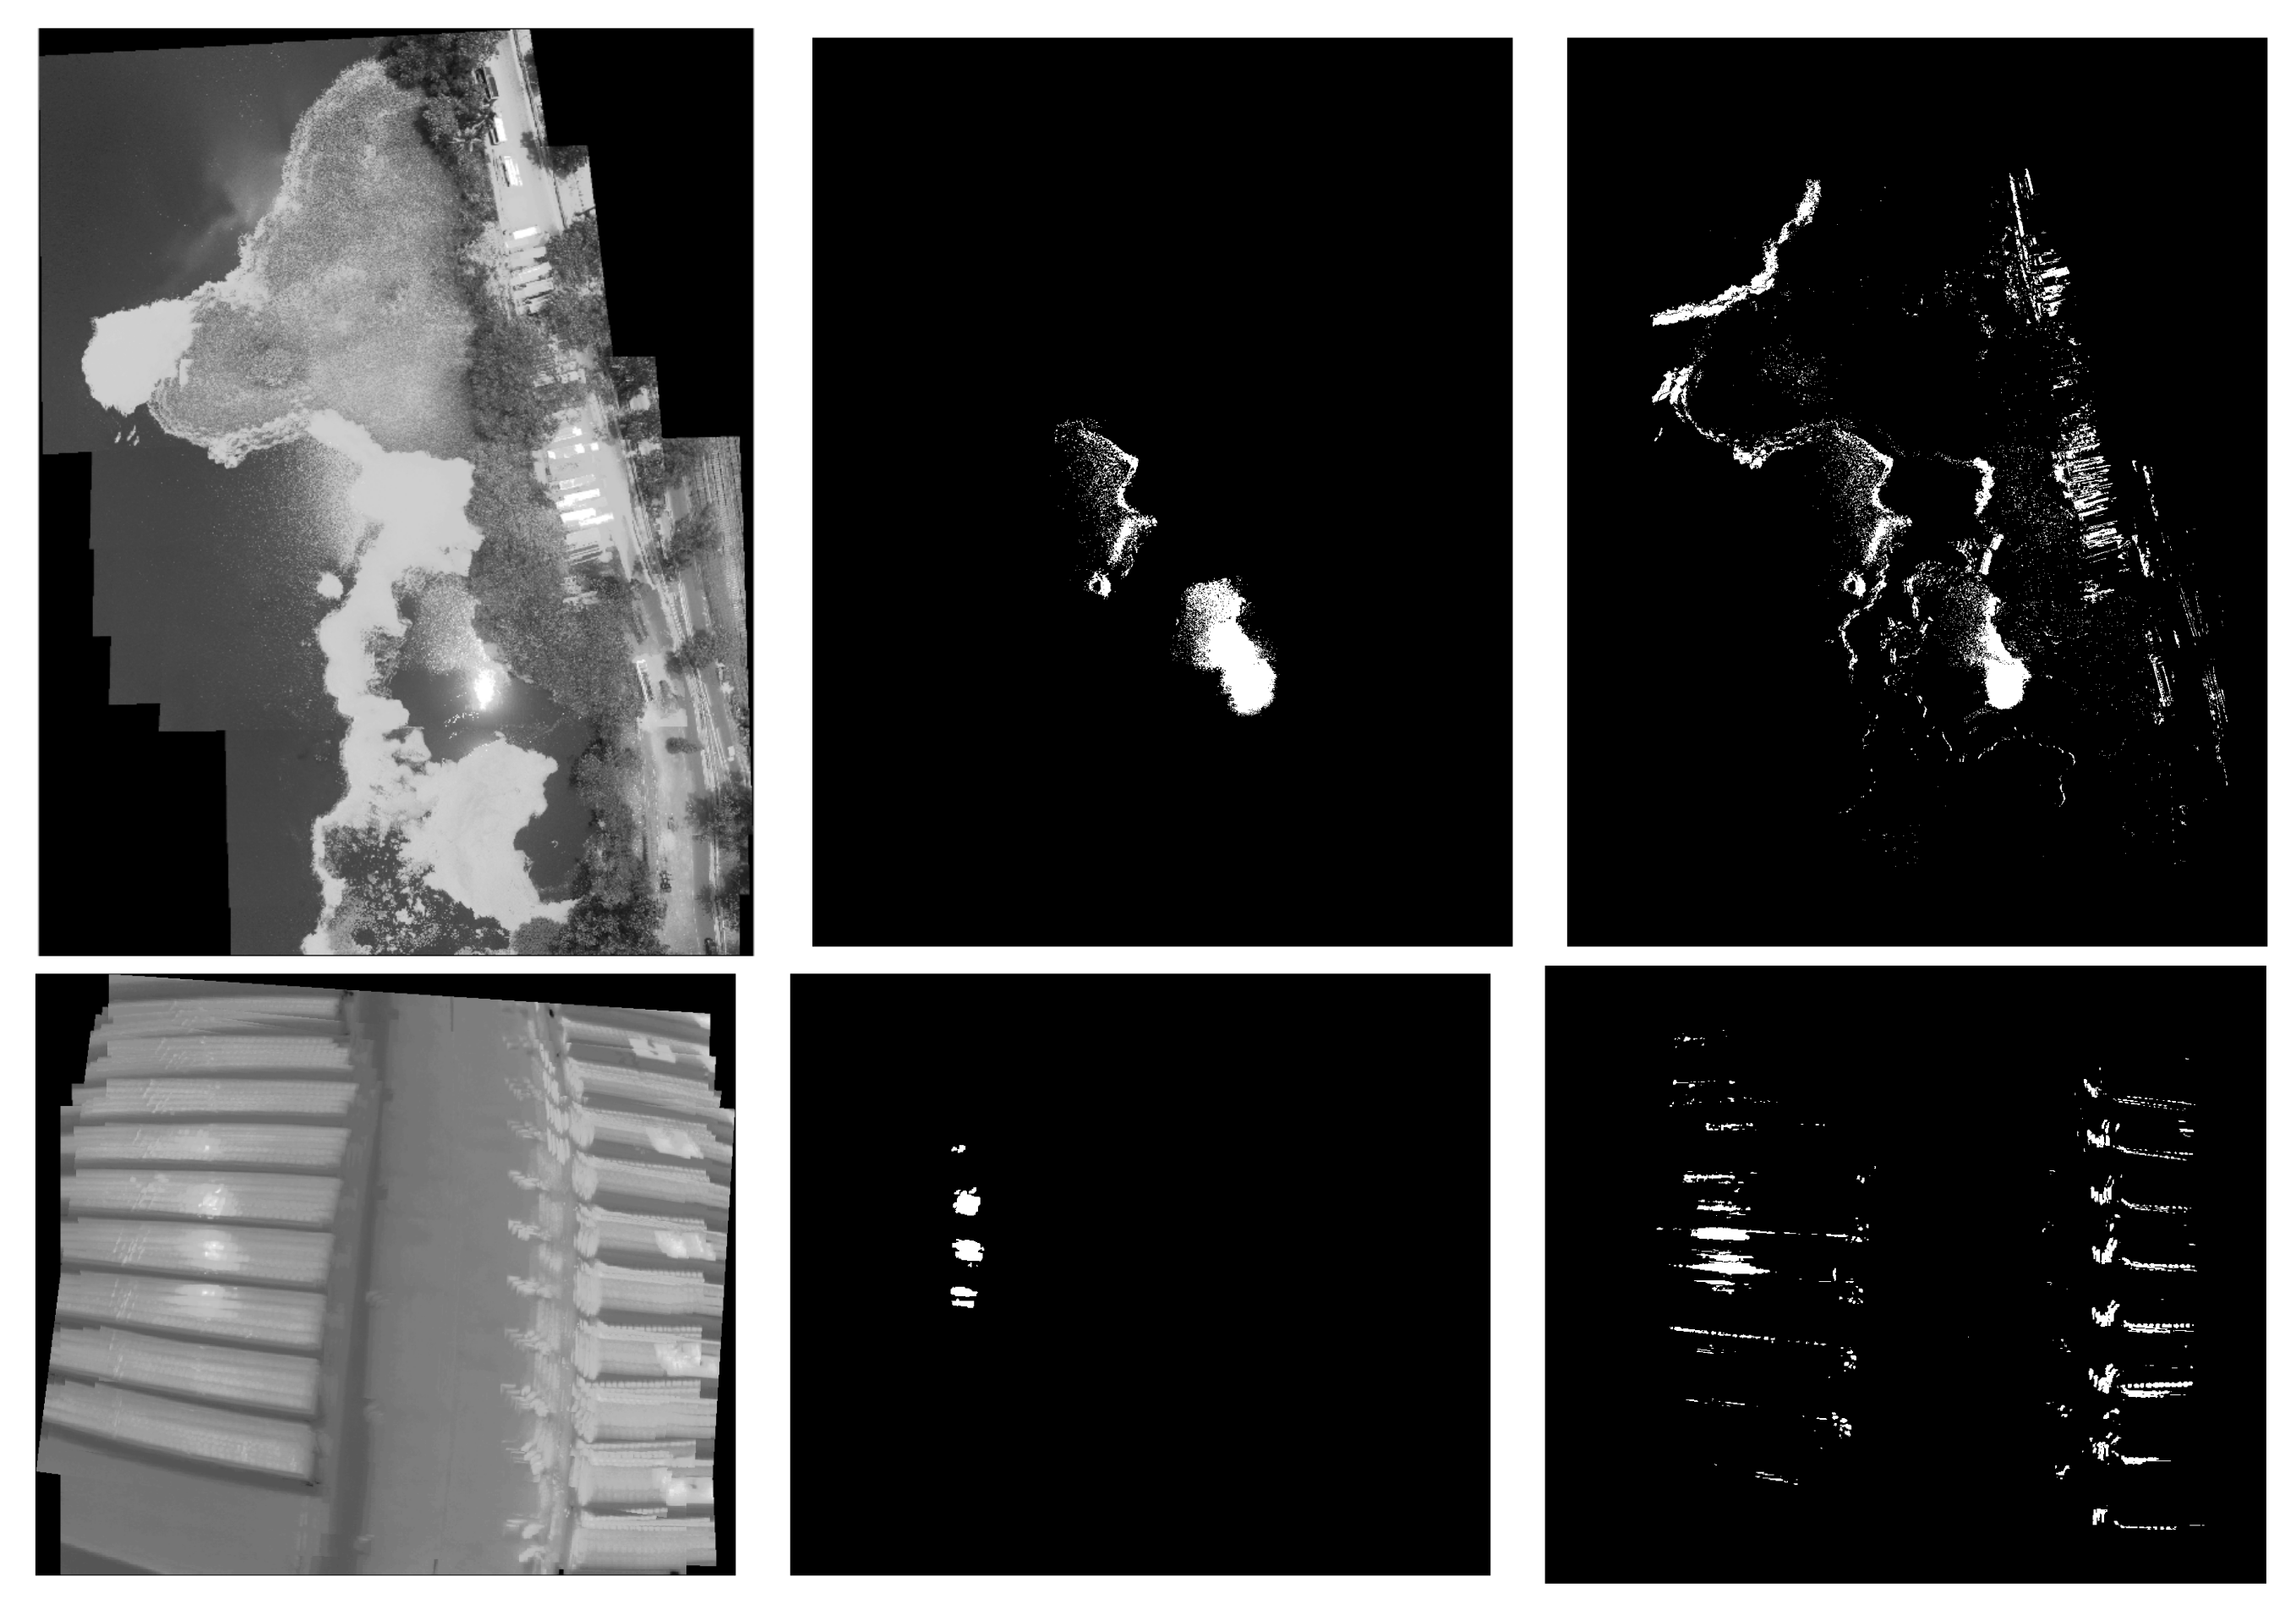
5.2. Reflection Detection in Drone-Based Thermographic Inspection

One of the primary sources of data misinterpretation is the reflection caused by the surrounding objects, the stimulation units, or the aerial platform itself. Sometimes the reflection of the drone itself appears in the images, which can cause misinterpretation, especially in remote inspection, to which there is limited access.
In this study, a method is proposed for detecting and localizing the reflections in a thermal image stream [144]. The typical approach to detect the reflections is to capture thermal images from different fields of view. In this way, the reflection’s position changes as the position of the thermal camera changes. The same concept is adopted in this paper. Thus, firstly, a series of thermal images were acquired from different but consecutive fields of view. Later, the images were aligned to provide a stitched thermal map of the inspected area. Then, the multiple measurements obtained for each pixel of the thermal map were used to estimate the thermal values. A probabilistic map was calculated to demonstrate the occurrence probability of the reflection effect in each pixel.
In the experiments, three assumptions were made for simplification: (a) it is assumed that the drone surveys in a reasonable distance to ensure the existence of enough landmarks for the image matching and registration; (b) it is assumed that no local distortion or non-rigid deformations exist to avoid local mismatches in the thermal map; and (c) no moving object or local motions not related to the camera movement, or existing reflection, exist in the obtained images.
In this study, the proposed method was evaluated using three experiments representing different scenarios. In the first experiment, an open access dataset containing high-resolution RGB images with no motion blurriness is used. The images were collected by an FC300X camera installed on a DJI Platform 3 [145]. The second experiment was conducted to use the proposed method for the inspection of aerospace components. The employed dataset contains thermal images of a Boeing 737–500 airplane collected by an uncooled thermal camera installed on a customized drone manufactured by the Third Element Aviation company. Moreover, the third experiment is selected to assess the algorithm behavior for the worst-case scenario, where the thermal images contain low-resolution images with motion blurriness of a solar panel installation. The dataset contains thermal images acquired by the eBee Classic drone equipped with a SenseFly ThermoMAP camera [146].
For evaluation purposes, a target map representing the reflection areas was generated manually. The target map is later used to provide a pixel-wise comparative analysis of the method’s results. In Figure 6, some sample results and target maps of conducted experiments are demonstrated.

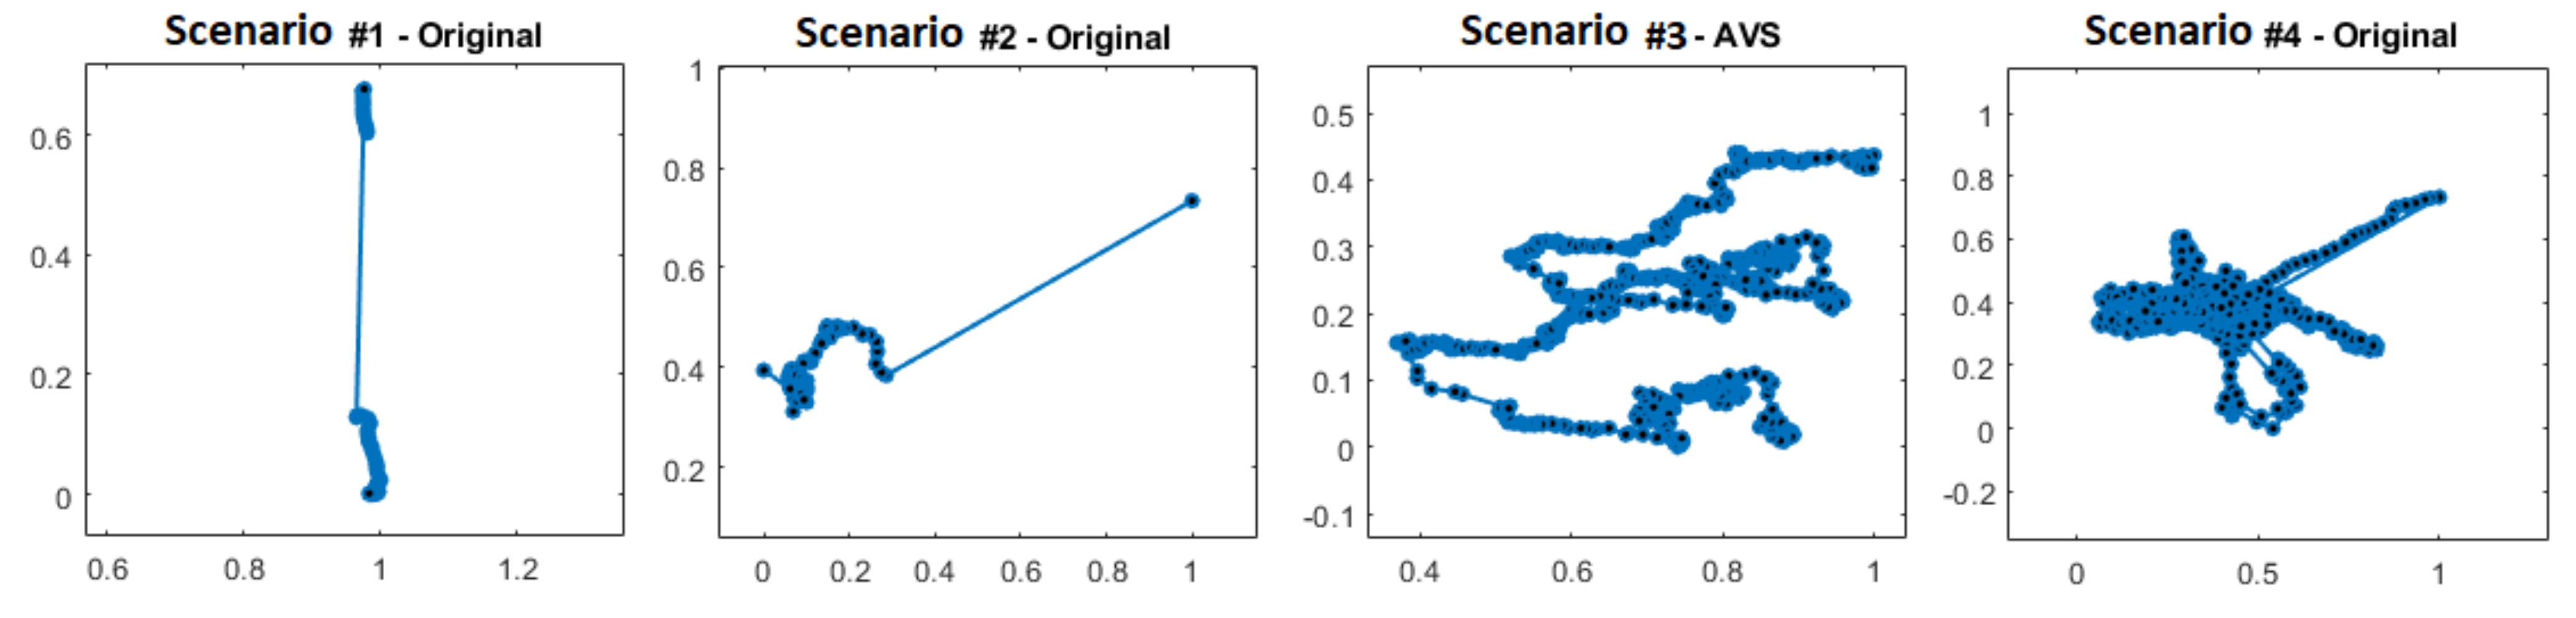
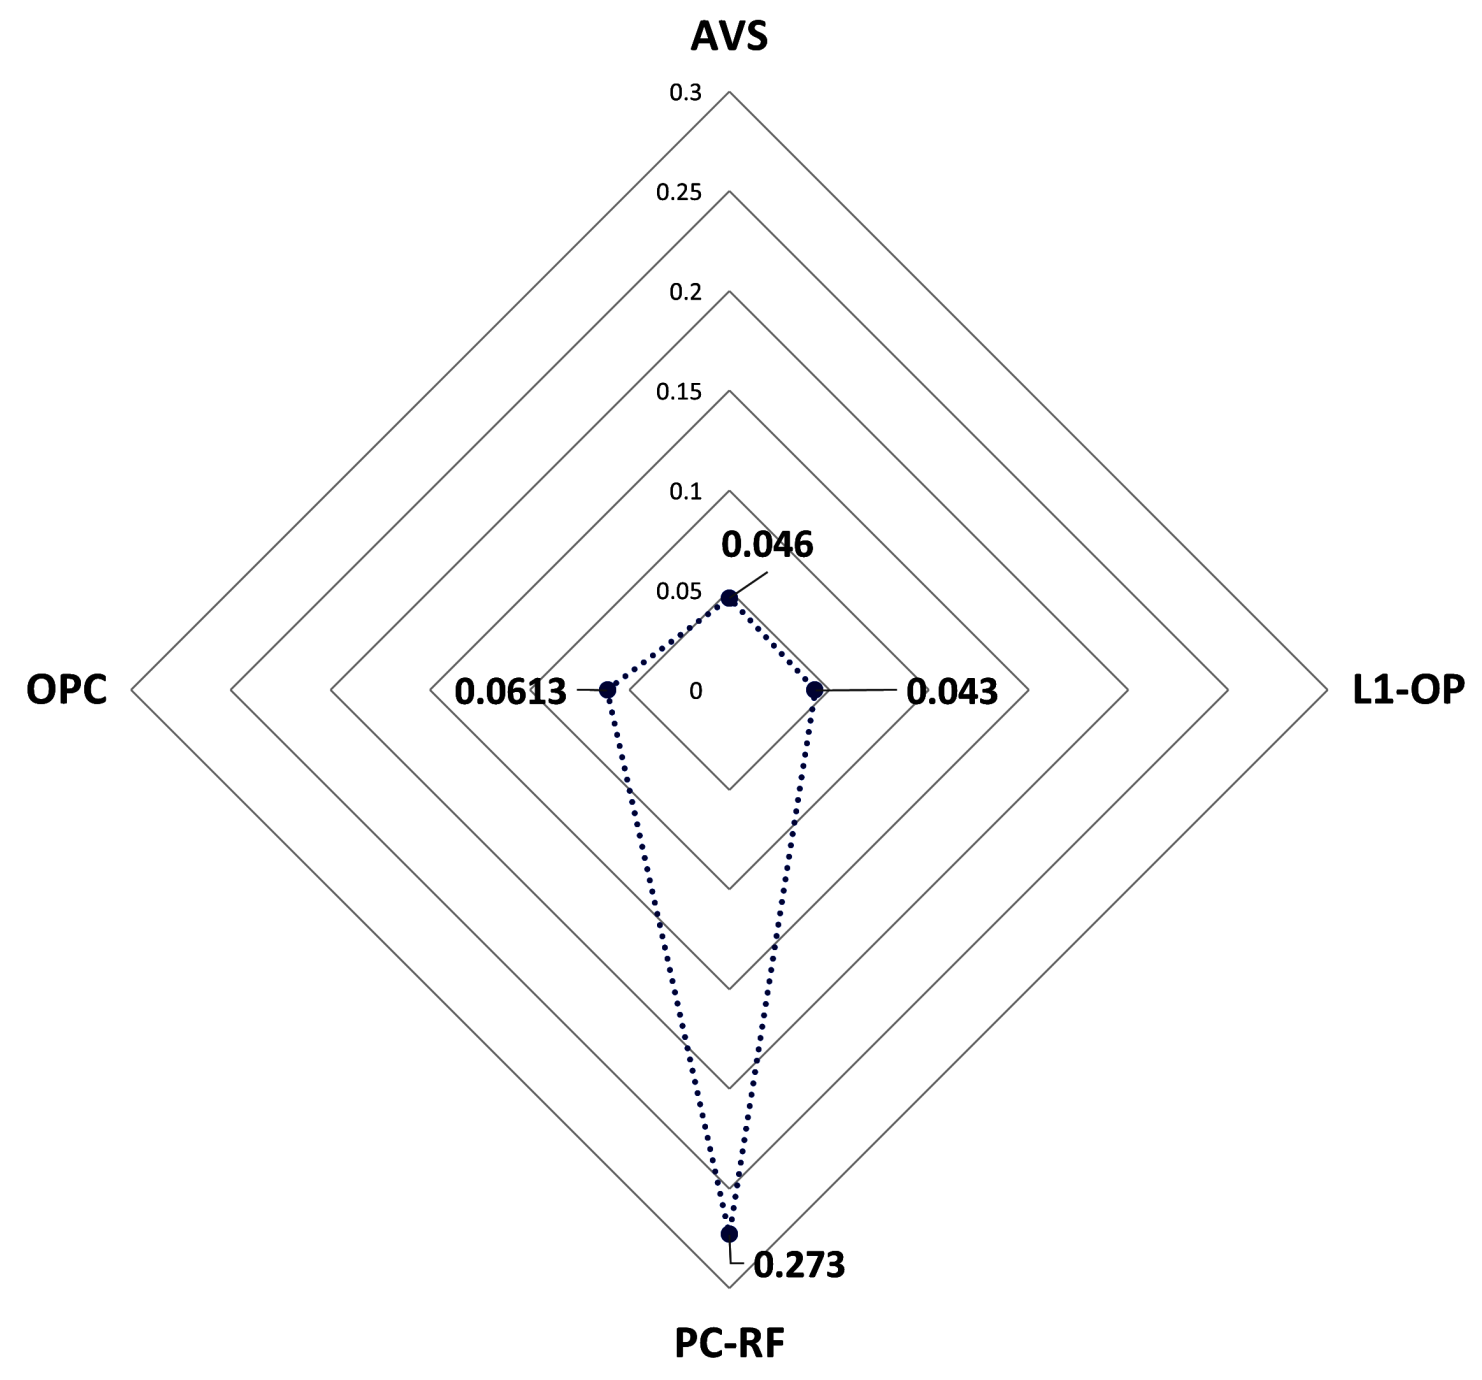
5.3. Video Stabilization in Case of Drone Hovering

One of the issues that must be addressed is the constant monitoring of an area with minimum to no vibration using a thermal imaging system installed on a drone. In such scenarios, the observer must maintain its position relative to the specimen to provide an accurate and reliable analysis of temporal changes in thermal behavior. The mentioned presumption can be very challenging to maintain in practice, as drones may experience unavoidable slight movements (in all directions) while hovering. To overcome this problem, the authors provide a comparative analysis of video stabilization techniques to minimize the effect of the drone’s unexpected movements, specifically for the drone’s hovering scenarios.
This study involves the comparison of four stabilization techniques: (a) moving average filter for smoothing (AVS) [147], (b) a technique based on robust L1 optimal camera path (L1-OP) [148], (c) a method based on phase correlation (PC-RF), and (d) an optimization-based technique explained in [149]. The provided comparative study includes quality assessments as explained in [150].
The experiments were conducted in two sessions recorded by thermal and visible cameras. The resulted dataset contains four sets of image streams involving different scenarios. For this experiment, a DJI Mavic 2 Pro and a FLIR GF309 cooled camera were used, providing a total of 25 minutes of thermal and visible footage. The camera motions are shown in Figure 7.
The first assessment considers the computation time of the candidate methods, as shown in Figure 8. Computation time is one of the most important metrics, especially where the system needs to be deployed on an aerial platform with limited processing capabilities. As shown in the figure, PC-RF has the highest computation time compared to others. Based on the results, AVS, L1-OP, and OPC are more suitable for near real-time applications.
In addition to computation time, four other metrics were used for comparison purposes: (a) Peak Signal to Noise Ratio (PSNR), (b) Interframe Transformation Fidelity (ITF), (c) Interframe Similarity Index (ISI), and (d) AvSpeed, which all were briefly explained in [150]. As shown in Table 5, PC-RF presents the most reliable results for the first scenario, despite some sudden wrongly stabilized frames, which affect the value of AvSpeed. For the second and third scenarios, PC-RF and L1-OP show the best results. Finally, for the fourth experiment, which contains motion blurriness, OPC provides the most significant results compared to other methods.

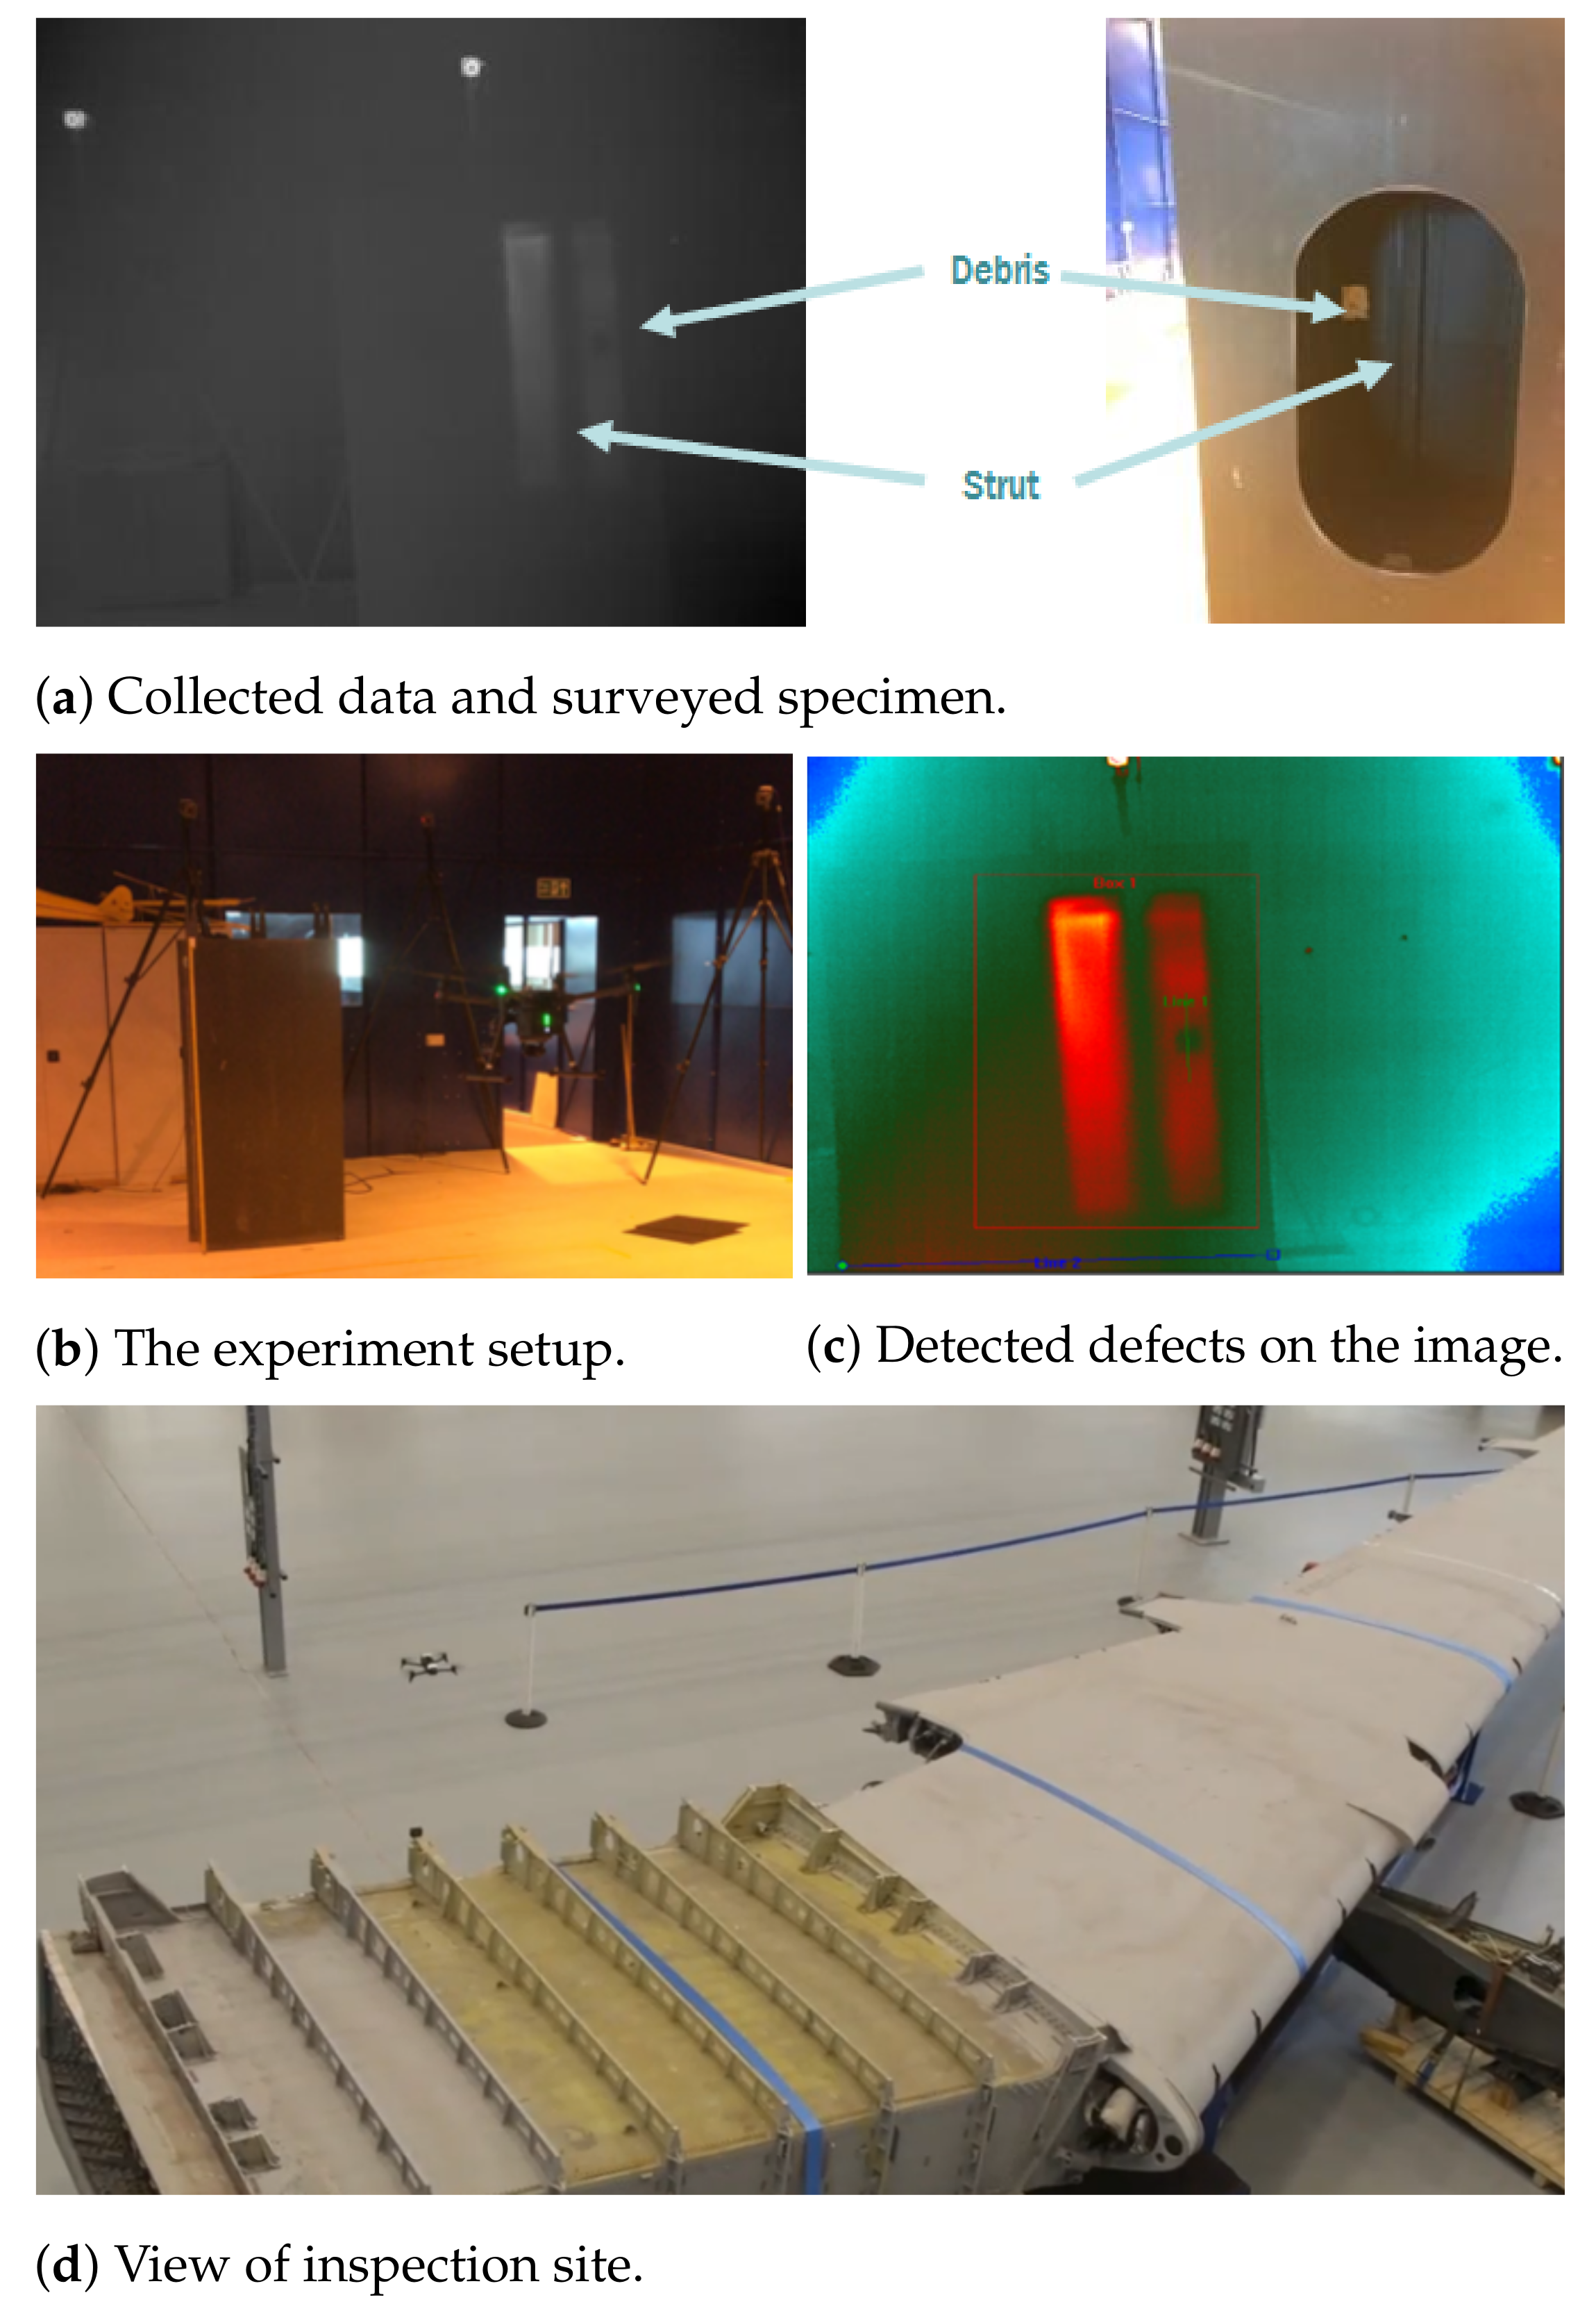
5.4. Aerial Inspection of Aircraft Wings

In this study, an Unmanned Aerial Vehicle is integrated with non-invasive imaging technology to demonstrate the possibility of defect detection on a metallic or composite wing in real-time. The proposed system can be used for quality assurance and aircraft maintenance. The presented concept could reduce the initial capital investment and increase the mobility of the inspection process. Furthermore, a novel localization technique for self-positioning is employed to localize the UAV position, based on the section of a metal wing that needs to be scanned.
The main objective of this study is to investigate the feasibility of employing a drone equipped with a thermal camera to inspect a large aircraft structure. In this study, A DJI M210 drone equipped with a Zenmuse XT thermal camera is used to inspect a wing box made of a carbon fiber-reinforced polymer structure. The structure consists of four compartments, each with a support strut down the center, as seen in Figure 9. In this experiment, warm air was bled into the top right compartment from the rear of the specimen. The front surface was then inspected with the thermal camera. Figure 9 shows a defect which is, in fact, debris inside the wing box. Due to the noisy data, it is not possible to identify any small subsurface defects. A stable UAV and a better excitation source would result in a higher quality dataset. Even though a flash lamp is an ideal option, the required high electrical power and the lamp size prevented using flash lamps as a payload for the drone. It is worth noting that the use of an external flash excitation is an option, but it restricts the versatility of the UAV.
Flights conducted during the experiment have demonstrated the difficulty of manually flying a UAV while capturing NDI data. The data were subject to standard post-processing procedures, such as Principal Component Thermography (PCT) [151] or Pulsed Phase Thermography (PPT) [152]. However, the data were essentially useless due to the noisy sequence, and could not provide accurate results. The acquired sequence revealed that the data were captured at different distances/angles due to the unstable drone. It is worth mentioning that the data were also affected by atmospheric interference combined with vibrations.

5.5. Autonomous Systems Imaging of Aerospace Structures

The study presented in [153] investigates drone-based NDI of composite materials using active thermography. The study introduces a schema to inspect composite panels for aircraft structures straight from the manufacturing line. The inspection evaluates the worthiness and quality of the structures. Since the inspection is inside the structure, the challenges of drone localization could result in an unstable flight and unreliable data. This issue is tackled by distributing ultrasonic sensors around the experimental area. The UAV uses the provided information from the ultrasonic sensors to estimate its location. In the experiment, the specimen was separated into the various regions of interest, which were later stitched together in the post-processing step.
It is found that cooled thermal camera is not feasible for drone-based thermographic inspection [153]. Cooled thermal cameras often require cryogenic cooling, which is an excess weight to be carried by a drone. Thus, a DJI M210 equipped with an uncooled microbolometer FLIR A320 camera (long-wave infrared −7.5–14 mm, 640 × 512 pixels, 13 mm lens) is employed for data acquisition. The camera is connected to a computer via a cable for data collection and a power cable for the drone. The drone and setup are shown in Figure 10.

6. Conclusions

In recent decades, the growing interest in aerial platforms for the inspection of large infrastructures has motivated companies to invest in finding alternative approaches that improve the inspection process. Drones can decrease the time and cost of the inspection, while increasing the reliability, safety of the inspection, and data consistency. Thus, understanding the possible applications of drones and the advantages and challenges of drone-based inspections can assist researchers and companies in addressing the challenges and strategizing their usage of the aerial platform for different scopes. This paper provides a comprehensive review of drones and their applications in different industries for inspection purposes. The advantages of drone-based inspection are extensively discussed. Moreover, the challenges and limitations of employing drones for industrial inspection are briefly explained. Finally, some of our case studies in the field of drone-based inspection of industrial infrastructures are described.

Author Contributions

Conceptualization, Methodology, and validation P.N., C.I.-C., S.D., N.P.A. and X.P.V.M.; Experimental Data Acquisition P.N. and S.D.; Formal analysis P.N., F.L., C.I.-C. and X.P.V.M.; writing—review, editing, and data visualization P.N., C.I.-C. and S.P.; supervision, resources, funding acquisition X.P.V.M., M.G. and N.P.A. All authors have read and agreed to the published version of the manuscript.

Funding

This research was funded by several agencies such as UK-Canada joint project MULTI-ACT. We also acknowledge the support of Natural Sciences and Engineering Research Council of Canada (NSERC), the CREAT-oN DuTy! Program, Discovery grant program, Canada Research Chair MIVIM on infrared vision. The help of TORNGATS Services Techniques is also acknowledged.

Data Availability Statement

Data sharing not applicable.

Conflicts of Interest

The authors declare no conflict of interest. The funders had no role in the design of the study; in the collection, analyses, or interpretation of data; in the writing of the manuscript, or in the decision to publish the results.

References

  1. Maldague, X. Theory and Practice of Infrared Technology for Nondestructive Testing; John Wiley & Sons: New York, NY, USA, 2001. [Google Scholar]
  2. Maldague, X.P.; Moore, P.O. Nondestructive Testing Handbook: Infrared and Thermal Testing, 3rd ed.; American Society for Nondestructive Testing: Columbus, OH, USA, 2001. [Google Scholar]
  3. Ibarra-Castanedo, C.; Tarpani, J.R.; Maldague, X.P. Nondestructive testing with thermography. Eur. J. Phys. 2013, 34, S91. [Google Scholar] [CrossRef]
  4. Jalal, M.F.A.; Sahari, K.S.M.; Aziz, M.A.; Yunos, K.; Anuar, A.; Ghani, M.F.A.; How, D.N.T. Design and development of robotic system for visual inspection of boiler tube inner surface. Procedia Comput. Sci. 2017, 105, 304–309. [Google Scholar] [CrossRef]
  5. Khaloo, A.; Lattanzi, D.; Cunningham, K.; Dell’Andrea, R.; Riley, M. Unmanned aerial vehicle inspection of the Placer River Trail Bridge through image-based 3D modelling. Struct. Infrastruct. Eng. 2018, 14, 124–136. [Google Scholar] [CrossRef]
  6. Shihavuddin, A.; Chen, X.; Fedorov, V.; Nymark Christensen, A.; Andre Brogaard Riis, N.; Branner, K.; Bjorholm Dahl, A.; Reinhold Paulsen, R. Wind turbine surface damage detection by deep learning aided drone inspection analysis. Energies 2019, 12, 676. [Google Scholar] [CrossRef] [Green Version]
  7. Mattar, R.A.; Kalai, R. Development of a wall-sticking drone for non-destructive ultrasonic and corrosion testing. Drones 2018, 2, 8. [Google Scholar] [CrossRef] [Green Version]
  8. Rossi, M.; Brunelli, D.; Adami, A.; Lorenzelli, L.; Menna, F.; Remondino, F. Gas-drone: Portable gas sensing system on UAVs for gas leakage localization. In Proceedings of the SENSORS, Valencia, Spain, 2–5 November 2014; pp. 1431–1434. [Google Scholar]
  9. Finn, A.; Scheding, S. Developments and challenges for autonomous unmanned vehicles. Intell. Syst. Ref. Libr. 2010, 3, 128–154. [Google Scholar]
  10. Newcome, L.R. Unmanned Aviation: A Brief History of Unmanned Aerial Vehicles; American Institute of Aeronautics and Astronautics: Reston, VA, USA, 2004. [Google Scholar]
  11. Nonami, K.; Kendoul, F.; Suzuki, S.; Wang, W.; Nakazawa, D. Autonomous Flying Robots: Unmanned Aerial Vehicles and Micro Aerial Vehicles; Springer Science & Business Media: Berlin/Heidelberg, Germany, 2010; pp. 1–329. [Google Scholar] [CrossRef]
  12. Arjomandi, M.; Agostino, S.; Mammone, M.; Nelson, M.; Zhou, T. Classification of unmanned aerial vehicles. In Report for Mechanical Engineering Class; University of Adelaide: Adelaide, Australia, 2006. [Google Scholar]
  13. Hassanalian, M.; Abdelkefi, A. Classifications, applications, and design challenges of drones: A review. Prog. Aerosp. Sci. 2017, 91, 99–131. [Google Scholar] [CrossRef]
  14. Dempsey, M.E.; Rasmussen, S. Eyes of the Army–US Army Roadmap for Unmanned Aircraft Systems 2010–2035; US Army UAS Center of Excellence: Fort Rucker, AL, USA, 2010; Volume 9. [Google Scholar]
  15. Moore, G.K. What is a picture worth? A history of remote sensing/What is the value of an image? An overview of téléétection. Hydrol. Sci. Bull. 1979, 24, 477–485. [Google Scholar] [CrossRef] [Green Version]
  16. Rakha, T.; Gorodetsky, A. Review of Unmanned Aerial System (UAS) applications in the built environment: Towards automated building inspection procedures using drones. Autom. Constr. 2018, 93, 252–264. [Google Scholar] [CrossRef]
  17. Hardin, P.J.; Jensen, R.R. Small-scale unmanned aerial vehicles in environmental remote sensing: Challenges and opportunities. GISci. Remote. Sens. 2011, 48, 99–111. [Google Scholar] [CrossRef]
  18. Martinez, K. The History of Drones (Drone History Timeline from 1849 To 2019). Available online: https://www.dronethusiast.com/history-of-drones (accessed on 11 May 2021).
  19. Mac, R.; Shao, H.; Bi, F. Bow to Your Billionaire Drone Overlord: Frank Wang’s Quest to Put DJI Robots into The Sky. Forbes. (2018.07.25). 2015. Available online: https://www.forbes.com/sites/ryanmac/2015/05/06/dji-drones-frank-wang-china-billionaire (accessed on 11 May 2021).
  20. Vempati, A.S.; Kamel, M.; Stilinovic, N.; Zhang, Q.; Reusser, D.; Sa, I.; Nieto, J.; Siegwart, R.; Beardsley, P. Paintcopter: An autonomous UAV for spray painting on three-dimensional surfaces. IEEE Robot. Autom. Lett. 2018, 3, 2862–2869. [Google Scholar] [CrossRef]
  21. Liu, P.; Chen, A.Y.; Huang, Y.N.; Han, J.Y.; Lai, J.S.; Kang, S.C.; Wu, T.H.; Wen, M.C.; Tsai, M.H. A review of rotorcraft unmanned aerial vehicle (UAV) developments and applications in civil engineering. Smart Struct. Syst. 2014, 13, 1065–1094. [Google Scholar] [CrossRef]
  22. Matikainen, L.; Lehtomäki, M.; Ahokas, E.; Hyyppä, J.; Karjalainen, M.; Jaakkola, A.; Kukko, A.; Heinonen, T. Remote sensing methods for power line corridor surveys. ISPRS J. Photogramm. Remote. Sens. 2016, 119, 10–31. [Google Scholar] [CrossRef] [Green Version]
  23. Rouse, M.; Earls, A.; Shea, S.; Wigmore, I. Drone (Unmanned Aerial Vehicle, UAV). Definition from WhatIs.com. 2016. Available online: https://internetofthingsagenda.techtarget.com/definition/drone (accessed on 2 March 2019).
  24. Biljecki, F.; Stoter, J.; Ledoux, H.; Zlatanova, S.; Çöltekin, A. Applications of 3D city models: State of the art review. ISPRS Int. J. -Geo-Inf. 2015, 4, 2842–2889. [Google Scholar] [CrossRef] [Green Version]
  25. Fernández-Hernandez, J.; González-Aguilera, D.; Rodríguez-Gonzálvez, P.; Mancera-Taboada, J. Image-based modelling from unmanned aerial vehicle (UAV) photogrammetry: An effective, low-cost tool for archaeological applications. Archaeometry 2015, 57, 128–145. [Google Scholar] [CrossRef]
  26. Elijah, O.; Rahman, T.A.; Orikumhi, I.; Leow, C.Y.; Hindia, M.N. An overview of Internet of Things (IoT) and data analytics in agriculture: Benefits and challenges. IEEE Internet Things J. 2018, 5, 3758–3773. [Google Scholar] [CrossRef]
  27. Sudevan, V.; Shukla, A.; Karki, H. Current and future research focus on inspection of vertical structures in oil and gas industry. In Proceedings of the 2018 18th International Conference on Control, Automation and Systems (ICCAS), PyeongChang, Korea, 17–20 October 2018; pp. 144–149. [Google Scholar]
  28. Mohamadi, F. Vertical Takeoff and Landing (VTOL) Small Unmanned Aerial System for Monitoring Oil and Gas Pipelines. US Patent 8,880,241, 4 November 2014. [Google Scholar]
  29. Li, Y.; Liu, C. Applications of multirotor drone technologies in construction management. Int. J. Constr. Manag. 2019, 19, 401–412. [Google Scholar] [CrossRef]
  30. Lee, S.; Choi, Y. Reviews of unmanned aerial vehicle (drone) technology trends and its applications in the mining industry. Geosyst. Eng. 2016, 19, 197–204. [Google Scholar] [CrossRef]
  31. Deng, C.; Wang, S.; Huang, Z.; Tan, Z.; Liu, J. Unmanned aerial vehicles for power line inspection: A cooperative way in platforms and communications. J. Commun. 2014, 9, 687–692. [Google Scholar] [CrossRef] [Green Version]
  32. Buerhop, C.; Pickel, T.; Dalsass, M.; Scheuerpflug, H.; Camus, C.; Brabec, C.J. aIR-PV-check: A quality inspection of PV-power plants without operation interruption. In Proceedings of the 2016 IEEE 43rd Photovoltaic Specialists Conference (PVSC), Portland, OR, USA, 5–10 June 2016; pp. 1677–1681. [Google Scholar]
  33. Teubner, J.; Kruse, I.; Scheuerpflug, H.; Buerhop-Lutz, C.; Hauch, J.; Camus, C.; Brabec, C.J. Comparison of drone-based IR-imaging with module resolved monitoring power data. Energy Procedia 2017, 124, 560–566. [Google Scholar] [CrossRef]
  34. Zefri, Y.; ElKettani, A.; Sebari, I.; Ait Lamallam, S. Thermal infrared and visual inspection of photovoltaic installations by UAV photogrammetry—Application case: Morocco. Drones 2018, 2, 41. [Google Scholar] [CrossRef] [Green Version]
  35. Peled, A.; Appelbaum, J. Minimizing the current mismatch resulting from different locations of solar cells within a PV module by proposing new interconnections. Sol. Energy 2016, 135, 840–847. [Google Scholar] [CrossRef]
  36. Forniés, E.; Naranjo, F.; Mazo, M.; Ruiz, F. The influence of mismatch of solar cells on relative power loss of photovoltaic modules. Sol. Energy 2013, 97, 39–47. [Google Scholar] [CrossRef]
  37. Silvestre, S.; Boronat, A.; Chouder, A. Study of bypass diodes configuration on PV modules. Appl. Energy 2009, 86, 1632–1640. [Google Scholar] [CrossRef]
  38. Djordjevic, S.; Parlevliet, D.; Jennings, P. Detectable faults on recently installed solar modules in Western Australia. Renew. Energy 2014, 67, 215–221. [Google Scholar] [CrossRef] [Green Version]
  39. Lopez-Garcia, J.; Pozza, A.; Sample, T. Long-term soiling of silicon PV modules in a moderate subtropical climate. Sol. Energy 2016, 130, 174–183. [Google Scholar] [CrossRef]
  40. Sinha, A.; Sastry, O.; Gupta, R. Detection and characterisation of delamination in PV modules by active infrared thermography. Nondestruct. Test. Eval. 2016, 31, 1–16. [Google Scholar] [CrossRef]
  41. Meyer, S.; Richter, S.; Timmel, S.; Gläser, M.; Werner, M.; Swatek, S.; Hagendorf, C. Snail trails: Root cause analysis and test procedures. Energy Procedia 2013, 38, 498–505. [Google Scholar] [CrossRef]
  42. Quater, P.B.; Grimaccia, F.; Leva, S.; Mussetta, M.; Aghaei, M. Light Unmanned Aerial Vehicles (UAVs) for cooperative inspection of PV plants. IEEE J. Photovoltaics 2014, 4, 1107–1113. [Google Scholar] [CrossRef] [Green Version]
  43. Tsanakas, J.A.; Ha, L.D.; Al Shakarchi, F. Advanced inspection of photovoltaic installations by aerial triangulation and terrestrial georeferencing of thermal/visual imagery. Renew. Energy 2017, 102, 224–233. [Google Scholar] [CrossRef]
  44. Alshayeb, M.; Chang, J. Variations of PV Panel Performance Installed over a Vegetated Roof and a Conventional Black Roof. Energies 2018, 11, 1110. [Google Scholar] [CrossRef] [Green Version]
  45. Tsanakas, J.A.; Ha, L.; Buerhop, C. Faults and infrared thermographic diagnosis in operating c-Si photovoltaic modules: A review of research and future challenges. Renew. Sustain. Energy Rev. 2016, 62, 695–709. [Google Scholar] [CrossRef]
  46. Gallardo-Saavedra, S.; Hernández-Callejo, L.; Duque-Perez, O. Technological review of the instrumentation used in aerial thermographic inspection of photovoltaic plants. Renew. Sustain. Energy Rev. 2018, 93, 566–579. [Google Scholar] [CrossRef]
  47. Grimaccia, F.; Aghaei, M.; Mussetta, M.; Leva, S.; Quater, P.B. Planning for PV plant performance monitoring by means of unmanned aerial systems (UAS). Int. J. Energy Environ. Eng. 2015, 6, 47–54. [Google Scholar] [CrossRef] [Green Version]
  48. Buerhop, C.; Weißmann, R.; Scheuerpflug, H.; Auer, R.; Brabec, C. Quality control of PV-modules in the field using a remote-controlled drone with an infrared camera. In Proceedings of the 27th European Photovoltaic Solar Energy Conference and Exhibition (EU PVSEC 2012), Frankfurt, Germany, 24 September 2012; Volume 1, pp. 3370–3373. [Google Scholar]
  49. Koch, S.; Weber, T.; Sobottka, C.; Fladung, A.; Clemens, P.; Berghold, J. Outdoor Electroluminescence Imaging of Crystalline Photovoltaic Modules: Comparative Study between Manual Ground-Level Inspections and Drone-Based Aerial Surveys. In Proceedings of the 32nd European Photovoltaic Solar Energy Conference and Exhibition, München, Germany, 21–24 June 2016; Volume 53, pp. 1736–1740. [Google Scholar] [CrossRef]
  50. Aghaei, M.; Madukanya, E.U.; de Oliveira, A.K.V.; Rüther, R. Fault inspection by aerial infrared thermography in a pv plant after a meteorological tsunami. In Proceedings of the VII Congresso Brasileiro de Energia Solar-CBENS, Gramado, Brazil, 17–20 April 2018; Volume 2018. [Google Scholar]
  51. Leva, S.; Aghaei, M.; Grimaccia, F. PV power plant inspection by UAS: Correlation between altitude and detection of defects on PV modules. In Proceedings of the 2015 IEEE 15th International Conference on Environment and Electrical Engineering (EEEIC), Rome, Italy, 10–13 June 2015; pp. 1921–1926. [Google Scholar]
  52. Aghaei, M.; Leva, S.; Grimaccia, F. PV power plant inspection by image mosaicing techniques for IR real-time images. In Proceedings of the 2016 IEEE 43rd Photovoltaic Specialists Conference (PVSC), Portland, OR, USA, 5–10 June 2016; pp. 3100–3105. [Google Scholar]
  53. Alsafasfeh, M.; Abdel-Qader, I.; Bazuin, B.; Alsafasfeh, Q.; Su, W. Unsupervised fault detection and analysis for large photovoltaic systems using drones and machine vision. Energies 2018, 11, 2252. [Google Scholar] [CrossRef] [Green Version]
  54. Lee, S.; An, K.E.; Jeon, B.D.; Cho, K.Y.; Lee, S.J.; Seo, D. Detecting faulty solar panels based on thermal image processing. In Proceedings of the 2018 IEEE International Conference on Consumer Electronics (ICCE), Las Vegas, NV, USA, 12–15 January 2018; pp. 1–2. [Google Scholar]
  55. Taqi, A.; Beryozkina, S. Overhead Transmission Line Thermographic Inspection Using a Drone. In Proceedings of the 2019 IEEE 10th GCC Conference &Exhibition (GCC), Kuwait, Kuwait, 19–23 April 2019; pp. 1–6. [Google Scholar]
  56. Mirallès, F.; Hamelin, P.; Lambert, G.; Lavoie, S.; Pouliot, N.; Montfrond, M.; Montambault, S. LineDrone Technology: Landing an unmanned aerial vehicle on a power line. In Proceedings of the 2018 IEEE International Conference on Robotics and Automation (ICRA), Brisbane, Australia, 21–25 May 2018; pp. 6545–6552. [Google Scholar]
  57. Hamelin, P.; Miralles, F.; Lambert, G.; Lavoie, S.; Pouliot, N.; Montfrond, M.; Montambault, S. Discrete-time control of LineDrone: An assisted tracking and landing UAV for live power line inspection and maintenance. In Proceedings of the 2019 International Conference on Unmanned Aircraft Systems, ICUAS, Atlanta, GA, USA, 11–14 June 2019; pp. 292–298. [Google Scholar] [CrossRef]
  58. Park, J.Y.; Kim, S.T.; Lee, J.K.; Ham, J.W.; Oh, K.Y. Automatic Inspection Drone with Deep Learning-based Auto-tracking Camera Gimbal to Detect Defects in Power Lines. In Proceedings of the 3rd International Conference on Vision, Image and Signal Processing, Vancouver, BC, Canada, 26–28 August 2019; pp. 1–6. [Google Scholar]
  59. Wang, B.; Chen, X.; Wang, Q.; Liu, L.; Zhang, H.; Li, B. Power line inspection with a flying robot. In Proceedings of the 2010 1st International Conference on Applied Robotics for the Power Industry, Montreal, QC, Canada, 5–7 October 2010. [Google Scholar]
  60. Green, J. Mine rescue robots requirements outcomes from an industry workshop. In Proceedings of the 2013 6th Robotics and Mechatronics Conference (RobMech), KwaZulu-Natal, South Africa, 30–31 October 2013; pp. 111–116. [Google Scholar]
  61. Dunnington, L.; Nakagawa, M. Fast and safe gas detection from underground coal fire by drone fly over. Environ. Pollut. 2017, 229, 139–145. [Google Scholar] [CrossRef]
  62. Carvalho, R.; Nascimento, R.; D’Angelo, T.; Delabrida, S.; GC Bianchi, A.; Oliveira, R.A.; Azpúrua, H.; Uzeda Garcia, L.G. A UAV-based framework for semi-automated thermographic inspection of belt conveyors in the mining industry. Sensors 2020, 20, 2243. [Google Scholar] [CrossRef] [Green Version]
  63. Cajzek, R.; Klanšek, U. An unmanned aerial vehicle for multi-purpose tasks in construction industry. J. Appl. Eng. Sci. 2016, 14, 314–327. [Google Scholar] [CrossRef] [Green Version]
  64. Siebert, S.; Teizer, J. Mobile 3D mapping for surveying earthwork projects using an Unmanned Aerial Vehicle (UAV) system. Autom. Constr. 2014, 41, 1–14. [Google Scholar] [CrossRef]
  65. Hubbard, B.; Wang, H.; Leasure, M.; Ropp, T.; Lofton, T.; Hubbard, S.; Lin, S. Feasibility study of UAV use for RFID material tracking on construction sites. In Proceedings of the 51st ASC Annual International Conference, College Station, TX, USA, 22–25 April 2015; pp. 669–676. [Google Scholar]
  66. Fang, Y.; Chen, J.; Cho, Y.; Zhang, P. A point cloud-vision hybrid approach for 3D location tracking of mobile construction assets. In Proceedings of the 33rd International Symposium on Automation and Robotics in Construction (ISARC 2016), Auburn, AL, USA, 18–21 July 2016; Volume 33, pp. 1–7. [Google Scholar]
  67. Hardin, B.; McCool, D. BIM and Construction Management: Proven Tools, Methods, and Workflows; John Wiley & Sons: Hoboken, NJ, USA, 2015. [Google Scholar]
  68. Tezel, B.; Aziz, Z. From conventional to IT based visual management: A conceptual discussion for lean construction. J. Inf. Technol. Constr. 2017, 22, 220–246. [Google Scholar]
  69. Wang, J.; Sun, W.; Shou, W.; Wang, X.; Wu, C.; Chong, H.Y.; Liu, Y.; Sun, C. Integrating BIM and LiDAR for real-time construction quality control. J. Intell. Robot. Syst. 2015, 79, 417–432. [Google Scholar] [CrossRef]
  70. Price, T.J. James Blyth—Britain’s first modern wind power pioneer. Wind Eng. 2005, 29, 191–200. [Google Scholar] [CrossRef]
  71. Righter, R.W. Wind Energy in America: A History; University of Oklahoma Press: Norman, OK, USA, 1996. [Google Scholar]
  72. Kulsinskas, A.; Durdevic, P.; Ortiz-Arroyo, D. Internal Wind Turbine Blade Inspections Using UAVs: Analysis and Design Issues. Energies 2021, 14, 294. [Google Scholar] [CrossRef]
  73. Reddy, A.; Indragandhi, V.; Ravi, L.; Subramaniyaswamy, V. Detection of Cracks and damage in wind turbine blades using artificial intelligence-based image analytics. Measurement 2019, 147, 106823. [Google Scholar] [CrossRef]
  74. Yang, W.; Peng, Z.; Wei, K.; Tian, W. Structural health monitoring of composite wind turbine blades: Challenges, issues and potential solutions. IET Renew. Power Gener. 2017, 11, 411–416. [Google Scholar] [CrossRef] [Green Version]
  75. Hahn, B.; Durstewitz, M.; Rohrig, K. Reliability of wind turbines. In Wind Energy; Springer: Berlin/Heidelberg, Germany, 2007; pp. 329–332. [Google Scholar]
  76. Sørensen, B.F.; Lading, L.; Sendrup, P. Fundamentals for Remote Structural Health Monitoring of Wind Turbine Blades—A Pre-Project; Risoe National Lab.: Roskilde, Denmark, May 2002. [Google Scholar]
  77. Mishnaevsky, L.; Branner, K.; Petersen, H.N.; Beauson, J.; McGugan, M.; Sørensen, B.F. Materials for wind turbine blades: An overview. Materials 2017, 10, 1285. [Google Scholar] [CrossRef] [Green Version]
  78. Elkmann, N.; Felsch, T.; Förster, T. Robot for rotor blade inspection. In Proceedings of the 2010 1st International Conference on Applied Robotics for the Power Industry, Montreal, QC, Canada, 5–7 October 2010. [Google Scholar]
  79. Martin, R.W.; Sabato, A.; Schoenberg, A.; Giles, R.H.; Niezrecki, C. Comparison of nondestructive testing techniques for the inspection of wind turbine blades’ spar caps. Wind. Energy 2018, 21, 980–996. [Google Scholar] [CrossRef]
  80. Meinlschmidt, P.; Aderhold, J. Thermographic inspection of rotor blades. In Proceedings of the 9th European Conference on NDT, Berlin, Germany, 25–29 September 2006. [Google Scholar]
  81. Li, X.l.; Sun, J.; Tao, N.; Feng, L.; Shen, J.l.; He, Y.; Zhang, C.; Zhao, Y.j. An effective method to inspect adhesive quality of wind turbine blades using transmission thermography. J. Nondestruct. Eval. 2018, 37, 1–11. [Google Scholar] [CrossRef]
  82. Fauteux, L.; Jolin, N. Drone Solutions for Wind Turbine Inspections; Technical Report; Nergica: Gaspe, QC, Canada, December 2018. [Google Scholar]
  83. Poleo, K.K.; Crowther, W.J.; Barnes, M. Estimating the impact of drone-based inspection on the Levelised Cost of electricity for offshore wind farms. Results Eng. 2021, 9, 100201. [Google Scholar] [CrossRef]
  84. Murphy, J.T.; Mishra, D.; Silliman, G.R.; Kumar, V.P.; Mandayam, S.T.; Sharma, P. Method and System for Wind Turbine Inspection. US Patent App. 13/021,056, 8 May 2012. [Google Scholar]
  85. Pedersen, H. Internal Inspection of a Wind Turbine. European Patent EP3287367A1, 28 February 2018. [Google Scholar]
  86. Denhof, D.; Staar, B.; Lütjen, M.; Freitag, M. Automatic optical surface inspection of wind turbine rotor blades using convolutional neural networks. Procedia CIRP 2019, 81, 1166–1170. [Google Scholar] [CrossRef]
  87. Ellenberg, A.; Kontsos, A.; Bartoli, I.; Pradhan, A. Masonry crack detection application of an unmanned aerial vehicle. Comput. Civ. Build. Eng. 2014, 2014, 1788–1795. [Google Scholar]
  88. Phung, M.D.; Dinh, T.H.; Hoang, V.T.; Ha, Q.P. Automatic crack detection in built infrastructure using unmanned aerial vehicles. In Proceedings of the 34th International Symposium on Automation and Robotics in Construction (ISARC), Taipei, Taiwan, 28 June– July 2017; pp. 823–829. [Google Scholar] [CrossRef] [Green Version]
  89. Kim, J.W.; Kim, S.B.; Park, J.C.; Nam, J.W. Development of Crack Detection System with Unmanned Aerial Vehicles and Digital Image Processing. Adv. Struct. Eng. Mech. (ASEM15) 2015, 33, 1–11. [Google Scholar]
  90. Lee, E.J.; Shin, S.Y.; Ko, B.C.; Chang, C. Early sinkhole detection using a drone-based thermal camera and image processing. Infrared Phys. Technol. 2016, 78, 223–232. [Google Scholar] [CrossRef]
  91. Ge, J.; Luo, Y.; Tei, G. Real-time pedestrian detection and tracking at nighttime for driver-assistance systems. IEEE Trans. Intell. Transp. Syst. 2009, 10, 283–298. [Google Scholar]
  92. Shakmak, B.; Al-Habaibeh, A. Detection of water leakage in buried pipes using infrared technology; A comparative study of using high and low resolution infrared cameras for evaluating distant remote detection. In Proceedings of the 2015 IEEE Jordan Conference on Applied Electrical Engineering and Computing Technologies, AEECT 2015, Amman, Jordan, 3–5 November 2015; pp. 1–7. [Google Scholar] [CrossRef] [Green Version]
  93. Valente, J.; Roldán, J.J.; Garzón, M.; Barrientos, A. Towards Airborne Thermography via Low-Cost Thermopile Infrared Sensors. Drones 2019, 3, 30. [Google Scholar] [CrossRef] [Green Version]
  94. Wiggenhauser, H. Active IR-applications in civil engineering. Infrared Phys. Technol. 2002, 43, 233–238. [Google Scholar] [CrossRef]
  95. Wild, W. Application of infrared thermography in civil engineering. Proc. Est. Acad. Sci. Eng. 2007, 13, 436–444. [Google Scholar]
  96. De Dios, J.M.; Ollero, A.; Ferruz, J. Infrared inspection of buildings using autonomous helicopters. IFAC Proc. Vol. 2006, 39, 602–607. [Google Scholar] [CrossRef]
  97. Rocha, J.; Santos, C.; Póvoas, Y. Evaluation of the infrared thermography technique for capillarity moisture detection in buildings. Procedia Struct. Integr. 2018, 11, 107–113. [Google Scholar] [CrossRef]
  98. Ortiz-Sanz, J.; Gil-Docampo, M.; Arza-García, M.; Cañas-Guerrero, I. IR Thermography from UAVs to Monitor Thermal Anomalies in the Envelopes of Traditional Wine Cellars: Field Test. Remote Sens. 2019, 11, 1424. [Google Scholar] [CrossRef]
  99. Ficapal, A.; Mutis, I. Framework for the detection, diagnosis, and evaluation of thermal bridges using infrared thermography and unmanned aerial vehicles. Buildings 2019, 9, 179. [Google Scholar] [CrossRef] [Green Version]
  100. Entrop, A.; Vasenev, A. Infrared drones in the construction industry: Designing a protocol for building thermography procedures. Energy Procedia 2017, 132, 63–68. [Google Scholar] [CrossRef]
  101. Wang, C.; Peng, Y.; Cho, Y.; Li, H. As-built residential building information collection and modeling methods for energy analysis. In Proceedings of the 28th International Symposium on Automation and Robotics in Construction (ISARC), Seoul, Korea, 29 June–2 July 2011; pp. 227–232. [Google Scholar]
  102. Duane, C.B. Close-range camera calibration. Photogramm. Eng 1971, 37, 855–866. [Google Scholar]
  103. González-Aguilera, D.; Lagueela, S.; Rodriguez-Gonzálvez, P.; Hernández-López, D. Image-based thermographic modeling for assessing energy efficiency of buildings façades. Energy Build. 2013, 65, 29–36. [Google Scholar] [CrossRef]
  104. Morel, J.M.; Yu, G. ASIFT: A new framework for fully affine invariant image comparison. SIAM J. Imaging Sci. 2009, 2, 438–469. [Google Scholar] [CrossRef]
  105. Lin, W.; Yoda, T. Bridge Engineering: Classifications, Design Loading, and Analysis Methods; Butterworth-Heinemann: Oxford, UK, 2017. [Google Scholar]
  106. Murao, S.; Nomura, Y.; Furuta, H.; Kim, C.W. Concrete crack detection using UAV and deep learning. In Proceedings of the 13th International Conference on Applications of Statistics and Probability in Civil Engineering, ICASP 2019, Seoul, Korea, 26–60 May 2019. [Google Scholar]
  107. Hubbard, B.; Hubbard, S. Unmanned Aircraft Systems (UAS) for Bridge Inspection Safety. Drones 2020, 4, 40. [Google Scholar] [CrossRef]
  108. Seo, J.; Duque, L.; Wacker, J. Drone-enabled bridge inspection methodology and application. Autom. Constr. 2018, 94, 112–126. [Google Scholar] [CrossRef]
  109. Duque, L.; Seo, J.; Wacker, J. Timber Bridge Inspection Using UAV. In Proceedings of the Structures Congress 2018: Bridges, Transportation Structures, and Nonbuilding Structures-Selected Papers from the Structures Congress, Fort Worth, TX, USA, 19–21 April 2018; pp. 186–196. [Google Scholar] [CrossRef]
  110. Chan, B.; Guan, H.; Jo, J.; Blumenstein, M. Towards UAV-based bridge inspection systems: A review and an application perspective. Struct. Monit. Maint. 2015, 2, 283–300. [Google Scholar] [CrossRef]
  111. Gucunski, N.; Council, N.R. Nondestructive Testing to Identify Concrete Bridge Deck Deterioration; Transportation Research Board of The National Academies: Washington, DC, USA, 2013. [Google Scholar]
  112. Cheng, C.; Shang, Z.; Shen, Z. Automatic delamination segmentation for bridge deck based on encoder-decoder deep learning through UAV-based thermography. NDT E Int. 2020, 116, 102341. [Google Scholar] [CrossRef]
  113. General Secretariat of the Council (Council of the European Union). 2021. Available online: http://aei.pitt.edu/56818/1/ttr-2014-17.pdf (accessed on 28 April 2021).
  114. Pinto, L.R.; Vale, A.; Brouwer, Y.; Borbinha, J.; Corisco, J.; Ventura, R.; Silva, A.M.; Mourato, A.; Marques, G.; Romanets, Y.; et al. Radiological Scouting, Monitoring and Inspection Using Drones. Sensors 2021, 21, 3143. [Google Scholar] [CrossRef] [PubMed]
  115. Boudergui, K.; Carrel, F.; Domenech, T.; Guenard, N.; Poli, J.P.; Ravet, A.; Schoepff, V.; Woo, R. Development of a drone equipped with optimized sensors for nuclear and radiological risk characterization. In Proceedings of the 2011 2nd International Conference on Advancements in Nuclear Instrumentation, Measurement Methods and their Applications, Ghent, Belgium, 6–9 June 2011; pp. 1–9. [Google Scholar]
  116. Brunelli, D.; Pino, F.; Fontana, C.L.; Pancheri, L.; Moretto, S. DRAGoN: Drone for Radiation detection of Gammas and Neutrons. In Proceedings of the 2020 IEEE Sensors, Rotterdam, The Netherlands, 25–28 October 2020; pp. 1–4. [Google Scholar]
  117. Aleotti, J.; Micconi, G.; Caselli, S.; Benassi, G.; Zambelli, N.; Bettelli, M.; Zappettini, A. Detection of nuclear sources by UAV teleoperation using a visuo-haptic augmented reality interface. Sensors 2017, 17, 2234. [Google Scholar] [CrossRef] [Green Version]
  118. Okuyama, S.i.; Torii, T.; Suzuki, A.; Shibuya, M.; Miyazaki, N. A remote radiation monitoring system using an autonomous unmanned helicopter for nuclear emergencies. J. Nucl. Sci. Technol. 2008, 45, 414–416. [Google Scholar] [CrossRef] [Green Version]
  119. Martin, P.G.; Payton, O.D.; Fardoulis, J.S.; Richards, D.A.; Scott, T.B. The use of unmanned aerial systems for the mapping of legacy uranium mines. J. Environ. Radioact. 2015, 143, 135–140. [Google Scholar] [CrossRef] [Green Version]
  120. Sanada, Y.; Torii, T. Aerial radiation monitoring around the Fukushima Dai-ichi nuclear power plant using an unmanned helicopter. J. Environ. Radioact. 2015, 139, 294–299. [Google Scholar] [CrossRef]
  121. Morgenthal, G.; Hallermann, N. Quality assessment of Unmanned Aerial Vehicle (UAV) based visual inspection of structures. Adv. Struct. Eng. 2014, 17, 289–302. [Google Scholar] [CrossRef]
  122. Laefer, D.F.; Gannon, J.; Deely, E. Reliability of crack detection methods for baseline condition assessments. J. Infrastruct. Syst. 2010, 16, 129–137. [Google Scholar] [CrossRef]
  123. Fujino, Y. Issues and prospects of sensing and monitoring technology. Railw. Res. Rev. (RRR) 2013, 70, 4–9. [Google Scholar]
  124. Ogawa, S.; Kameda, K.; Sato, H.; Mita, A. Research on Practical Application of Structural Health Monitoring-Construction of Infrastructure System Including Data Model; Japan Earthquake Engineering Association: Tokyo, Japan, 2009; Volume 9. [Google Scholar]
  125. Europe, S.P. Global Market Outlook for Solar Power 2015–2019; Euoropean Photovoltaic Industry Association: Bruxelles, Belgium, 2015. [Google Scholar]
  126. Canada, T.; Group, P. National Highway System. 2011. Available online: https://www.tc.gc.ca/eng/policy/acg-acgd-menu-highways-2149.htm (accessed on 11 May 2021).
  127. Libra, M.; Daneček, M.; Lešetický, J.; Poulek, V.; Sedláček, J.; Beránek, V. Monitoring of defects of a photovoltaic power plant using a drone. Energies 2019, 12, 795. [Google Scholar] [CrossRef] [Green Version]
  128. Jones, H.G.; Serraj, R.; Loveys, B.R.; Xiong, L.; Wheaton, A.; Price, A.H. Thermal infrared imaging of crop canopies for the remote diagnosis and quantification of plant responses to water stress in the field. Funct. Plant Biol. 2009, 36, 978. [Google Scholar] [CrossRef] [PubMed] [Green Version]
  129. López-Fernández, L.; Lagüela, S.; Picón, I.; González-Aguilera, D. Large scale automatic analysis and classification of roof surfaces for the installation of solar panels using a multi-sensor aerial platform. Remote Sens. 2015, 7, 11226–11248. [Google Scholar] [CrossRef] [Green Version]
  130. Sato, Y.; Ozawa, S.; Terasaka, Y.; Kaburagi, M.; Tanifuji, Y.; Kawabata, K.; Miyamura, H.N.; Izumi, R.; Suzuki, T.; Torii, T. Remote radiation imaging system using a compact gamma-ray imager mounted on a multicopter drone. J. Nucl. Sci. Technol. 2018, 55, 90–96. [Google Scholar] [CrossRef]
  131. Ashour, R.; Taha, T.; Mohamed, F.; Hableel, E.; Kheil, Y.A.; Elsalamouny, M.; Kadadha, M.; Rangan, K.; Dias, J.; Seneviratne, L.; et al. Site inspection drone: A solution for inspecting and regulating construction sites. In Proceedings of the 2016 IEEE 59th International Midwest Symposium on Circuits and Systems (MWSCAS), Dhabi, United Arab Emirates, 16–19 October 2016; pp. 1–4. [Google Scholar]
  132. Kruglova, T.; Sayfeddine, D.; Vitaliy, K. Robotic laser inspection of airplane wings using quadrotor. Procedia Eng. 2015, 129, 245–251. [Google Scholar] [CrossRef] [Green Version]
  133. Sappington, R.N.; Acosta, G.A.; Hassanalian, M.; Lee, K.; Morelli, R. Drone stations in airports for runway and airplane inspection using image processing techniques. In Proceedings of the AIAA Aviation 2019 Forum, Dallas, TX, USA, 17–21 June 2019; p. 3316. [Google Scholar]
  134. Colantonio, A.; McIntosh, G. The differences between large buildings and residential infrared thermographic inspections is like night and day. In Proceedings of the 11th Canadian Conference on Building Science and Technology, London, ON, Canada, 6–8 November 2007; p. 13. [Google Scholar]
  135. Lizarazo, I.; Angulo, V.; Rodríguez, J. Automatic mapping of land surface elevation changes from UAV-based imagery. Int. J. Remote Sens. 2017, 38, 2603–2622. [Google Scholar] [CrossRef]
  136. Kim, D.; Youn, J.; Kim, C. Automatic fault recognition of photovoltaic modules based on statistical analysis of UAV thermography. Int. Arch. Photogramm. Remote. Sens. Spat. Inf. Sci. 2017, 42, 179. [Google Scholar] [CrossRef] [Green Version]
  137. Volkmann, W.; Barnes, G. Virtual Surveying: Mapping and Modeling Cadastral Boundaries Using Unmanned Aerial Systems (UAS) Virtual Surveying: Mapping and Modeling Cadastral Boundaries Using Unmanned Aerial Systems (UAS). In Proceedings of the FIG Congress 2014: Engaging the Challenges-Enhancing the Relevance, Kuala Lumpur, Malaysia, 17–19 June 2014; pp. 1–8. [Google Scholar]
  138. Lagüela, S.; D’iaz, L.; Roca, D.; Lorenzo, H. Aerial thermography from low-cost UAV for the generation of thermographic digital terrain models. Opto-Electron. Rev. 2015, 23, 78–84. [Google Scholar] [CrossRef] [Green Version]
  139. Roca, D.; Lagüela, S.; Díaz-Vilariño, L.; Armesto, J.; Arias, P. Low-cost aerial unit for outdoor inspection of building façades. Autom. Constr. 2013, 36, 128–135. [Google Scholar] [CrossRef]
  140. Fox, M.; Coley, D.; Goodhew, S.; De Wilde, P. Thermography methodologies for detecting energy related building defects. Renew. Sustain. Energy Rev. 2014, 40, 296–310. [Google Scholar] [CrossRef] [Green Version]
  141. Barreira, E.; de Freitas, V.P. Evaluation of building materials using infrared thermography. Constr. Build. Mater. 2007, 21, 218–224. [Google Scholar] [CrossRef]
  142. Bay, H.; Tuytelaars, T.; Van Gool, L. Surf: Speeded up robust features. In European Conference on Computer Vision; Springer: Berlin/Heidelberg, Germany, 2006; pp. 404–417. [Google Scholar]
  143. Jakubović, A.; Velagić, J. Image Feature Matching and Object Detection Using Brute-Force Matchers. In Proceedings of the 2018 International Symposium ELMAR, Zadar, Croatia, 16–19 September 2018; pp. 83–86. [Google Scholar]
  144. Nooralishahi, P.; Deane, S.; Lopez, F.; Ibarra-Castanedo, C.; Avdelidis, N.P.; Maldague, X. Reflectivity detection and reduction of thermographic images using image stitching technique and its applications on remote inspection. In Proceedings of the Thermosense: Thermal Infrared Applications XLII. International Society for Optics and Photonics, Bellingham, WA, USA, 17 June 2020; Volume 11409, p. 114090U. [Google Scholar]
  145. Shraeyas. Shraeyas/Drone-Image-Stitching. 2019. Available online: https://github.com/Shraeyas/Drone-Image-Stitching (accessed on 11 May 2021).
  146. SenseFly. Solar Panel Installation Dataset. 2019. Available online: https://www.sensefly.com/education/datasets/?dataset=1416 (accessed on 11 May 2021).
  147. Spannbauer, A. Python Video Stabilization with OpenCV. Available online: https://adamspannbauer.github.io/python_video_stab/html/index.html (accessed on 11 May 2021).
  148. Grundmann, M.; Kwatra, V.; Essa, I. Auto-directed video stabilization with robust l1 optimal camera paths. Proceedings of IEEE Computer Vision and Pattern Recognition, Colorado Springs, CO, USA, 20 June 2011; pp. 225–232. [Google Scholar]
  149. Neph, R. Offline Optimization-Based Video Stabilization. 2019. Available online: https://ryanneph.netlify.app/experience/video-stabilization (accessed on 11 May 2021).
  150. Nooralishahi, P.; López, F.; Maldague, X. A Drone-Enabled Approach for Gas Leak Detection Using Optical Flow Analysis. Appl. Sci. 2021, 11, 1412. [Google Scholar] [CrossRef]
  151. Milovanović, B.; Gaši, M.; Gumbarević, S. Principal Component Thermography for Defect Detection in Concrete. Sensors 2020, 20, 3891. [Google Scholar] [CrossRef]
  152. Maldague, X.; Galmiche, F.; Ziadi, A. Advances in pulsed phase thermography. Infrared Phys. Technol. 2002, 43, 175–181. [Google Scholar] [CrossRef] [Green Version]
  153. Deane, S.; Avdelidis, N.P.; Ibarra-Castanedo, C.; Zhang, H.; Nezhad, H.Y.; Williamson, A.A.; Mackley, T.; Davis, M.J.; Maldague, X.; Tsourdos, A. Application of NDT thermographic imaging of aerospace structures. Infrared Phys. Technol. 2019, 97, 456–466. [Google Scholar] [CrossRef] [Green Version]
Figure 1. Categories of drone adopted from [13].
Drones 05 00106 g001
Figure 2. Applications of aerial inspection based on recent publications.
Drones 05 00106 g002
Figure 3. The activities that can help to ensure drone inspection safety [107].
Drones 05 00106 g003
Figure 4. General view of required steps for image stitching.
Drones 05 00106 g004
Figure 5. Result of the image stitching algorithm.
Drones 05 00106 g005
Figure 6. The left column demonstrates the stitched image created by applying the maximum function. The right photo shows the reflection map generated by the algorithm and the threshold set to 50%, and the middle photo shows the reference map used for evaluation. The top row images are from the first experiment containing images from a lake, which does not have any motion blurriness or unexpected camera movement. The bottom row images belong to the third experiment containing images with motion blurriness and lots of vibration.
Drones 05 00106 g006
Figure 7. The sample of camera motion paths for the four scenarios. The figure is adopted from our paper [150].
Drones 05 00106 g007
Figure 8. The processing time for stabilizing one frame in seconds (from [150]).
Drones 05 00106 g008
Figure 9. Result of wing inspection using drones.
Drones 05 00106 g009
Figure 10. (A) DJI M210 equipped with a thermal camera, (B) The view of setup and experimental site, (C) comparison of temperature responses to flash heating in the case of large uniform irradiation with a fixed camera and a stabilized camera with UAV at two distances (2 and 6 m).
Drones 05 00106 g010
Table 1. UAS categories based on U.S. Army Road map for UAS 2010–2035 [14].
CategorySizeMG /TW (lbs.)NOA § (ft.)Airspeed (Knots)
Group 1Small0–20<1200 AGL *<100
Group 2Medium21–55<3500 AGL<250
Group 3Large<1320<18,000 MSL **<250
Group 4Larger>1320<18,000 MSLAny airspeed
Group 5Largest>1320>18,000 MSLAny airspeed
MG: Maximum Gross, TW: Takeoff Weight; § NOA: Normal Operating Altitude; * AGL: Above Ground Level; ** MSL: Mean Sea Level; Note: If the UAV has even one characteristic of the next level, it is classified at that level.
Table 2. Categorization of drones based on their weight [12].
GroupWeight
Super heavy2000 kg < W
Heavy200 kg < W 2000 kg
Medium50 kg < W 200 kg
Light5 kg < W 50 kg
Micro W 5 kg
Table 3. Classification of drones based on their weight and wing span [13].
GroupWing SpanWeight
Smart Dusts1 mm < L 0.25 cm0.005 g < W 0.5 g
Pico-Air Vehicles0.25 cm < L 2.5 cm0.5 g < W 3 g
Nano-Air Vehicles2.5 cm < L 15 cm3 g < W 50 g
Micro-Air Vehicles15 cm < L 1 m50 g < W 2 kg
μ UAV1 m < L 2 m2 kg < W 5 kg
UAV2 m < L 61 m5 kg < W 15,000 kg
Table 4. Details of SenseFly industrial estate dataset.
Ground ResolutionRGB: 2 cm/pix, Thermal: 11 cm/pix
Coverage7.5 ha, (17.3 acres)
Flight height84 m, (275.4 ft)
Number of imagesRGB: 277 images, Thermal: 277 images
Table 5. The result of comparison between candidate methods (from [150]).
MetricsOriginalAVSL1-OPPC-RFOPC
Scenario #1PSNR * (min–max)70.94–110.8371.27–106.269.16–107.3665.09–111.9572.88–110.33
ITF **74.3674.8773.7680.1576.32
ISI 0.5320.5440.5040.7260.568
AvSpeed 0.19280.200.2150.3560.1526
Scenario #2PSNR (min–max)58.23–78.9758.65–85.8258.21–82.9258.65–69.76
ITF61.8362.3063.1763.16
ISI0.4270.520.640.56
AvSpeed1.5591.050.5650.41
Scenario #3PSNR (min–max)69.96–63.9965.02–88.8563.22–132.4665.40–87.40
ITF66.7470.2480.871.27
ISI0.1590.4020.60.14
AvSpeed1.060.58140.3860.621
Scenario #4PSNR (min–max)58.43–68.563.46–71.5659–69.6559.46–91.8262.24–248.9
ITF64.4766.7264.5668.6381.91
ISI0.11210.240.12200.27180.1281
AvSpeed4.922.23561.61962.4011.60
* PSNR: higher value indicates higher system accuracy. ** ITF: the higher shows smoother camera motions (perfect stabilization results infinity value). ISI: higher value shows higher similarity between frames. AvSpeed: the lower value shows more perceptual similarity.
Publisher’s Note: MDPI stays neutral with regard to jurisdictional claims in published maps and institutional affiliations.

