Article

Wireless Communications for Data Security: Efficiency Assessment of Cybersecurity Industry—A Promising Application for UAVs

1
Department of Industrial Engineering and Management, National Kaohsiung University of Science and Technology, Kaohsiung 80778, Taiwan
2
Thu Dau Mot University, Thu Dau Mot 75000, Vietnam
3
Industrial University of Ho Chi Minh City, Ho Chi Minh 70000, Vietnam
*
Authors to whom correspondence should be addressed.
Submission received: 31 October 2022 / Revised: 16 November 2022 / Accepted: 17 November 2022 / Published: 19 November 2022
(This article belongs to the Special Issue Cooperation of Drones and Other Manned/Unmanned Systems)

Abstract

:
The design of cooperative applications combining several unmanned aerial and aquatic vehicles is now possible thanks to the considerable advancements in wireless communication technology and the low production costs for small, unmanned vehicles. For example, the information delivered over the air instead of inside an optical fiber causes it to be far simpler for an eavesdropper to intercept and improperly change the information. This article thoroughly analyzes the cybersecurity industry’s efficiency in addressing the rapidly expanding requirement to incorporate compelling security features into wireless communication systems. In this research, we used a combination of DEA window analysis with the Malmquist index approach to assess the efficiency of the cybersecurity industry. We used input and output factors utilizing financial data from 2017–2020 sources from a US market. It was found that U1—Synopsys and U9—Fortinet exhibited the best performances when relating Malmquist and DEA window analysis. By evaluating ten big companies in the cybersecurity industry, we indicate that U2—Palo Alto Networks and U6—BlackBerry Ltd. companies needed significant improvements and that four other companies were generally more efficient. The findings of this study provide decision-makers a clear image and it will be the first study to evaluate and predict the performance of cyber security organizations, providing a valuable reference for future research.

1. Introduction

Cybersecurity prevents data loss and theft. Due to poor cloud service installation and more sophisticated cybercriminals, your organization may be targeted for a cyberattack [1,2,3,4] or data leak. The COVID-19 pandemic contributed to our society’s increasing reliance on technology. The coronavirus pandemic shut down industries in many countries. Offices, businesses, and schools must now operate online. Higher internet demand leads to more cybercrime. Social media sites freely discuss identity theft. Social Security numbers, credit card numbers, and bank account information are stored in Dropbox and Google Drive. Combine this with cloud services, weak cloud service security, cellphones, and IoT [5,6,7,8] and you have plenty of new security concerns that did not exist a few decades ago. Assailants target cloud services’ scalability, efficiency, and cost reductions. Misconfigured cloud settings cause data breaches, unauthorized access, insecure interfaces, and account hijacking. Businesses must defend themselves from cloud dangers because the average data breach costs USD 3.86 million. We are forgetting security risks and vulnerabilities resulting from using traditional security solutions over the wireless [9] channel. Similar issues to wireless transmissions are raised by powerline communication channels, which also extend serious privacy issues for most applications that use this medium.
Drones, known as Unmanned Aerial Vehicles (UAVs), are becoming increasingly popular for personal, commercial, and military domains. Wireless communications for drones are essential because they allow drones to operate without being tethered to a ground-based control system [10]. This means that the drone can be flown in a broader range of environments and can be controlled more easily. Wireless communications also allow more data to be transmitted to and from the drone, which is essential for its operation [11,12]. The escalating use of drones or the protest against them presents strict security and safety problems, demanding data protection and cyber security. Drones are controlled via a remote interface, which means hackers could access the drone’s camera and other sensors if the drone is hacked. Attackers could also take control of the drone itself, which could pose a severe safety hazard. To protect users and prevent malicious activities, data security and cyber security are essential to UAVs’ management [13].
The global cyber security market will be worth USD 153.16 billion in 2020. COVID-19 has had a unique and tremendous worldwide impact, with IT security demand dropping slightly in all countries. The global market grew 7.6% in 2020 compared to 2017–2019. The market is predicted to grow at a 12.0% compound annual growth rate (CAGR) from 2021 to 2028, from USD 165.78 billion to 366.10 billion. This market will rebound to pre-pandemic levels after the pandemic is over, boosting CAGR. With investments from Germany, France, India, Spain, South Korea, Italy, Canada, Qatar, and others, the demand for AI [2,5,14] and cloud security [4,15,16] solutions should expand. Manufacturing, banking, financial services [17], insurance (BFSI), and healthcare will drive future market growth.
Cybersecurity firms use machine learning, IoT [5,18,19,20,21], cloud computing, and big data in their corporate security departments. This implementation would help players understand unknown trials and hazards. As the IoT market grows, more security applications use IoT solutions. Internet security technology is one of the fastest-growing market trends and big data and cloud technology help firms discover and evaluate risks. Cloud computing is also helping the market grow. Cisco Systems, IBM, and others focus on cloud-based internet security. These cloud computing services employ the Analytics-as-a-Service (AaaS) platform to identify and mitigate threats swiftly. In the study, we evaluated the solutions and services supplied by the ten most significant cybersecurity industry participants using the data envelopment analysis (DEA) model, including the DEA Malmquist [7,22,23,24] and [25,26,27,28,29] DEA Window Analysis, from 2017 to 2020.
This study combines two Data Envelopment Analysis (DEA) models to analyze ten cybersecurity organizations’ performance efficiency in the past years (2017–2020). We ranked the most outstanding cybersecurity companies using DEA Window Analysis and the Malmquist Model. We also offer managerial suggestions for improving operational efficiency at ten cybersecurity organizations. The rest of this article is organized as follows. Section 2 discusses study methods, focusing on DEA Window Analysis and DEA Malmquist Model approaches. In Section 3, we discuss the empirical research and analysis of findings. The final section summarizes the study’s main points, identifies its limits, and offers recommendations for further investigation.

2. Literature Review and Research Procedure

Data envelopment analysis (DEA) was developed as a set of approaches for measuring the relative effectiveness of a group of decision-making units (DMUs) when price data for inputs and outputs are either lacking or ambiguous [30]. These approaches are nonparametric, relying solely on visual input-output information. Traditional DEA models almost entirely ignore the data set’s statistical aspects, causing them to be far from nonparametric. Since its introduction, several DEA models have been created and widely used to assess performance in various industries and organizations, including transportation, mining, logistics, finance, and many more.

2.1. DEA Malmquist Model

Based on the DEA, the Malmquist productivity index evaluates productivity change over time and may be broken down into two parts: one that measures technical progress and the other that measures the frontier shift. The current study adds to the DEA-based Malmquist approach by examining these two Malmquist components [31] in greater depth.
The DEA-based Malmquist productivity index is used in many applications. For example, regarding productivity changes in Swedish hospitals (Färe et al., 1994b) [32] and the provision of Swedish eye-care services (Löthgren and Tambour, 1999a) [33], Caves et al. (1982) [34] established the Malmquist productivity change index, which has become an essential part of the DEA toolset. Even though Caves, Christensen, and Diewert (CCD) proposed distance functions as a theoretical index, these distance functions have proven to be beneficial empirical instruments. The productivity of small and large enterprises in the automobile sector in France, Italy, and Spain during the pre-crisis (2001–2008) and post-crisis (2009–2014) eras is examined in M.Agostino et al.’s research (2022).
Since he was working with consumer-based indexes, Malmquist (1953), the original paper to which CCD referred and named their proposed productivity index, defined a quantity index as ratios of distances/distance functions in which observations were evaluated relative to an indifference curve. In the spirit of Malmquist’s consumer quantity index, CCD used the technology frontier instead of the indifference curve to define a productivity index. The output isoquant was employed as the reference in the CCD definition of the output-oriented Malmquist productivity index. The data under evaluation were projected using an output distance function. Similarly, for the input-based Malmquist productivity index, they picked an input isoquant as a reference. If and only if the data belong to the respective isoquants, the corresponding distance functions have a value of unity.
The Malmquist productivity index has two primary surveys: Tone, 2004 [35], is aimed toward Operations Research (OR) professionals, whereas Färe et al., 2008, are more interested in economists. Following Tone, 2004 [29], we seek a medium ground here and center our explanation on the Operation Research (OR) audience while maintaining financial references. We will include recent work on dynamic Malmquist productivity indices, endogenous technical Change, and extensions based on other distance function specifications such as directional distance functions in our assessment of this topic.
The Malmquist productivity index comprises two parts that measure the shift in the technological frontier and technical efficiency. In this study, we dig deeper into the two components to uncover the origins and patterns of productivity change that the Malmquist index’s aggregated form obscures. It is demonstrated that the separate Malmquist components can provide more information. Our proposed new technique not only detects the strategy shifts of individual DMUs in each period but also reveals patterns of productivity change and provides a fresh interpretation along with the managerial implications of each Malmquist component. We can determine whether such strategy shifts are advantageous and promising and alterations in isoquant characterize the “strategy shift” here [36]. When describing a “strategy shift” choice, technical, and allocative efficiency considerations should be considered when the price information is available.

2.2. DEA Window Analysis Model

In the window variation, the methodology will be briefly explained (Charnes et al., 1989) [37]. Much research has utilized the DEA window analysis method to analyze efficiency over several fields from time to time. Bian and Yang (2010) [38] assessed the efficiency of resources and the environment as a whole using some existing DEA models. The abovementioned algorithms can examine a DMU’s environmental and energy efficiency simultaneously. Yang and Chang (2009) [39] developed “a two-stage range-adjusted model” to assess whether the utilization of various energy sources is inefficient and congested [39]. This model was used with DEA window analysis to investigate the case throughout the period. Řepková (2015) analyzed data from Czech commercial banks using the DEA window analysis method [40]. She looked at the effectiveness of the Czech banking industry from 2003 to 2012 and measured it using the DEA window analysis method, which is based on a model that prioritizes inputs. Hunjet et al. (2015) [41] used DEA Window Analysis to investigate the relative dynamic efficiency of twelve Croatian towns in six years from 2004 to 2009. The towns’ dynamic relative efficiency is shown and examined using computational results. The influence of sector reorganization on the effectiveness of twenty one Croatian state-owned energy distribution facilities was investigated by Zaja et al. (2017) [42]. For the first stage of DEA, the operating costs were used as the input in a BCC model that also included total power sales, consumers, and network length as outputs. Each year, the relative efficiency of the power distribution centers was evaluated using pooled data from 2005 to 2013. The efficiency scores were regressed on contextual variables in the second stage to quantify their effects on performance ratings and documentation of roughly 2.8 percent yearly productivity gains following the regulatory adjustments.
Although numerous studies have used the DEA model, there are specific gaps in the papers cited above, according to the author’s literature review. There are even no articles addressing cybersecurity employing the DEA method. By combining the DEA Window analysis with the Malmquist Productivity Index in a hybrid approach, this article may be a dynamic assessment that provides us more insights into the efficiency changes in the cybersecurity market. This article will examine the cybersecurity efficiency of ten companies, which will be considered as ten different decision-making units addressing the period from 2017 to 2020.

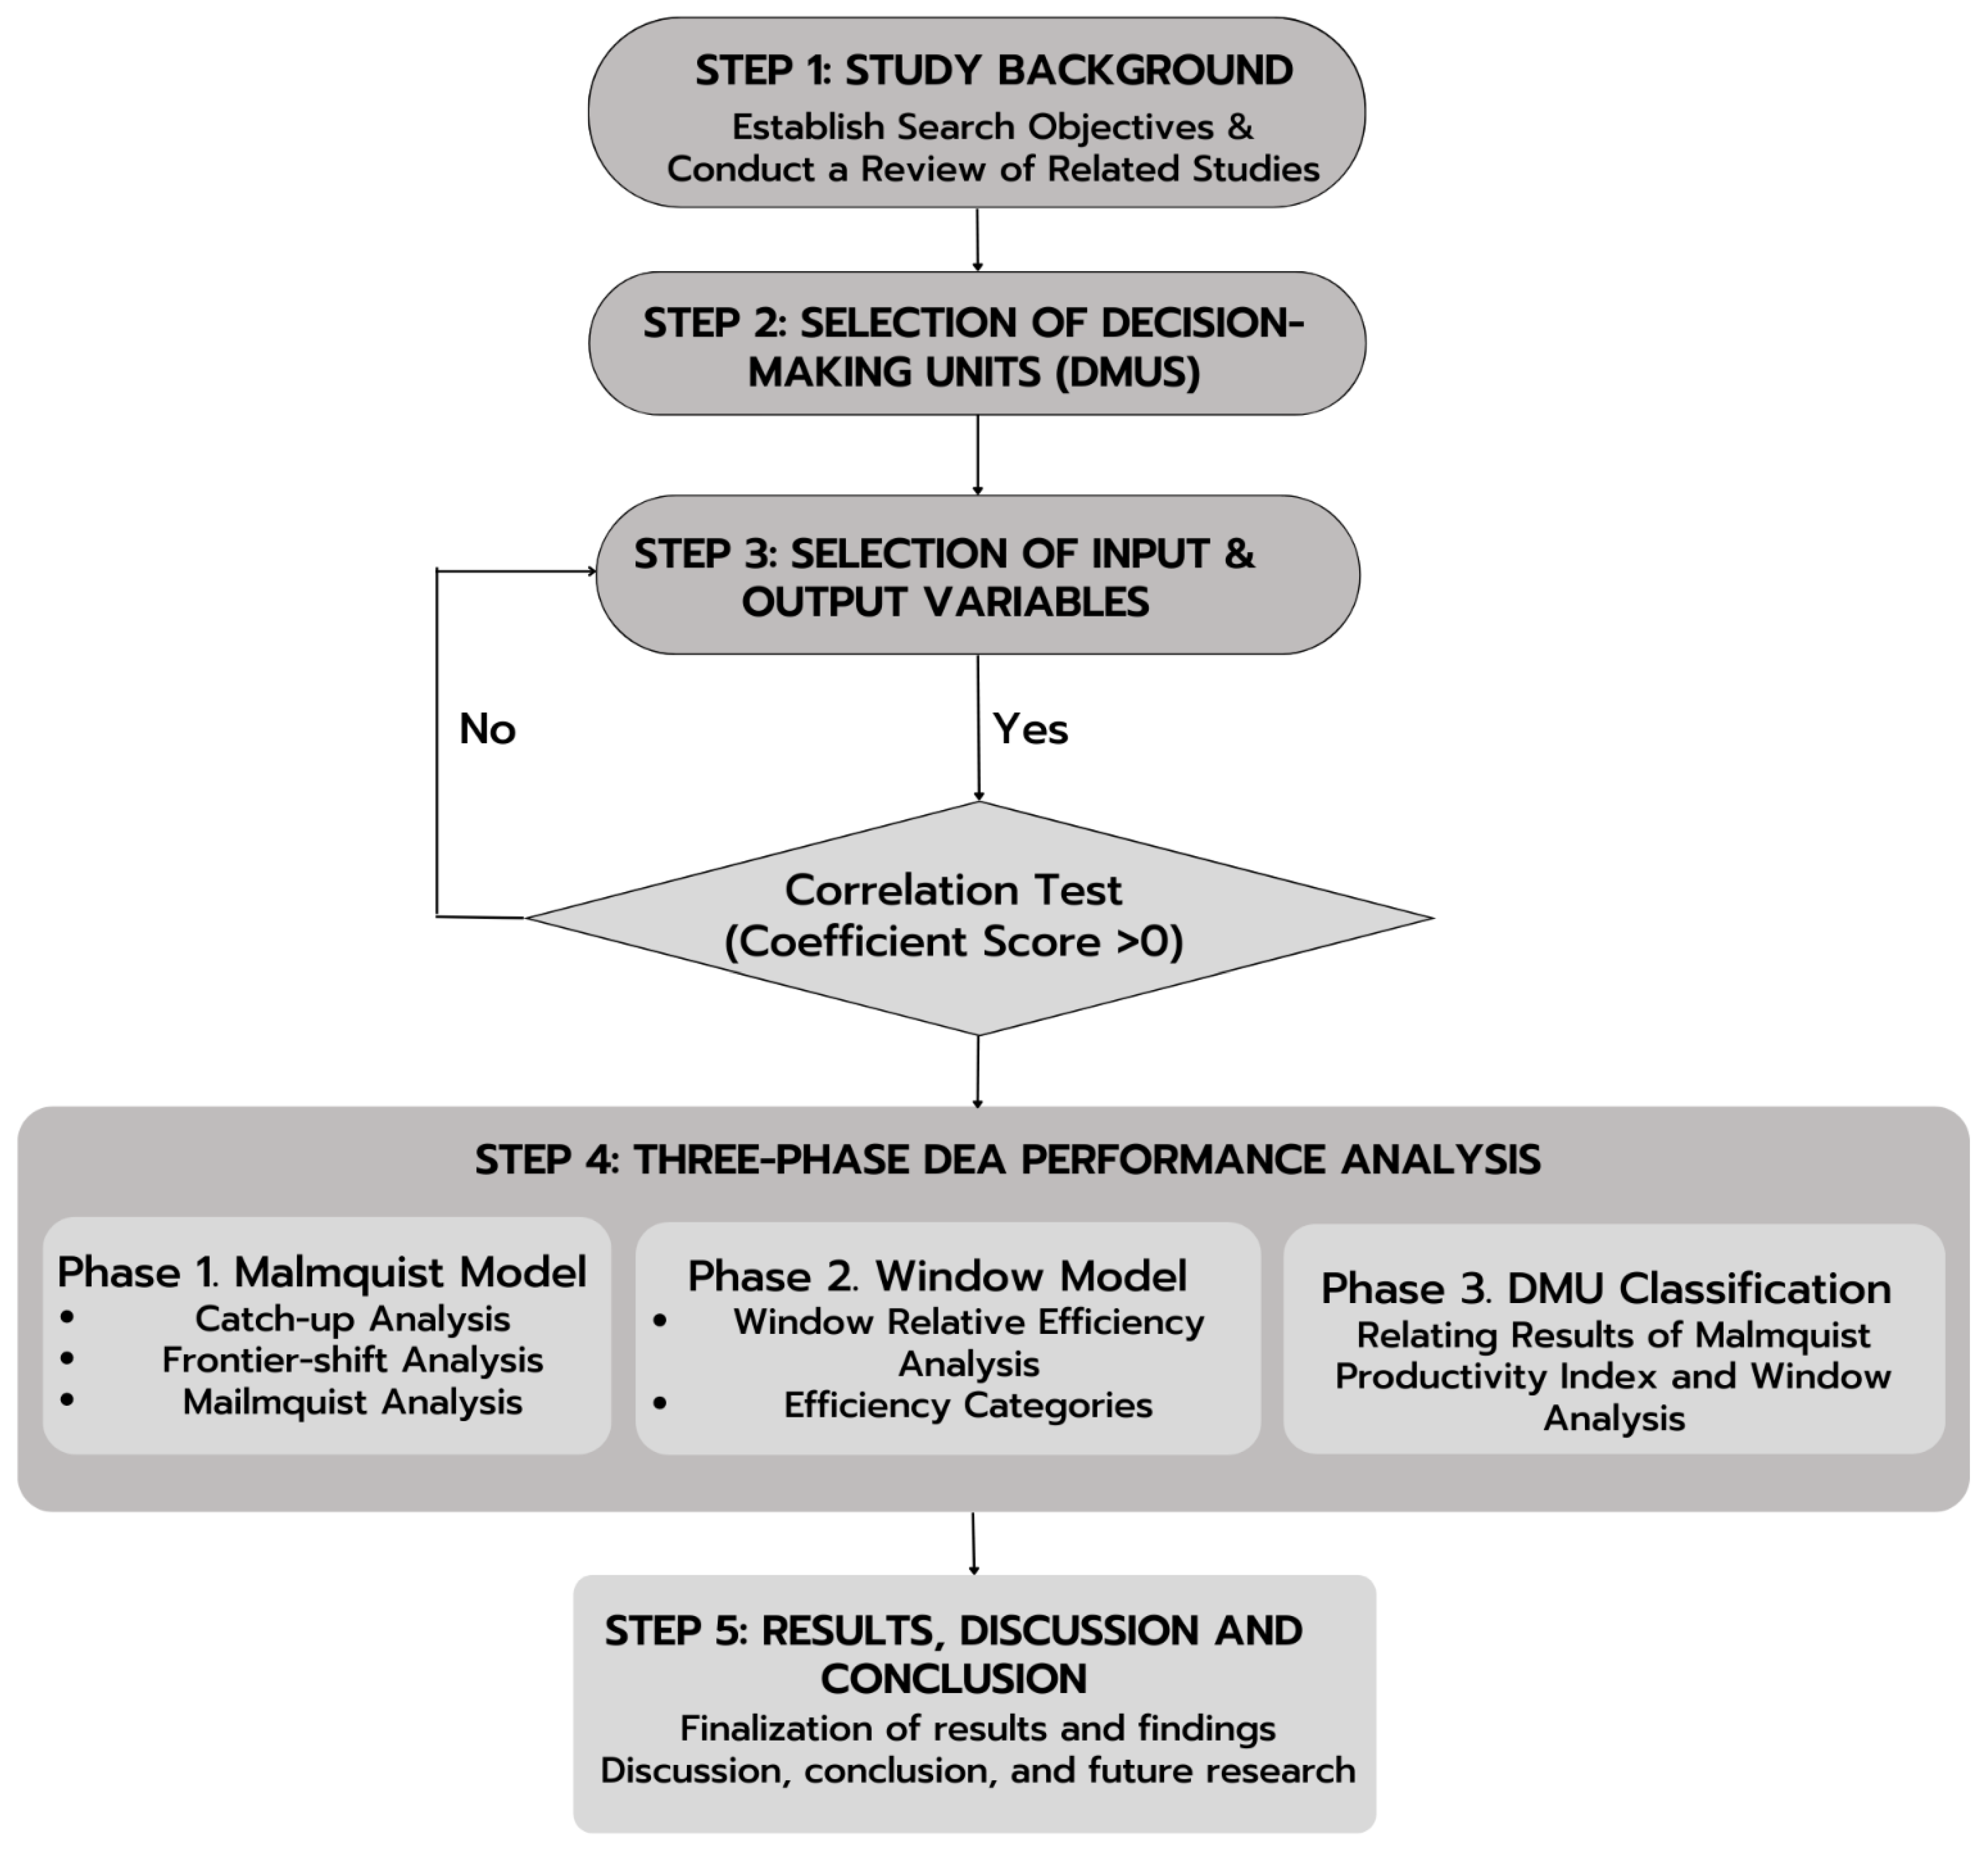
2.3. Research Procedure

Implementing the three-phase DEA performance analysis, which will be used to evaluate the performance efficiency of ten cybersecurity companies worldwide, is the most crucial aspect of this research. The research technique will be broken down into four parts, as shown in Figure 1.
We summarize the findings of a study that looked at the performance and ranking of all DMUS from 2017 to 2020. Then, we generate suggestions for underperforming units to improve their performance based on the DEA Malmquist and DEA Window Analysis findings. The following part will then explain the empirical results and outcomes.

3. Research Results and Discussion

The top ten cybersecurity companies were selected by market share. All the information was found in the companies’ annual reports, which are published annually. Total assets, liabilities (L), operating costs (OE), revenue ®, and gross profit (GP) were collected during data collection (GP). J. Zhu’s DEA definitions separate these data into input and output. Golany and Roll (1989) [43] suggested a “rule of thumb” for inputs, results, and DMUs. This regulation required twice as many DMUs as inputs and outputs. The number of DMUs is appropriate because it matches the study’s purpose of using from four to five outputs and inputs. This regulation does not limit the number of DMUs. The number of DMUs and the total number of output and input are correlated according to the law. The limitation on the number of inputs and outputs is also intended to limit the number of DMUs. The list of ten selected DMUs is shown in Table 1 as follows:

3.1. Selection of Input and Output Variables

The identification of specific input and output variables, as well as the deployment of DEA for efficiency assessments, is a time-consuming process. Because of the complexity of the DEA approach, the input and output elements chosen will have a significant impact on the outcomes. The author can ignore any technique that determines the correct number of variables if they have performed enough research on the benefits of the factors. Additionally, there is no defined rule for selecting variables in the present. According to previous studies, the input components primarily studied are indicators of financial aspects that organizations should balance or manage, but the output factors are signs that must be improved. Depending on the list of previously used inputs and outputs and the applicability of financial metrics, we choose to use three input elements factors (assets, liabilities, operating expenses) and two output factors (revenue, gross profit) in the analytical approach used in the proposed model as shown in Table 2. These index systems are used to assess the operational efficiency.
Five financial factors are used to evaluate a company’s performance. Commercial enterprises need asset management, capital control, production cost regulation, and increasing earnings and income. The study’s focus on cybersecurity efficiency is tied to their financial performance. This research’s first component focuses on finances. For the DEA to calculate efficiency, the author used output factors that rise inexorably with input factors. The isotonicity criteria are satisfied; otherwise, the components would be re-evaluated or deleted. The author chose these variables for the research.

3.2. Data Envelopment Analysis (DEA)-Malmquist Model

Before estimating the DEA efficiencies, we must calculate the correlation of input and output data. We will utilize a Pearson’s correlation test. The Pearson coefficient measures the linear relationship between two variables in empirical research and Auguste Bravais is credited with publishing Karl Pearson’s 1844 approach. Each correlation score represents a linear scale dependency between two components or data sets. A positive correlation indicates two variables increase or decline together, a nonlinear or zero correlation means no discernable relationship, and a negative correlation means one variable decrease while the other increases. The correlation coefficients are −1 to +1. When the correlation coefficient approaches +/−1, two groups form a linear relationship. The following Equation (1) is used to calculate a Pearson’s correlation coefficient:
r x y = i = 1 n ( x i x ¯ ) ( y i y ¯ ) i = 1 n ( x i x ¯ ) 2 i = 1 n ( y i y ¯ ) 2
  • DEA-Malmquist Model
The MPI’s primary purpose is to examine changes in the productivity performance of numerous DMUs over time, as measured by the product of Change in relative efficiency (catchup) and technological Change (frontier). The DMU’s extreme in terms of coping up to an increase or drop in efficiency performance is referred to as catchup efficiency. The term “frontier shift” refers to how DMUs can endure the advancement in the technical environment from one time to the next.
For a given D M U i The two periods in the DEA analysis are referred to as ( x i , y i ) for the first and ( x i 2 , y i 2 ) for the second. The frontier efficiency is t 2 : d t 2 = 1, 2 and t 2 = 1, 2 to assess the efficiency score D M U i   ( x i , y i ) t 1 . The following formulas (Equations (2)–(4)) will be used to calculate the relative efficiency change, which is the catchup index (CA), technological Change, frontier shift index (FR), and Malmquist Productivity Index (MPI):
C A = d 2 ( ( x i , y i ) ) 2 d 1 ( ( x i , y i ) ) 1
F R = [ d 1 ( ( x i , y i ) ) 1 d 2 ( ( x i , y i ) ) 1 x d 1 ( ( x i , y i ) ) 2 d 2 ( ( x i , y i ) ) 2 ] 1 2
M P I = [ d 1 ( ( x i , y i ) 2 ) d 1 ( ( x i , y i ) 1 ) x d 2 ( ( x i , y i ) 2 ) d 2 ( ( x i , y i ) 1 ) ] 1 2
  • Definitions of each parameter:
Catchup Index (CA): Färe et al. (1994) break down a unit’s total productivity change into that attributable to the “shift” in the efficient border between periods t and t + 1 and that attributed to the unit’s efficiency “catchup”. As we move from period t to period t + 1, the catchup factor indicates the Change in the cross-sectional efficiency of an operating unit. The boundary shift term describes the shift in the efficient boundary from period t to period t + 1 in terms of how much (or less) input is required to maintain a specific output level under efficient operation.
Frontier shift Index (FR): Technological Change occurs because of advancements in R&D technology and talent, such as introducing new technology or new R&D processes and systems. As a result, the R&D best practice manufacturing frontier moves forward. It is critical to understand how distant one is from the R&D technological frontier at any given time and how rapidly one may approach the border regarding R&D equipment or process renewal and modernization. The R&D Technology Change is defined as a “boundary shift” in R&D technology and is calculated using a formula.
With a DEA-like nonparametric technique, the Malmquist Productivity Index (MPI) evaluates productivity changes over time and can be decomposed into improvements in efficiency and technology. The utilization of a contemporary version of the data and the time variations of technology in the study period is required for productivity breakdown into technological change and efficiency catchup. Using the observations at time t and t+, the MPI may be written in terms of distance function as Equation. In the nonparametric framework, it is calculated as the product of catchup (or recovery) and frontier shift (or innovation) components, both derived from DEA technology.
It is possible to determine if a DMU’s total productivity factor improves or deteriorates using the above methods. The catchup or frontier efficiency might cause an increase or loss in efficiency. We can see from the preceding calculations that the DMU’s total factor productivity (TFP) reflects relative and technological innovation efficiency advances or losses. CA, FR, and MPI values can be more than one, less than one, or equal to one, indicating whether the DMU is progressing, regressing, or showing no change between the two periods.
Table 3 explains the correlation coefficients in detail, where n is the sample size and x i , y i are the individual sample points associated with i.

3.3. DEA WINDOW Analysis Model

Another technique in DEA that will be used in this study is the nonparametric Window model. In this method, n will refer to the summation of observed units, which will be addressed as D M U n . Additionally, the input factor is m, while the output factor is s.
Incorporating with the time series element t, D M U n t , the input and output are generated into a vector of X n t and Y n t . Additionally, they are shown in Equations (5) and (6) below, respectively.
X n t = x n 1 t · · · x n m t
Y n t = y n 1 t · · · y n s t
A window may start at any given point k (1 ≤ kT) in time T and have a width w (1 ≤ wTk), every window kw will be represented by the input matrix X k w and output matrix Y k w as presented in Equations (7) and (8) below.
X k w = [ x 1 k x 1 k + 1 · · · x 1 k + w x 2 k x 2 k + 1 · · · x 2 k + w x n k x n k + 1 · · · x n k + w ]
Y k w = [ y 1 k y 1 k + 1 · · · y 1 k + w y 2 k y 2 k + 1 · · · y 2 k + w y n k y n k + 1 · · · y n k + w ]
The DEA Window analysis will proceed right after the substitution of the input and output to the D M U n t Equation.

4. Empirical Results

4.1. Data Used Performance Analysis

The result of cyber security companies from 2017 to 2020 are shown in Table 4. The necessary input and output variables data are obtained from the US Stock Exchange, where most financial records and yearly reports are publicly available. Millions of dollars are used as the mathematical unit. The column in which the negative value appeared will be adjusted appropriately so that the entire data set has values that meet the DEA’s isotonic and homogenous requirements. The values in tables are appropriate already. The calculated averages, minimum and maximum values, and standard deviation for each variable in each year are shown in the following table as essential descriptive statistics summaries of all the input and output data.

4.2. Pearson Correlation

Table 5 shows the calculated Pearson Correlation coefficient scores for 2017, 2018, 2019, and 2020 in chronological order. A positive relationship requires Pearson test coefficients to range from 0 to 1. The kind of parameters used as inputs and outputs significantly impact the research’s outcomes and the quantity of the variables is essential. Another factor to consider is that the required isotonicity in the relationship between the input and output variables must be met before any DEA models can be used. As previously stated, each increase in output variables must be accompanied by a rise in input variables. The study data must be validated using a correlation test to meet this criterion, determining whether the inputs and outputs are isotonic.

4.3. Results of the Malmquist Model

The Malmquist productivity index (MPI) was utilized to assess the performance of 10 DMUS in this study. It is calculated as the sum of efficiency gains (catchup index) and technological advancements (frontier shift index). The productivity grows over time (i.e., more output for the same or lower level of inputs) for any organization in the industry and they may increase in technical efficiency (i.e., catch up with their borders) or technological progress (i.e., the frontier is growing over time) or both. The original dataset from Morningstar.com for 2017–2020 is used as input for DEA-Malmquist. The findings are broken down into three categories: catchup, frontier shift, and Malmquist.

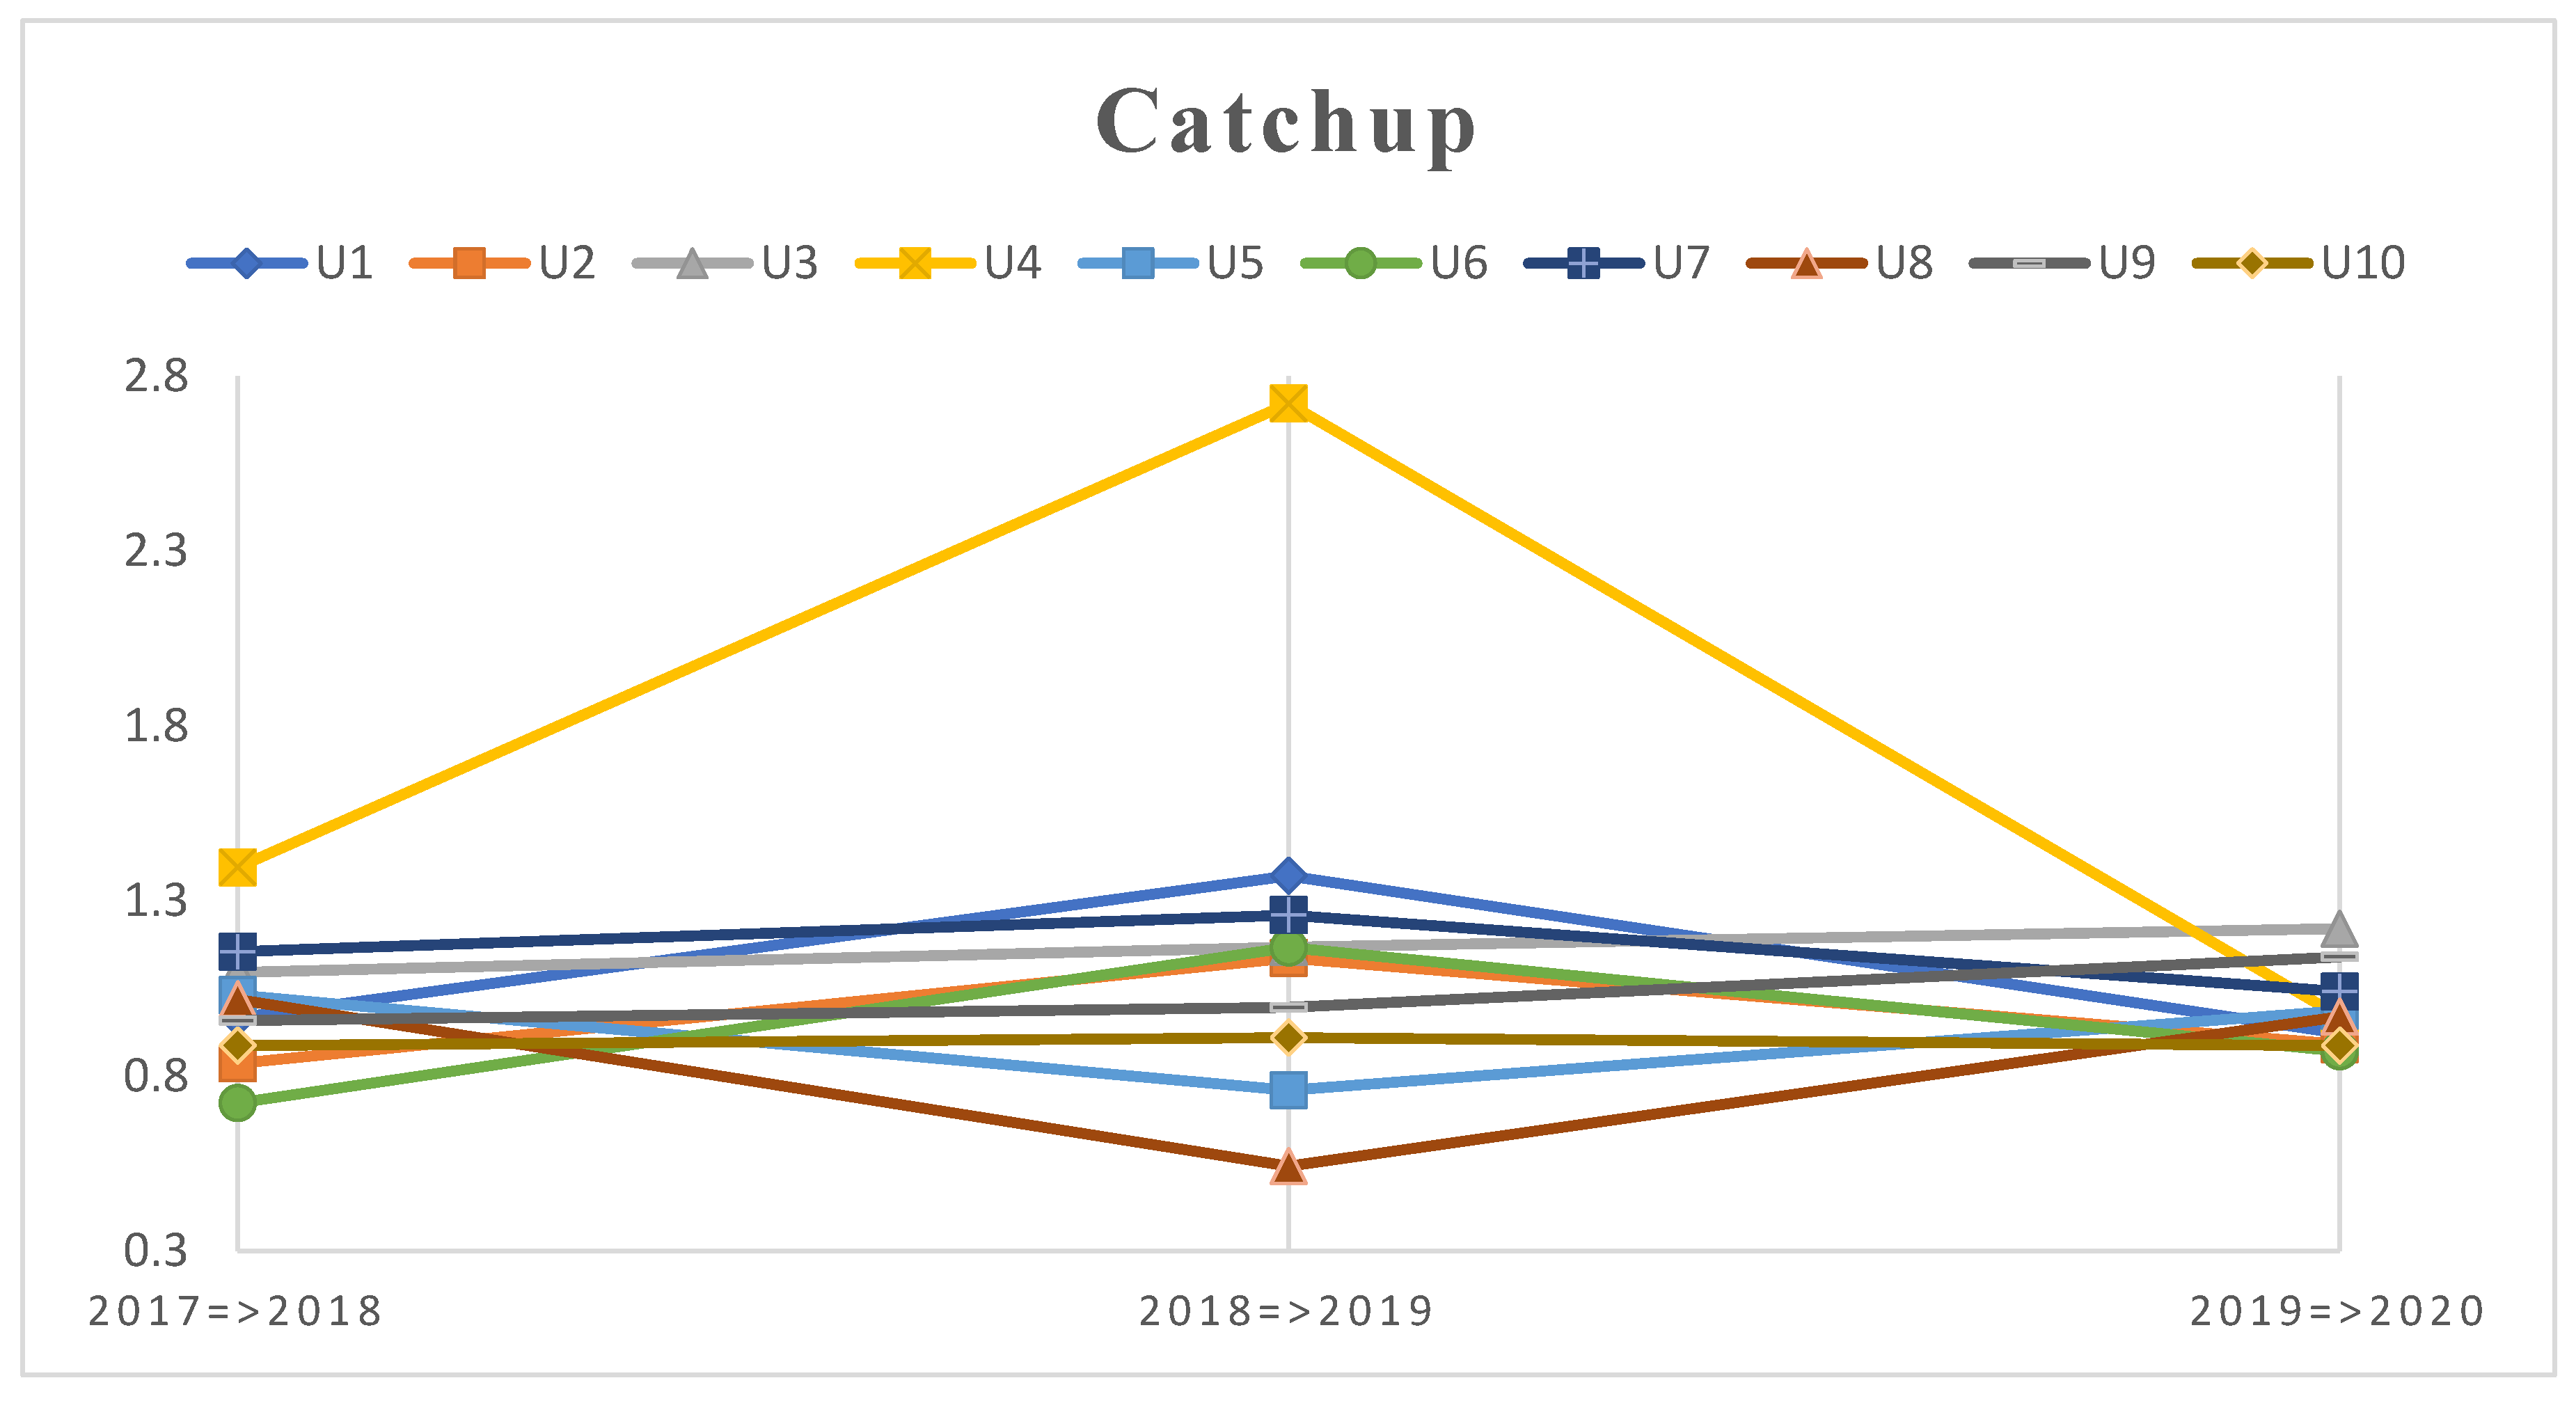
4.3.1. Technical Efficiency Change (Catch up Index—CA)

Because of its three components: improvements in relative efficiency, technological advancements, and productivity, the MPI is the most appropriate DEA model for evaluating performance. The catchup index is the first component, indicating the relative efficiency change between the two periods. The catchup index of each DMU can be seen in Table 6 for each period.
In 2017–2020, the Technical Efficiency Change (catchup index—CA) [7,36] was used to access developments in the technical field of cybersecurity organizations. It also represents the DMU’s efforts to improve efficiency. The performance assumptions for the catchup index are as follows: Index scores larger than one (>1) indicate progressive efficiency, whereas those less than one (<1) indicate non-progressive performance. The efficiency change (catchup) of the 10 DMUs from 2017 to 2020 is shown in Table 6 and Figure 2. In general, the technological effectiveness of all DMUS fluctuated during the 2017–2020 period. The average CA of all DMUs in this period is 1.0671. The best efficiency performance was U4 (Microsoft, Redmond, WC, USA) with CA = 1.6962, while the worst was U8 (CyberArk, Newton, MA, USA) with CA = 0.8441. Especially from 2017 to 2018, five of the ten DMUs met technical efficiency standards (average CA > 1). U4 (Microsoft) achieved the most, with CA = 1.3965. On the other hand, U6 (BlackBerry Ltd., Waterloo, ON, Canada) had the least effective technological capability with CA = 0.7234. The years 2018 and 2019 saw an increase in organizations’ technical improvements in efficiency compared to the years 2017 and 2018. Five of the 10 DMUs were technically efficient (average CA > 1). The most popular DMU, U4 (Microsoft, Redmond, WC, USA), exhibited incredible efficiency performance with CA = 2.7213. Meanwhile, U8 (CyberArk, Newton, MA, USA) had the least effective technological capability with CA = 0.5431.
Among those with scores below 1, the DMUs that showed low technical efficiency in 2017–2018 (namely, U1—Synopsys, U2—Palo Alto Networks, U6—Blackberry, U9—Fortinet, U—10 Jupiter), U1—Synopsys, U2—Palo Alto Networks, U6—Blackberry, and U9—Fortinet have been able to return to the progressive state with CA > 1 in the next period from 2018 to 2019 leaving U10—Jupiter Network below the 1.0 threshold. While some companies perform notable improvement in efficiency, the 2019–2020 period has seen a technical efficiency decrease in U5—IBM and U9—CyberArk (regressive with a score of 0.7599 and 0.5431).
In 2019–2020, only 3 out of 10 DMUS achieved technical efficiency (average CA > 1). U3 (Oracle) is the most achieved with CA = 1.2215. Additionally, U6 (BlackBerry Ltd., Waterloo, ON, Canada) had the least effective technological capability with CA = 0.8711. In particular, the remarkable improvement of U9 (Fortinet) must be included with the technical efficiency with CA = 1.1405. During the 2019–2020 year, the giant U4—Microsoft switched from being progressive to regressive, dropping dramatically from 2.7213 in 2018–2019 to 0.9868 in 2019–2020. The big players such as U4—Microsoft must watch out since the flexibility and adoption of new technology can provide huge advantages to smaller companies such as U9—Fortinet.
Most of the index scores for 2019–2020 are slightly above and below the 1.0 threshold. Due to a lack of planning, cybersecurity firms have been impacted by the pandemic and the global economic downturn. Companies with poor performance should focus on technological aspects to improve their market competitiveness. Developing internet security solutions based on artificial intelligence (Al) platforms is a top priority for key market companies [2,50,51,52].

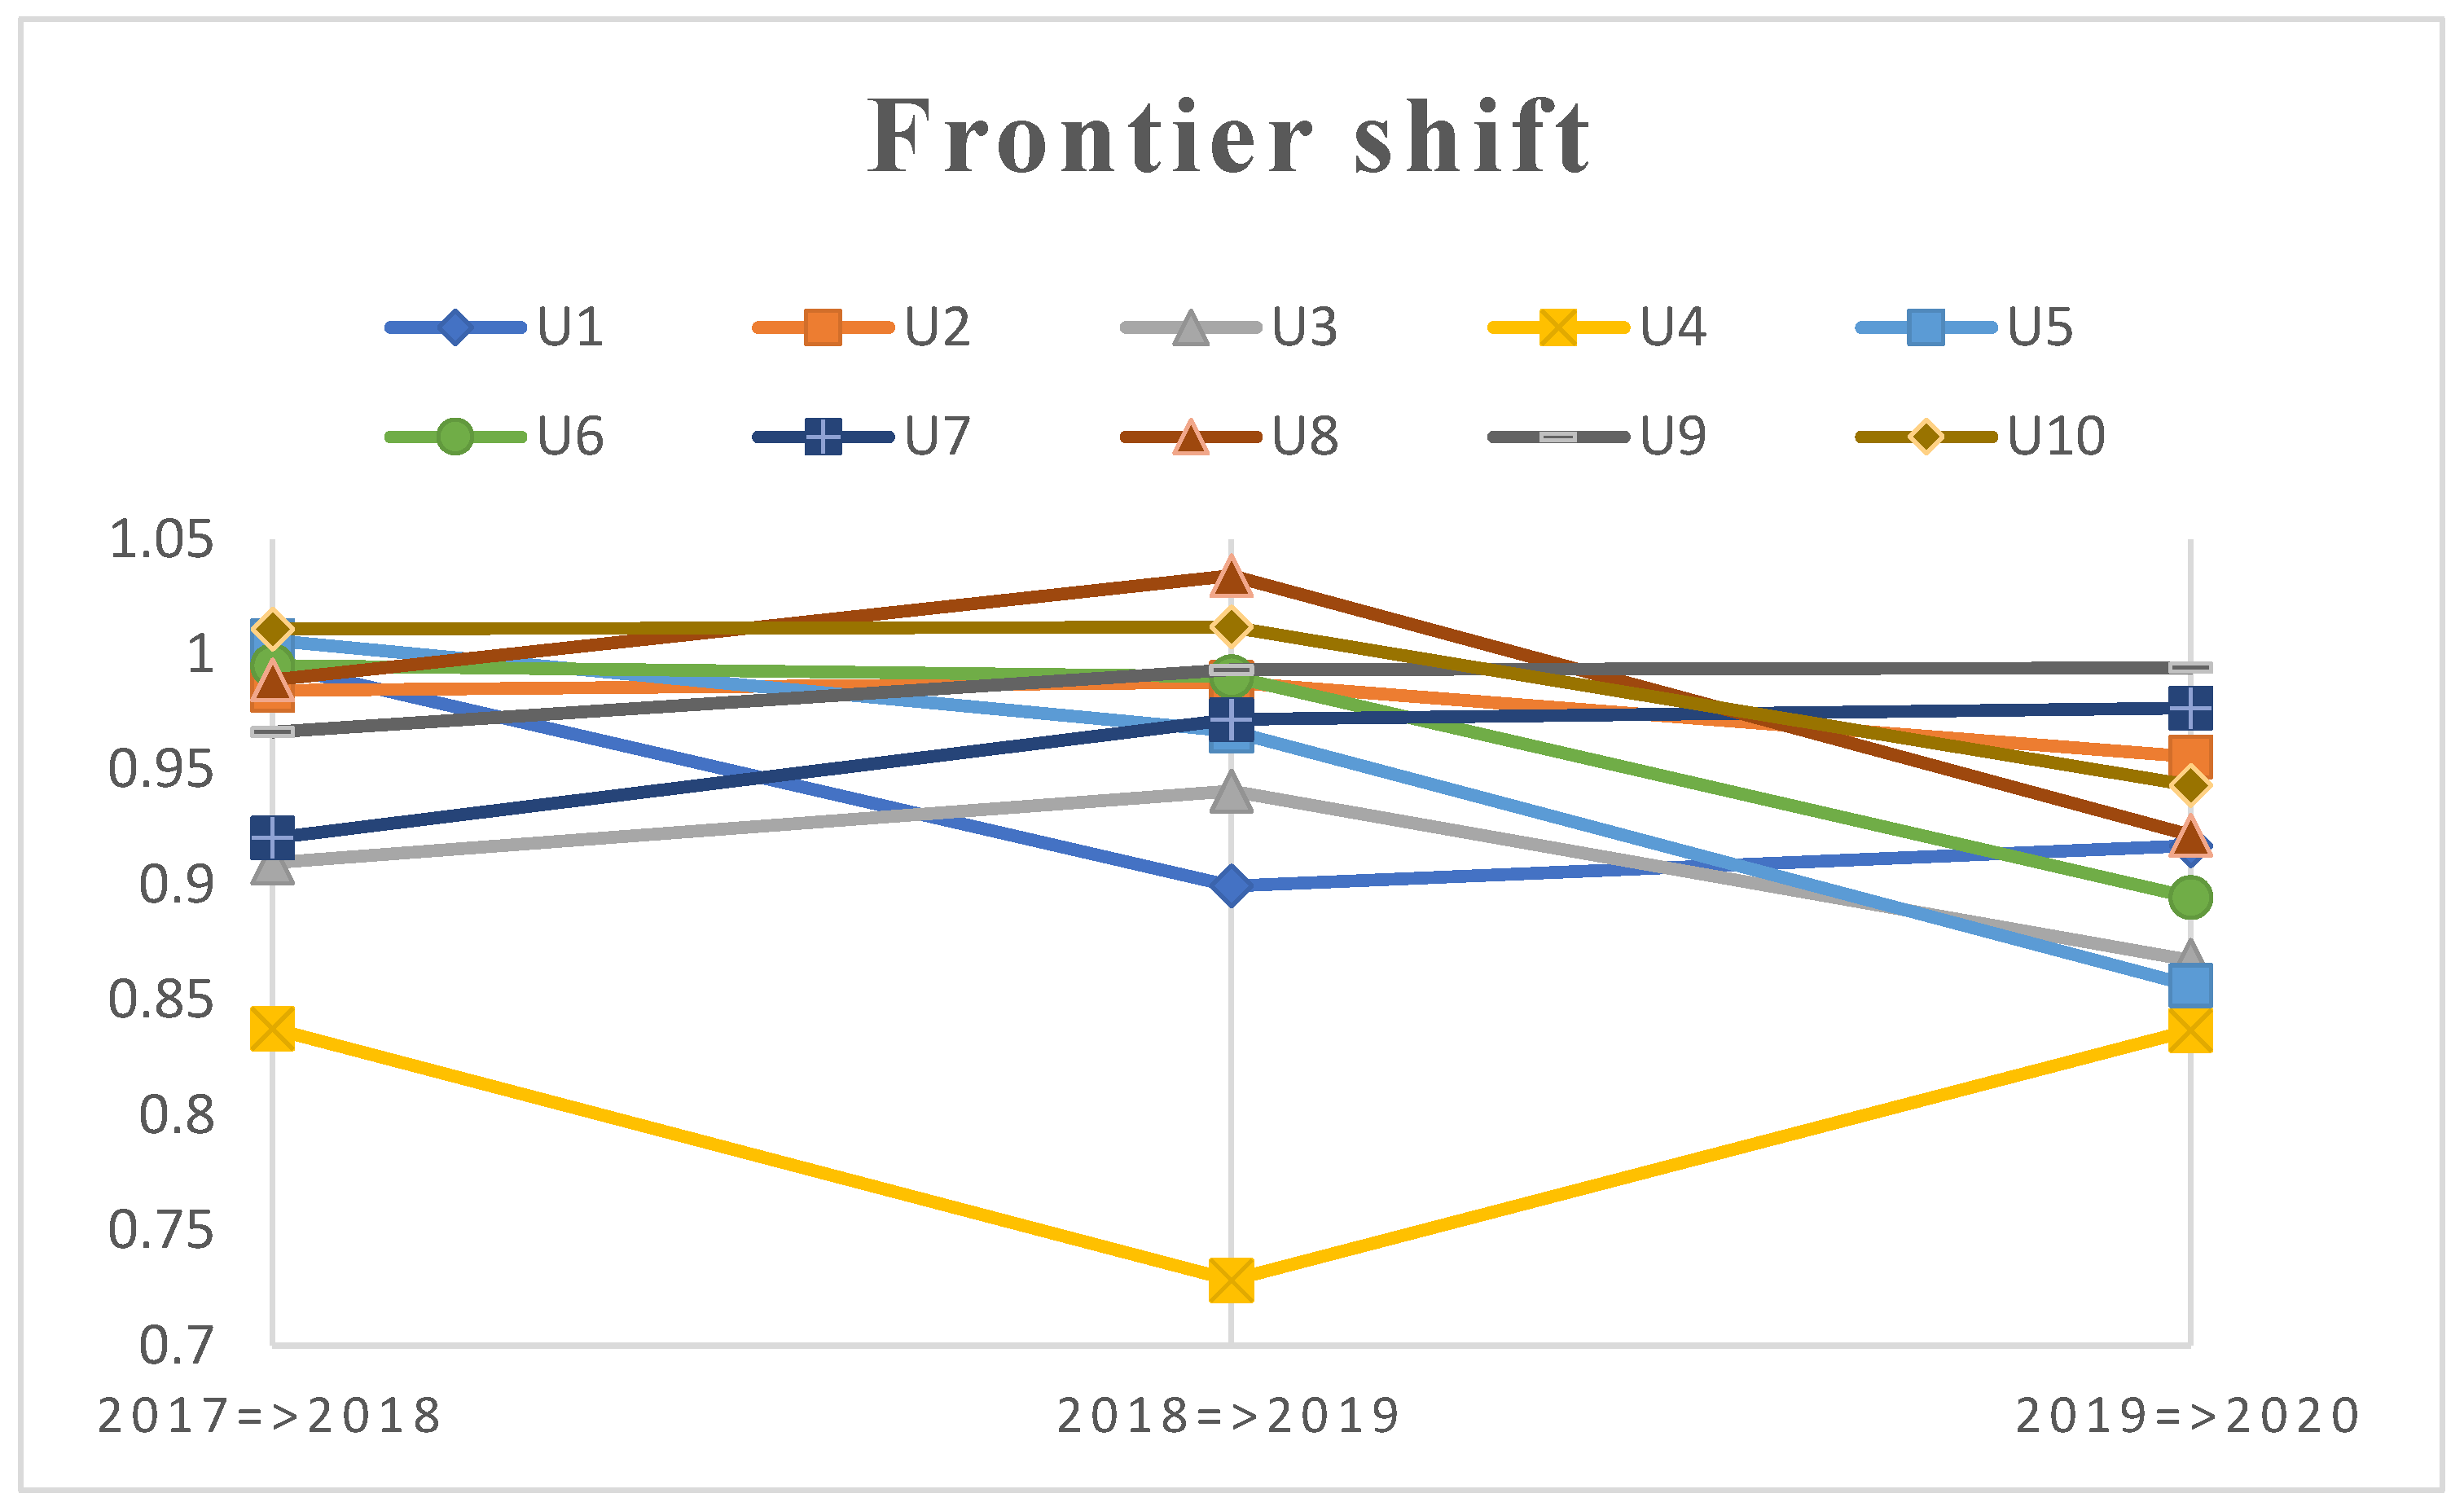
4.3.2. Technological Change (Frontier Shift Index—FR)

Table 7 index scores describe the DMU’s response to technical changes over two time periods and reveal how progressive or regressive a DMU is in the world of technological improvements in the cybersecurity business, which could be applied for many fields which were introduced in [47,48,49,50] and drones as well.
As seen in Table 7, the first period, from 2017 to 2018, has been very challenging for all the companies except for IBM and Jupiter Network, which progressively exhibited efficiency despite less technological Change. However, in the second period, from 2018 to 2019, IBM’s frontier shift index (FR) declined while the FR of CyberArk increased. In this period, most DMUs’ surges remained in the regress region (below the 1.0 threshold), with negative results. The results during this period imply that all the cybersecurity companies have not put enough effort into adapting to the changing technological environment.
Drone security technology has seen dramatic improvements between 2017 and 2020. In 2017, the focus was on improving drone detection and identification capabilities, which led to the developing of new sensors and better algorithms for analyzing data from those sensors [53]. In 2018, the focus shifted to improving intercepting drones; further tracking systems and better ways to disable drones were developed [54]. In 2019, the focus shifted to improving the ability to defend against drone attacks and this improvement led to the development of new countermeasures and better ways to protect against drones [55]. In 2020, the focus shifted to improving the ability to recover from an attack by drones, which is a severe push to increase new recovery protocols and better ways to repair damage from drones [13].
Figure 3 indicates that U1—Synopsys and U4—Microsoft show an inverted triangle. It means that Synopsys and Microsoft have gained a very intensive effort in applying high tech in this period compared to the previous period. Nevertheless, all DMUs could not maintain the progressive status in terms of technology when all the FR are lower than 1 and U4—Microsoft has the worst efficiency performance with FR = 0.8369. Therefore, companies need to put effort into a continuous investment, mainly in technological areas, to increase their efficiency to correspond with the expansion of the present cybersecurity industry.

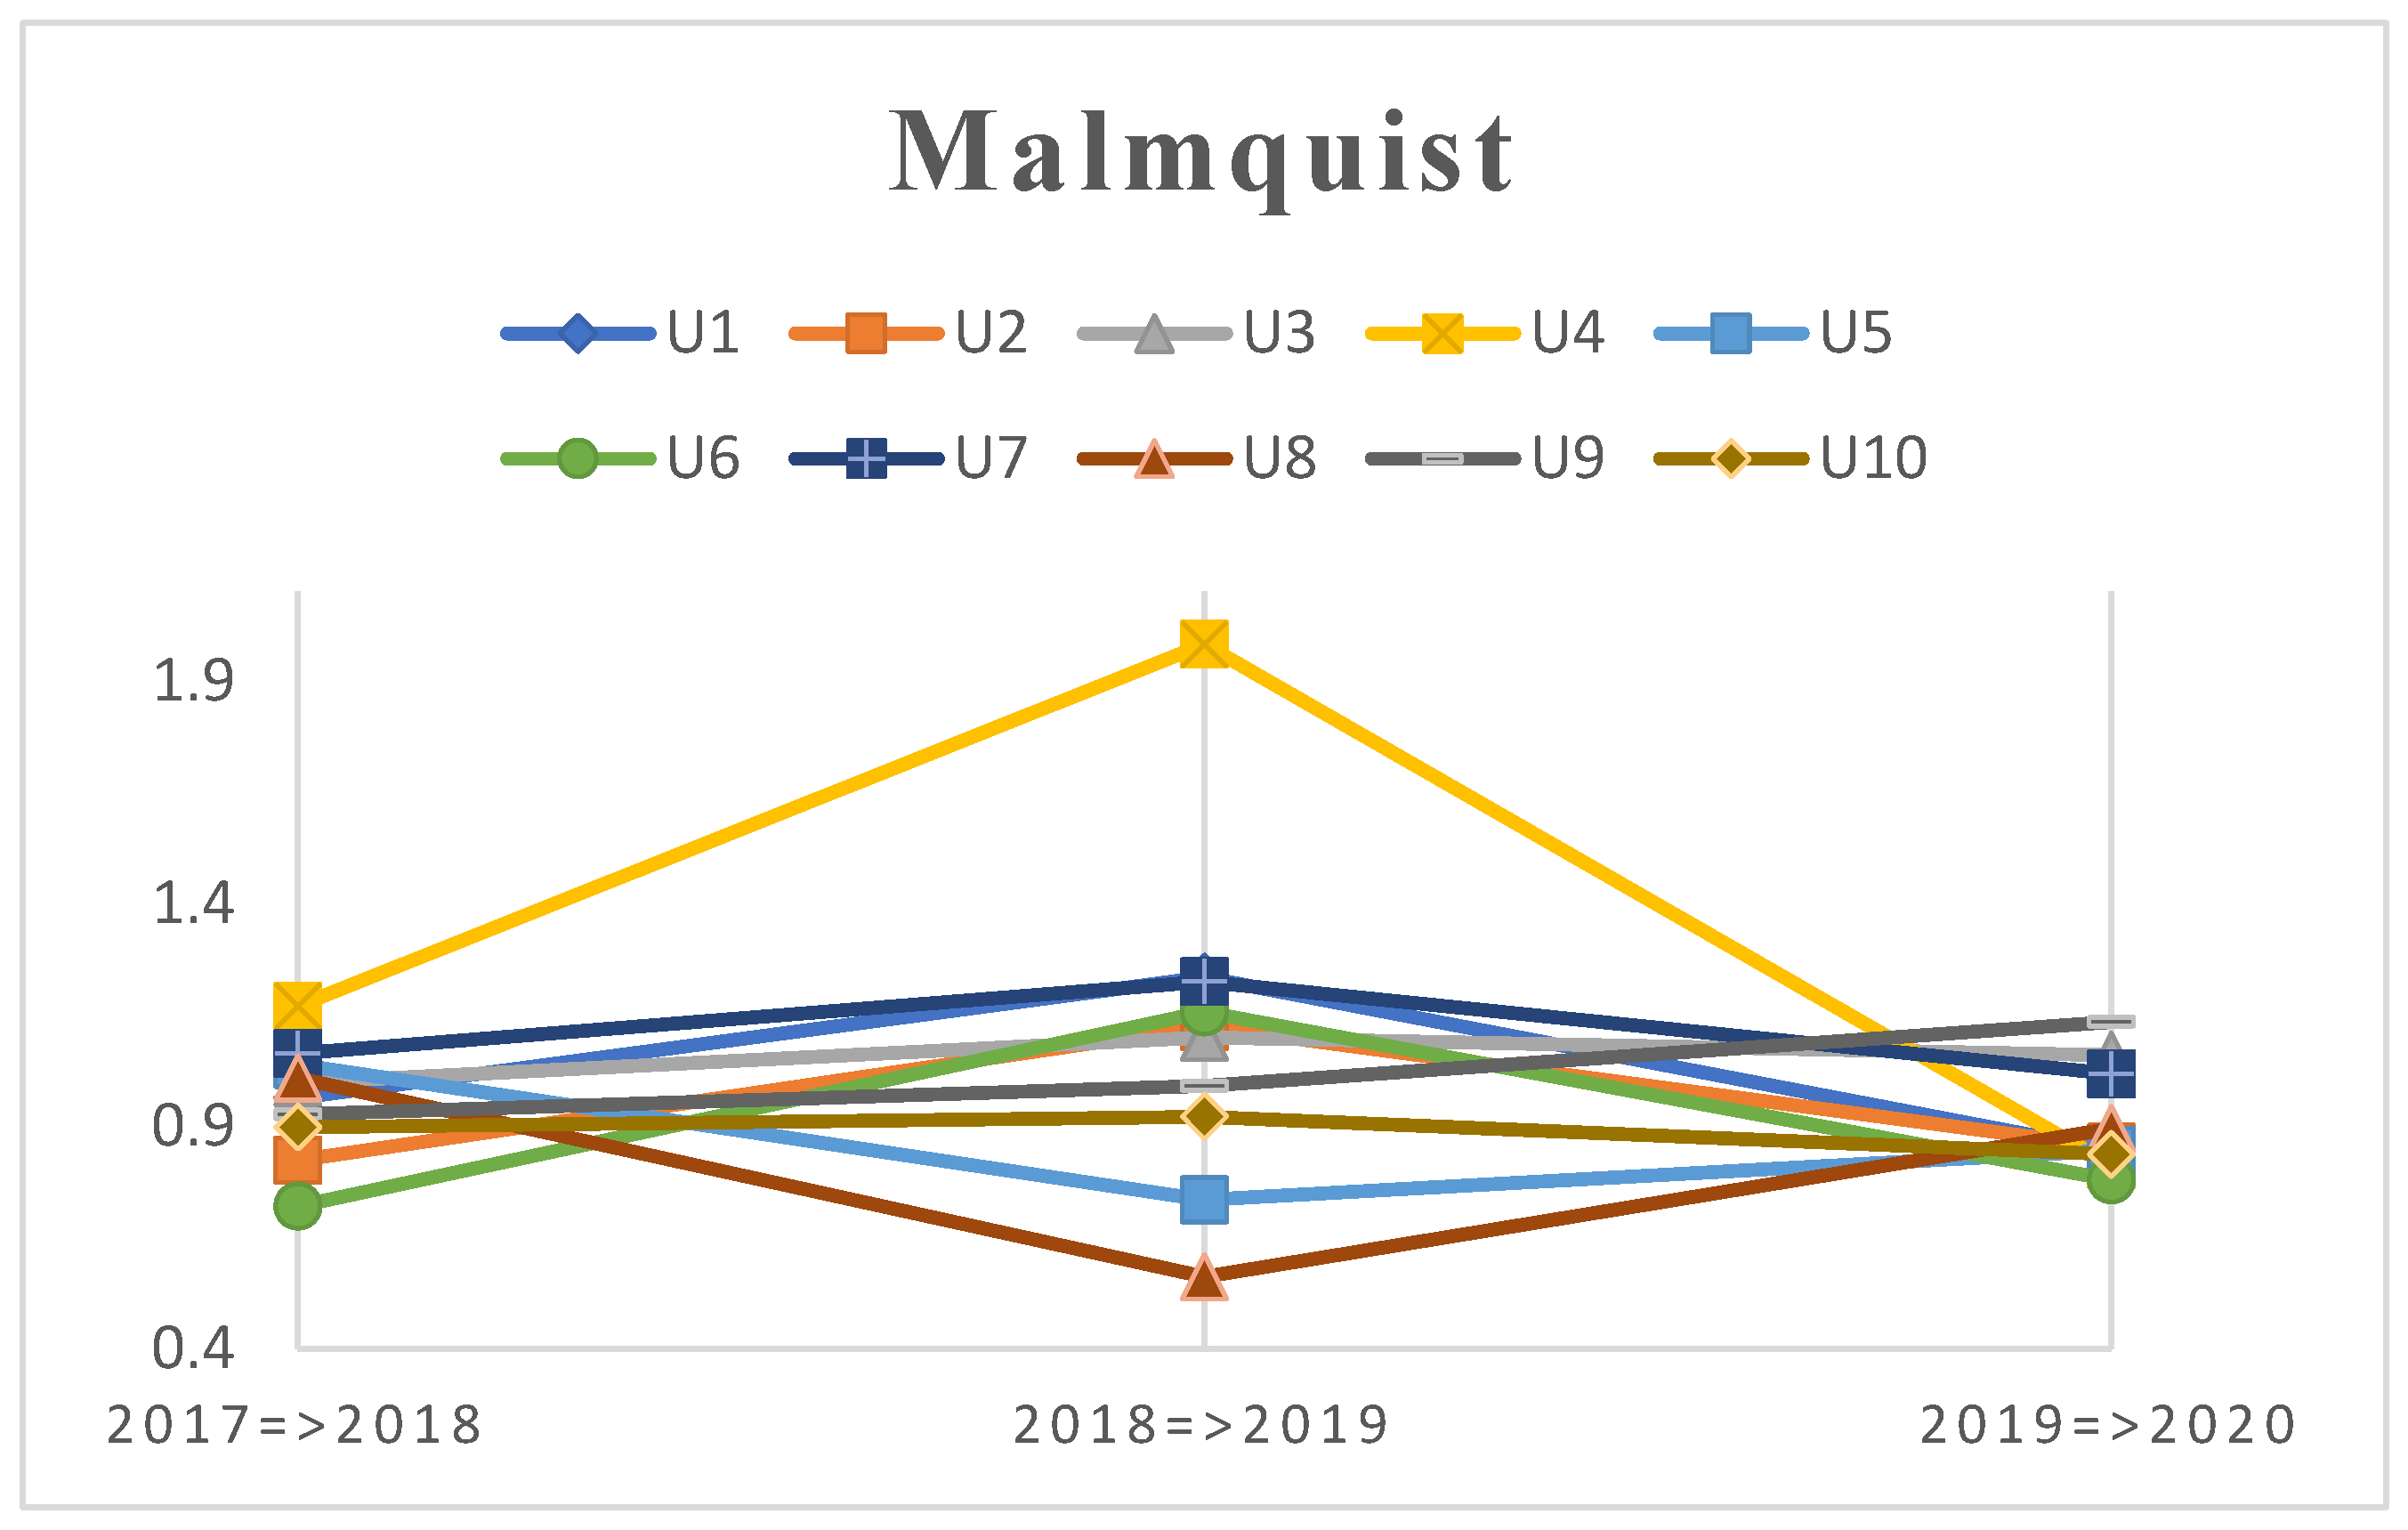
4.3.3. Total Factor Productivity (Malmquist Index)

As evidenced by several other relevant examples in the literature about MPI’s usage in efficiency analysis across a wide range of industries, this method can also be a valuable tool in evaluating the performance of cybersecurity companies. The total productivity of the DMU is calculated using the combined product of the catchup and frontier indexes. All manufacturers’ overall performance regresses when the average MPI falls below the 1.0 criterion, as seen in Table 8.
It can be observed in Figure 4 that even though the second period shows a significant improvement, the influence on the overall operation is minor due to the low MPI in the first and second periods. This conclusion, however, suggests that DMUs should focus on adjusting to changes in technological aspects of cybersecurity, notably new trends and innovations, to maintain productivity.

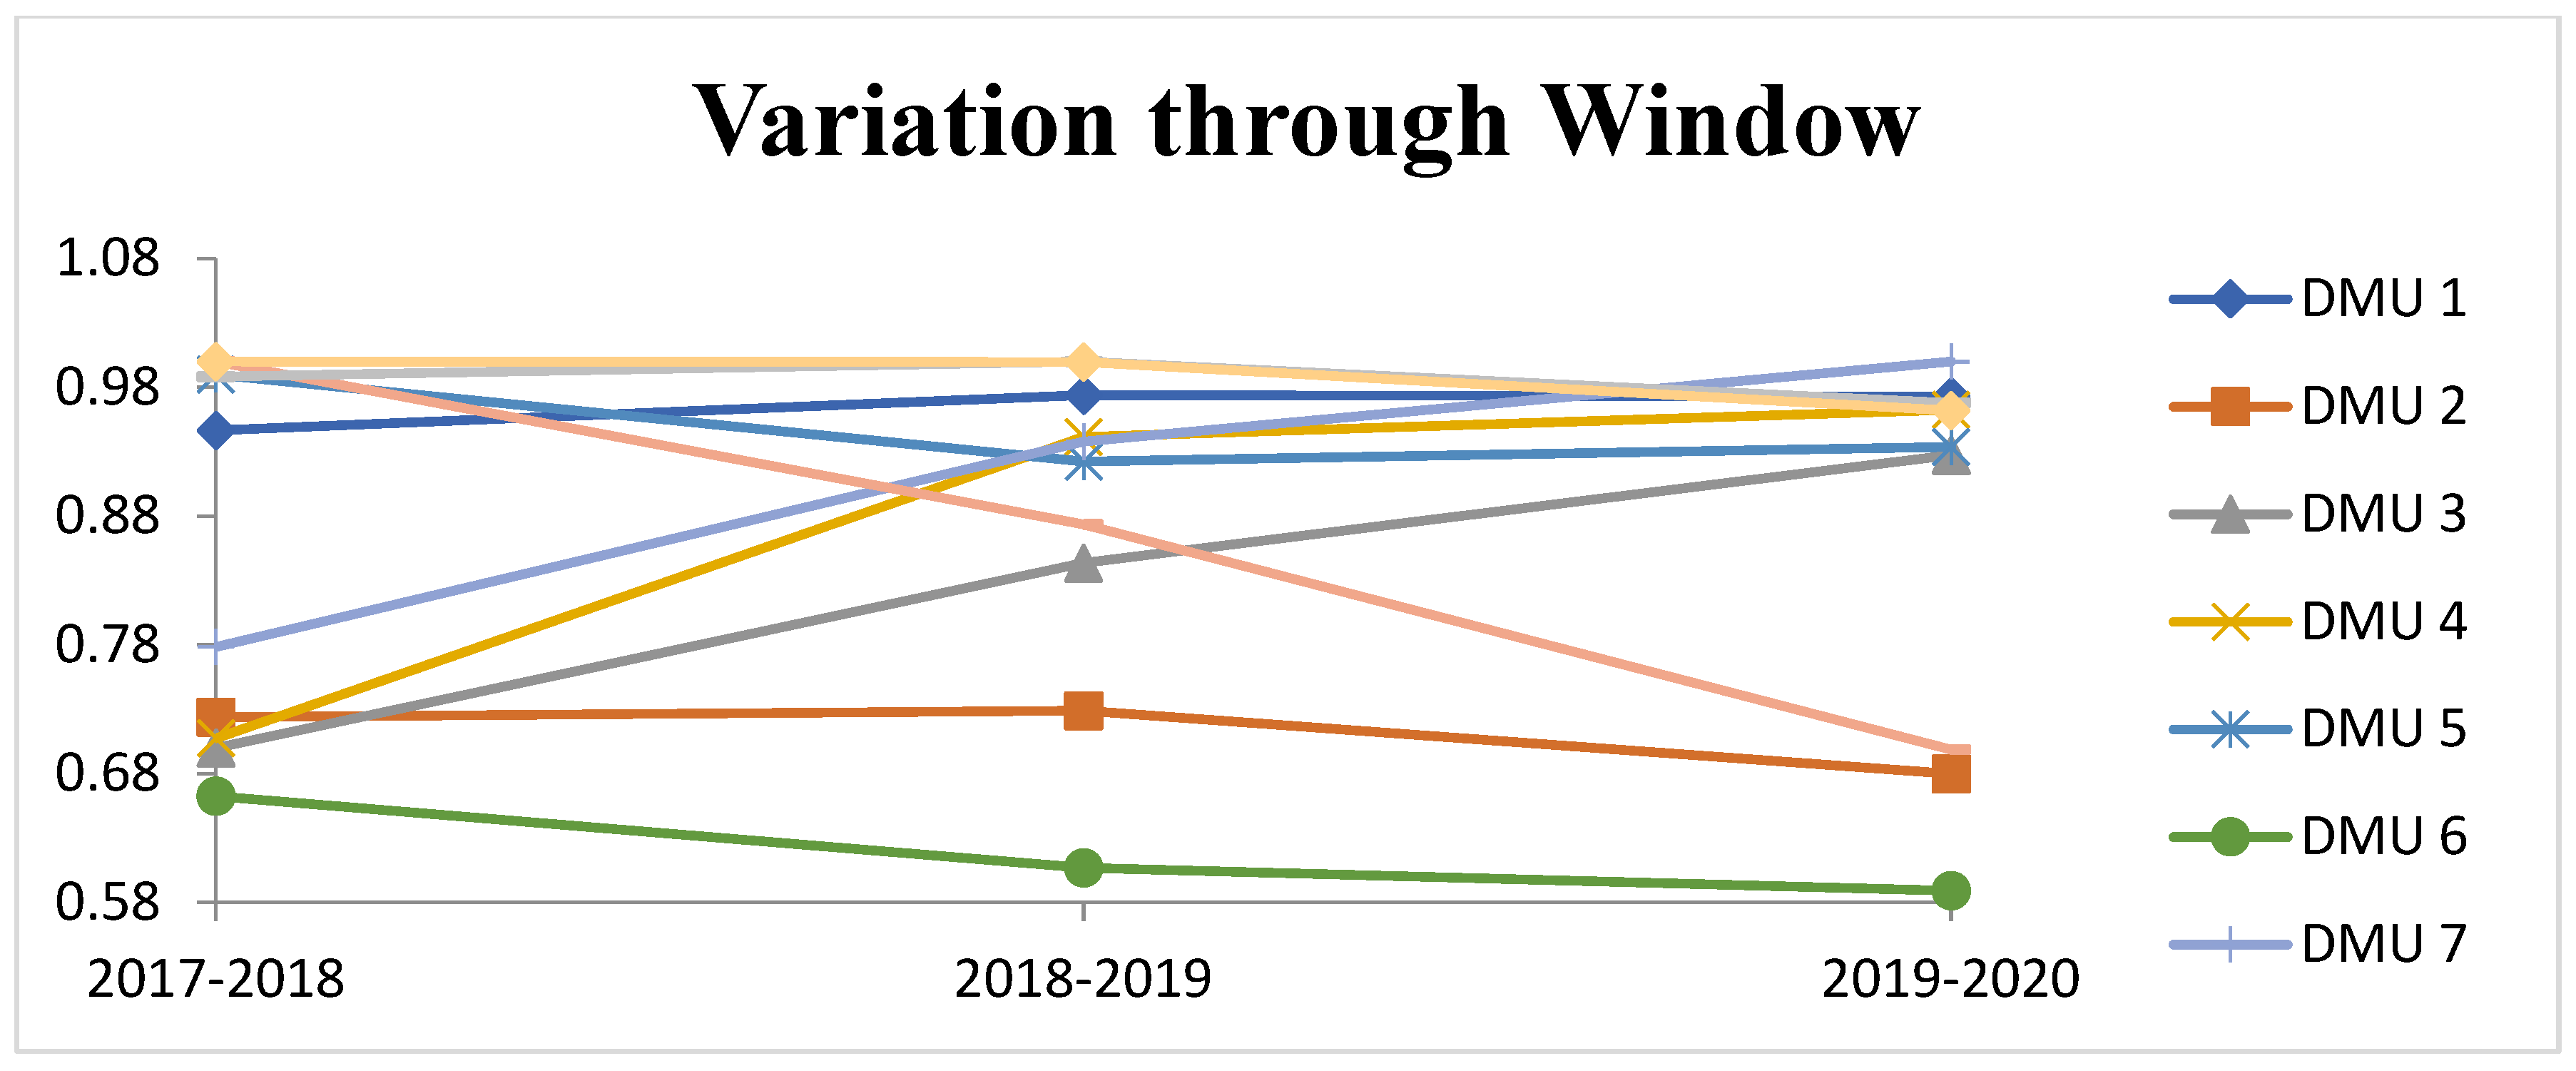
4.4. DEA Window Analysis Results

4.4.1. Relative Efficiency Scores

The results of the DEA Malmquist model reflect the current operational picture of the top 10 global cybersecurity companies after evaluating productiveness through changes in efficiency scores (catchup index) and technological investment effects (frontier shift index). The DEA Window model is used in this phase to rank the efficiency and inefficiency scores of 10 DMUS for the 2017–2020 period. Window analysis is a powerful technique for analyzing the relative efficiency of each DMU over a range of periods. The author calculated the specific efficiency scores in each period using the two-window analysis in this study. We chose to employ the two-window class to complement the results of the window analysis with the Malmquist model. The excellent efficiency value in this analysis is equal to 1.000. Unlike the Malmquist model, the values here will not exceed one and correlate to relative efficiency. The comparable efficiency scores of the DMUs utilizing the Window analysis are shown in Table 9.
The Window analysis results describe the relative efficiency of each DMUs. With scores ranging from 0 to 1, the highest scorers mean performing highly efficiently during specific periods. A 2-year window analysis was used to complement the 2-year configuration of the MPI results. These results are also to be able to compare the efficiency of an initial year to the next one and the next one to the following year. The efficiency of each DMU will be categorized into three, as shown in Table 10 below.
The minimum to maximum values obtained during the first to last period the author decided is used to create these categories and ranges. When looking at Table 10, certain companies had excellent efficiency at one point in time. From 2017 to 2018, the U8—CyberArk and DMU U10—Jupiter Networks had the best results. U9—Fortinet is exceptionally efficient in the second period (2018–2019) and U7—Cisco is highly efficient in the third phase (from 2019 to 2020). As DEA evaluates the whole ten companies, this suggests a balance between input and output factors among these companies. Some DMUs are very efficient for the first period, then rapidly drop to moderate efficiency and eventually to the least efficient state. The efficiency scores of the DMUs can be seen fluctuating over time.

4.4.2. DMUs Efficiency Categories

To properly observe the status of the DMUs in different year periods. Table 11 will list the DMUs according to their efficiency categories.
As seen in Table 11, most cybersecurity companies are from moderately to highly efficient during the first period. There were only three least efficient companies: Microsoft, Redmond, WC, USA; Oracle, Austin, TX, USA, and BlackBerry Ltd., Waterloo, ON, Canada. It seems that the period from 2018 to 2019 was a good year for the cybersecurity industry. From the second to the third period, there was a change in the performance of 10 DMUs. Microsoft moved from the least efficiency to highly efficient group in 2018–2019, while Palo Alto Networks fell to the least efficient list. From least efficient in 2016–2018, Oracle jumped to the moderately efficient group in 2018–2019. CyberArk fell to moderate in the second period from being previously highly efficient, while Synopsys and Cisco Systems Inc. jumped up highly efficient in the last period.
Juniper Networks, IBM, and Fortinet were companies that could maintain their efficiency categories. Table 11 shows the cybersecurity companies that offer consistency in their efficiency categories.
CyberArk continues losing their efficiency score to the least efficiency during the second to the third period from being highly efficient on the first. In contrast, Oracle continuously improved efficiency from the least efficient in the 2017–2018 period to moderately efficient in the 2018–2019 period and finally jumped to highly efficient in the third period, 2019–2020.
BlackBerry Ltd., Waterloo, ON, Canada which did not significantly improve its efficiencies during the three periods, must focus on changing its handling of input factors to produce more valuable outputs. The three companies that are on the list of highly efficient ones (Juniper Networks, Sunnyvale, CA, USA; IBM, Armonk, NY, USA, and Fortinet, Sunnyvale, CA, USA) must only need to maintain their current performance.
Figure 5 below shows the movement of the average relative efficiencies of the companies from the 10 DMUs during the three periods. Table 12 below lists the 10 DMUs and arranges them according to their average efficiency scores.

4.5. Relating Malmquist Productivity Index and Window Analysis Relative Efficiency

The final classifications of the ten cybersecurity companies were created using the same efficiency categories used in the window analysis and the MPI conditions. Table 13 below shows a list of countries categorized according to their relative efficiency.
In the window analysis, U1—Synopsys and U9—Fortinet were successful in achieving average high-efficiency scores and turned out to be progressive in compliance with their average productivity index, as shown in Table 13. Synopsys and Fortinet established important output factors while maintaining exceptional control over the input elements by being highly efficient and progressive. This condition does not need to achieve perfect efficiency over the three periods (if the efficiency scores are increasing and within the range of 0.9223–1.000). However, U10—Juniper Networks proved highly efficient yet regressive. This classification indicates that Juniper Networks can maintain an average relative efficiency inside the highly efficient category despite three periods of decline. Juniper Networks must improve the output factors while maintaining control over the inputs, and this is to achieve any growth in relative efficiency and progress in the future.
Table 13 demonstrates that the U3—Oracle and the U4—Microsoft have remained relatively efficient while also progressing. Based on these results, we can see that the company’s average relative efficiencies are improving. We can also assume that if the efficiency trend continues, Oracle and Microsoft will be classified as highly efficient in the future. The second company in the moderately efficient group, U5—IBM also had moderate relative efficiency, but it declined across three periods. If this company’s efficiency does not increase in the future, it will be relegated to the data source’s least efficient category.
The least efficient and regressing companies include U2—Palo Alto Networks and U6—BlackBerry Ltd., Waterloo, ON, Canada Their average relative efficiencies are equal to or lower than the 0.7238 indexes, suggesting that they have a long road ahead to improving their efficiency and strength. Consistent annual improvements in relative efficiency enable it to become progressive and highly efficient.

5. Conclusions

5.1. Remarkable Conclusions and Findings

In this paper, we have thoroughly examined the effectiveness of the cybersecurity sector and the steps that can be implemented to enhance drone security. The outcomes of relative efficiency, change in relative efficiency over time, technological progress, and total factor productivity of cybersecurity enterprises over four years are also illustrated in this study. The findings suggest that many businesses may enhance their performance, particularly relative efficiency, during periods of relative decline. This increase has the potential to lead to technical improvement. The input variables include total assets, liabilities, and operating expenses.
In 2017–2020, 5 out of 10 companies are improving technical efficiency (U1, U3, U4, U7, U9). Even if the sector is very competitive, technological growth in these areas must continue and begin within the organization. Total factor productivity will result from the combination of catchup and frontier efficiency. Because the idea of a productivity index is the product of these two efficiencies, producers must be concerned about the balance between these two efficiencies to obtain a progressive conclusion. U7—Cisco Systems Inc. is the only firm with a productivity index greater than 1.0 during all the periods, according to the Malmquist model’s results. Cisco Systems Inc. is the most reliable in terms of efficiency, causing it to be the best among all.
We showed that if the same period frontier is used to start the window with the year in issue, only gains in productivity can be recognized, resulting in lower efficiency scores than before the increase. However, when the same temporal frontier is the window that ends with the year in question, only efficiency declines are visible. Allowing the same period frame to be specified by its middle year allows for detecting both gains and decreases in production, but not differentiation. Second, we show that, when using DEA window analysis scores, the traditional breakdown of the neighboring or base period Malmquist index into the frontier shift and catching up effects is incorrect. When Malmquist indices are calculated from DEA window scores, the high fluctuation in index values that are typically observed is balanced out by the analysis’ inherent averaging, causing the index values to be more credible, but at the expense of the decomposition property.

5.2. Main Limitation of the Approach

However, there are certain limitations that have been explored in this research. First, the findings of this study are highly dependent on the value obtained from the collected data on financial input and output variables. The quantitative data results might not have been comparable or applicable to other industries, including those connected with cybersecurity, such as 5G, machine learning, or cloud computing.
Secondly, it is important to note that while all units inside a window are compared against each other, this method assumes that there are no technical differences between them. This approach is a common issue in DEA window analysis and even worse when combined with the Malmquist index technique used to estimate technological advancements. This problem is reduced by using a restricted window width. The window width should be chosen so that it is acceptable to believe that technical Change within each window is insignificant for a DEA window analysis to produce reliable conclusions.

5.3. Future Research Suggestion

According to the original study direction, if this research direction is recommended to continue in the future, the following paths will be proposed:
The first approach is that if the research focuses solely on the application aspect, many additional things and regions can be explored. The second technique combines DEA models with other forecasting models such as Grey or Fuzzy.
For future research on the same topic, the author recommends changing the input and output components and comparing the results. In this manner, a more objective outcome can be achieved. Other aspects, such as total units of production, undesirable factors, such as recalled defective units and certain non-financial variables, can all be considered.
In addition, the DEA has various models available to be exploited and researched. Future studies may dig into the DEA model’s algorithms to indicate and point out some limitations in this study, such as the relationship between the number of inputs, outputs, and DMUs. Additionally, they may answer how and why the input and output selection affects DEA analysis results or to clarify some relatively abstract concepts in the analysis. If the following articles are ready to dive deeper into this issue, it will be a fully qualified study and an excellent potential option. A promising application could be employed for drones to improve their security. It is clear that [56,57,58,59,60] proposed the possible applications of our approaches.

Author Contributions

Conceptualization, C.-N.W. and V.T.T.N.; methodology, C.-N.W.; software, N.T.M.V.; validation, V.T.T.N.; formal analysis, V.T.T.N.; resources, N.T.M.V.; data curation, V.T.T.N. and N.T.M.V.; writing—original draft, N.T.M.V.; writing—review and editing, V.T.T.N. and F.-C.Y.; supervision, F.-C.Y. and C.-N.W.; project administration, F.-C.Y. All authors have read and agreed to the published version of the manuscript.

Funding

This study did not receive any financial support from outside sources and Drones Editorial Office funded the APC.

Institutional Review Board Statement

Not applicable.

Informed Consent Statement

Not applicable.

Data Availability Statement

The data used to support the findings of this study are available from the corresponding author upon request.

Acknowledgments

The authors would like to thank Ministry of Science and Technology, Taiwan. We also would like to thank the National Kaohsiung University of Science and Technology, the Industrial University of Ho Chi Minh City, and Thu Dau Mot University for their assistance. Additionally, we would like to thank the reviewers and editors for their constructive comments and suggestions to improve our work.

Conflicts of Interest

The authors state that the work has no potential conflict of interest.

References

  1. Acharya, S.; Dvorkin, Y.; Karri, R. Causative Cyberattacks on Online Learning-Based Automated Demand Response Systems. IEEE Trans. Smart Grid 2021, 12, 3548–3559. [Google Scholar] [CrossRef]
  2. Alazab, M.; Priya, R.M.S.; Parimala, M.; Maddikunta, P.K.R.; Gadekallu, T.R.; Pham, Q.V. Federated Learning for Cybersecurity: Concepts, Challenges, and Future Directions. IEEE Trans. Ind. Inform. 2022, 18, 3501–3509. [Google Scholar] [CrossRef]
  3. Bin Arfaj, B.A.; Mishra, S.; AlShehri, M. Efficacy of Unconventional Penetration Testing Practices. Intell. Autom. Soft Comput. 2022, 31, 223–239. [Google Scholar] [CrossRef]
  4. Kara, I.; Aydos, M. The rise of ransomware: Forensic analysis for windows based ransomware attacks. Expert Syst. Appl. 2022, 190, 116198. [Google Scholar] [CrossRef]
  5. Alqarni, A.A.; Alsharif, N.; Khan, N.A.; Georgieva, L.; Pardade, E.; Alzahrani, M.Y. MNN-XSS: Modular Neural Network Based Approach for XSS Attack Detection. CMC-Comput. Mater. Contin. 2022, 70, 4075–4085. [Google Scholar] [CrossRef]
  6. Khanduzi, R.; Peyghami, M.R.; Sangaiah, A.K. Data envelopment analysis and interdiction median problem with fortification for enabling IoT technologies to relieve potential attacks. Future Gener. Comput. Syst. 2018, 79, 928–940. [Google Scholar] [CrossRef]
  7. Li, G.D. Spatiotemporal Dynamics of Ecological Total-Factor Energy Efficiency and Their Drivers in China at the Prefecture Level. Int. J. Environ. Res. Public Health 2019, 16, 3480. [Google Scholar] [CrossRef] [Green Version]
  8. Li, M.J.; Wang, J. Spatial-Temporal Distribution Characteristics and Driving Mechanism of Green Total Factor Productivity in China’s Logistics Industry. Pol. J. Environ. Stud. 2021, 30, 201–213. [Google Scholar] [CrossRef]
  9. Burg, A.; Chattopadhyay, A.; Lam, K.-Y. Wireless communication and security issues for cyber–physical systems and the Internet-of-Things. Proc. IEEE 2017, 106, 38–60. [Google Scholar] [CrossRef]
  10. Kagawa, T.; Ono, F.; Shan, L.; Takizawa, K.; Miura, R.; Li, H.-B.; Kojima, F.; Kato, S. A Study on Latency-Guaranteed Multi-Hop Wireless Communication System for Control of Robots and Drones. In Proceedings of the 2017 20th International Symposium on Wireless Personal Multimedia Communications (WPMC), Yogyakarta, Indonesia, 17–20 December 2017; pp. 417–421. [Google Scholar]
  11. Mehta, P.L.; Kumar, A.; Mohammad, B.; Prasad, R. A Technological and Business Perspective on Connected Drones for 6G and Beyond Mobile Wireless Communications. Wirel. Pers. Commun. 2022, 126, 1–20. [Google Scholar] [CrossRef]
  12. Saad, W.; Bennis, M.; Mozaffari, M.; Lin, X. Wireless Communications and Networking for Unmanned Aerial Vehicles; Cambridge University Press: Cambridge, UK, 2020. [Google Scholar]
  13. Nouacer, R.; Hussein, M.; Espinoza, H.; Ouhammou, Y.; Ladeira, M.; Castiñeira, R.J.M. Microsystems, Towards a framework of key technologies for drones. Microprocess. Microsyst. 2020, 77, 103142. [Google Scholar] [CrossRef]
  14. Alghassab, M. Analyzing the Impact of Cybersecurity on Monitoring and Control Systems in the Energy Sector. Energies 2022, 15, 218. [Google Scholar] [CrossRef]
  15. Gan, G.Y.; Lee, H.S.; Liu, J.Y. A DEA Approach Towards to the Evaluation of IoT Applications in Intelligent Ports. J. Mar. Sci. Technol. 2021, 29, 256–265. [Google Scholar] [CrossRef]
  16. Priyadarshini, I.; Kumar, R.; Sharma, R.; Singh, P.K.; Satapathy, S.C. Identifying cyber insecurities in trustworthy space and energy sector for smart grids. Comput. Electr. Eng. 2021, 93, 107204. [Google Scholar] [CrossRef]
  17. Yin, S.W.; Gong, Z.W.; Gu, L.; Deng, Y.J.; Niu, Y.J. Driving forces of the efficiency of forest carbon sequestration production: Spatial panel data from the national forest inventory in China. J. Clean. Prod. 2022, 330, 129776. [Google Scholar] [CrossRef]
  18. Shi, L.Y.; Li, X.Y.; Gao, Z.B.; Duan, P.F.; Liu, N.; Chen, H.L. Worm computing: A blockchain-based resource sharing and cybersecurity framework. J. Netw. Comput. Appl. 2021, 185, 103081. [Google Scholar] [CrossRef]
  19. Tashtoush, Y.M.; Darweesh, D.A.; Husari, G.; Darwish, O.A.; Darwish, Y.; Issa, L.B.; Ashqar, H.I. Agile Approaches for Cybersecurity Systems, IoT and Intelligent Transportation. IEEE Access 2022, 10, 1360–1375. [Google Scholar] [CrossRef]
  20. Tsimenidis, S.; Lagkas, T.; Rantos, K. Deep Learning in IoT Intrusion Detection. J. Netw. Syst. Manag. 2022, 30, 1–40. [Google Scholar] [CrossRef]
  21. Dang, T.-T.; Nguyen, N.-A.-T.; Nguyen, V.-T.-T.; Dang, L.-T. A Two-Stage Multi-Criteria Supplier Selection Model for Sustainable Automotive Supply Chain under Uncertainty. Axioms 2022, 11, 228. [Google Scholar] [CrossRef]
  22. Chen, K.; Ren, X.T.; Yang, G.L.; Qin, H.B. The other side of the coin: The declining of Chinese social science. Scientometrics 2022, 127, 127–143. [Google Scholar] [CrossRef]
  23. Li, Y.; Chiu, Y.H.; Liu, Y.B.; Lin, T.Y.; Chang, T.H. The Impact of the Media and Environmental Pollution on the Economy and Health Using a Modified Meta 2-Stage EBM Malmquist Model. Inq. J. Health Care Organ. Provis. Financ. 2020, 57, 1–24. [Google Scholar] [CrossRef] [PubMed]
  24. Liu, X.X.; Liu, H.H.; Yang, G.L.; Pan, J.F. Productivity assessment of the real estate industry in China: A DEA-Malmquist index. Eng. Constr. Arch. Manag. 2021, 52, 146–168. [Google Scholar] [CrossRef]
  25. Nguyen, V.T.T.; Wang, C.-N.; Yang, F.-C.; Vo, T.M.N. Mathematics, Efficiency Evaluation of Cyber Security Based on EBM-DEA Model. Eurasia Proc. Sci. Technol. Eng. Math. 2022, 17, 38–44. [Google Scholar] [CrossRef]
  26. Řepková, I.J.P.E. Finance, Efficiency of the Czech banking sector employing the DEA window analysis approach. Procedia Econ. Financ. 2014, 12, 587–596. [Google Scholar] [CrossRef] [Green Version]
  27. Wang, K.L.; Wang, J.G.; Wang, J.M.; Ding, L.L.; Zhao, M.S.; Wang, Q.W. Investigating the spatiotemporal differences and influencing factors of green water use efficiency of Yangtze River Economic Belt in China. PLoS ONE 2020, 15, e0230963. [Google Scholar] [CrossRef]
  28. Wu, D.D.; Wang, Y.H.; Qian, W.Y. Efficiency evaluation and dynamic evolution of China’s regional green economy: A method based on the Super-PEBM model and DEA window analysis. J. Clean. Prod. 2020, 264, 121630. [Google Scholar] [CrossRef]
  29. Wang, Y.; Wu, D.; Li, H. Efficiency measurement and productivity progress of regional green technology innovation in China: A comprehensive analytical framework. Technol. Anal. Strat. Manag. 2021, 34, 1432–1448. [Google Scholar] [CrossRef]
  30. Wang, C.-N.; Yang, F.-C.; Nguyen, V.T.T.; Nguyen, Q.M.; Huynh, N.T.; Huynh, T.T.J.M. Optimal Design for Compliant Mechanism Flexure Hinges: Bridge-Type. Micromachines 2021, 12, 1304. [Google Scholar] [CrossRef]
  31. Georgiou, O.; Raza, U. Low power wide area network analysis: Can LoRa scale? IEEE Wirel. Commun. Lett. 2017, 6, 162–165. [Google Scholar] [CrossRef] [Green Version]
  32. Färe, R.; Grosskopf, S.; Lindgren, B.; Roos, P. Productivity developments in Swedish hospitals: A Malmquist output index approach. In Data Envelopment Analysis: Theory, Methodology, and Applications; Springer: Berlin/Heidelberg, Germany, 1994; pp. 253–272. [Google Scholar]
  33. Löthgren, M.; Tambour, M. Productivity and customer satisfaction in Swedish pharmacies: A DEA network model. Eur. J. Oper. Res. 1999, 115, 449–458. [Google Scholar] [CrossRef]
  34. Caves, D.W.; Christensen, L.R.; Diewert, W.E. The economic theory of index numbers and the measurement of input, output, and productivity. Econometrica 1982, 50, 1393–1414. [Google Scholar] [CrossRef]
  35. Tone, K.; Sahoo, B. Degree of scale economies and congestion: A unified DEA approach. Eur. J. Oper. Res. 2004, 158, 755–772. [Google Scholar] [CrossRef] [Green Version]
  36. Wang, C.N.; Nguyen, N.A.; Fu, H.P.; Hsu, H.P.; Dang, T.T. Efficiency Assessment of Seaport Terminal Operators Using DEA Malmquist and Epsilon-Based Measure Models. Axioms 2021, 10, 48. [Google Scholar] [CrossRef]
  37. Charnes, A.; Cooper, W.W.; Wei, Q.L.; Huang, Z.M. Cone ratio data envelopment analysis and multi-objective programming. Int. J. Syst. Sci. 1989, 20, 1099–1118. [Google Scholar] [CrossRef]
  38. Bian, Y.; Yang, F.J.E.P. Resource and environment efficiency analysis of provinces in China: A DEA approach based on Shannon’s entropy. Energy Policy 2010, 38, 1909–1917. [Google Scholar] [CrossRef]
  39. Chang, Y.-C.; Chen, D.-H. Catalytic reduction of 4-nitrophenol by magnetically recoverable Au nanocatalyst. J. Hazard. Mater. 2009, 165, 664–669. [Google Scholar] [CrossRef]
  40. Řepková, I.J.P.E. Finance, Banking efficiency determinants in the Czech banking sector. Procedia Econ. Financ. 2015, 23, 191–196. [Google Scholar] [CrossRef] [Green Version]
  41. Hunjet, D.; Neralić, L.; Wendell, R.E. Evaluation of the dynamic efficiency of Croatian towns using data envelopment analysis. Central Eur. J. Oper. Res. 2015, 23, 675–686. [Google Scholar] [CrossRef]
  42. Žaja, M.M.; Banker, R.; Fang, S.; Hunjet, D.; Neralić, L.; Wendell, R.E. Efficiency Gains in Croatia’s Electricity Distribution Centers Following Industry Structure Changes. Data Envel. Anal. J. 2017, 3, 119–150. [Google Scholar] [CrossRef]
  43. Golany, B.; Roll, Y.J.O. An application procedure for DEA. Omega 1989, 17, 237–250. [Google Scholar] [CrossRef]
  44. Lu, W.-M.; Hung, S.-W.J.C.; Research, O. Exploring the efficiency and effectiveness in global e-retailing companies. Comput. Oper. Res. 2011, 38, 1351–1360. [Google Scholar] [CrossRef]
  45. Tao, L.; Liu, X.; Chen, Y.J.Q. Quantity, Online banking performance evaluation using data envelopment analysis and axiomatic fuzzy set clustering. Qual. Quant. 2013, 47, 1259–1273. [Google Scholar] [CrossRef]
  46. Yang, Z.; Shi, Y.; Wang, B.; Yan, H. Website quality and profitability evaluation in ecommerce firms using two-stage DEA model. Procedia Comput. Sci. 2014, 30, 4–13. [Google Scholar] [CrossRef] [Green Version]
  47. Kwon, H.-B. Performance modeling of mobile phone providers: A DEA-ANN combined approach. Benchmarking Int. J. 2014, 21, 1120–1144. [Google Scholar] [CrossRef]
  48. Yang, Z.; Shi, Y.; Yan, H. Applications, Scale, congestion, efficiency and effectiveness in e-commerce firms. Electron. Commer. Res. Appl. 2016, 20, 171–182. [Google Scholar] [CrossRef]
  49. Wang, C.-N.; Nguyen, N.-A.-T.; Dang, T.-T.; Trinh, T.-T. A decision support model for measuring technological progress and productivity growth: The case of commercial banks in Vietnam. Axioms 2021, 10, 131. [Google Scholar] [CrossRef]
  50. Aldhyani, T.H.H.; Alkahtani, H. Attacks to Automatous Vehicles: A Deep Learning Algorithm for Cybersecurity. Sensors 2022, 22, 360. [Google Scholar] [CrossRef]
  51. Fatani, A.; Dahou, A.; Al-qaness, M.A.A.; Lu, S.F.; Elaziz, M.A. Advanced Feature Extraction and Selection Approach Using Deep Learning and Aquila Optimizer for IoT Intrusion Detection System. Sensors 2022, 22, 140. [Google Scholar] [CrossRef]
  52. Yin, J.; Tang, M.J.; Cao, J.L.; Wang, H.; You, M.S.; Lin, Y.Z. Vulnerability exploitation time prediction: An integrated framework for dynamic imbalanced learning. World Wide Web 2021, 25, 401–423. [Google Scholar] [CrossRef]
  53. Fan, B.; Li, Y.; Zhang, R.; Fu, Q. Review on the technological development and application of UAV systems. Chin. J. Electron. 2020, 29, 199–207. [Google Scholar] [CrossRef]
  54. Beke, É.; Bódi, A.; Katalin, T.G.; Kovács, T.; Maros, D.; Gáspár, L. The role of drones in linking industry 4.0 and ITS Ecosystems. In Proceedings of the 2018 IEEE 18th International Symposium on Computational Intelligence and Informatics (CINTI), Budapest, Hungary, 21–22 November 2018; pp. 000191–000198. [Google Scholar]
  55. Chamola, V.; Kotesh, P.; Agarwal, A.; Gupta, N.; Guizani, M. A comprehensive review of unmanned aerial vehicle attacks and neutralization techniques. Ad Hoc Netw. 2021, 111, 102324. [Google Scholar] [CrossRef] [PubMed]
  56. Peng, F.; Wang, Y.; Xuan, H.; Nguyen, T.V.T. Management, Efficient road traffic anti-collision warning system based on fuzzy nonlinear programming. Int. J. Syst. Assur. Eng. Manag. 2022, 13, 456–461. [Google Scholar] [CrossRef]
  57. Chen, C.; Xiang, J.; Ye, Z.; Yan, W.; Wang, S.; Wang, Z.; Chen, P.; Xiao, M.J.D. Deep Learning-Based Energy Optimization for Edge Device in UAV-Aided Communications. Drones 2022, 6, 139. [Google Scholar] [CrossRef]
  58. Ding, C.; Zheng, Z.J.D. A Reinforcement Learning Approach Based on Automatic Policy Amendment for Multi-AUV Task Allocation in Ocean Current. Drones 2022, 6, 141. [Google Scholar] [CrossRef]
  59. Kler, R.; Gangurde, R.; Elmirzaev, S.; Hossain, M.S.; Vo, N.V.; Nguyen, T.V.; Kumar, P.N. Society, Optimization of Meat and Poultry Farm Inventory Stock Using Data Analytics for Green Supply Chain Network. Discret. Dyn. Nat. Soc. 2022, 2022, 1–8. [Google Scholar] [CrossRef]
  60. Savkin, A.V.; Verma, S.C.; Anstee, S.J.D. Optimal navigation of an unmanned surface vehicle and an autonomous underwater vehicle collaborating for reliable acoustic communication with collision avoidance. Drones 2022, 6, 27. [Google Scholar] [CrossRef]
Figure 1. The procedure of the research described in five steps.
Drones 06 00363 g001
Figure 2. The technical Change (catchup) of DMUs (2017–2020).
Drones 06 00363 g002
Figure 3. Technological Change (frontier shift) of DMUs (2017–2020).
Drones 06 00363 g003
Figure 4. The Malmquist productivity index of DMUs (2017–2020).
Drones 06 00363 g004
Figure 5. Comparative relative efficiencies of cybersecurity companies.
Drones 06 00363 g005
Table 1. DMUs List.
Table 1. DMUs List.
DMUCompany NameStock Code
U1 Synopsys, Mountain View, CA, USA SNPS
U2 Palo Alto Networks, Santa Clara, CA, USA PANW
U3 Oracle, Austin, TX, USA ORCL
U4 Microsoft, Redmond, WC, USA MSFT
U5 IBM, Armonk, NY, USA IBM
U6 BlackBerry Ltd., Waterloo, ON, Canada BB
U7 Cisco Systems Inc., San Jose, CA, USA CSCO
U8 CyberArk, Newton, MA, USA CYBR
U9 Fortinet, Sunnyvale, CA, USA FTNT
U10 Juniper Networks, Sunnyvale, CA, USA JNPR
Table 2. List of inputs and outputs in prior research using data envelopment analysis method.
Authors [Reference]Inputs/CriteriaOutputs/ResponsesResearch TopicsApplied Sectors
Lu et al., 2011 [44]Operating expenses, Liability, Equity, EmployeeNet income, Net sales, Intangible value, Market value“Exploring the efficiency and effectiveness in global e-retailing companies”.E-retailing
Tao et al., 2013 [45]Equipment Operating cost EmployeesRevenue Web metrics“Online banking performance evaluation using data envelopment analysis and axiomatic fuzzy set clustering”E-banking
Yang et al., 2014 [46]Costs Assets LaborsRevenue Profit“Website quality and profitability evaluation in e-commerce firms using two-stage DEA model”E-commerce
He-Boong Kwon, 2014 [47]Cost, AssetRevenue, Operating income“Performance modeling of mobile phone providers: A DEA-ANN combined approach”Mobile Devices
Yang et al., 2016 [48]Employees Operating expenses Total assetsRevenue Market share“Efficiency and effectiveness in e-commerce firms”E-commerce
Wang et al., 2021 [49]Assets, Deposit, Operating expense, LiabilitiesLoan, Net income“A Decision Support Model for Measuring Technological Progress and Productivity Growth: The Case of Commercial Banks in Vietnam”Banking
Table 3. Pearson correlation.
CorrelationDegree of Correlation
>0.8Very High
0.6–0.8High
0.4–0.6Medium
0.2–0.4Low
<0.2Very low
Table 4. The period from 2017 to 2020: statistics and numbers.
AssetsLiabilitiesOperating ExpensesRevenueGross Profit
2017Max241,0861076312437279,13936227
Min502.58148.61199.53261.7219.85
Average65,59430,8016708.918,16310,889
SD81,26538,1618659.825,97914,097
2018Max258,848106,45223,65179,59036,936
Min673.62206.85247.45343.2294.74
Average65,71433,9376920.618,95711,537
SD83,60740,1838520.226,19314,302
2019Max286,556131,20125,85777,14736,488
Min1405.2781.03309433.9371.28
Average67,64038,142727919,28211,982
SD90,05646,1198932.525,75314,350
2020Max301,311135,24528,68073,62135,575
Min1562.4855.06375.85464.43381.86
Average70,42642,1407769.419,04412,112
SD93,87250,4979273.924,43513,915
Table 5. Pearson Correlation coefficient of the period from 2017 to 2020.
Assets (A)Liabilities (L)Operating
Expenses (OE)
Revenue (R)Gross Profit (GP)
2017A10.73830.52470.49350.5565
L0.738310.94930.93280.9486
OE0.52470.949310.9840.9931
R0.49350.93280.98410.9621
GP0.55650.94860.99310.96211
2018A10.78210.49820.46920.5465
L0.782110.91750.89440.9345
OE0.49820.917510.98210.9947
R0.46920.89440.982110.9632
GP0.54650.93450.99470.96321
2019A10.81510.46260.47460.5206
L0.815110.87480.87470.8802
OE0.46260.874810.9910.9844
R0.47460.87470.99110.9649
GP0.52060.88020.98440.96491
2020A10.85510.49240.49180.5557
L0.855110.8420.82540.8538
OE0.49240.84210.99620.9657
R0.49180.82540.996210.9646
GP0.55570.85380.96570.96461
Table 6. Result of the DMUs’ Catchup Index (efficiency change) (2017–2020).
CatchupCompany Name2017 => 20182018 => 20192019 => 2020Average
U1 Synopsys, Mountain View, CA, USA 0.96731.37220.92251.0873
U2 Palo Alto Networks, Santa Clara, CA, USA 0.83631.13740.89160.9551
U3Oracle, Austin, TX, USA1.09661.16861.22151.1622
U4Microsoft, Redmond, WC, USA1.39652.72130.97081.6962
U5IBM, Arkmont, NY, USA1.03180.75990.98680.9262
U6BlackBerry Ltd., Waterloo, ON, Canada0.72341.16760.87110.9207
U7 Cisco Systems Inc., San Jose, CA, USA 1.15581.261.04181.1525
U8 CyberArk, Newton, MA, USA 1.0190.54310.97010.8441
U9 Fortinet, Sunnyvale, CA, USA 0.95880.99681.14051.032
U10 Juniper Networks, Sunnyvale, CA, USA 0.88740.91010.88710.8949
Average 1.00731.20370.99041.0671
Max 1.39652.72131.22151.6962
Min 0.72340.54310.87110.8441
SD 0.18570.58730.11480.2465
Table 7. Technological Change (frontier shift index) of DMUs (2017–2020).
FrontierCompany Name2017 => 20182018 => 20192019 => 2020Average
U1 Synopsys, Mountain View, CA, USA 0.99560.89950.9170.9374
U2Palo Alto Networks, Santa Clara, CA, USA 0.98430.98790.95560.9759
U3Oracle, Austin, TX, USA0.90960.94070.86720.9058
U4Microsoft, Redmond, WC, USA0.83760.72840.83690.801
U5IBM, Armonk, NY, USA1.00610.96660.85630.943
U6 BlackBerry Ltd., Waterloo, ON, Canada 0.99520.99050.89460.9601
U7 Cisco Systems Inc., San Jose, CA, USA 0.92030.97170.97670.9562
U8 CyberArk, Newton, MA, USA 0.9891.03420.92160.9816
U9 Fortinet, Sunnyvale, CA, USA 0.96630.99340.99420.9846
U10 Juniper Networks, Sunnyvale, CA, USA 1.01111.01190.94320.9887
Average 0.96150.95250.91630.9434
Max 1.01111.03420.99420.9887
Min 0.83760.72840.83690.801
SD 0.05560.08710.05250.0562
Table 8. Malmquist productivity index of the DMUs from 2017 to 2020.
MalmquistCompany Name2017 => 20182018 => 20192019 => 2020Average
U1 Synopsys, Mountain View, CA, USA 0.9631.23420.84591.0144
U2 Palo Alto Networks, Santa Clara, CA, USA 0.82321.12370.8520.933
U3Oracle, Austin, TX, USA0.99741.09931.05931.052
U4Microsoft, Redmond, WC, USA1.16971.98210.81241.3214
U5IBM, Armonk, NY, USA1.03820.73450.8450.8725
U6 BlackBerry Ltd., Waterloo, ON, Canada 0.721.15640.77920.8852
U7 Cisco System Inc., San Jose, CA, USA 1.06361.22441.01761.1019
U8 CyberArk, Newton, MA, USA 1.00790.56170.8940.8212
U9 Fortinet, Sunnyvale, CA, USA 0.92650.99021.13391.0168
U10 Juniper Networks, Sunnyvale, CA, USA 0.89720.92090.83670.885
Average 0.96071.10280.90760.9903
Max 1.16971.98211.13391.3214
Min 0.720.56170.77920.8212
SD 0.12730.37750.11920.1472
Table 9. DMU efficiency scores based on DEA Window analysis using two years Window from 2017 to 2020.
DMUCompany Name2017–20182018–20192019–2020
U1 Synopsys, Mountain View, CA, USA 0.94650.97390.9729
U2 Palo Alto Networks, Santa Clara, CA, USA 0.72390.72880.6797
U3Oracle, Austin, TX, USA0.69980.84370.9274
U4Microsoft, Redmond, WC, USA0.70730.94140.9625
U5IBM, Armonk, NY, USA0.98990.92230.9336
U6 BlackBerry Ltd, Ontario, Canada 0.66240.60680.5889
U7 Cisco Systems Inc., San Jose, CA, USA 0.77830.93801.0000
U8 CyberArk, Newton, MA, USA 1.00000.87350.6986
U9 Fortinet, Sunnyvale, CA, USA 0.98831.00000.9678
U10 Juniper Networks, Sunnyvale, CA, USA 1.00000.99970.9619
Average 0.84960.88280.8693
Max 1.00001.00001.0000
Min 0.66240.60680.5889
Table 10. Equivalent efficiency categories per range.
Efficiency Score RangeCategories
0.9223–1.000Highly Efficient
0.7239–09222Moderately Efficient
0.7238 and belowLeast Efficient
Table 11. List of companies per efficiency categories by year periods.
Year PeriodLeast EfficientModerately EfficientHighly Efficient
2017–2018Microsoft, Redmond, WC, USA
Oracle, Austin, TX, USA
BlackBerry Ltd., Waterloo, ON, Canada
Synopsys, Mountain View, CA, USA
Cisco Systems Inc., San Jose, CA, USA
Palo Alto Networks, Santa Clara, CA, USA
CyberArk, Newton, MA, USA
Juniper Networks, Sunnyvale, CA, USA
IBM, Armonk, NY, USA
Fortinet, Sunnyvale, CA, USA
2018–2019Palo Alto Networks, Santa Clara, CA, USA
BlackBerry Ltd., Waterloo, ON, Canada
Oracle, Austin, TX, USA
CyberArk, Newton, MA, USA
Fortinet, Sunnyvale, CA, USA
Juniper Networks, Sunnyvale, CA, USA
Synopsys, Mountain View, CA, USA
Microsoft, Redmond, WC, USA
Cisco Systems Inc., San Jose, CA, USA
IBM, Armonk, NY, USA
2019–2020CyberArk, Newton, MA, USA
Palo Alto Networks, Santa Clara, CA, USA
BlackBerry Ltd., Waterloo, ON, Canada
Fortinet, Sunnyvale, CA, USA
Juniper Networks, Sunnyvale, CA, USA
Synopsys, Mountain View, CA, USA
Microsoft, Redmond, WC, USA
Cisco Systems Inc., San Jose, CA, USA
IBM, Armonk, NY, USA
Oracle, Austin, TX, USA
Table 12. Average efficiency scores of DMUs.
DMUCompany NameAverage Efficiency
U10Juniper Networks, Sunnyvale, CA, USA 0.9735
U9 Fortinet, Sunnyvale, CA, USA 0.9693
U1Synopsys, Mountain View, CA, USA0.949
U5IBM, Armonk, NY, USA0.8893
U7 Cisco Systems Inc., San Jose, CA, USA 0.8574
U8 CyberArk, Newton, MA, USA 0.8275
U4Microsoft, Redmond, WC, USA 0.7486
U3Oracle, Austin, TX, USA0.748
U2 Palo Alto Networks, Santa Clara, CA, USA 0.6831
U6BlackBerry Ltd., Waterloo, ON, Canada0.6162
Table 13. List of DMUs’ efficiency levels and corresponding MPI conditions.
Highly Efficient and ProgressiveHighly Efficient but Regressive
U1—Synopsys, Mountain View, CA, USA; U9—Fortinet, Sunnyvale, CA, USA U10—Juniper Networks, Sunnyvale, CA, USA
Moderately Efficient yet Progressive Moderately Efficient yet Regressive
U3—Oracle, Austin, TX, USA; U4—Microsoft, Redmond, WC, USAU5—IBM, Armonk, NY, USA
Least Efficient, but ProgressiveLeast Efficient and Regressive
-U2—Palo Alto Networks, Santa Clara, CA, USA; U6—BlackBerry Ltd., Waterloo, ON, Canada
Publisher’s Note: MDPI stays neutral with regard to jurisdictional claims in published maps and institutional affiliations.

