Article

Entropy Measures in the Assessment of Heart Rate Variability in Patients with Cardiodepressive Vasovagal Syncope

1
Hypertension Unit, Department of Hypertension and Diabetology, Medical University of Gdańsk, Dębinki 7c, 80-952 Gdańsk, Poland
2
Faculty of Applied Physics and Mathematics, Gdańsk University of Technology, Narutowicza 11/12,80-233 Gdańsk, Poland
3
Institute of Theoretical Physics and Astrophysics, University of Gdańsk, Wita Stwosza 57, 80-952Gdańsk, Poland
4
Department of Cardiology and Electrotherapy, Medical University of Gdańsk, Dębinki 7, 80-952Gdańsk, Poland
*
Author to whom correspondence should be addressed.
Entropy 2015, 17(3), 1007-1022; https://0-doi-org.brum.beds.ac.uk/10.3390/e17031007
Submission received: 12 December 2014 / Revised: 9 February 2015 / Accepted: 25 February 2015 / Published: 2 March 2015
(This article belongs to the Special Issue Entropy and Cardiac Physics)

Abstract

:
Sample entropy (SampEn) was reported to be useful in the assessment of the complexity of heart rate dynamics. Permutation entropy (PermEn) is a new measure based on the concept of order and was previously shown to be accurate for short, non-stationary datasets. The aim of the present study is to assess if SampEn and PermEn obtained from baseline recordings might differentiate patients with various outcomes of the head-up tilt test (HUTT). Time-domain heart rate variability (HRV) indices and several nonlinear parameters were calculated using 500 RR interval-long ECG recordings done before tilting in patients with a history suggesting vasovagal syncope. Groups of patients with so-called cardiodepressive vasovagal syncope (VVS_2) during HUTT and patients who did not faint during the test were compared. Two types of HUT tests were analyzed: with spontaneous (SB) or controlled breathing (CB). In our study, SampEn was higher in VVS_2 patients during SB, and PermEn was higher in VVS_2 patients during CB. Irrespective of the type of breathing during the test, SampEn and PermEn were similar in patients with the same type of reaction during HUTT. The use of several entropy-based parameters seems to be useful in HRV assessment in patients with vasovagal fainting.

1. Introduction

The cardiovascular system is controlled by the autonomic nervous system (ANS). In some cases, for example in vasovagal syndrome (VVS), the consequence of ANS dysfunction is an occurrence of syncope [1]. In patients with recurrent vasovagal faints, quality of life might be significantly decreased comparably to chronic illnesses. Moreover, as many referrals to the emergency department are for syncope, the cost of its management is meaningful.
In the diagnostic process of VVS, the so-called head-up tilt table test (HUTT) is often used to provoke an incident of fainting and to observe (analyze) the reaction of the heart rate and blood pressure during the event.
Various parameters of heart rate variability (HRV) are usually used to describe ANS function. The assessment of baroreceptor sensitivity might also add useful information about the mechanism of syncope, especially in patients with recurrent faints [2].
Previous studies performed in patients with a history of fainting provide contrasting results regarding standard HRV parameters, both in supine, as well as in tilted positions. Little is known about why in some patients with a typical history of vasovagal faints the head-up tilt test is negative (HUTT(−): there is no syncope as a result of tilting). There is substantial interest in the usefulness of the parameters of heart rate variability analyzed in baseline recordings (i.e., during the supine position before tilting) to differentiate patients with various reactions to HUTT. In the present paper, we analyze the features of the baseline heart rate that might characterize susceptibility to syncope during tilting.
In most of the studies, standard HRV parameters (time and/or frequency domain) were assessed, but no differences between HUTT(+) and HUTT(−) patients were found [38]. As respiratory rate and pattern might impact the results of HRV analysis, in some studies, patients were asked to breathe 15 times per min. However, baseline spectral HRV parameters were still not different in patients who fainted or did not faint during tilting (although all subjects had a typical history of vasovagal faints) [9,10]. In our study, attention is paid to the non-linear methods of HRV analysis, both during spontaneous and controlled breathing.
In patients with syncope during HUTT, various responses of heart rate and blood pressure preceding/causing a loss of consciousness are observed, and the modified VASIS classification is usually used to define subtypes of vasovagal reaction [11]. Therefore, it seems reasonable to perform analyses of HRV indices considering subgroups with different mechanisms of syncope. Guzman et al. [12] reported that baseline spectral HRV parameters were significantly different in patients with the cardiodepressive-compared with vasodepressive-type of reaction to HUTT performed during spontaneous breathing. In the study by Kochiadakis et al. [13] HUTT tests were performed during controlled breathing 15 times per min and revealed differences in baseline HF and LF spectra between groups with cardiodepressive and vasodepressive types of syncope, but some results were contradictory to the results of Guzman. In turn, Kouakam et al. [14] have not found differences between the above groups regarding spectral HRV parameters assessed in baseline recordings. In the present paper, we focus on the cardiodepressive-type of syncope as a result of HUTT and compare it with the negative reaction to the test.
There were also attempts to check if standard HRV parameters are able to predict the result of HUTT. Piccirillo [15] reported that the power of the HF spectrum might differentiate patients with positive or negative results for the test, whereas Lipsitz [16] concluded that it is impossible to predict syncope during the test using spectral HRV parameters for baseline ECG recordings.
Recently, attention was paid to non-linear methods of HRV assessment. Among them, complexity measures, such as approximate entropy (ApEn) and sample entropy (SampEn), seemed to be very promising in cardiovascular research. Significant changes of ApEn and SampEn were found to precede cardiac arrhythmias, especially episodes of atrial fibrillation [1719]. SampEn was useful for rapid identification of trauma patients with potentially lethal injuries using short ECG data recordings (reduced up to 100 RR intervals) [20]. The assessment of entropy was reported to be helpful in risk stratification after coronary artery bypass grafting [21], in heart failure patients [22] and for the assessment of fetal heart rate signal [23]. As the application of ApEn is in many cases substantially limited, we decided not to include it in our analyses. Permutation entropy (PermEn) is a new measure based on the concept of order [24]. PermEn seems to have some advantages in comparison to ApEn and SampEn, but its usefulness in the assessment of HRV has been verified in only a few cases [25,26].
In summary, the main aim of the present study was two-fold: firstly, to assess if two entropy measures based on different concepts (SampEn and PermEn) obtained from baseline ECG recordings might differentiate patients with a history of syncope suggesting vasovagal reaction and different outcomes of the head-up tilt test; secondly, to investigate the impact of controlled breathing on the above analyses.

2. Methods

2.1. SampEn

Sample entropy is a measure of the complexity of real data sequences established by Richman and Moorman [27]. SampEn enables one to distinguish time series in terms of their irregularity and unpredictability: the larger the value of SampEn, the greater the complexity of the system. Three input variables, m, r and N, should be fixed to compute SampEn (m, the length of compared runs; r, the tolerance distance expressed as a percentage of the standard deviation of the datasets; N, the length of data points). For a given set of N data, the family of statistics SampEn(m,r,N) quantifies the probability of a fact, that if m records are close, they still remain close for m + 1 records, where the proximity of records is determined by r.
Several combinations of parameters m and r are considered in the existing literature, though there are few guidelines for how to optimize their choice. For this study, m = 2 and r = 0.2 of the standard deviation SD of the datasets were used. The choice of r out of this interval may cause errors: values of r that are too large could prevent the recognition of essential features of the data; for too small value of r, the noise impact may corrupt the results.
The parameter m describes the embedding dimension; each sequence of m consecutive data represents a point in the m-dimensional phase space in which the real dynamics is reconstructed [28]. In most relatively slow signals, such as those obtained during HRV analysis, the choice of m = 2 led to satisfactory and meaningful results. On the other hand, the most recent studies suggest that for faster signals, like those generated during atrial fibrillation events, m = 3 would be more appropriate [29].
Sample entropy is an improved, more reliable version of approximate entropy introduced by Pincus [30]. The idea of the construction of SampEn is similar to ApEn, but due to slight changes in the definition (such as excluding so-called self-matches), some bias can be avoided. SampEn calculated for clinical HR data is not sensitive to missing points [31], i.e., its changes under the loss of data are not essential. SampEn is also affected little by the observational noise [32] and is more accurate than ApEn in the analysis of short records of data [27]. The comparison of the relative consistency of the two statistics is also in favor of SampEn, although both statistics lack this important property for some types of processes [27].

2.2. PermEn

In 2002, a new approach to time series analysis was proposed by Bandt and Pompe [33]. Their idea was based on assigning some symbols to data and to investigating order relations between them. This method turned out to be very useful in analyzing different types of time series. It could be applied to non-stationary data and does not need one to establish the probability density function [24]. Below, we recall the main steps of the construction of PermEn.
In order to compute PermEn, two input parameters have to be fixed: L, the number of considered patterns, and N, the length of the time series.
We consider a time series { x n } n = 1 N and a sliding window of length L: xn,…,xn+L−1. Let us denote the last finite sequence by x n n + L 1. With a given window, one can associate an ordinal pattern. Namely, the elements of the window after ordering have the form:
x π 1 < x π 2 < < x π L
which gives the permutation π = (π1, π2,…,πL). In such a case, we say that x n n + L 1 has the type of ordinal pattern π.
To illustrate the notion of an ordinal pattern, let us consider the following example: if L = 4 and xn = 1.5, xn+1 = −2, xn+2 = 0, xn+3 = 4, then the type of ordinal pattern of the analyzed window is equal to π = (2,3,1,4). In case there are equal values in the sequence, we use the following convention: if xi = xj, then we define xi < xj for i < j (cf. [24]).
Now, to define PermEn, we consider the relative frequency p(π) of each permutation pattern π in the sequence { x n } n = 1 N:
p ( π ) = # { n : 1 n N L + 1 , x n n + L 1 has type π } N L + 1 .
Finally, we get:
P e r m E n ( N , L ) = π p ( π ) ln p ( π ) .

3. Procedures

3.1. Subjects

Two subgroups of patients were included in the study: first, including subjects who breathed spontaneously during HUTT (spontaneous breathing (SB) group) and second, including patients with controlled breathing during the test (CB group). None of the subjects had organic heart disease. All patients had a history of recurring syncope and were suspected of having the vasovagal mechanism of syncope. There were no differences between the groups concerning age or gender. The study complies with the Declaration of Helsinki; informed consent was obtained from each patient. The protocol of the study was approved by the Bioethics Committee of Medical University of Gdańsk.
The SB group consisted of 30 patients (22 women; mean age 38.3 ± 16.8 years) with a negative HUTT result (NEG_SB group) and 20 patients (13 women; mean age 36.8 ± 17.1 years) with a cardiodepressive reaction (VVS_2_SB group).
The CB group consisted of 31 patients (19 women; mean age 28.7 ± 7.4 years) with a negative HUTT result (NEG_CB group) and 19 patients (14 women; mean age 27.8 ± 7.1 years) with a cardiodepressive reaction (VVS_2_CB group). The unequal proportion of NEG and VVS_2 subjects mirrors the unequal proportion that exists in our databases (in patients with a history of syncope, the result of HUTT is more often negative than positive with the cardiodepressive reaction).

3.2. Physiological Measurements

The head-up tilt test was performed in the morning, after an overnight fast. After 20 min of rest in the supine position, the 20-min recording of ECG started. Then, the table was tilted to 60 degrees. The so-called passive test lasted 30 min or until syncope occurred. In case the patient did not faint, an active test with 400 mcg of nitroglycerin (aerosol, given sublingually) was then completed. In the CB group, the HUTT tests were performed under controlled breathing to standardize the impact of breathing on heart rate [32]. Patients followed a recorded voice instruction to breathe in and out 15 times per minute (i.e., with a frequency of 0.25 Hz).
The results were interpreted according to the modified VASIS criteria [11]: if the heart rate fell to a ventricular rate of less than 40 beats/min for more than 10 s or asystole occurred for more than 3 s, the cardiodepressive-type of vasovagal reaction (VVS_2) was defined. If the patient did not faint, a negative reaction to HUTT was defined (NEG).
The reproducibility of the head-up tilt test result is poor, especially for cardiodepressive reaction, and the rate of positive responses decreases with sequential head-up tilt tests [34]. Therefore, only patients in whom HUTT was performed for the first time were included in the study, and because of this, all tested groups were comprised of different patients.
In our study, respiration was not recorded. In spectral HRV analysis, the HF peak frequency in NEG_SB was 0.215 ± 0.06 Hz and in VVS_2_SB group was 0.228 ± 0.07 Hz.
In the VVS_2_SB group, syncope occurred as a result of the passive test in 2 patients and as a result of the active test (with nitroglycerin administration) in 18 patients. In the VVS_2_CB group, syncope occurred as a result of the active test (with nitroglycerin administration) in all 19 patients.

3.3. Data Analysis

A high-resolution ECG (3 channels, 1000-Hz sampling frequency) was recorded during the test with the use of Task Force Monitor (CNSystems, Graz, Austria). The data were then carefully checked by a physician, and all artifacts were removed. Premature beats were not excluded, but abnormal RR intervals did not exceed 5% of all beats. In the present study, ECG recordings done in a supine position after 20 min of rest (baseline) were analyzed.
HRV parameters were calculated for a sample size of 500 RR intervals. In all patients, the linear parameters of heart rate variability, including time-domain analysis indices (mean RR interval, standard deviation of all normal-to-normal RR intervals (STD RR), root-mean-square of the differences of adjacent normal-to-normal RR intervals (RMSSD) and the percentage of interval differences of successive normal RR intervals greater than 50 ms (pNN50)), were obtained. Among the nonlinear parameters of heart rate variability, we calculated sample and permutation entropies (SampEn and PermEn), Poincaré plot indices (sd1, sd2) and the α1 scaling exponent by detrended fluctuation analysis (DFA α1). To calculate SampEn parameters, m = 2 and r = 0.2 SD were used. To compute PermEn, patterns of length L = 3 were analyzed.

3.4. Statistical Methods

Results are presented as the means ± SD. The distributions of variables were determined by the Shapiro–Wilk test. Differences between groups were assessed by the Student t-test or Mann–Whitney two-sample test, as appropriate. A value of p < 0.05 was considered statistically significant.
In the case of the two-sample t-test, the fact that there were different numbers of observations in subgroups was included by use of the Welch–Satterthwaite version of the t-test, if necessary. Using either the simple Student t-test or Welch’s t-test decided Levene’s test for homogeneity of variances.
For verification of two-sample test results regarding entropy measures, the MANOVA with two dependent variables, SampEn and PermEn, and three categorical factors, gender (male, female), breathing (CB, SB) and HUTT (positive, negative), was used. Appropriate post hoc tests (recommended for unequal subgroups) produced the same conclusions and confirmed the previous results.

4. Results

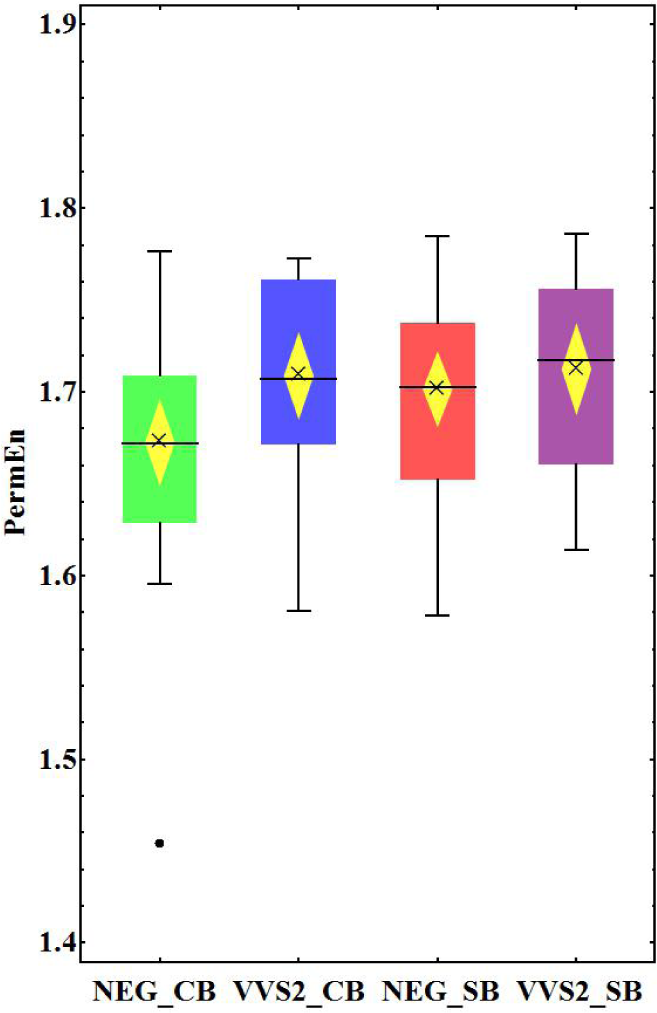
4.1. NEG vs. VVS_2 Groups

Patients with cardiodepressive reaction to HUTT performed during spontaneous breathing (VVS_2_SB group) had significantly higher values of SampEn in baseline recordings compared to patients who did not faint during the study. Interestingly, at baseline, VVS_2_SB patients had also a significantly slower heart rate and higher values of RMSSD and pNN50 (Table 1).
In patients who were on controlled breathing during HUTT, baseline HRV parameters did not differ significantly, except for PermEn, which was higher in the VVS_2_CB group. RR and SampEn also tended to be higher in the VVS_2_CB group, but the differences did not reach statistical significance. All results for the comparison between NEG_CB and VVS_2_CB groups are presented in Table 2.
Mean values of ordinal patterns frequencies (length L = 3) in all studied groups are presented in Table 3.

4.2. Spontaneous vs. Controlled Breathing

Comparisons between HRV parameters in patients with the same results of HUTT, but different modes of breathing during tests were also performed, and their results are presented in Tables 4 and 5. Controlled breathing resulted in a significantly slower heart rate (i.e., longer mean RR interval) in patients who did not faint during the test. In patients with syncope as a result of HUTT, not only the heart rate was slower, but also SDNN, RMSSD, pNN50, sd1 and sd2 were significantly different in groups with controlled breathing during HUTT. In contrast, entropy-based parameters were not different in groups with the same results of HUTT irrespective of the type of respiration. Mean and median values of SampEn and PermEn in all studied subgroups are presented in Figures 1 and 2.

5. Discussion

5.1. NEG vs. VVS_2 Groups

The pathophysiology of vasovagal syncope is still unclear, and conflicting results on autonomic control during HUTT have been published. In most of the studies inquiring into vasovagal faints using standard HRV parameters, the baseline characteristics of patients with a history of fainting were used, but various reactions during HUTT did not vary [37]. However, some differences were noted if the studied groups were divided according to the type of vasovagal reaction [12,13]. This suggests that various types of vasovagal syncope (e.g., mixed, cardiodepressive and vasodepressive) differ so much in heart rate properties that no specific features can be found in groups that combine all types of VVS. That is why as a first step, we decided to select from VVS patients a smaller, but relatively homogenous group with quite well-defined vasovagal reaction. Therefore, in the present study, we compare patients with a negative result of HUTT with patients developing cardiodepressive syncope during the test. All examined subjects experienced syncope in the past. We believe that this enabled us to see the differences presented above. In our study, patients with a cardiodepressive reaction had distinct properties of the baseline heart rate, which made them more sensitive to the orthostatic stress.
During spontaneous breathing, VVS_2 patients had a slower heart rate and higher (RMSSD and pNN50) heart rate variability, which is in contrast to the studies by Lippman [6] and Grimm [5], who did not report significant differences between VVS and NEG baseline parameters, but the VVS group consisted of patients with all types of vasovagal reaction during HUTT.
To our knowledge, our work is the first study that compares baseline values of SampEn and PermEn in patients with the cardiodepressive reaction to HUTT and subjects with a history of fainting, but without syncope during tilt-table testing. SampEn was able to differentiate the above groups in the case that HUTT was performed on spontaneous breathing, and PermEn was significantly different between the VVS_2 and NEG groups in the case of controlled breathing. Previous studies reported that heart rhythm complexity decreases during sympathetic activation. In a study by Porta et al., entropy indices decreased progressively with increasing tilt-table inclination [35]. The decrease of entropy as a consequence of the sympathetic activation during orthostatic challenge was also shown by Turianikova et al. [36]. On the other hand, pharmacological autonomic blockade with atropine, as well as propranolol combined with atropine have also decreased heart entropy, suggesting that vagal activity is the main modulator of heart rate complexity [37]. A recent study by Weipert [38] indicates that both vagal and sympathetic modulations contribute to heart rate complexity, and what is more, different autonomic states might result in the same value of SampEn (e.g., reciprocal changes of vagal and sympathetic systems and co-activation of both systems).
Although all of the above-mentioned studies [35,36,38] were done in healthy volunteers (in contrast to our population, consisting of patients with a history of recurrent syncope), we can use them to explain why a faster heart rate and lower complexity in the NEG group, observed in a supine position, could prevent vasovagal syncope during tilt. We hypothesize that NEG patients have high sympathetic modulation and decreased vagal activity at baseline, which balance autonomic changes during HUTT (increased vagal and decreased sympathetic activations) and make the system more resistant against the orthostatic stress.
During controlled breathing, PermEn was significantly lower in NEG patients, while other parameters did not differ between the VVS_2 and NEG groups. Permutation entropy based on a concept of order relations assessed for intervals between heart beats gives additional information about the complexity of the signal [39]. Permutation entropy was previously successfully applied for the analysis of electroencephalogram, heart rate or financial data. Recently, it was shown that for EEG signal analysis, various types of entropy (ApEn, SampEn, PermEn and conditional entropy) provide different information about the time series complexity [40]. The combination of various types of entropy (for example, SampEn and PermEn) enabled the authors to separate EEG signals recorded in healthy individuals, epileptic patients in a seizure-free period and epileptic patients during a seizure period.
In our study, PermEn revealed special features of the heart rhythm in patients asked to breathe with a frequency of 0.25 Hz, which led to changes in the distribution of heart rate patterns. There was an increase in the percentage of acceleration and deceleration runs, which caused the decrease of PermEn values concerning the NEG_CB group (Table 3). In our previous work, we analyzed the distribution of patterns in 97 healthy volunteers and concluded that acceleration and deceleration runs seem to be mostly related to sympathetic influences [41]. In fact, this supports our hypothesis that in patients with vasovagal faints, high baseline sympathetic modulation prevents the incidence of syncope during the head-up tilt.

5.2. Spontaneous vs. Controlled Breathing

Irrespective of the type of breathing during HUTT, SampEn and PermEn remained similar in patients with the same type of reaction at the end of the test. It seems that entropy-based parameters are not sensitive to the mode of respiration in characterizing patients who will faint as a result of HUTT. However, the rate of respiration has to be considered. In a study by Porta et al. [42], the regularity of the heart rate time series (assessed using conditional entropy) has not changed during respiration of 15 breathes/min compared to spontaneous breathing, which is in agreement with our results. However, controlled respiration with 10 breathes/min resulted in increased regularity. Our findings reassure us that the standard HRV parameters depend largely on the respiration rate, which might impact the results of the studies concerning head-up tilt tests. Controlled breathing during HUTT is usually considered to make the analysis of HRV more easy for interpretation, because it should standardize the impact of breathing on heart rate. This seems reasonable, because in the majority of studies, respiration is not recorded. However, our results indicate that controlled breathing might significantly change the heart rate in all patients. Moreover, in the VVS_2 group, this kind of breathing influenced also SDNN, RMSSD, pNN50, sd1 and sd2. Therefore, the interpretation of HRV and autonomic nervous system activity is even more difficult. Moreover, some limitations of the study include that during HUTT with controlled breathing, patients had to follow a voice instruction to breath in and out, which could be a difficult and disturbing element (at least for some patients) and might impact the results.

5.3. Aspect of Gender

In our study, the groups were not balanced in terms of sex, because the selection of patients was done only in regard to the type of reaction to HUTT (NEG or VVS_2) and the quality of the recording. Therefore, the proportion of men and women in our study mirrors the unequal proportion of both sexes in our population of vasovagal patients, which is in agreement with data from previous studies analyzing the epidemiology of reflex syncope in relatively young populations [43,44]. However, the complexity of the heart rate strongly depends on age and gender [45], which is confirmed by very recent studies using conditional entropy [46], as well as symbolic dynamics methods [47]. Because of the small number of patients in each group, we are not able to perform additional analyses focused on age and gender, but further studies are needed to check whether differences in entropy-based parameters between the NEG and VVS_2 groups are gender dependent.

6. Conclusions

  • In baseline recordings, SampEn and PermEn were able to show differences between groups with cardiodepressive or negative results for HUTT.
  • Various entropy-based methods provide distinct information about heart rate complexity.
  • In contrast to standard HRV parameters, SampEn and PermEn showed no significant differences when a comparison of the groups with the same reaction to HUTT, but different modes of respiration (NEG_SB vs. NEG_CB and VVS_2_SB vs. VVS_2_CB) was performed.
  • Further studies in bigger groups of patients are needed to validate the above results.

Acknowledgments

The work was supported by the National Science Centre, Poland, UMO: 2012/06/M/ST2/00480, and by the Foundation for Polish Science within the SKILLS project co-financed with European Union funds from the European Social Fund (No. 172/UD/SKILLS/2012).
  • PACS classifications: 87.19.Hh; 89.70.Cf

List of Abbreviations

ApEn
approximate entropy
HUTT
head-up tilt test
HUTT(−)
negative result of head-up tilt test (no syncope)
HUTT(+)
positive result of head-up tilt test (syncope)
NEG_CB
group with HUTT(−) and controlled breathing
NEG_SB
group with HUTT(−) and spontaneous breathing
PermEn
permutation entropy
SampEn
sample entropy
VVS_2_CB
group with HUTT(+) and controlled breathing
VVS_2_SB
group with HUTT(+) and spontaneous breathing

Author Contributions

Beata Graff: conception and design of the study, interpretation of the data, drafting the article. Grzegorz Graff: conception and design of the study, interpretation of the data, drafting the article. Danuta Makowiec: conception of the study, interpretation of the data, critical revision of the manuscript. Agnieszka Kaczkowska: analysis and interpretation of the data, drafting the article. Dorota Wejer: analysis and interpretation of the data. Szymon Budrejko: acquisition of the data, reviewed relevant literature. Dariusz Kozłowski: acquisition of the data, reviewed relevant literature. Krzysztof Narkiewicz: critical revision of the manuscript. All authors have read and approved the final manuscript.

Conflicts of Interest

The authors declare no conflicts of interest.

References

  1. Alboni, P.; Furlan, R. (Eds.) Vasovagal Syncope; Springer: Basel, Switzerland, 2015.
  2. Mosqueda-Garcia, R.; Fernandez-Violante, R.; Tank, J.; Snell, M.; Cunningha, G.; Furlan, R. Yohimbine in neurally mediated syncope. Pathophysiological implications. J. Clin. Invest. 1998, 102, 1824–1830. [Google Scholar]
  3. Folino, A.F.; Russo, G.; Porta, A.; Buja, G.; Cerutti, S.; Iliceto, S. Modulations of autonomic activity leading to tilt-mediated syncope. Int. J. Cardiol. 2007, 120, 102–107. [Google Scholar]
  4. Freitas, J.; Pereira, S.; Lago, P.; Costa, O.; Carvalho, M.J.; Falcão de Freitas, A. Impaired arterial baroreceptor sensitivity before tilt-induced syncope. Europace 1999, 1, 258–265. [Google Scholar]
  5. Grimm, W.; Wirths, A.; Hoffmann, J.; Menz, V.; Maisch, B. Heart rate variability during head-up tilt testing in patients with suspected neurally mediated syncope. Electrophysiology 1998, 21, 2411–2415. [Google Scholar]
  6. Lippman, N.; Stein, K.M.; Lerman, B.B. Failure to decrease parasympathetic tone during upright tilt predicts a positive tilt-table test. Am. J. Cardiol. 1995, 75, 591–595. [Google Scholar]
  7. Morillo, C.A.; Klein, G.J.; Jones, D.L.; Yee, R. Time and frequency domain analyses of heart rate variability during orthostatic stress in patients with neurally mediated syncope. Am. J. Cardiol. 1994, 74, 1258–1262. [Google Scholar]
  8. Tulppo, M.P.; Hughson, R.L.; Mäkikallio, T.H.; Airaksinen, K.E.J.; Seppänen, T.; Huikuri, H.V. Effects of exercise and passive head-up tilt on fractal and complexity properties of heart rate dynamics. Am. J. Physiol. Heart Circ. Physiol. 2001, 280, H1081–H1087. [Google Scholar]
  9. Kochiadakis, G.E.; Orfanakis, A.; Chryssostomakis, S.I.; Manios, E.G.; Kounali, D.K.; Vardas, P.E. Autonomic nervous system activity during tilt testing in syncopal patients, estimated by power spectral analysis of heart rate variability. Pacing. Clin. Electrophysiol. 1997, 20, 1332–1341. [Google Scholar]
  10. Kochiadakis, G.E.; Rombola, A.T.; Kanoupakis, E.M.; Simantirakis, E.N.; Chlouverakis, G.I.; Vardas, P.E. Assessment of autonomic function at rest and during tilt testing in patients with vasovagal syncope. Am. Heart J. 1997, 134, 459–466. [Google Scholar]
  11. Brignole, M.; Menozzi, C.; Rosso, A.D.; Costa, S.; Gaggioli, G.; Bottoni, N.; Bartoli, P.; Sutton, R. New classification of haemodynamics of vasovagal syncope: Beyond the VASIS classification. Analysis of the pre-syncopal phase of the tilt test without and with nitroglycerin challenge. Vasovagal Syncope International Study. Europace 2000, 2, 66–76. [Google Scholar]
  12. Guzmán, C.E.; Sánchez, G.M.; Márquez, M.F.; Hermosillo, A.G.; Cárdenas, M. Differences in heart rate variability between cardioinhibitory and vasodepressor responses to head-up tilt table testing. Arch. Med. Res. 1999, 30, 203–211. [Google Scholar]
  13. Kochiadakis, G.E.; Kanoupakis, E.M.; Igoumenidis, N.E.; Marketou, M.E.; Solomou, M.C.; Vardas, P.E. Spectral analysis of heart rate variability during tilt-table testing in patients with vasovagal syncope. Int. J. Cardiol. 1998, 64, 185–194. [Google Scholar]
  14. Kouakam, C.; Lacroix, D.; Zghal, N.; Logier, R.; Klug, D.; Franc, P.L.; Jarwe, M.; Kacet, S. Inadequate sympathovagal balance in response to orthostatism in patients with unexplained syncope and a positive head up tilt test. Heart 1999, 82, 312–318. [Google Scholar]
  15. Piccirillo, G.; Naso, C.; Moise, A.; Lionetti, M.; Carlo, M.N.S.D.; Laurentis, D.; Magri, D.; Cacciafesta, M.; Marigliano, V. Heart rate and blood pressure variability in subjects with vasovagal syncope. Clin. Sci. (Lond.) 2004, 107, 55–61. [Google Scholar]
  16. Lipsitz, L.A.; Wei, J.Y.; Rowe, J.W. Syncope in an elderly, institutionalised population: Prevalence, incidence, and associated risk. Q. J. Med. 1985, 55, 45–54. [Google Scholar]
  17. Vikman, S.; Mäkikallio, T.H.; Yli-Mäyry, S.; Pikkujämsä, S.; Koivisto, A.M.; Reinikainen, P.; Airaksinen, J.; Huikuri, H.V. Altered Complexity and Correlation Properties of R-R Interval Dynamics Before the Spontaneous Onset of Paroxysmal Atrial Fibrillation. Circulation 1999, 100, 2079–2084. [Google Scholar]
  18. Tuzcu, V.; Nas, S.; Borklu, T.; Ugur, A. Decrease in the heart rate complexity prior to the onset of atrial fibrillation. Europace 2006, 8, 398–402. [Google Scholar]
  19. Shin, D.G.; Yoo, C.S.; Yi, S.H.; Bae, J.H.; Kim, Y.J.; Park, J.S.; Hong, G.R. Prediction of Paroxysmal Atrial Fibrillation Using Nonlinear Analysis of the R-R Interval Dynamics Before the Spontaneous Onset of Atrial Fibrillation. Circ. J. 2006, 70, 94–99. [Google Scholar]
  20. Batchinsky, A.I.; Salinas, J.; Kuusela, T.; Necsoiu, C.; Jones, J.; Cancio, L. Rapid prediction of trauma patient survival by analysis of heart rate complexity: Impact of reducing data set size. Shock 2009, 32, 565–571. [Google Scholar]
  21. Hogue, C.W.J.; Domitrovich, P.P.; Stein, P.K.; Despotis, G.D.; Re, L.; Schuessler, R.B.; Kleiger, R.E.; Rottman, J.N. RR interval dynamics before atrial fibrillation in patients after coronary artery bypass graft surgery. Circulation 1998, 98, 429–434. [Google Scholar]
  22. Signorini, M.G.; Ferrario, M.; Marchetti, M.; Marseglia, A. Prediction of Paroxysmal Atrial Fibrillation Using Nonlinear Analysis of the R-R Interval Dynamics Before the Spontaneous Onset of Atrial Fibrillation. Conf. Proc. IEEE Eng. Med. Biol. Soc. 2006, 1, 3431–3434. [Google Scholar]
  23. Ferrario, M.; Signorini, M.G.; Magenes, G.; Cerutti, S. Comparison of Entropy-Based Regularity Estimators: Application to the Fetal Heart Rate Signal for the Identification of Fetal Distress. IEEE Trans. Biomed. Eng. 2006, 53, 119–125. [Google Scholar]
  24. Amigó, J.M. Permutation Complexity in Dynamical Systems; Springer: Berlin/Heidelberg, Germany, 2010. [Google Scholar]
  25. Graff, B.; Graff, G.; Kaczkowska, A. Entropy Measures of Heart Rate Variability for Short ECG Datasets in Patients with Congestive Heart Failure. Acta Physica Polonica B Proc. Suppl. 2012, 5, 153–158. [Google Scholar]
  26. Parlitz, U.; Berg, S.; Luther, S.; Schirdewan, A.; Kurths, J.; Wessel, N. Classifying cardiac biosignals using ordinal pattern statistics and symbolic dynamics. Comput. Biol. Med. 2012, 42, 319–327. [Google Scholar]
  27. Richman, J.S.; Moorman, J.R. Physiological time-series analysis using approximate entropy and sample entropy. Am. J. Physiol. Heart Circ. Physiol. 2000, 278, H2039–H2049. [Google Scholar]
  28. Takens, F. Detecting strange attractors in turbulence. In Dynamical Systems and Turbulence; Springer: Berlin/Heidelberg, Germany, 1981; pp. 366–381. [Google Scholar]
  29. Alcaraz, R.; Abasolo, D.; Hornero, R.; Rieta, J.J. Optimal parameters study for sample entropy-based atrial fibrillation organization analysis. Comput. Methods Programs Biomed. 2010, 99, 124–132. [Google Scholar] [Green Version]
  30. Pincus, S.M. Approximate entropy as a measure of system complexity. Proc. Natl. Acad. Sci. USA 1991, 88, 2297–2301. [Google Scholar]
  31. Lake, D.E.; Richman, J.S.; Griffin, M.P.; Moorman, J.R. Sample entropy analysis of neonatal heart rate variability. Am. J. Physiol. Regul. Integr. Comp. Physiol. 2002, 283, R789–R797. [Google Scholar]
  32. Ramdani, S.; Bouchara, F.; Lagarde, J. Influence of noise on the sample entropy algorithm. Chaos 2009, 19, 013123. [Google Scholar]
  33. Bandt, C.; Pompe, B. Permutation Entropy: A Natural Complexity Measure for Time Series. Phys. Rev. Lett. 2002, 88. [Google Scholar] [CrossRef]
  34. Sagristá-Sauleda, J.; Romero, B.; Permanyer-Miralda, G.; Moya, A.; Soler-Soler, A. Reproducibility of sequential head-up tilt testing in patients with recent syncope, normal ECG and no structural heart disease. Eur. Heart J. 2002, 23, 1706–1713. [Google Scholar]
  35. Porta, A.; Gnecchi-Ruscone, T.; Tobaldini, E.; Guzzetti, S.; Furlan, R.; Montano, N. Progressive decrease of heart period variability entropy-based complexity during graded head-up tilt. J. Appl. Physiol. (1985) 2007, 103, 1143–1149. [Google Scholar]
  36. Turianikova, Z.; Javorka, K.; Baumert, M.; Calkovska, A.; Javorka, M. The effect of orthostatic stress on multiscale entropy of heart rate and blood pressure. Physiol. Meas. 2011, 32, 1425–1437. [Google Scholar]
  37. Porta, A.; Castiglioni, P.; Bari, V.; Bassani, T.; Marchi, A.; Cividjian, A.; Quintin, L.; Rienzo, M.D. K-nearest-neighbor conditional entropy approach for the assessment of short-term complexity of cardiovascular control. Physiol. Meas. 2013, 34, 17–33. [Google Scholar]
  38. Weippert, M.; Behrens, M.; Rieger, A.; Behrens, K. Sample Entropy and Traditional Measures of Heart Rate Dynamics Reveal Different Modes of Cardiovascular Control During Low Intensity Exercise. Entropy 2014, 16, 5698–5711. [Google Scholar]
  39. Zanin, M.; Zunino, L.; Rosso, O.A.; Papo, D. Permutation entropy and its main biomedical and econophysics applications: A review. Entropy 2012, 14, 1553–1577. [Google Scholar]
  40. Keller, K.; Unakafov, A.M.; Unakafova, V.A. Ordinal Patterns, Entropy, and EEG. Entropy 2014, 16, 6212–6239. [Google Scholar]
  41. Graff, G.; Graff, B.; Kaczkowska, A.; Makowiec, D.; Amigó, J.M.; Piskorski, J.; Narkiewicz, K.; Guzik, P. Ordinal pattern statistics for the assessment of heart rate variability. Eur. Phys. J. Spec. Top. 2013, 222, 525–534. [Google Scholar]
  42. Porta, A.; Guzzetti, S.; Montano, N.; Pagani, M.; Somers, V.; Malliani, A.; Baselli, G.; Cerutti, S. Information domain analysis of cardiovascular variability signals: Evaluation of regularity, synchronisation and co-ordination. Med. Biol. Eng. Comput. 2000, 38, 180–188. [Google Scholar]
  43. Colman, N.; Nahm, K.; Ganzeboom, K.S.; Shen, W.K.; Reitsma, J.B.; Linzer, M.; Wieling, W.; Kaufmann, H. Epidemiology of reflex syncope. Clin. Auton. Res. 2004, 14, I/9–I/17. [Google Scholar]
  44. Kenny, R.A.; Bhangu, J.; King-Kallimanis, B.L. Epidemiology of syncope/collapse in younger and older Western patient populations. Prog. Cardiovasc. Dis. 2013, 55, 357–363. [Google Scholar]
  45. Ryan, S.M.; Goldberger, A.L.; Pincus, S.M.; Mietus, J.; Lipsitz, L.A. Gender- and age-related differences in heart rate dynamics: Are women more complex than men? J. Am. Coll. Cardiol. 1994, 24, 1700–1707. [Google Scholar]
  46. Catai, A.M.; Takahashi, A.C.; Perseguini, N.M.; Milan, J.C.; Minatel, V.; Rehder-Santos, P.; Marchi, A.; Bari, V.; Porta, A. Effect of the Postural Challenge on the Dependence of the Cardiovascular Control Complexity on Age. Entropy 2014, 16, 6686–6704. [Google Scholar]
  47. Mueller, A.; Bonnemeier, H.; Malberg, H.; Kurths, J.; Wessel, N. Age-dependent changes in the manifestations of gender-related differences in the cardiovascular regulation. Proceedings of the 8th Conference of the European Study Group on Cardiovascular Oscillations (ESGCO 2014), Trento, Italy, 25–28 May 2014; pp. 147–148.
Figure 1. SampEn in all studied subgroups (horizontal whiskers depict the upper and lower fence (Q1-1.5IQR, Q3+1.5IQR), where IQR = Q3-Q1 and Q1, Q3 are quartiles, x denotes the mean value and the yellow diamond depicts the mean confidence interval).
Entropy 17 01007f1
Figure 2. PermEn in all studied subgroups (horizontal whiskers depict the upper and lower fence (Q1-1.5IQR, Q3+1.5IQR), where IQR = Q3-Q1 and Q1, Q3 are quartiles, x denotes the mean value and the yellow diamond depicts the mean confidence interval).
Entropy 17 01007f2
Table 1. Comparison of heart rate variability (HRV) parameters in the negative head-up tilt test result (NEG) and cardiodepressive vasovagal syncope (VVS_2) groups in baseline recordings during spontaneous breathing.
NEG_SBVVS_2_SBp
RR753.00 ± 24.200834.00 ± 22.2000.024
SDNN45.90 ± 5.20048.60 ± 3.6800.140
RMSSD28.70 ± 4.40033.30 ± 3.1900.049
pNN507.23 ± 2.05013.00 ± 2.7500.018
α11.18 ± 0.0411.11 ± 0.0330.197
sd120.30 ± 3.11023.60 ± 2.2600.051
sd261.10 ± 6.81064.50 ± 4.8100.163
SampEn1.29 ± 0.0571.47 ± 0.0570.040
PermEn1.70 ± 0.0101.71 ± 0.0120.490
Table 2. Comparison of HRV parameters in NEG and VVS_2 groups in baseline recordings during controlled breathing.
NEG_CBVVS_2_CBp
RR858.00 ± 25.300909.00 ± 27.7000.069
SDNN59.30 ± 7.09063.40 ± 6.0200.308
RMSSD46.90 ± 8.66047.70 ± 5.6500.223
α11.06 ± 0.0510.97 ± 0.0610.286
sd133.20 ± 6.13033.80 ± 4.0000.223
sd276.00 ± 8.25082.20 ± 8.0200.348
SampEn1.37 ± 0.0471.50 ± 0.0690.112
PermEn1.67 ± 0.0121.71 ± 0.0110.048
Table 3. Mean values ± SD (expressed in %) of ordinal patterns frequencies (length L = 3) in all studied groups. SB, spontaneous breathing; CB, controlled breathing.
PatternNEG_SBVVS_2_SBNEG_CBVVS_2_CB
(1 2 3)26.59 ± 4.8325.66 ± 4.5027.35 ± 5.5525.68 ± 5.08
(3 2 1)23.92 ± 6.8824.35 ± 5.1527.57 ± 5.1724.60 ± 5.71
(1 3 2)11.61 ± 2.5712.02 ± 2.5711.02 ± 2.6412.27 ± 2.86
(3 1 2)13.13 ± 2.9612.97 ± 2.5511.53 ± 2.5112.59 ± 2.59
(2 3 1)13.64 ± 3.1113.74 ± 2.1311.45 ± 2.8013.35 ± 2.33
(2 1 3)11.11 ± 2.2611.26 ± 2.7311.08 ± 2.2511.51 ± 2.59
Table 4. Comparison of baseline HRV parameters in groups with a negative result of head-up tilt test (HUTT) and different modes of respiration during the test.
NEG_SBNEG_CBp
RR753.00 ± 24.200858.00 ± 25.3000.004
SDNN45.90 ± 5.20059.30 ± 7.0900.082
RMSSD28.70 ± 4.40046.90 ± 8.6600.075
pNN507.23 ± 2.05019.00 ± 3.8600.054
α11.18 ± 0.0411.06 ± 0.0510.072
sd120.30 ± 3.11033.20 ± 6.1300.075
sd261.10 ± 6.81076.00 ± 8.2500.087
SampEn1.29 ± 0.0571.37 ± 0.0470.316
PermEn1.70 ± 0.0101.67 ± 0.0120.080
Table 5. Comparison of baseline HRV parameters in groups with cardiodepressive reaction during HUTT and different modes of respiration during the test.
VVS_2_SBVVS_2_CBp
RR834.00 ± 22.200909.00 ± 27.7000.036
SDNN48.60 ± 3.68063.40 ± 6.0200.032
RMSSD33.30 ± 3.19047.70 ± 5.6500.042
pNN5013.00 ± 2.75023.00 ± 3.8600.039
α11.11 ± 0.0330.97 ± 0.0610.053
sd123.60 ± 2.26033.80 ± 4.0000.042
sd264.50 ± 4.81082.20 ± 8.0200.048
SampEn1.47 ± 0.0571.50 ± 0.0690.761
PermEn1.71 ± 0.0121.71 ± 0.0110.825

