Article

Entropic Measures of Complexity of Short-Term Dynamics of Nocturnal Heartbeats in an Aging Population

by
Danuta Makowiec
1,*,
Agnieszka Kaczkowska
2,
Dorota Wejer
1,
Marta Żarczyńska-Buchowiecka
3 and
Zbigniew R. Struzik
1,4,5
1
Institute of Theoretical Physics and Astrophysics, University of Gdańsk, 80-952 Gdańsk, ul. Wita Stwosza 57, Poland
2
Faculty of Applied Physics and Mathematics, Gdańsk University of Technology, 80-233 Gdańsk, ul. Narutowicza 11/12, Poland
3
Chair & Clinic of Cardiology, Medical University of Gdańsk, 80-211 Gdańsk, ul. Dȩbinki 7, Poland
4
RIKEN Brain Science Institute, 2-1 Hirosawa, 351-0198 Wako-shi, Japan
5
Graduate School of Education, The University of Tokyo, 7-3-1 Hongo, Bunkyo-ku, 113-0033 Tokyo, Japan
*
Author to whom correspondence should be addressed.
Entropy 2015, 17(3), 1253-1272; https://0-doi-org.brum.beds.ac.uk/10.3390/e17031253
Submission received: 31 December 2014 / Revised: 21 February 2015 / Accepted: 10 March 2015 / Published: 13 March 2015
(This article belongs to the Special Issue Entropy and Cardiac Physics)

Abstract

:
Two entropy-based approaches are investigated to study patterns describing differences in time intervals between consecutive heartbeats. The first method explores matrices arising from networks of transitions constructed following events represented by a time series. The second method considers distributions of ordinal patterns of length three, whereby patterns with repeated values are counted as different patterns. Both methods provide estimators of dynamical aspects of short-term heartbeat signals obtained from nocturnal Holter electrocardiogram (ECG) recordings of healthy people of different ages and genders. The deceleration capacity, arising from the adjacency matrix of the network, and the entropy rate, resulting from the transition matrix of the network, are also calculated, and both significantly decay with aging. As people age, the permutation entropy grows, due to the increase in patterns with repeated values. All of these estimators describe in a consistent way changes in the beat-to-beat heart period dynamics caused by aging. An overall slowing down of heart period changes is observed, and an increase of permutation entropy results from the progressive increase of patterns with repeated values. This result points to the sympathetic drive becoming dominant in cardiac regulation of nocturnal heart rate with age.

1. Introduction

Cardiac physics utilizes the notion of entropy in many ways. Investigations into time intervals between subsequent heartbeats, estimated by the time distance between two subsequent R peaks in a ECG recording, and therefore called RR-intervals, continue to broaden our understanding of the regulation of the cardiovascular (CV) system [1,2]. Entropic measures are assumed to serve as consistent and fair estimates of nonstationary signals and of signals with uncertain values because of inaccuracy or incoherence in recordings [3]. In the following, entropy-based methods are developed and applied to RR-interval signals recorded during the subjects’ nocturnal rest to identify changes in the heart rhythm, called RR-increments, caused by healthy aging. The first method explores tools arising from a network representation of a time series [4,5]. The adjacency matrix of the network of RR-increments is used to obtain an approximation of the deceleration capacity, the measure that results from the phase-rectified signal averaging (PRSA) method [6] and that has been successful in predicting mortality in post-infraction patients [7]. The transition matrix of this network leads to the Markov characterization of the dynamics, and hence, it provides the entropy rate as an estimator of the total complexity of the time series. This approach is a continuation of our earlier investigations into the usability of network theory tools in the assessment of RR-time interval signals [8]. Our second method is based on the distribution of ordinal patterns and the resulting permutation entropy [1,9,10]. However, because we deal with recordings of 8-ms resolution, we address methods that enable us to consider events with repeated values [11].
The autonomic nervous system (ANS) and circulating hormones serve as important mechanisms for regulating CV function [12]. The two branches of the ANS: the sympathetic and vagal subsystems, cooperate in what is known as a baroreflex loop, to maintain a preset value for arterial pressure, which ensures that the arterial pressure is adequate for the proper perfusion of the organs. The regulation of the ANS is coordinated by the central nervous system, which additionally monitors the actual needs of the organism. With advancing age, there is strong evidence of increased activity of the sympathetic subsystem and a possible increment in activity of the vagal part of the ANS; see [13,14]. Although data show that the baroreceptor reflex is intact during normal aging [15], decreased sensitivity of adrenergic receptors in the heart and blood vessels and altered responsiveness of the baroreceptors in the aorta and carotid arteries impair the baroreflex regulation [14,16]. As a consequence, impairment of the functioning of the complex interplay between many parts of the regulatory system is observed [14,16].
The phenomenon of age-related ANS-CV deterioration has been revealed in the form of noticeable alterations in cardiac interbeat RR-interval dynamics measured by means of what is known as heart rate variability (HRV) [17]. Signals with RR-intervals derived from long-term ECG recordings have been widely used in assessing ANS responses during normal activities in health and disease [16,1827]. The reasons for the observed variations are far from being completely understood [28]. Nevertheless, HRV remains the surrogate index of cardiac autonomic function in the sinus node and ventricles and is a marker of imbalanced sympathetic/vagal activity [28,29]. In particular, in [18], a significant decrease with age was shown in indices estimating overall HRV. However, for indices that describe the short-term components of HRV and, therefore, they are thought to reflect the vagal modulation, no significant change was observed. In [24], a progressive increase in vagal dominance in the sympatho-vagal balance was postulated. An alteration in long-range organization, as well as a loss of complexity, have been reported by [20,23], although fractal scale-invariance and nonlinear properties have been claimed to be stable with advancing age [30].
A twenty-four hour ECG Holter recording consists of two main parts: diurnal and nocturnal, which correspond with the two different states of human activity. The nocturnal part provides the possibility to gain insight into the state of the autonomic baseline, because sleep can be assumed to be a period of human activity that is free of external stimulation [31]. Normal sleep is characterized by a fall in blood pressure and an increase in heart period RR-interval, which indicates increased vagal tone. However, sleep is organized in cycles, each lasting about 90 minutes, in which stages of slow-wave sleep (non-rapid eye movement sleep, NREM) are followed by rapid eye movement (REM) sleep [32,33]. HRV has been found to be strongly affected by this sleep organization, i.e., the vagal modulation and sympathetic activity follow the sleep stages [34,35]. Aging manifests in a decrease in the proportion of the deeper, more restorative parts of the slow-wave sleep [33,36]. This is accompanied by increased light sleep (known as Stages 1 and 2 of NREM) and also a large number and frequency of arousals and extended durations of waking after sleep onset [37]. Hence, the HRV of nocturnal signals reflects the effects of the autonomic regulation undergoing transitions in physiological couplings caused by the cyclic organization of sleep [38].
Different mechanisms are responsible for heart accelerations and decelerations [12]. Since adjustments caused by the sympathetic system are slow, on a scale of seconds, whereas adjustments by the vagal system are fast [29], by the qualification and quantification of RR-increments, we gain insight into the particular mechanisms driving short-term heartbeat dynamics across sleep stages. We then describe the levels of the two autonomic tones [39]: sympathetic and vagal. In this way, the approaches discussed in the paper describe consistently how ANS attenuation influences beat-to-beat heart period dynamics.

2. Materials and Methods

2.1. Signal Preprocessing

Twenty-four-hour ambulatory ECG recording was performed in 194 healthy volunteers without known cardiac events in the past. The volunteers were divided into 14 groups depending on gender and age; see Table 1.
The ECG signal analysis was performed in steps. Firstly, Del Mar Reynolds Impresario software was used to find premature, supraventricular and ventricular beats, missed beats and pauses. Next, each signal was thoroughly corrected manually and annotated correspondingly by an experienced cardiologist. Then, as nocturnal RR-intervals are longer than diurnal ones, the six-hour period, compatible with the sleep of the subject, was extracted for each signal individually. The range of periods studied was: 12% at 21:00–03:00, 15% at 22:00–04:00, 23% at 23:00–05:00, 35% at 24:00-06:00 and 15% at 01:00–07:00. The perturbations in a signal, i.e., annotated artifacts or not normal-to-normal RR-intervals, were edited according to the following rules. If the perturbation consisted of less than or equal to five consecutive abnormal RR-intervals, these abnormal RR-intervals were replaced by the medians calculated from the last seven proper RR-intervals. In the other cases, when the perturbation was longer than five consecutive heartbeats, such perturbation was deleted, which was annotated thoroughly for the proper construction of accelerations and decelerations. In total, the editing was applied to less than 1% of RR-intervals. A few exceptions, where editing covered more than 1%, but less than 5%, were related to signals obtained from the elderly. Finally, each signal studied contained at least 20,000 normal-to-normal RR-intervals.
The Holter recorders used by us registered ECG signals with a 128-Hz sampling frequency, which sets the resolution of RR-intervals to about 8 ms. Therefore, all of the RR-intervals and the resulting RR-increments are multiples of 8 ms. The signal resolution then becomes an obvious option for the discrete methods of symbolic dynamics.
The time sequence of RR-intervals RR = {RR0, ⋯, RRi, ⋯, RRN} (i is the time index) is the basis for the construction of signals with RR-increments ΔRR = {δRR1, ⋯, δRRi, ⋯, δRRN}, where δRRi = RRi − RRi−1. Hence, a deceleration in heart rate is described by δRRi > 0, while an acceleration is described by δRRi < 0. When we do not observe a change between consecutive RR-intervals, i.e. δRRi = 0, we say that a no-change event has taken place.
After arranging the signal values, we obtain the state space of RR-increments, which is composed of a finite number of multiplies of 8 ms: 0, ±8, ±16, ⋯ ms. These values, when sorted ascending from the greatest acceleration (the greatest negative value) to the greatest deceleration (the greatest positive value), will be described as:
Δ J { Δ K , , 0 , , Δ K } , Δ K = max i { | δ R R i | } .
All of the results presented, unless otherwise indicated, were obtained with the accuracy of the signal resolution.

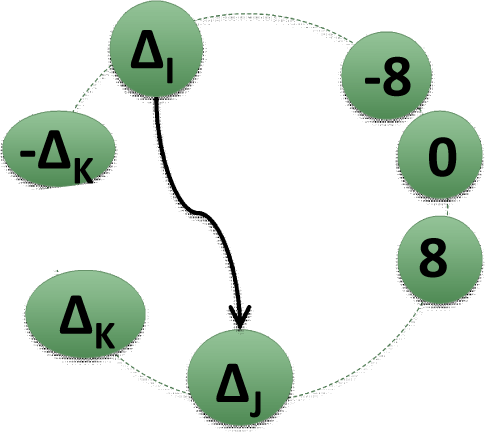
2.2. Matrices of Network Representation of RR-Increments

The construction of a network from a time series is illustrated in Figure 1 [40]. In this construction, we count the number of pairs (ΔI, ΔJ), which occur subsequently in ΔRR, a series with RR-increments. In this way, the adjacency matrix of network A is a matrix of which element AIJ is the weight of the outgoing edge from vertex ΔI to vertex ΔJ or is 0 if there is no edge between these vertices. Then, we normalize the numbers in matrix A to obtain a square matrix A of size (2K + 1):
A I J = | { ( δ R R i , δ R R i + 1 ) : δ R R i = Δ I , δ R R i + 1 = Δ J } | N ,
which provides probabilities PI, ΔJ) that event ΔJ occurs immediately after event ΔI in a time sequence.
The PRSA method offers the possibility to study causal relationships between accelerations or decelerations of the heart [6]. The standard algorithm is based on anchor points, i.e., points in time series that correspond to either moderate acceleration or moderate deceleration. The deceleration capacity (DC) represents the average of the special combination of RR-intervals directly preceding and following such a deceleration [6]. One can observe that this combination can be transcribed into RR-increments as follows:
R R i + R R i + 1 R R i 1 R R i 2 = δ R R i 1 + δ R R i + δ R R i + δ R R i + 1 .
Therefore, DC can be approximated by DCA based on values of the adjacency matrix A as:
D C A = 1 4 [ Δ I = Δ d Δ D Δ K = Δ D Δ D ( Δ K + Δ I ) A K I + Δ I = Δ d Δ D Δ J = Δ D Δ D ( Δ I + Δ J ) A I J ] ,
where Δd and ΔD are deceleration size limits. In our calculus, we assume Δd = 40 ms and ΔD = 100 ms, because with such a choice, we estimate approximately the effects of fast decelerations, namely larger than 5% and smaller than 10% of the mean heart period [35].
Based on adjacency matrix A, transition matrix T can be introduced as follows:
T I J = A I J J A I J = P ( Δ J | Δ I ) .
An element TIJ of matrix T is the conditional probability of observing ΔJ after an increment ΔI. Furthermore, matrix T can be interpreted as a directed and weighted network. The set of vertices is the same as in matrix A. However, the edges represent probabilities of transitions from a given vertex only.
Matrix T is right stochastic, i.e., the sum of each row is 1, and its maximal right eigenvalue is 1. Matrix T describes a Markov walk on a network where a walker moves from vertex ΔI to ΔJ with probability TIJ. The role of vertices in a network reveals the stationary distribution arising, μ = {μI : I = ΔK, …, ΔK}, which is the eigenvector of T corresponding to an eigenvalue of 1. Consequently, we can calculate the entropy rate as follows:
S T = I = Δ K Δ K μ I J = Δ K Δ K T I J ln T I J .

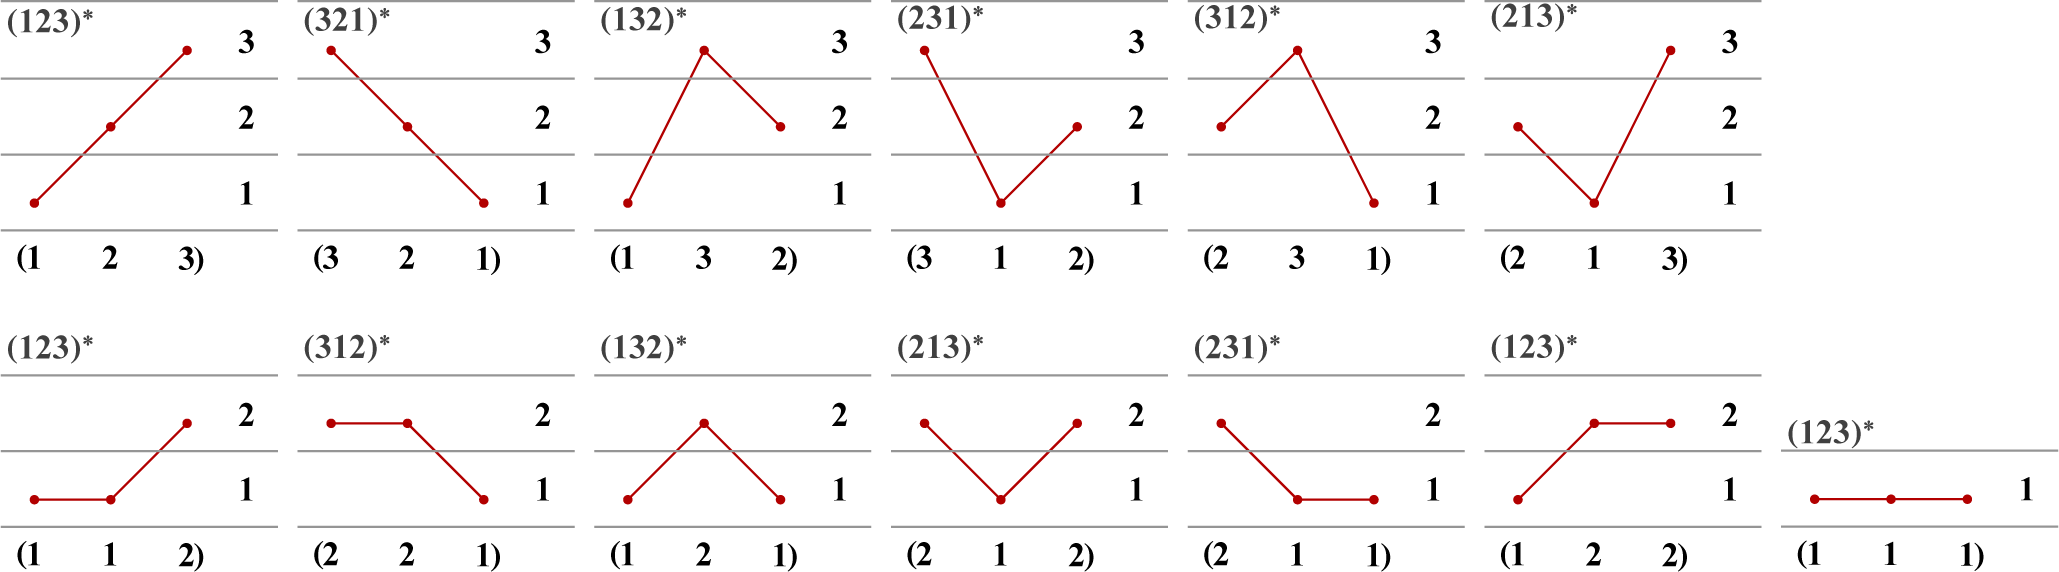
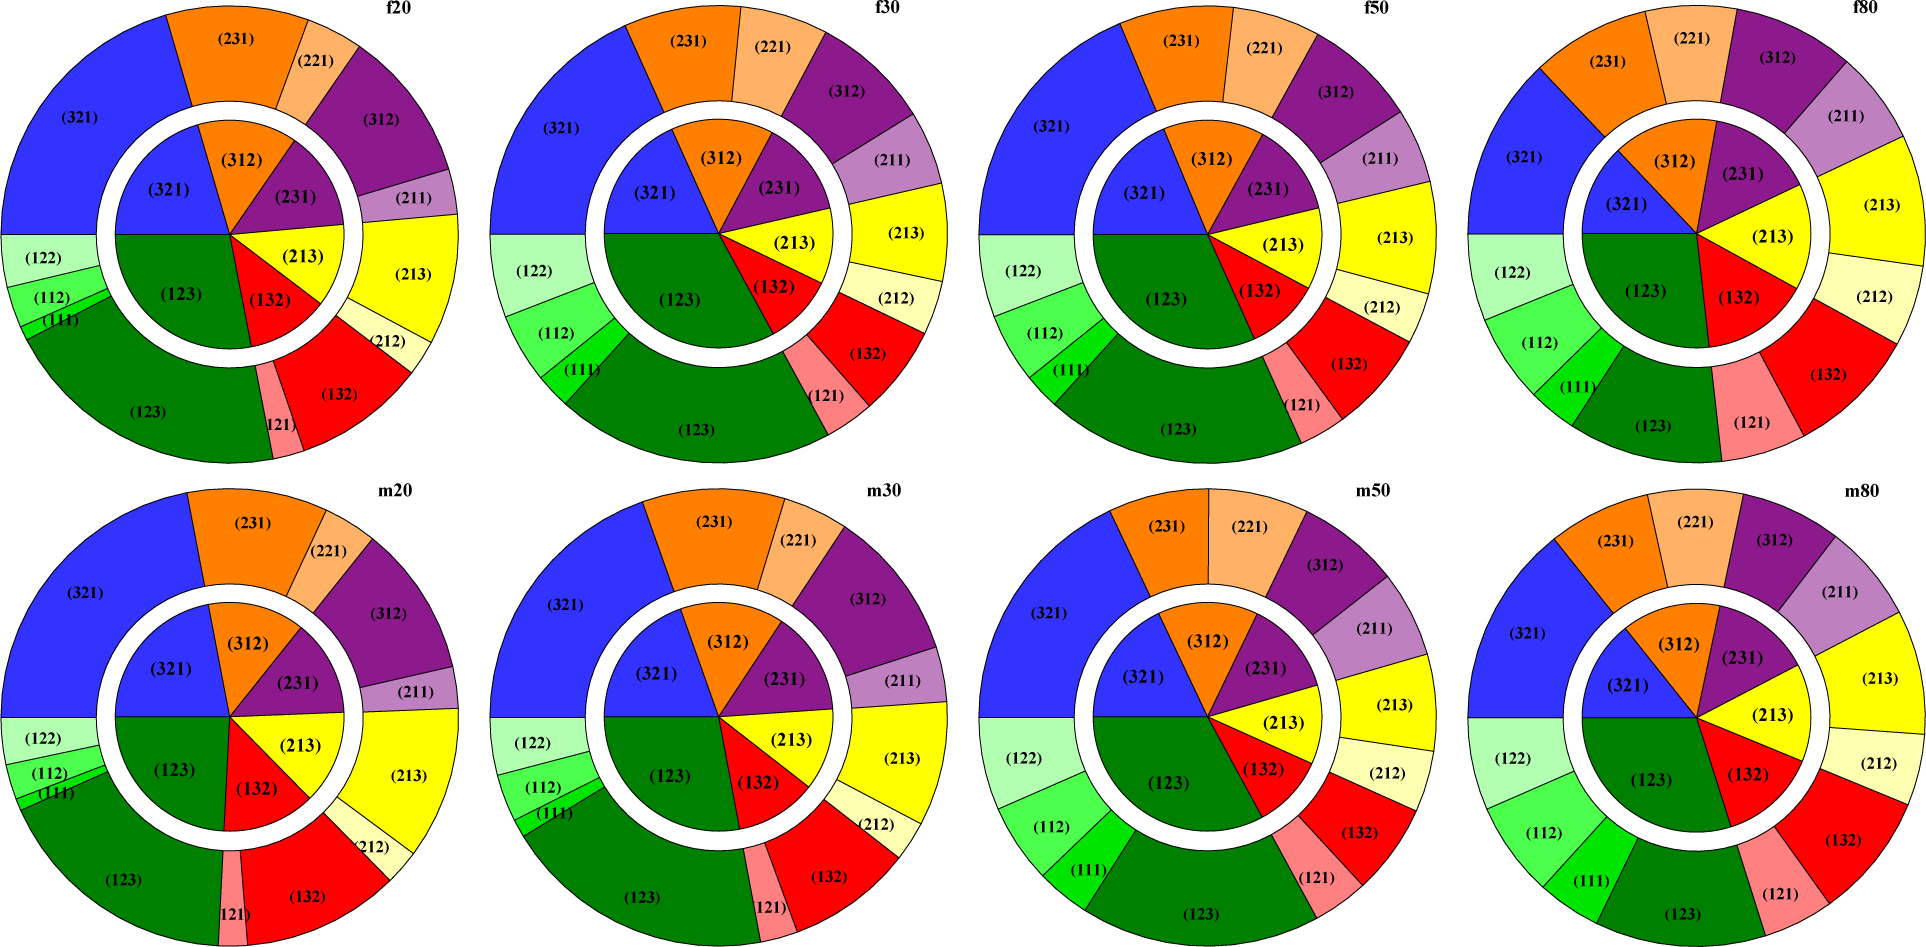
2.3. Ordinal Patterns

The standard analysis of ordinal patterns (OP) considers a distribution of the so-called ordinal patterns found for segments of size L of a given signal. These patterns are given as sequences of indices of the values in the segments when the values are arranged in ascending order [1,9,10]. The method assumes that the signal consists of continuous values, so the order in each segment can be found uniquely, i.e., for each of two values in each segment, the ascending relation can be determined. If the values in a segment are the same, it is proposed to proceed either by arranging these values in the order of occurrence in the segment or by adding to each of them a small random value to establish the order.
In this way, if L = 3, then the OP analysis is based on 3! = 6 patterns corresponding to all possible permutations of a three-element set S3 = {1, 2, 3}; see Figure 2, first row. However, when the data considered have a low resolution, segments with repeated values cannot be considered to be rare events, and therefore, they need to be investigated thoroughly. Recently, a modification to the OP approach has been proposed [11]. An additional set of patterns has been introduced to consider segments with repeating values. In particular, in the case of L = 3, two supplementary sets should be considered to include events in which two of the three values in a segment are the same S2 = {1, 2} and events in which all three values of a segment are the same as each other S1 = {1}. See Figure 2, second row, for a list of possible patterns and their notation.
Ordinal patterns for L = 3 can be directly related to the adjacency matrix obtained for the RR-increments. While the standard six ordinal patterns correspond to areas in the plane of matrix A; the patterns with repeated values are borders between these areas. The point (0, 0) corresponds to pattern (111). Other patterns are aligned with horizontal, vertical and diagonal axes. These direct connections between the probability of ordinal patterns and the probability of the event of the two following increments are as follows:
patterns with repeating values:
p ^ ( ( 111 ) ) = P ( 0 , 0 ) , p ^ ( ( 112 ) ) = Δ J > 0 P ( 0 , Δ J ) , p ^ ( ( 221 ) ) = Δ J > 0 P ( 0 , Δ J ) , p ^ ( ( 122 ) ) = Δ I > 0 P ( Δ I , 0 ) , p ^ ( ( 221 ) ) = Δ I > 0 P ( Δ I , 0 ) , p ^ ( ( 121 ) ) = Δ I > 0 P ( Δ I , Δ I ) , p ^ ( ( 212 ) ) = Δ I > 0 P ( Δ I , Δ I ) ;
patterns without repeating values (with ΔI ≠ 0 and ΔJ ≠ 0):
p ^ ( ( 123 ) ) = Δ I , Δ J > 0 P ( Δ I , Δ J ) , p ^ ( ( 321 ) ) = Δ I , Δ J > 0 P ( Δ I , Δ J ) , p ^ ( ( 132 ) ) = Δ I , Δ J > 0 Δ I > Δ J P ( Δ I , Δ J ) , p ^ ( ( 231 ) ) = Δ I , Δ J > 0 Δ I > Δ J P ( Δ I , Δ J ) , p ^ ( ( 312 ) ) = Δ I , Δ J > 0 Δ I > Δ J P ( Δ I , Δ J ) , p ^ ( ( 213 ) ) = Δ I , Δ J > 0 Δ I > Δ J P ( Δ I , Δ J ) .
The permutation entropy PE for segments of a given size L is defined as the Shannon entropy calculated for the distribution of ordinal patterns πL:
P E ( L ) = π L p ^ ( π L ) ln p ^ ( π L ) .
In the following, we estimate PE according to (7) for L = 3 in two cases: firstly as in the standard case, when repeated values are treated in the order of their appearance (denoted as PEs); and secondly, when patterns with repeating values are counted separately (denoted as PErv).

2.4. Statistics and Graphical Tools Used

All signal analyses were performed by programs prepared by us. The statistical analyses and graphic representations of results were carried out with SigmaPlot v. 13.0 (Systat Software, Inc., Chicago, IL, USA) and Mathematica 10.0 (Wolfram Research, Inc., Champaign, IL, USA).

3. Results and Discussion

Values for HRV indices, which are commonly assumed to be basic in the assessment of multiple hour signals [17,23,25,39], together with new estimators of HRV, obtained for the six-hour signals investigated by us, are shown in Table 2. The results are pooled in the age-gender groups.

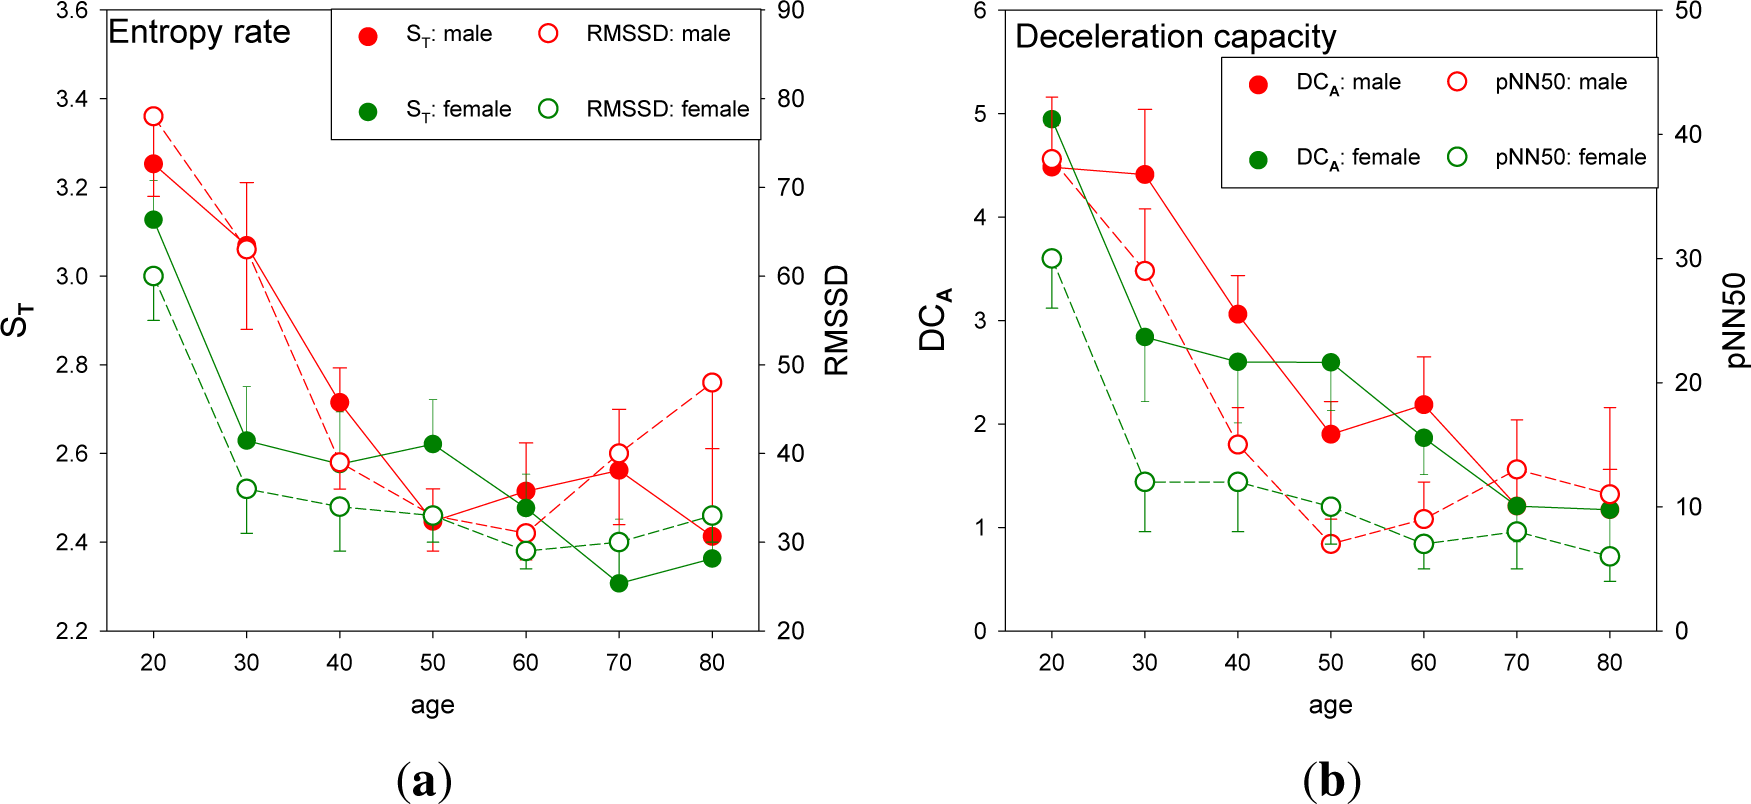
3.1. Standard HRV Characteristics of the Groups Studied

The standard indices are given for the following two purposes: to describe the general HRV properties in the population studied and to set a reference point for the estimators proposed by us. In Table 2, we see properties typical for a normal aging population as quantified by standard indices of HRV[1823,25,42]. These indices also exhibit a known gender difference between females and males, namely the HRV values for females are lower than for males in age-matched groups [19,23,25].
In particular, the overall variability expressed by the standard deviation of normal-to-normal (NN)-intervals (SDNN) [17,41] shows the tendency to decrease as the age of the group increases (statistically significant by one-way ANOVA analysis (p ≤ 0.001)) in both males and females, although in the case of females, this decrease is not as evident as in the male group. Comparable results have been reported in [19,23]. The square root of the mean of the sum of the squares of differences (RMSSD), the index describing the very short-term variability [39] and, therefore, assumed to reflect the vagal modulation, exhibits a dependence on age similar to SDNN. Since RMSSDs have been found to be insensitive to non-stationarities caused by bursts of sympathetic activity during different sleep stages independent of age [43], this index can be considered to be exclusively related to vagal activity. Our results on RMSSD are in agreement with observations provided in [23], namely values of RMSSD decay significantly with age (statistically significant by one-way ANOVA analysis (p ≤ 0.001)). Hence, one can state that the role of the vagal activity diminishes with aging. Surprisingly, this decline changes at the age of seventy, when for two decades, in the subject’s seventies and eighties, we observe a growth in RMSSD. This trend reversal has been previously observed [24] and attributed to vagal dominance in advanced age.
The most pronounced gender influence was found for the percentage of NN-intervals that vary more than 50 ms from the previous interval (pNN50). Males of age 30–39 have a pNN50 index 2.41-times higher than that of the age-matched female participants (the difference is significant by the t-test (p = 0.018)). Similar results are obtained for RMSSD: males aged 30–39 have an RMSSD index 1.75-times higher than the age-matched female participants (the difference is significant by the Mann–Whitney rank sum test (p = 0.024)). The index of overall SDNN variability also shows a large gender difference for this decade of age: SDNN for males is 1.61-times higher than SDNN for females (the difference is significant by the t-test at p ≤ 0.0001).
The ratio of low frequency band power (LF) to high frequency band power (HF), which is often interpreted as the HRV index for the balance between sympathetic and vagal activity [25,39], was expected to be slightly dependent on age in the case of males and independent of age in the case of females [23,44]. Our data do not give consistent information about the age and/or gender influence on the LF/HF value.
The fractal index of HRV detrended fluctuation analysis (DFA) α2, which describes the long range dependence between RR-intervals, has been described as positively correlated with age for both gender groups and for both circadian diurnal and nocturnal activity [23]. However, our results do not show any meaningful differences between the age and gender groups. This observation would support the hypothesis that long range correlation, hence the general architecture of heart rate fluctuations, does not change with age [30].

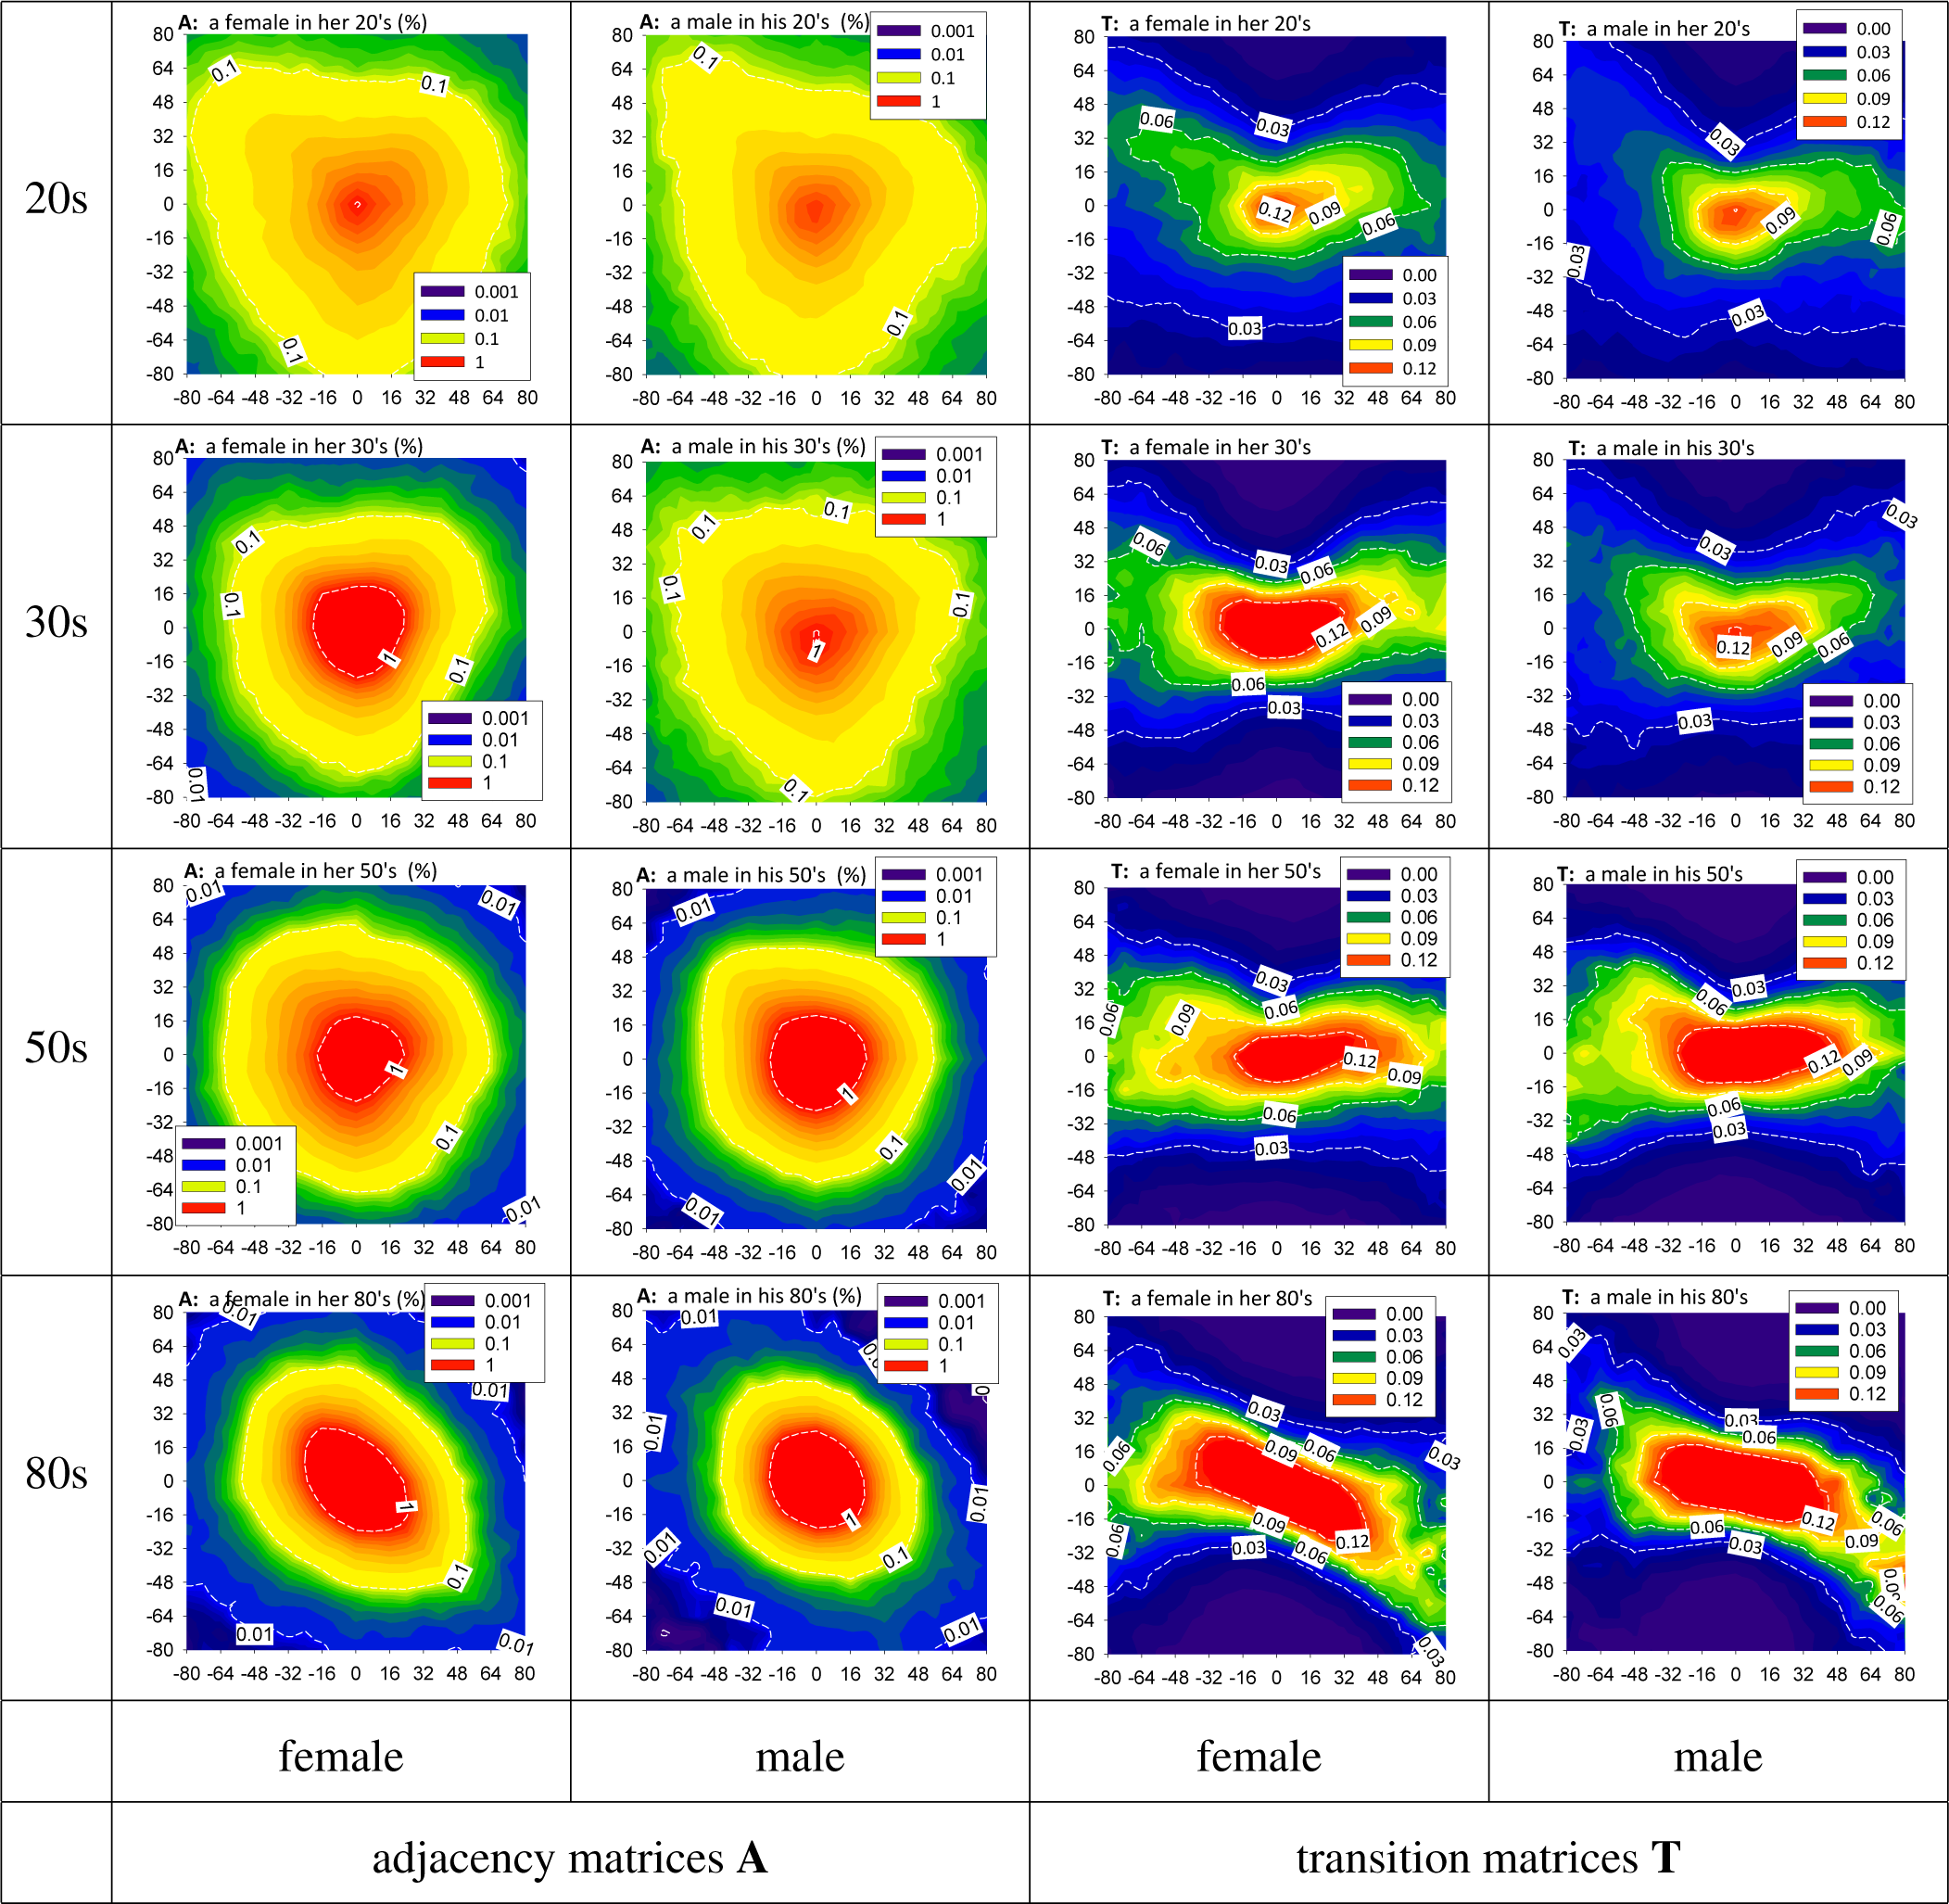
3.2. HRV by Adjacency and Transition Matrices

Transition matrices T obtained following Formula (5) provide a Markov approximation of the underlying dynamics of changes in RR-increments. The entropy rate ST resulting from matrix T summarizes the properties of the Markov chain approximation. Based on our signals, we see a gradual decrease in the entropy rate due to aging (statistically significant by one-way ANOVA analysis, (p ≤ 0.001)). Moreover, it is shown that females age differently from males. Similarly to results observed in RMSSD, the largest gender discrepancy appears in subjects in their thirties. This difference is statistically significant by the t-test (two-tailed, p = 0.028). The steady decrease in entropy for males persists until they are in their fifties, while in the case of females, ST does not change. However, since the gender differences between age-matched groups other than in their thirties do not achieve statistical significance (p = 0.05), the gender disparity discerned should be interpreted cautiously.
A description of changes in heart period dynamics in ST caused by age can be compared to results provided by RMSSD, which also measures RR-increments. However, while RMSSD describes variation in RR-increments, ST measures variations in pairs of subsequent RR-increments. In Figure 3a, we plot decay with age of both indices to underline similarities and discrepancies between these two indices.
With age, approximate deceleration capacity DCA, estimated according to (4) and probabilities provided by adjacency matrices A, also shows a significant decrease in the probability of events involved in decelerations of size Δd = 40 Δ ΔD = 100 ms (statistically significant by one-way ANOVA on ranks analysis (p ≤ 0.001)); see Figure 3b. Similarly to the property found for entropy rate ST, here also, the difference between males and females occurring in their thirties is statistically significant by the t-test (one-tailed, p < 0.045).
Since DCA is a descriptor of the ability of the heart to slow down quickly, it has been postulated as an indicator of the strength of the vagal activity [6,35]. The decay of deceleration capacity can be compared to changes provided by pNN50, but with the caution that the pNN50 index is insensitive to whether a large acceleration or deceleration occurs. In Figure 3b, we plot the dependence on age for both indices to exemplify similarities and discrepancies between these two indices. Accordingly, our results with DCA can be seen as a loss in total vagal output with healthy aging, which is similar to results obtained by Schumann et al. [35].
The decay in the entropy rate with age and also the decay in deceleration capacity indicate a decrease in the complexity of the underlying dynamics. However, they explain only roughly in which way the dynamics is simplified. However, matrices of both types A and T, which drive the deceleration capacity and entropy rate, as representations of networks of changes observed in the heart period dynamics, can be expressed graphically in a compact way, so indicating the whole spectrum of all available RR-increments after and/or before a given RR-increment. Hereby, we obtain insight into the details of the underlying dynamics, which is impossible when dealing with simple HRV indices. In the sequence of plots in Figure 4, we show the contour plots for A and T matrices to provide an explanation for the decrease observed in deceleration capacity and in the entropy rate. We represent networks by contour plots of the networks’ matrices to enhance the readability of densely interconnected networks [40]. We limit the presentations to the age and gender groups that show the most specific features in the ST and DCA decays. Moreover, the plots resolve total changes in the heart rhythm into the RR-increments of sizes restricted to 80 Δ +80 ms.
The pair (0, 0) of the two consecutive no-change events is the most probable pair of subsequent events in all As, independent of age and gender. Thus, events where three subsequent RR-intervals have the same length at the approximation of the signal resolution of 8 ms are most likely to appear. The next most pronounced feature of the heart period dynamics is that the probability of this pattern significantly grows according to age and gender. Specifically, from P f e m a l e ( 20 ) ( 0 , 0 ) = 1.04 ± 0.26 %, P m a l e ( 20 ) ( 0 , 0 ) = 0.86 ± 0.21 % for females and males, correspondingly, at the age of twenty, to P f e m a l e ( 80 ) ( 0 , 0 ) = 3.46 ± 0.50 % P m a l e ( 80 ) ( 0 , 0 ) = 4.93 ± 0.92 % for people in their eighties.
Following the 1% curves (labeled 0.01) in plots of A in Figure 4, we can observe the size and shape of regions representing events with a probability greater than 1%. These regions are localized around (0, 0) and spread significantly with age progression. This means that with aging, the heart period dynamics becomes limited to smaller changes in the heart period lengths. The circular type shape of this curve indicates a Gaussian distribution of RR-increments inside the curve. This is the case for females in their thirties and subjects in their fifties independent of gender. Moreover, in the case of the middle-aged population in the 50s age range, the curves labeled 0.12 in the resulting Markov transitions matrices T show a small dependence on the last step, when 24 ≤ δRRi 32 ms for females and 32 ≤ δRRi 40 for males. This property additionally supports the hypothesis that small RR-increments form non-correlated noise. However, for elderly people, in the 80s age range, we see the influence of the last event directly. After a deceleration, an acceleration is more probable than a deceleration, and vice versa: after an acceleration, a deceleration appears with higher probability. This antipersistent one-step dynamics is present for all core values of δRRi, and it seems to be stronger in females than in males. It is noticeable that the antipersistent character of RR-increments described is also present in other age-gender groups, but is limited to accelerations greater than 32 ms and observed as transitions after large accelerations in T matrices in Figure 4. The antipersistency after a deceleration develops with aging.

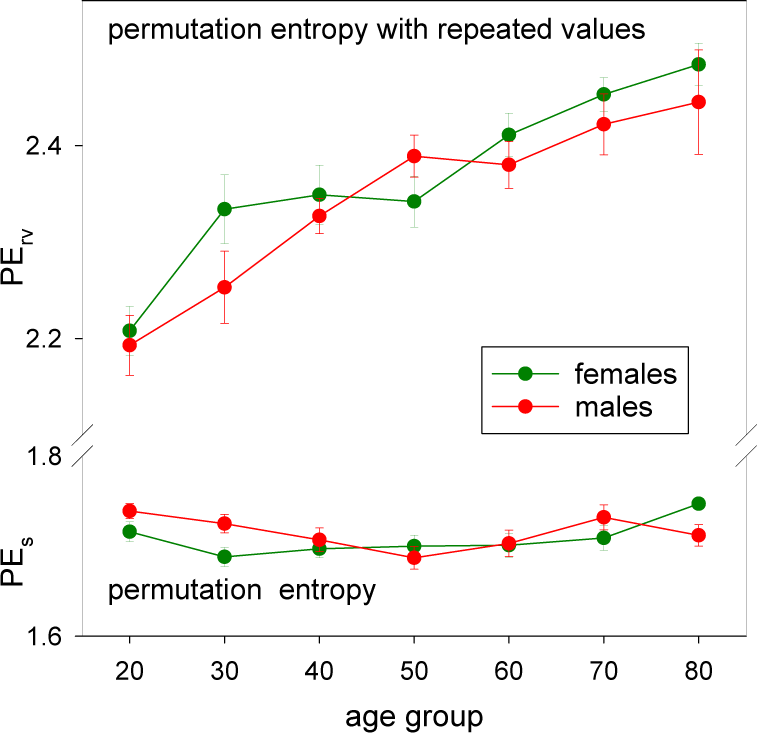
3.3. HRV by Permutation Entropy with Repeated Values

The standard permutation entropy estimates assume that subsequent values in a time series are distinct, and therefore, the order can always be found in any pattern. However, in the case of signals with a resolution of 8 ms, the role of no-change events cannot be ignored, especially when the analysis concerns the heartbeat changes in elderly people. From Figure 5, we read that when PE is estimated in a standard way, the PE value does not vary much with age or gender. However, PErv, which considers segments with repeated values as distinct patterns, grows systematically with age. This relation is statistically significant (by one-way ANOVA test with p < 0.001). Similarly to results obtained from the network approach, here we also see that this increase depends on gender. The PErv value grows more rapidly for females than males from 30 years of age. The reason for the increase observed in the permutation entropy is the increase of events with repeated values; see Figure 6.
The dependence on age of occurrence of patterns with repeated values is statistically significant (by one-way ANOVA test with p < 0.001 or by Kruskal–Wallis one-way ANOVA on ranks test in the case that the Shapiro–Wilk normality test fails, with p < 0.004).
The distribution of ordinal patterns, when the repetitions are taken into account, allows the filtering of RR-increments according to their size. In the case of our signals, a filter of 8 ms is large enough to separate highly variable signals of young males and females in the 20s age group from signals of older participants. The acceleration ability measured by the presence of the (123)-pattern does not vary much with age or gender, although there is a significant difference in both gender groups between the groups in their eighties and twenties (one-way ANOVA test, p ≤ 0.001, and Tukey’s test for pairwise comparison, p ≤ 0.001). The deceleration ability estimated by the ratio of the (321)-pattern grows with age when estimated in a standard way. However, this growth is related to the method in which standard patterns are classified. It masks the increase in patterns with repeated values. When patterns with repeated values are counted separately, we see that the deceleration ability decreases significantly (one-way ANOVA test, p ≤ 0.001, and Tukey’s test for pairwise comparison, p ≤ 0.001). The strong antipersistent variations observed in signals obtained from elderly subjects in the matrices A and T may be related to the increased occurrence of patterns (212) and (121) in males and females in their eighties (statistically significant by one-way-ANOVA on ranks, p ≤ 0.001).

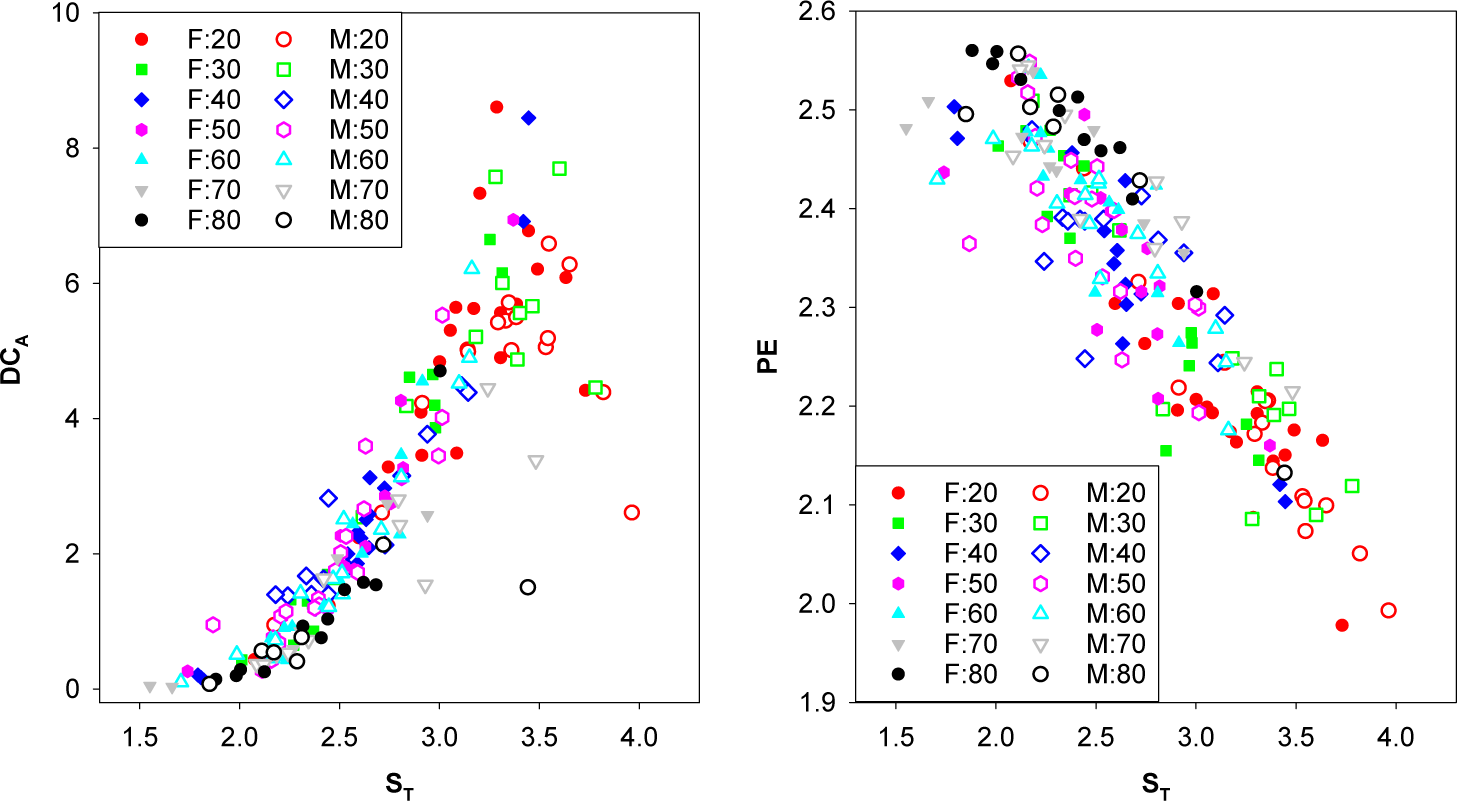
3.4. Correlations between the Measures Studied

The values of ST and DCA studied by us arise from the network approach to the series of RR-increments, as well as PE, the estimate of short-term variability. Hence, it is interesting to ask whether these values are correlated. If they are correlated, we should ask how they are correlated. In Figure 7, we show the plot of pairs (ST(p), DCA(p)) and (ST(p), PErv(p)) obtained for the same participant p. We see that a larger ST corresponds to a larger DCA. The linear approximation between these two values fails for low entropy rates ST < 2.3 and for large entropy rates ST > 3.5. The lowest entropy values are accompanied by zero deceleration capacity. However, the large entropy values can also characterize people by low deceleration capacity. The relation between (ST(p) and PErv(p)) seems to be linear; the quantities are negatively correlated. However, the lowest entropy values are not paired with the largest permutation entropy. Hence, the relation is not straightforward, and therefore, the three indices (ST, DCA, PErv(p)) reveal different aspects of the underlying dynamics.

3.5. Physiological Aspects of Healthy Aging

The identification of physiological processes responsible for the changes described in heart period dynamics requires understanding the influence of sleep on cardiovascular control mechanisms in healthy individuals. With normal sleep, when NREM sleep and REM sleep continue to alternate through the night in a cyclic fashion, the first cycle is usually characterized by short REM sleep and the longest time of restful deep sleep [32,33]. In the subsequent cycles, the REM sleep becomes longer, and the deep sleep takes up less NREM sleep time. Age is said to be the strongest and most consistent factor that modifies the pattern of sleep stages [33]. While the total of REM sleep episodes as a percentage of total sleep is approximately 20% to 25% across childhood, adulthood and into old age [33,36], the percentage of deep NREM sleep decreases with age. For a normal young adult, it is about 15% to 25%. However, at the age of sixty, deep sleep may no longer be present, particularly in males [33]. Females appear to maintain deep sleep later in life than males [33,36]. Hence, in the elderly, most NREM sleep consists of Stage 2 light sleep.
The organization of sleep stages corresponds with changes in the activity of the autonomic nervous system, with NREM sleep associated with reduced sympathetic activity and enhanced parasympathetic activity and REM sleep related to irregular activation and deactivation of these functions [32]. Furthermore, the brain is more active in REM sleep. REM sleep and arousals from sleep presumably reflect central autonomic commands, leading to transient periods of tachycardia [45]. It has been found that these transitions lead to significantly higher values of SDNN for REM sleep than for deep NREM sleep, independent of age [43]. However, it occurs that RMSSD is not influenced by the sleep stages, which could be interpreted to mean that vagal tone does not significantly change across the sleep stages [43]. Moreover, it has been found that the strength of the baroreflex component is greater in deep NREM sleep than in light NREM sleep and REM in healthy human subjects [46]. Sleep-stage transitions also lead to the variability in the respiratory rhythm, which, in turn, affects cardiorespiratory coupling [38]. Different cardiorespiratory phase synchronization is observed in different sleep stages, higher in deep sleep, lower in light sleep and lowest during REM.
It has become apparent that there is a bidirectional relationship between sleep and cardiovascular health [47]. For example, hypertension in humans is often associated with diminution or loss of the normal sleep-related fall in blood pressure. Sleep disorders, in particular obstructive sleep apnea, are associated with a range of cardiovascular disorders. Therefore, the characterization of normal changes in heart period dynamics in healthy aging, by methods accessible from simple measurements, like Holter recordings, is meaningful.
In our investigations, the total of these effects are considered. Therefore, both respiratory influence and baroreflex effects could be masked by each other or by the central commands, and vice versa. Fortunately, since the short-term variability index RMSSD appears to be less sensitive to sleep stages, we can suppose that the indices considered by us are not strongly influenced by sleep transitions.
Assuming that small variations around the actual homeostatic state are driven by a baroreflex feedback loop, while sharp increases in heart rate to maximum levels appear to be due to the increased sympathetic stimulation combined with parasympathetic inhibition [48], we can say that healthy aging is characterized by changes in RR-intervals in small steps rather than by large accelerations or decelerations. Therefore, the dynamics of beat-to-beat heart period changes slows down with aging. However, in the elderly, if large accelerations or decelerations occur, they happen in an antipersistent way.
The increasing role of patterns with repeated values is also a sign that the dynamics of changes in RR-intervals slows down. The changes have to be small; otherwise, obtaining the same values is less probable. Thus, again, we see that with healthy aging, cardiovascular functions are maintained slowly and in small steps.

4. Conclusions

The nocturnal heart period dynamics is nonstationary, characterized by alternations between different sleep stages, each of which enters and/or switches on/off different parts of autonomic regulation and other higher brain centers [32,33]. These alternations are comparable to phase transitions taking place in physiologic couplings [38]. Since the interpretation of standard HRV indices is based on physiologically-stable conditions [17,39], the assessment of such variability by standard HRV indices is challenging. To cope with nonstationarity, we have proposed analysis approaches based on pairs of subsequent changes in heart period lengths.
The model of stochastic dynamics arising from the transition networks between accelerations and decelerations delivers a compact representation of aging. The model shows that crucial changes with age occur in two steps. The first step is achieving the target, i.e., a homeostatic state of the blood perfusion in the organs of the body, by small increments in RR-intervals rather than by large ones. This transition depends on gender and occurs earlier in females (in their thirties) than in males (in their forties). The second step is a transition to the antipersistent dynamics, in which, if large accelerations or large decelerations occur, they alternate with each other.
The concept of entropy provides a means for the construction of effective measures that capture and summarize the complexity of the dynamics of RR-increments. The indices considered—entropy rate, approximate deceleration capacity and permutation entropy with repeated values—provide a consistent picture of age-related changes in the beat-to-beat dynamics. In contrast with standard HRV indices, they do not wrongly interpret the increase of variability in the elderly. Moreover, the three indices allow the decomposition of the total effect into a compact graphical representation of crucial aspects of the underlying dynamics.
Vagal deficiency in the afferent-efferent coupling of baroreflex control is considered to play a key role in reduced cardiovagal baroreflex function with age [14,16]. Therefore, the decrease in complexity of the underlying dynamics with aging is observed as a decay in the entropy rate. Moreover, the suppressed vagal tone, revealed by the decrease of deceleration capacity, is in accordance with the increase in permutation entropy, calculated on patterns with repeated values. These results suggest that the dynamics of heart period changes slows down with aging and support the hypothesis of the sympathetic dominance in nocturnal cardiovascular regulation in the elderly.

Acknowledgments

The authors Danuta Makowiec, Zbigniew R. Struzik, Dorota Wejer and Agnieszka Kaczkowska acknowledge the financial support of the National Science Centre, Poland, UMO: 2012/06/M/ST2/00480.

Author Contributions

Danuta Makowiec: conceived of and designed the study, analyzed and interpreted the data, wrote the paper, reviewed the relevant literature and made the final revision of the manuscript. Agnieszka Kaczkowska: analyzed and interpreted the data and drafted parts of the paper. Dorota Wejer: analyzed and interpreted the data and drafted parts of the paper. Marta Żarczyńska-Buchowiecka: acquired the data and reviewed the relevant literature. Zbigniew Struzik: conceived of and designed the study and critically revised the manuscript. All authors have read and approved the final manuscript.

Conflicts of Interest

The authors declare no conflict of interest.

References

  1. Zanin, M.; Zunino, L.; Rosso, O.A.; Papo, D. Permutation entropy and its main biomedical and econophysics applications: A review. Entropy 2012, 14, 1553–1577. [Google Scholar]
  2. Faes, L.; Nollo, G.; Jurysta, F.; Marinazzo, D. Information dynamics of brain–heart physiological networks during sleep. New J. Phys. 2014, 16. [Google Scholar] [CrossRef]
  3. Cirugeda-Roldan, E.; Cuesta-Frau, D.; Miro-Martinez, P.; Oltra-Crespo, S. Comparative study of entropy sensitivity to missing biosignal data. Entropy 2014, 16, 5901–5918. [Google Scholar]
  4. Donner, R.V.; Zou, Y.; Donges, J.F.; Marwan, N.; Kurths, J. Recurrence networks—a novel paradigm for nonlinear time series analysis. New J. Phys. 2010, 12. [Google Scholar] [CrossRef]
  5. Campanharo, A.S.L.O.; Sirer, M.I.; Malmgren, R.D.; Ramos, F.M.; Amaral, L.A.N. Duality between time series and networks. PLoS ONE 2011, 6. [Google Scholar] [CrossRef]
  6. Bauer, A.; Kantelhardt, J.W.; Bunde, A.; Barthel, P.; Schneider, R.; Malik, M.; Schmidt, G. Phase-rectified signal averaging detects quasi-periodicities in non-stationary data. Physica A 2006, 364, 423–434. [Google Scholar]
  7. Bauer, A.; Kantelhardt, J.W.; Barthel, P.; Schneider, R.; Mäkikallio, T.; Ulm, K.; Hnatkova, K.; Schömig, A.; Huikuri, H.; Bunde, A.; et al. Deceleration capacity of heart rate as a predictor of mortality after myocardial infarction: cohort study. Lancet 2006, 367, 1674–1681. [Google Scholar]
  8. Makowiec, D.; Struzik, Z.; Graff, B.; Żarczyńska-Buchowiecka, M.; Wdowczyk, J. Transition network entropy in characterization of complexity of heart rhythm after heart transplantation. Acta Phys. Pol. B 2014, 45, 1771–1781. [Google Scholar]
  9. Bandt, C.; Pompe, B. Permutation entropy: A natural complexity measure for time series. Phys. Rev. Lett. 2002, 88. [Google Scholar] [CrossRef]
  10. Amigó, J.M. Permutation Complexity in Dynamical Systems; Springer: Berlin/Heidelberg, Germany, 2010. [Google Scholar]
  11. Bian, C.; Qin, C.; Ma, Q.D.Y.; Shen, Q. Modified permutation-entropy analysis of heartbeat dynamics. Phys. Rev. E 2012, 85. [Google Scholar] [CrossRef]
  12. Klabunde, R.E. Cardiovascular Physiology Concepts; Lippincott Williams & Wilkins: Philadelphia, PA, USA, 2012. [Google Scholar]
  13. Esler, M.D.; Thompson, J.M.; Kaye, D.M.; Turner, A.G.; Jennings, G.L.; Cox, H.S.; Lambert, G.W.; Seals, D.R. Effects of aging on the responsiveness of the human cardiac sympathetic nerves to stressors. Circulation 1995, 91, 351–358. [Google Scholar]
  14. Hotta, H.; Uchida, S. Aging of the autonomic nervous system and possible improvements in autonomic activity using somatic afferent stimulation. Geriatr. Gerontol. Int. 2010, 10, S127–S136. [Google Scholar]
  15. Ebert, T.J.; Morgan, B.J.; Barney, J.A.; Denahan, T.; Smith, J.J. Effects of aging on baroreflex regulation of sympathetic activity in humans. Am. J. Physiol. Heart Circ. Physiol. 1992, 263, H798–H803. [Google Scholar]
  16. Callegaro, C.C.; Taylor, J. Age-related effects of vagotonic atropine on cardiovagal baroreflex gain. Neurobiol. Aging. 2010, 33, 368–374. [Google Scholar]
  17. Task Force of the European Society of Cardiology the North American Society of Pacing. Heart rate variability: Standards of measurement, physiological interpretation, and clinical use. Circulation 1996, 93, 1043–1065. [Google Scholar]
  18. Reardon, M.; Malik, M. Changes in Heart Rate Variability with Age. Pacing Clin. Electrophysiol. 1996, 19, 1863–1866. [Google Scholar]
  19. Umetani, K.; Singer, D.H.; McCraty, R.; Atkinson, M. Twenty-four hour time domain heart rate variability and heart rate: Relations to age and gender over nine decades. J. Am. Coll. Cardiol. 1998, 31, 593–601. [Google Scholar]
  20. Pikkujämsä, S.M.; Mäkikallio, T.H.; Sourander, L.B.; Räihä, I.J.; Puukka, P.; Skyttä, J.; Peng, C.K.; Goldberger, A.L.; Huikuri, H.V. Cardiac interbeat interval dynamics from childhood to senescence: Comparison of conventional and new measures based on fractals and chaos theory. Circulation 1999, 100, 393–399. [Google Scholar]
  21. Crasset, V.; Mezzetti, S.; Antoine, M.; Linkowski, P.; Degaute, J.P.; van de Borne, P. Effects of aging and cardiac denervation on heart rate variability during sleep. Circulation 2001, 103, 84–88. [Google Scholar]
  22. Shimazu, T.; Tamurai, N.; Antoine, M.; Linkowski, P.; Degaute, J.P.; van de Borne, P. Aging of the autonomic nervous system. Nihon Rinsho. 2005, 63, 973–977. [Google Scholar]
  23. Beckers, F.; Verheyden, B.; Aubert, A.E. Aging and nonlinear heart rate control in a healthy population. Am. J. Physiol. Heart Circ. Physiol. 2006, 290, H2560–H2570. [Google Scholar]
  24. Struzik, Z.R.; Hayano, J.; Soma, R.; Kwak, S.; Yamamoto, Y. Aging of complex heart rate dynamics. IEEE Trans. Biomed. Eng. 2006, 53, 89–94. [Google Scholar]
  25. Meersman, R.E.D.; Stein, P.K. Vagal modulation and aging. Biol. Psychol. 2007, 74, 165–173. [Google Scholar]
  26. Monahan, K.D. Effect of aging on baroreflex function in humans. Am. J. Physiol. Regul. Integr. Comp. Physiol. 2007, 293, R3–R12. [Google Scholar]
  27. Makowiec, D.; Rynkiewicz, A.; Galaska, R.; Wdowczyk-Szulc, J.; Żarczyńska-Buchowiecka, M. Reading multifractal spectra: Aging by multifractal analysis of heart rate. Europhys. Lett. 2011, 94. [Google Scholar] [CrossRef]
  28. Goldberger, J.J.; Cain, M.E.; Hohnloser, S.H.; Kadish, A.H.; Knight, B.P.; Lauer, M.S.; Maron, B.J.; Page, R.L.; Passman, R.S.; Siscovick, D.; et al. American Heart Association/American College of Cardiology Foundation/Heart Rhythm Society Scientific Statement on Noninvasive Risk Stratification Techniques for Identifying Patients at Risk for Sudden Cardiac Death: A Scientific Statement From the American Heart Association Council on Clinical Cardiology Committee on Electrocardiography and Arrhythmias and Council on Epidemiology and Prevention. Circulation 2008, 118, 1497–1518. [Google Scholar]
  29. Poirier, P. Exercise, heart rate variability, and longevity: The cocoon mystery? Circulation 2014, 129, 2085–2087. [Google Scholar]
  30. Schmitt, D.T.; Ivanov, P.C. Fractal scale-invariant and nonlinear properties of cardiac dynamics remain stable with advanced age: a new mechanistic picture of cardiac control in healthy elderly. Am. J. Physiol. Regul. Integr. Comp. Physiol. 2007, 293, R1923–R1937. [Google Scholar]
  31. Tobaldini, E.; Nobili, L.; Strada, S.; Casali, K.R.; Braghiroli, A.; Montano, N. Heart rate variability in normal and pathological sleep. Front. Physiol. 2013, 4. [Google Scholar] [CrossRef]
  32. Guyton, A.C.; Hall, J.E. Textbook of Medical Physiology; Elsevier Saunders: Philadelphia, PA, USA, 2006. [Google Scholar]
  33. Carskadon, M.A.; Dement, W.C. Normal human sleep : An overview. In Principles and Practice of Sleep Medicine, 5th; Kryger, M.H., Roth, T., Dement, W.C., Eds.; Elsevier Saunders: Philadelphia, PA, USA, 2011; Chapter 2; pp. 16–26. [Google Scholar]
  34. Monti, A.; Medigue, C.; Nedelcoux, H.; Escourrou, P. Autonomic control of the cardiovascular system during sleep in normal subjects. Eur. J. Appl. Physiol. 2002, 87, 174–181. [Google Scholar]
  35. Schumann, A.Y.; Bartsch, R.P.; Penzel, T.; Ivanov, P.C.; Kantelhardt, J.W. Aging effects on cardiac and respiratory dynamics in healthy subjects across sleep stages. Sleep 2010, 33, 943–955. [Google Scholar]
  36. Ohayon, M.M.; Carskadon, M.A.; Guilleminault, C.; Vitiello, M.V. Meta-analysis of quantitative sleep parameters from childhood to old age in healthy individuals: developing normative sleep values across the human lifespan. Sleep 2004, 27, 1255–73. [Google Scholar]
  37. Espiritu, J.R. Aging-related sleep changes. Clin. Geriatr. Med. 2008, 24, 1–14. [Google Scholar]
  38. Bartsch, R.P.; Schumann, A.Y.; Kantelhardt, J.W.; Penzel, T.; Ivanov, P.C. Phase transitions in physiologic coupling. Proc. Natl. Acad. Sci. USA 2012, 109, 10181–10186. [Google Scholar]
  39. Nicolini, P.; Ciula, M.M.; de Asmundus, C.; Magrini, F.; Brugada, P. The prognostic value of heart rate variability in the elderly, changing the perspective: from sympathovagal balance to chaos theory. Pacing Clin. Electrophysiol. 2012, 35, 622–638. [Google Scholar]
  40. Makowiec, D.; Graff, B.; Kaczkowska, A.; Graff, G.; Wejer, D.; Wdowczyk, J.; Zarczynska-Buchowiecka, M.; Gruchala, M.; Struzik, Z.R. Visualization of short-term heart period variability with network tools as a method for quantifying autonomic drive. 2014; arXiv:1407.4921v1. [Google Scholar]
  41. Tarvainen, M.P.; Niskanen, J.P.; Lipponen, J.A.; Ranta-aho, P.O.; Karjalainen, P.A. Kubios HRV-heart rate variability analysis software. Comput. Methods Progr. Biomed. 2014, 113, 210–220. [Google Scholar]
  42. Dietrich, D.F.; Schindler, C.; Schwartz, J.; Barthélémy, J.C.; Tschopp, J.M.; Roche, F.; von Eckardstein, A.; Brändli, O.; Leuenberger, P.; Gold, D.R.; et al. Heart rate variability in an ageing population and its association with lifestyle and cardiovascular risk factors: Results of the SAPALDIA study. Europace 2006, 8, 521–529. [Google Scholar]
  43. Schmitt, D.T.; Stain, P.K.; Ivanov, P.C. Stratification pattern of static and scale-invariant dynamic measures of heartbeat fluctuations across sleep stages in young and elderly. IEEE Trans. Biomed. Eng. 2009, 56, 1564–1573. [Google Scholar]
  44. Kuo, T.B.J.; Lin, T.; Yang, C.C.H.; Li, C.L.; Chen, C.F.; Chou, P. Effect of aging on gender differences in neural control of heart rate. Am. J. Physiol. Heart Circ. Physiol. 1999, 277, H2233–H2239. [Google Scholar]
  45. Trinder, J. Cardiovascular control during sleep: “Sleep-dependent changes in the coupling between heart period and blood pressure in human subjects,” by Silvani et al. Am. J. Physiol. Regul. Integr. Comp. Physiol. 2008, 294, R1684–R1685. [Google Scholar]
  46. Silvani, A.; Grimaldi, D.; Vandi, S.; Barletta, G.; Vetrugno, R.; Provini, F.; Pierangeli, G.; Berteotti, C.; Montagna, P.; Zoccoli, G.; Cortelli, P. Sleep-dependent changes in the coupling between heart period and blood pressure in human subjects. Am. J. Physiol. Regul. Integr. Comp. Physiol. 2008, 294, R1686–R1692. [Google Scholar]
  47. Parati, G.; Lombardi, C.; Narkiewicz, K. Sleep apnea: epidemiology, pathophysiology, and relation to cardiovascular risk. Am. J. Physiol. Regul. Integr. Comp. Physiol. 2007, 293, R1671–R1683. [Google Scholar]
  48. Martini, F.H.; Ober, W.C.; Nath, J.L. Visual Anatomy & Physiology; Pearson Education: Upper Saddle River, NJ, USA, 2011. [Google Scholar]
Figure 1. Illustration of the network construction. The network vertices (arranged in a circle) represent values of RR-increments described by Equation (1). Negative labels correspond to cardiac accelerations; positive labels describe cardiac decelerations; 0 means ‘no-change’ event. A directed edge (ΔI, ΔJ) is plotted, if after an RR-increment of size ΔI, the next increment is of size ΔJ. Each time this event takes place, this edge obtains an additional +1 in weight. Thus, by the weight of the edge, we count the events (RRi−1, RRi, RRi+1), where δRRi = ΔI and δRRi+1 = ΔJ.
Entropy 17 01253f1
Figure 2. List of all ordinal patterns in case L = 3 and their notation used in our analysis. The standard ordinal patterns are listed in the first row. The second row shows six extra patterns possible if values of S2 are arranged in a three-element sequence, and one pattern corresponds to the S1 set. The standard notation of each pattern is given above the pattern and is denoted as ( )*; the new notation is provided below the patterns.
Entropy 17 01253f2
Figure 3. Comparison of the decay with age of entropy rate ST with RMSSD (left) and deceleration capacity DCA with pNN50 (right) for males and females in the age-gender groups represented as mean ± Std. err.
Entropy 17 01253f3
Figure 4. Contour plots for adjacency matrices A and transition matrices T. The log scale is used in the case of A to show the spread of counted events.
Entropy 17 01253f4
Figure 5. Dependence of permutation entropy with repeated values PErv and standard permutation entropy PEs on age for males and females, in the age-gender groups represented as mean ± Std. err.
Entropy 17 01253f5
Figure 6. Pie charts for distributions of ordinal patterns for representative groups of signals: females (first row) and males (second row). The inner circles describe distributions obtained with a standard approach. The outer circles show the occurrence of patterns with repeating values in standard patterns. The notation of the patterns follows Figure 2.
Entropy 17 01253f6
Figure 7. Correlation between entropy rate ST and deceleration capacity DCA (left) and permutation entropy with repeated values of PErv for participants grouped according to age and gender.
Entropy 17 01253f7
Table 1. Description of the composition of groups of healthy participants in the study.
Group NameAgeFemaleMale
twenties (20s)20–291818
thirties (30s)30–391313
forties (40s)40–491620
fifties (50s)50–591319
sixties (60s)60–691113
seventies (70s)70–791012
eighties (80s)80–89117
Table 2. Main indices of HRV for age-dependent groups of females and males. Indices of standard HRV were estimated by Kubios HRV [41], the age-gender mean ± Std. err.
Standard Indices of HRV
Entropic Indices of HRV
Age YearsRR [ms]SDNN [ms]RMSSD [ ms]pNN50DFA:α2 LF HFSTDCAPErv
females

20–29962 ± 23107 ± 860 ± 530 ± 40.96 ± 0.021.5 ± 0.23.1 ± 0.14.9 ± 0.42.2 ± 0.03
30–39880 ± 1977 ± 536 ± 512 ± 41.06 ± 0.032.5 ± 0.52.6 ± 0.12.8 ± 0.62.3 ± 0.04
40–49905 ± 2681 ± 634 ± 512 ± 41.06 ± 0.022.3 ± 0.42.6 ± 0.12.6 ± 0.62.3 ± 0.03
50–59947 ± 1874 ± 533 ± 310 ± 31.06 ± 0.031.8 ± 0.22.6 ± 0.12.6 ± 0.52.3 ± 0.03
60–69944 ± 2876 ± 929 ± 27 ± 21.07 ± 0.021.4 ± 0.12.5 ± 0.11.9 ± 0.42.4 ± 0.02
70–79934 ± 2669 ± 330 ± 58 ± 31.05 ± 0.051.8 ± 0.52.3 ± 0.21.2 ± 0.32.5 ± 0.02
80–89972 ± 3781 ± 833 ± 36 ± 21.08 ± 0.061.9 ± 0.52.4 ± 0.11.2 ± 0.42.5 ± 0.02
males

20–291055 ± 25138 ± 1178 ± 938 ± 51.01 ± 0.021.6 ± 0.33.3 ± 0.14.5 ± 0.42.2 ± 0.03
30–391030 ± 27124 ± 863 ± 929 ± 51.01 ± 0.032.5 ± 0.53.1 ± 0.14.4 ± 0.62.3 ± 0.04
40–49977 ± 3198 ± 639 ± 315 ± 30.99 ± 0.024.0 ± 0.82.7 ± 0.13.1 ± 0.42.3 ± 0.02
50–59936 ± 2893 ± 633 ± 47 ± 21.04 ± 0.023.8 ± 0.52.5 ± 0.11.9 ± 0.32.4 ± 0.02
60–69996 ± 2585 ± 631 ± 39 ± 31.07 ± 0.033.2 ± 0.52.5 ± 0.12.2 ± 0.52.4 ± 0.02
70–79926 ± 3185 ± 1340 ± 813 ± 41.03 ± 0.032.0 ± 0.32.6 ± 0.11.2 ± 0.32.4 ± 0.03
80–89876 ± 2386 ± 1048 ± 1811 ± 70.98 ± 0.072.8 ± 0.92.4 ± 0.21.2 ± 0.42.5 ± 0.05
RR—the mean of normal-to-normal RR-intervals (NN-intervals), SDNN—standard deviation of NN-intervals; RMSSD—the square root of the mean of the sum of the squares of differences between successive NN-intervals; pNN50—the percentage of NN-intervals that vary more than 50 ms from the previous interval; DFA: α2—scaling exponent of detrended fluctuation analysis (DFA) for long-term fluctuations, i.e., the scaling properties of the square-root fluctuations of the integrated and detrended data estimated for scales 16 ≤ n ≤ 64; LF HF—ratio between LF and HF band powers calculated as the average of ratios of LF and HF computed for window width 256 s with 50% overlap by the Welch’s periodogram method; ST—entropy rate follows Equation (6); DCA—approximate deceleration capacity follows Equation (4); PErv—permutation entropy with repeated values follows Equation (7).

