1. Introduction
The issues of regulating debt sustainability of a financial system by establishing budget constraints are relevant for different countries. The use of debt financing, on the one hand, contributes to an increase in investment activity and solutions to socio-economic problems. However, on the other hand, it inevitably leads to an increase in credit risk and the likelihood of a country’s default. Therefore, assessing debt sustainability is a subject of active discussion by the world’s scientific community (
Checherita-Westphal et al. 2014;
Kleyner 2015;
Checherita-Westphal and Rother 2012;
Reinhart and Rogoff 2010). The topic of public debt sustainability takes on special significance as global debt surges under the pressure of the COVID-19 epidemic (
Đukić et al. 2021).
According to the authors, the concept of debt sustainability of the budget, as the main source of the country’s resource base, is a provision on what level of government debt borrowing is acceptable for the economy of the state as a whole. Acceptability for the country’s economy means that with the existing actual level of public debt, the investment development of the state is achieved, combined with a low threat of bankruptcy and default.
In this paper, we aim to contribute to a better understanding of the debt limits of acceptable values of indicators of the Northwestern Federal District (NWFD) regions, and also propose a methodology for assessing the debt sustainability of a budget system, which includes a system of clear indicators of debt sustainability and is based on econometric methods of assessment.
The purpose of our study is to assess the debt sustainability of Russian region budget systems and determine the differentiated level of budget constraints. As such, the goals of the study are: to form a database of stability indicators of the budget system of Russian Federation regions for the period starting from 2010; to analyze the state and dynamics of development of debt financing in Russia; to conduct a comparative analysis of the debt burden on the budget system of Russia and foreign countries; to develop a methodology for assessing the debt sustainability of the budget system of Russian regions; to prove the differentiated public debt limits for each Russian region.
2. Materials and Methods
2.1. Debt Sustainability of the Budget System of Russian Regions
According to the study results presented herein, the amount of Russia’s public debt has been growing steadily over the past 10 years. At the same time, despite studies conducted by Russian scientists of the debt burden on the Russian Federation budget system, as well as studies on the relationship between public debt and economic growth conducted by foreign scientists, these studies are as a rule nothing more than a systematization of sources of information on the levels of these indicators, which do not justify the values of debt limits using a scientific methodology. Two parameters characterize this gap in the research: first, there is no statistical validity to the regional budget debt limits of the constituent entities of the Russian Federation; second, even though the upper limits of the local government debt of the regions are regulated by the Budget Code of the Russian Federation, the size of the budget constraint is only established for Russian regions in three categories, not taking into account the differentiation of indicators of socio-economic development within the categories for each of the 85 regions of the Russian Federation.
The values of the levels of debt sustainability of the regions of the Russian Federation depending on the three types of sustainability and their marginal values are presented in
Table 1.
As can be seen from
Table 1, in terms of the ratio of public debt to total budget revenues, low debt sustainability implies a limit value of less than 85%, which, in the opinion of the authors, implies a high debt limit and can contribute to the onset of a crisis situation associated with the impossibility of timely repayment of debt obligations of the municipality. The values of the indicators in the case of low debt sustainability essentially represent hard budget constraints, upon reaching which the debt is subject to immediate reduction. The values of indicators corresponding to the type of high and medium debt sustainability can be called soft budget constraints, upon reaching which the regions can increase borrowing if necessary; however, in this case, each additional loan is subject to approval by the government of the region.
At the same time, it should be noted that for regions with low debt sustainability, more stringent requirements are imposed on the part of the Ministry of Finance of Russia. These requirements include the need to harmonize regional programs of borrowing and guarantees, the implementation of market borrowings only for debt refinancing, and the development and approval of a plan to restore solvency. If a region with low debt sustainability fails to meet its solvency recovery plan, a process may be initiated to remove the region’s top official from office.
In this regard, important research issues are the establishment of the statistical validity of the upper limits of the standard values of public debt by collecting a statistical database of debt ratios (indicators), as well as the establishment of differentiated (different for each region) values of the upper limits of public debt. At the moment, the Budget Code of the Russian Federation regulates the values for such indicators as the debt-to-revenue ratio, debt cost-to-budget expenditures ratio, and debt cost-to-revenue ratio; however, the value is set to one for all regions of the Russian Federation, which does not take into account differences in the level of socio-economic development of each region of the Russian Federation.
From the foregoing, a scientific research problem is also objectively formed, which consists in substantiating the upper limits of the acceptable level of public debt using scientific classification methods, particularly the methodology of hierarchical cluster analysis, which allows dividing regions into three groups from minimal credit risk to high credit risk and determining the upper acceptable the limits of raising debt funds for the budgets of the regions of each of these groups. In this context, it is especially important to determine the upper limits of budget constraints for the regions of the third cluster (regions with a high level of debt). Such a statement of the scientific problem allows filling a gap in scientific research on the acceptability of the level of debt financing and revealing the limits of the upper limits of public debt for the regions of the Northwestern Federal District. The formulation of the scientific problem determines the scientific novelty of the study, which consists in substantiating the marginal values of the debt burden indicators of the budget system of the regions of the Northwestern Federal District based on the systematization of selected signal indicators, the classification of statistical data of indicators by region using the method of hierarchical cluster analysis.
2.2. Literature Review
The relationship between economic growth and public debt has been widely discussed in the scientific literature for the past 30 years. Such studies are based on extensive empirical data from different countries (China, Eurozone countries, BRICS countries, Great Britain, Malaysia, etc.) for a period from 20 to 50 years and have a high scientific validity of results (
Checherita-Westphal and Rother 2012;
Zhao et al. 2019;
Azam 2019;
Joy and Panda 2021). Indeed, several scientific works prove the significant impact of public debt on economic growth (
Baharumshah et al. 2017;
Zhao et al. 2019;
Checherita-Westphal and Rother 2012), including through the positive impact of growing public investment (
Avdimetaj et al. 2021). At the same time, there are studies arguing that there is no evidence of such a consistent pattern (
Kluza 2016;
Égert 2015), as well as studies statistically justifying the level of debt burden, for which there is a negative correlation between public debt and the country’s GDP, and which leads to a decrease in economic activity (
Eberhardt and Presbitero 2015;
Reinhart and Rogoff 2010). In the study of
Caner et al. (
2021), which is based on data from 29 OECD countries, it was found that the threshold impact of the interaction of public and private debt on economic growth is negative and significant when the ratio of total debt to GDP reaches 220%. The study also found that the actual effect of individual debt is vastly underestimated if the interactive effect is omitted. The downside is that government debt is crowding out private investment, which leads to decreased investment activity within nonstate companies (
Huang et al. 2020).
Few academic papers have focused on the factors behind the turning point between public debt and economic growth (
Batini et al. 2019;
Butkus et al. 2021;
Demirci et al. 2019). In a study by Butkus et al., it was noted that an increase in government debt-to-GDP ratio is not necessarily detrimental to growth if there is a high level of investment activity in the country at the same time, while specifying the threshold value of the expenditure multiplier, at which time government debt will hold back economic growth (
Butkus et al. 2021). There are also studies that have found that the level of socio-economic development and financial inclusion in terms of debt burden in a country moves closely with each other (
Sarma and Pais 2011).
As our study is devoted to the assessment of budget constraints of public debt, the results of the study on sustainability of the fiscal policy of Austrian municipalities are essential for us, particularly when the effectiveness of using the municipal debt limits for reducing budget deficit has been proven, based on an adaptive version of Bohn’s sustainability test method (
Bröthaler et al. 2015). At the same time, the authors note that municipalities have widely cut investments in local infrastructure, which reduces the long-term quality of available infrastructure. In the study of Chudik et al. (
Chudik et al. 2017), statistically significant threshold values were obtained as to the debt burden of budgets for countries with growing debt. The need to reduce the country’s debt burden to a sustainable level was confirmed.
In this context, studies of indicators on fiscal federalism or fiscal decentralization are also important, because, in addition to studies on how fiscal centralization affects economic growth, they present an empirical analysis based on a set of panel data, and a wide range of indicators of fiscal federalism are presented (
Akai et al. 2007;
Maličká and Martinková 2018). To a large extent, the authors’ choice of indicators of debt sustainability, which are presented in
Section 3, was made on the basis of an analysis of similar scientific studies widely represented in the international literature.
2.3. Methodology for Assessing Debt Sustainability of the Regional Budget System
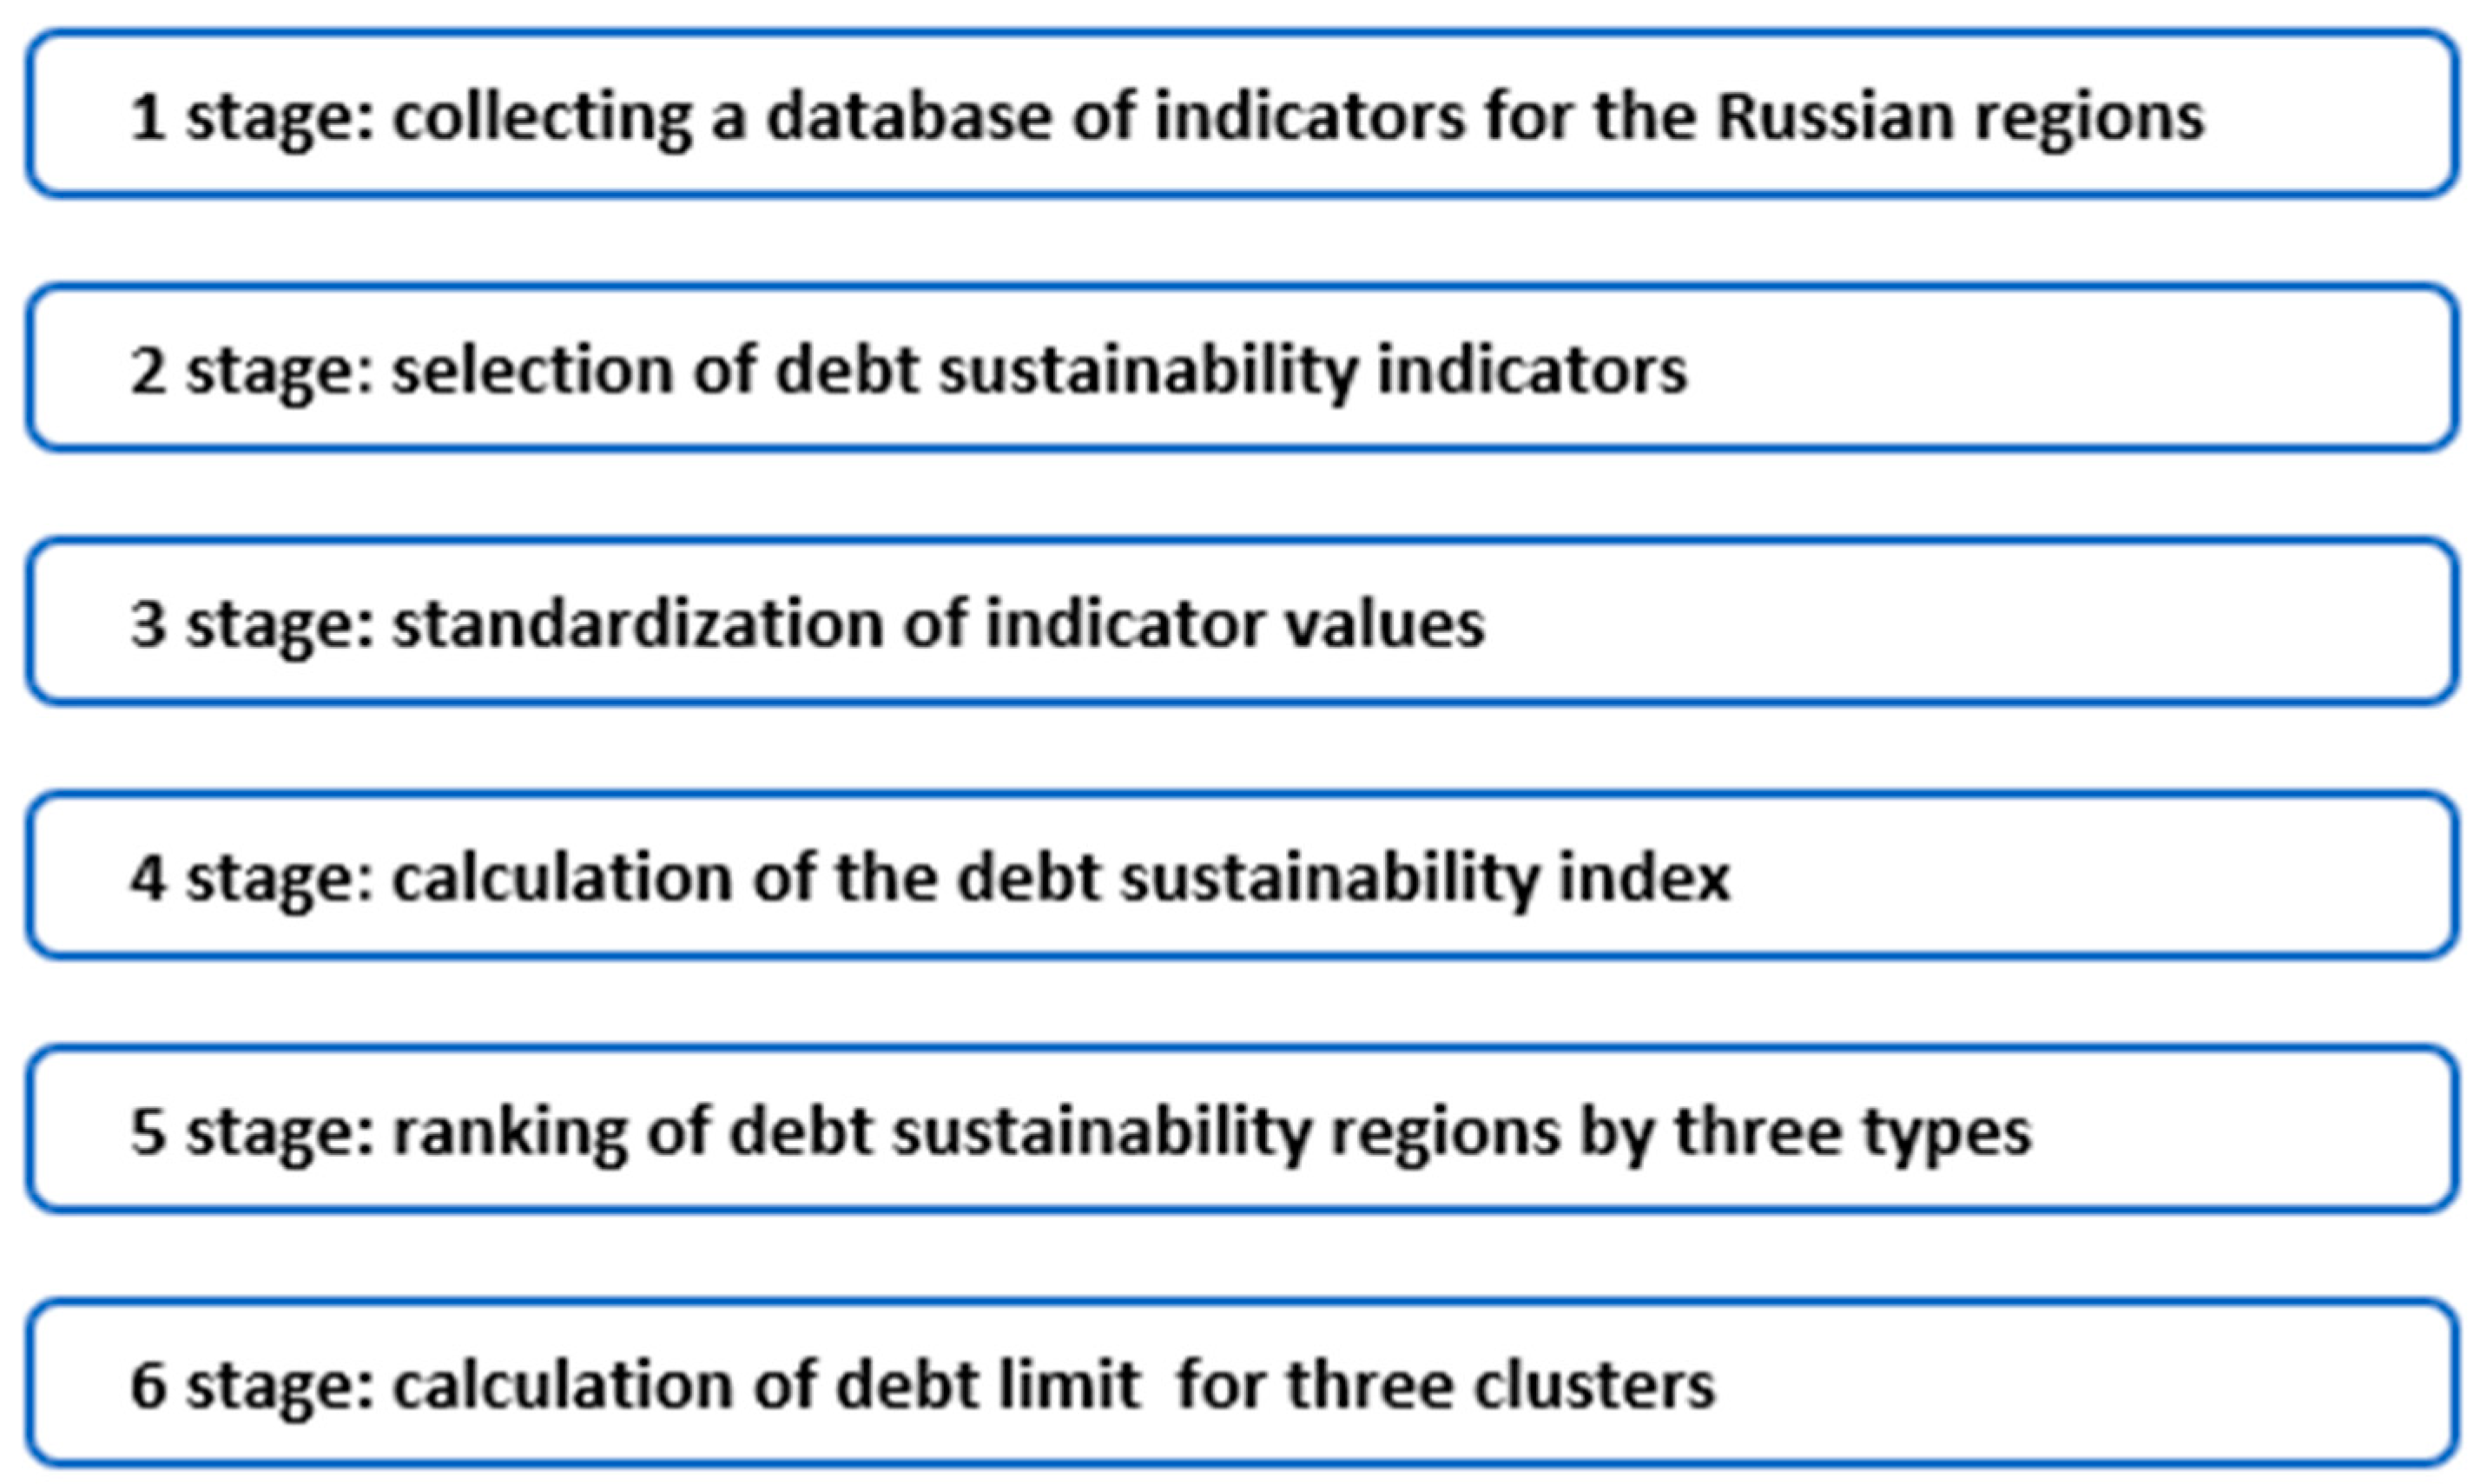
The assessment of debt sustainability of the budget system of Russian Federation regions was carried out using the author’s methodology, which involved a set of stages and methods of assessment, as well as a certain algorithm for their application. The developed methodology assumes the justification of choice and systematization of indicators of the debt sustainability, standardization of their values based on the method of Euclidean distances, calculation of the integral indicator of the debt sustainability, its ranking using the multivariate mean formula, as well as the division of regions into three debt sustainability groups with the determination of the limit values (threshold values and limits) for each group using the hierarchical cluster analysis (
Figure 1).
When developing the methodology, the authors took into account a number of requirements: the system of indicators should cover all components of the regional financial system in four sectors (debt sector, public finance sector, personal finance sector, corporate finance sector); the number of indicators should be limited and the indicators should be essential to assessing the sector; indicators should be easily accessible on the website of departments; there should be an applicable method for bringing indicators with different units of measurement into an integral one. Preference is given to the use of relative indicators in order to avoid significant differences within regions, taking into account their differentiation in terms of socio-economic development.
The first stage of the study involved using open data from the Federal State Statistics Service to form statistical, financial, and economic 26 variables for the Russian economy. Next, about 13 indicators of debt security often found in scientific research were calculated. Then, in the second stage of the study, using the correlation analysis method, six indicators of debt sustainability that had a very close connection with the value of the region’s local government debt were selected. During the third stage of the study, the indicator values were standardized. The Euclidean method distances were applied to take into account the degree of differences of each indicator across federal districts.
This method makes it possible to take into account not only the absolute values of the indicators of each region, but also the degree of their proximity to the benchmark indicator. The coordinates of the compared regions are expressed in fractions of the corresponding coordinates of the standard, taken as a unit. This takes into account how the indicator characterizes the state of the region: if the indicator is direct, then the greater its value, the higher the stability of the regional financial system; if the indicator is the opposite, then the smaller its value, the higher the stability of the system. The formulas for standardizing indicator values across the four sectors are given below.
Ki—assessment of the level of development of the i-region for each indicator; Xi—value of the indicator in the region i; max(Xi), min(Xi)—indicator-standard, which can be chosen as the optimal values of indicators of regional development.
At the fourth stage of the study, the standardized values of six indicators were averaged over a dynamic series using the multivariate mean formula. A composite index (an integral indicator) of the debt sustainability was calculated for each region of the NWFD.
This task required the use of the multivariate mean formula, which is given below:
—the integral value of the RFU stability level, comparable to the average level of the value for the regions, taken as 1.00; i = 1, …, k—total number of analyzed regions; —reduced private indicators; —numerical value of n indicator for -region; —the numerical value of n on average for the analyzed regions; Kn—the total set of all integrable partial indicators for this factor.
At the fifth stage of the study, a hierarchical cluster analysis was carried out, and the limit boundaries were obtained for the six indicators for each region.
Cluster analysis was used as a method for studying statistical sets of connections because it is one of the methods of multivariate classification that allows you to select areas of accumulation of objects from the dataset and combine them into groups (segments) that are homogeneous in terms of characteristics. The control of budget constraints within the boundaries we have identified will increase the debt sustainability of the budget system of the Russian regions. We also used a distance matrix of indicators over the regions of the NWFD for each analyzed period and divided the dataset into three clusters according to the type of debt sustainability: low, medium, and high.
At the same time, the limitations of the developed methodology include the high complexity of its use on large data arrays, as well as the fact that when calculating the multivariate average, individual indicators are included in the calculation on an equal footing. The advantage of the technique is the relative simplicity and clarity of use, and the transparency and ease of logical interpretation of the results.
2.4. Data and Research Methods
The study is based on open data from the Federal State Statistics Service and the Ministry of Finance of the Russian Federation: 26 absolute variables of socio-economic development of the Russian regions were selected in 11 regions of the Northwestern Federal District over the period from 2010 to 2020, such as local government debt, foreign government debt, volume of exports and imports, gross domestic product, population, average per capita income of people, and expenses for repayment and servicing of local government debt. Based on the absolute indicators, the authors calculated 6 relative debt sustainability indicators for 11 regions of the NWFD.
The study used methods of comparison and grouping, correlation analysis, the method of Euclidean distances, calculation of the multivariate mean, and hierarchical cluster analysis. The selection of debt sustainability indicators was carried out using correlation analysis, which has proven itself as a method for studying the relationship between the debt sustainability of the budget system and the risk of public debt (
Li et al. 2021). We used correlation analysis to determine the closeness of the relationship between the value of the public debt of regions and the indicators of debt sustainability; based on the value of the correlation coefficient and refutation of the null hypothesis, six indicators of debt sustainability were selected.
The integral debt sustainability indicator calculation was carried out using the multivariate mean formula, which has proven itself for ranking indicators of digital potential (
Kiseleva 2020). The hierarchical cluster analysis was applied to determine budget constraints (limits of the public debt) for each region of the Northwestern Federal District. The hierarchical cluster analysis is one of the multivariate classification methods that allowed us to select regions of congestion of objects from the aggregate data, and combine them into groups (segments) that are homogeneous in terms of characteristics (
Kurushin and Vasilyeva 2017). We used the method of Euclidean distances and cluster analysis to standardize the obtained values. Both methods are widely used in the natural and social sciences to standardize and classify panel data (
Ghosh and Sahu 2021;
Barykin et al. 2021;
Bagirova and Shubat 2021;
Zolkover et al. 2020). Using a distance matrix of indicators over the regions of the NWFD for each analyzed period, we divided the dataset into three clusters. Then, the authors identified cluster centroids for each indicator, confirming the results obtained during the previous study stage and solving the problem of targeted statistical justification of the norms of budget restrictions on debt burden. We used intergroup communication as a method of clustering, and the Euclidean distance as a measure of the similarity between objects.
The authors applied the methodology based on the standardization of indicator values and the multivariate mean formula. The results allowed the authors to rank the regions according to the level of debt sustainability, and use of the hierarchical cluster analysis allowed them to group the regions by three types of debt sustainability, with the definition of acceptable indicator boundaries of the debt sustainability of each cluster. All calculations in our study were performed using SPSS Statistics software.
3. Results
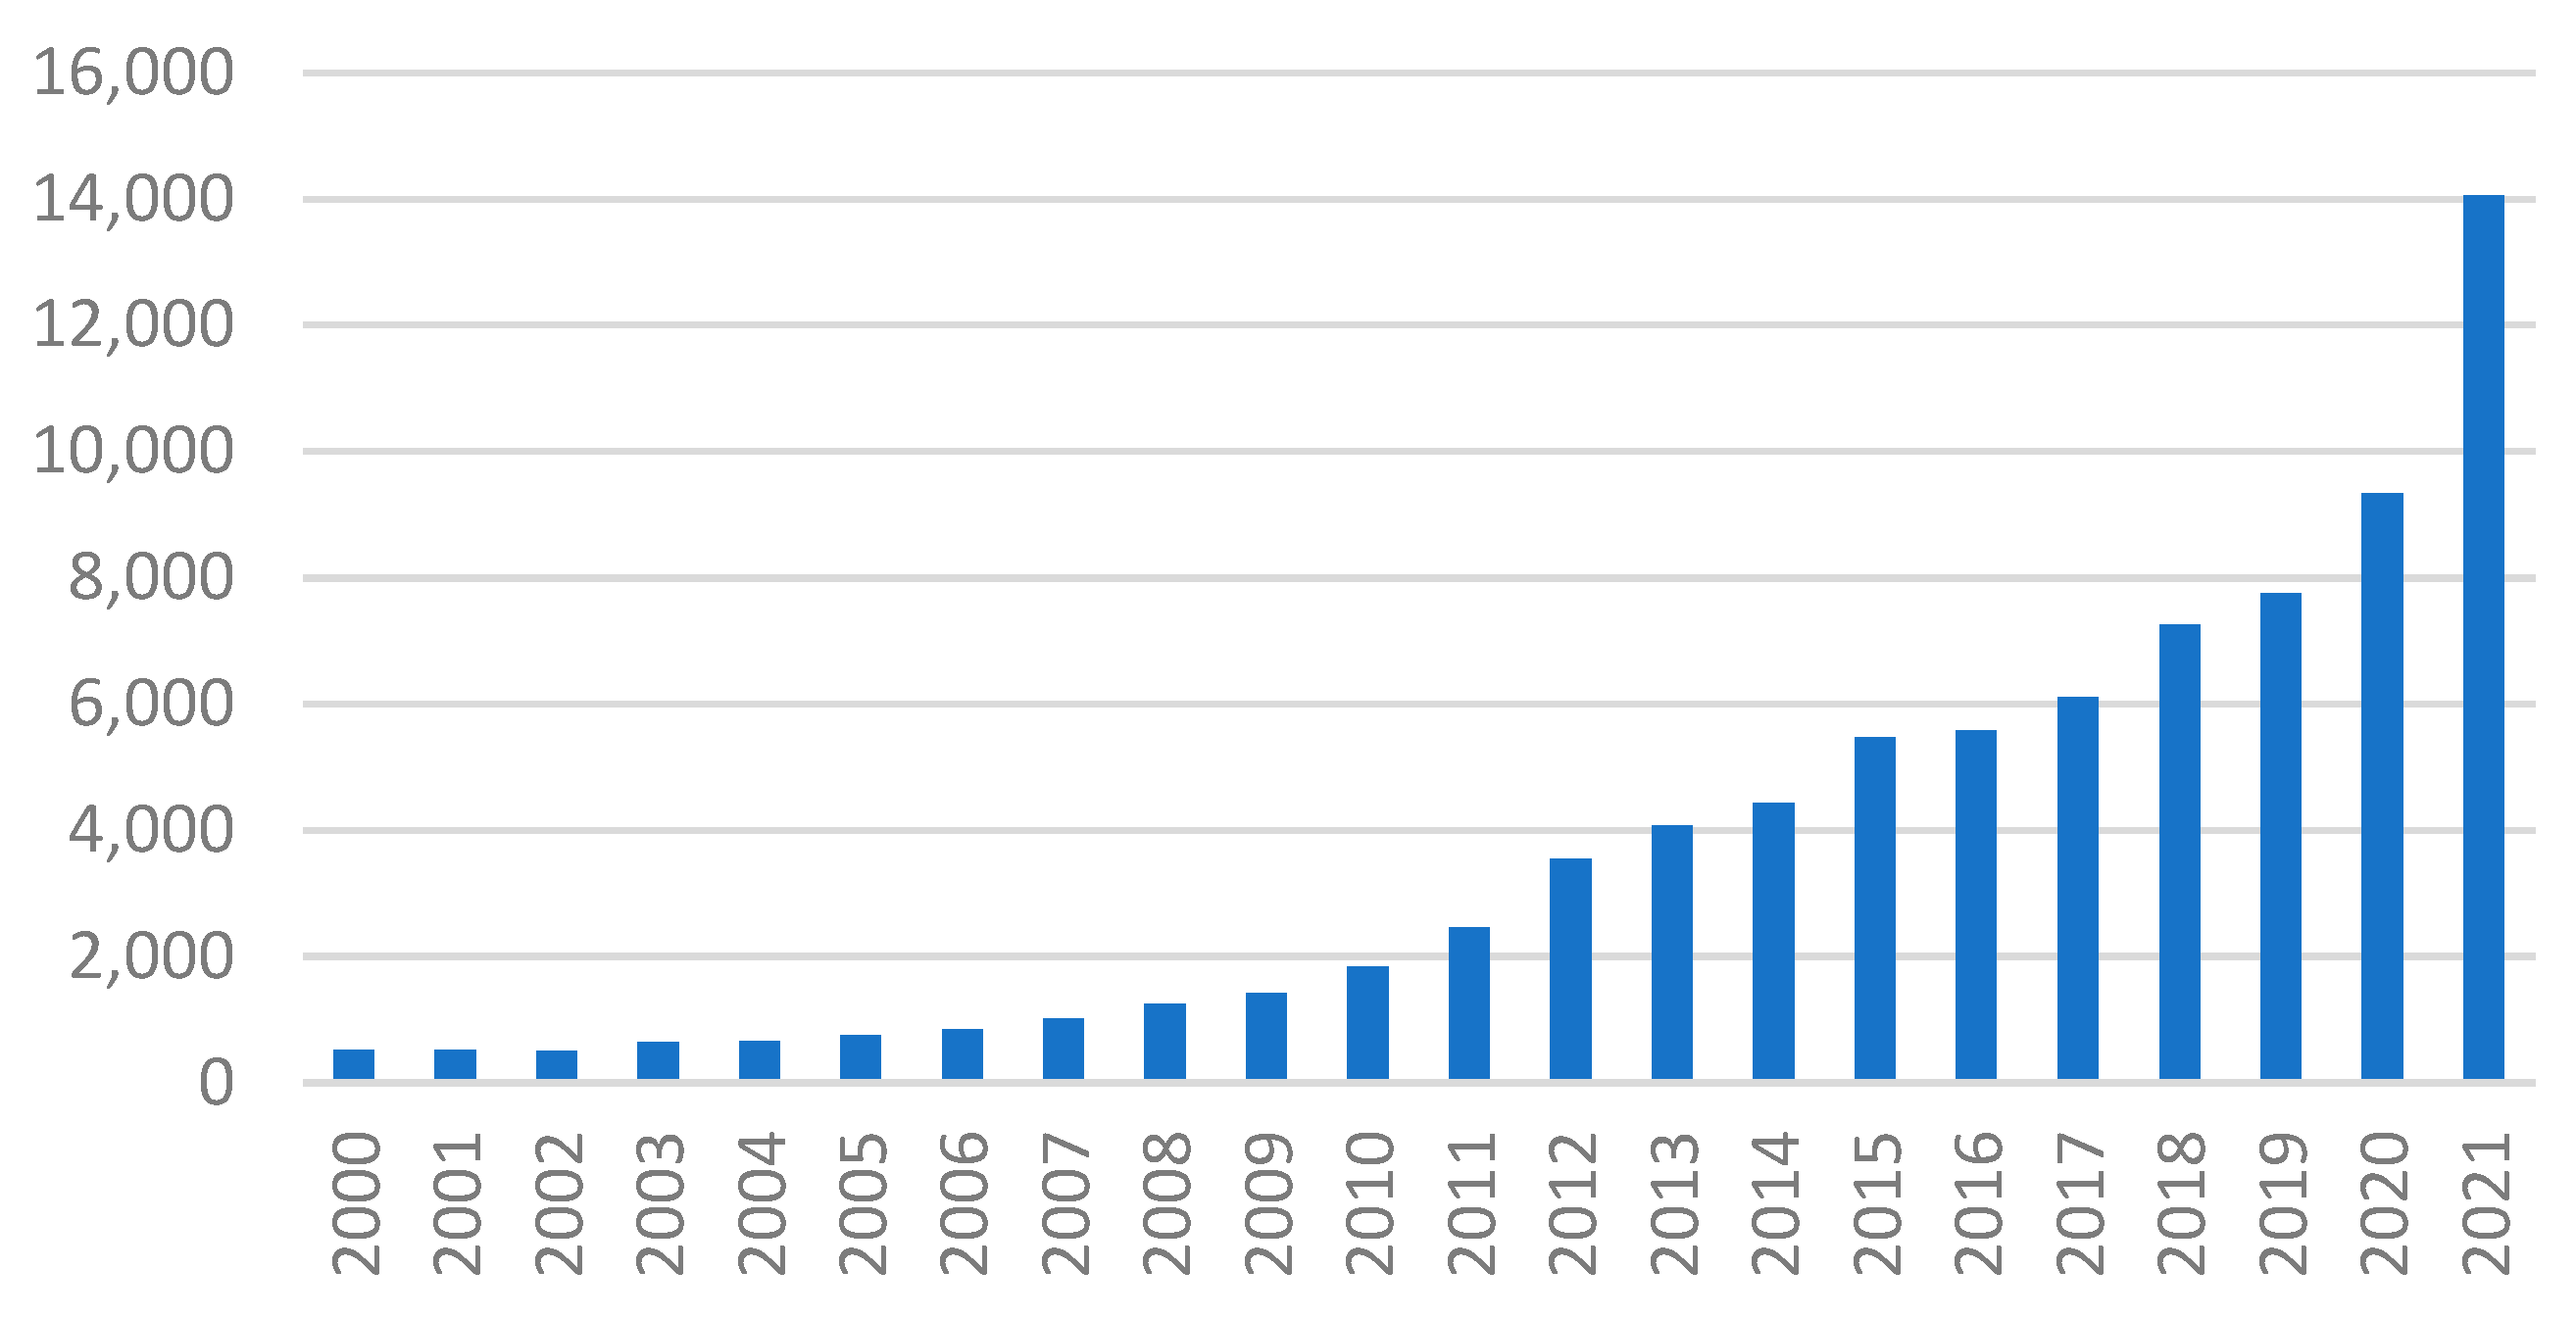
According to the Ministry of Finance of the Russian Federation and the Federal State Statistics Service, local and foreign government debt tends to grow. Such dynamics can be clearly traced through the issue of government bonds (
Figure 2).
As can be seen from
Figure 2, the amount of borrowing by the Ministry of Finance has increased significantly over the past 20 years, and the growth rate of the second decade exceeded the growth rate of the first decade. The most active growth occurred in the period from 2012 to 2020. The increase in the issue of government securities is a consequence of the influence of factors such as liberalization of the debt market, modernization of market infrastructure, increased transparency of the market, and simplification of the mechanism for purchasing securities. At the same time, a study of the directions of using the local government debt showed that the main direction is to cover the deficit of regional budgets. The shortage of regional budgets was caused by a decrease in budget revenues due to the 2014–2015 crisis, after the introduction of the policy of economic sanctions by the United States and the European Union. Along with this, expenditures of regional budgets increased due to changes in the tax legislation of the Russian Federation (reduction of the budget revenue) and implementation of the May decrees of the President of the Russian Federation (an increase in social expenses and, as a result, an increase in budget expenditures).
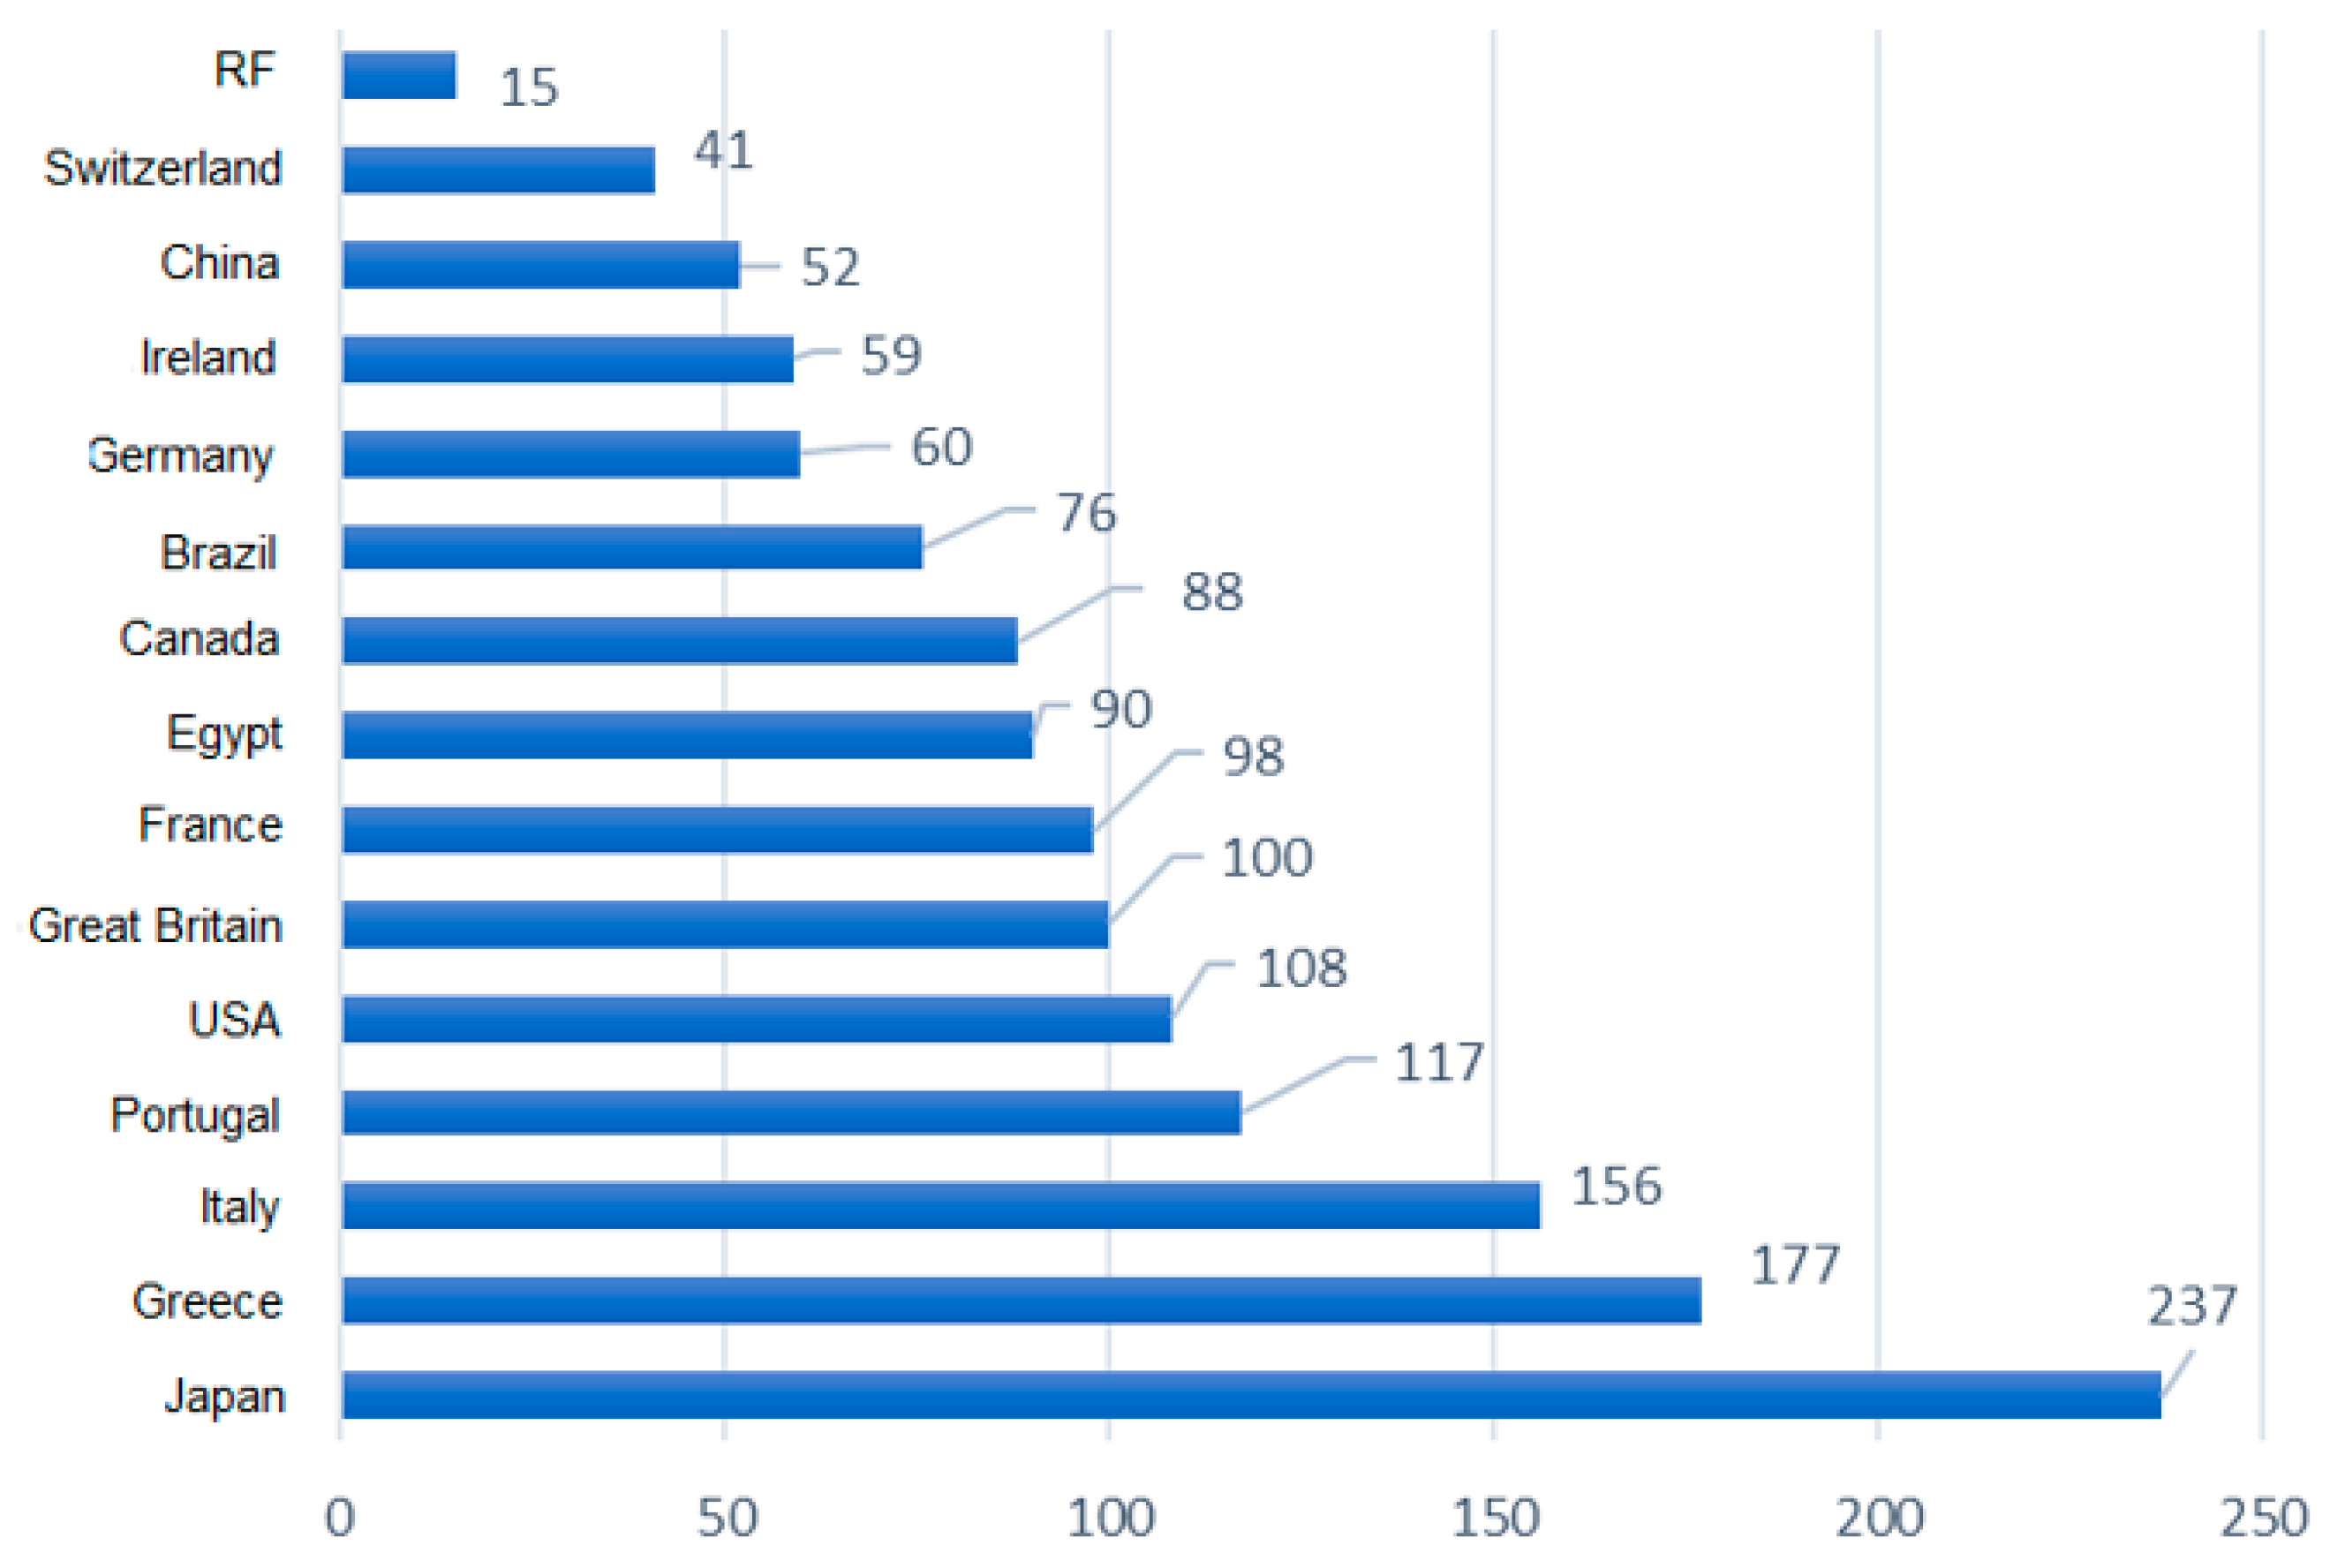
The authors found a negative point: the increase in investments in fixed assets of Russian regions at the expense of public debt is at a minimum level. The analysis of one of the main indicators of the country’s debt security, the debt-to-GDP ratio, among the countries of the world allows us to assert that despite the growth of the local government debt, Russia’s debt burden is low. Traditionally, Japan, the USA, and Euro region countries are notable for their high public debt (
Figure 3).
The performed correlation analysis of variables, which are given in most studies as variables of a country’s debt security, showed a high multicollinear relationship and determined the choice of debt sustainability indicators (
Table 2). The values of the correlation coefficients between variables indicate a high degree of influence of the selected variables on the amount of public debt, which confirms the validity of their use (or application) for calculating debt sustainability indicators. The data source of variables was the Federal State Statistics Service of the Russian Federation (
https://eng.rosstat.gov.ru/folder/75924, accessed on 20 April 2021).
When conducting a correlation analysis, the authors used macroeconomic variables, such as public debt, revenue, and GDP, the data on which characterize the level of variables in the country as a whole, as in order to justify the tightness of the relationship between variables and their influence on the amount of debt, this approach is well applicable. In the next stage of the study, data on variables were used that characterize their values for the regions of the Northwestern Federal District, as can be seen from the materials presented later in the article.
Debt sustainability indicators included:
Indicator 1 (R1)—the ratio of public debt to GRP; debt-to-GRP ratio.
Indicator 2 (R2)—the amount of local government debt per capita; debt-to-per capita ratio.
Indicator 3 (R3)—the share of public debt in regional exports; debt-to-regional exports ratio.
Indicator 4 (R4)—the ratio of public debt to total budget revenues; debt-to-revenue ratio.
Indicator 5(R5)—the share of expenditures on servicing of the public debt in regional budget expenditures; debt cost-to-budget expenditures ratio.
Indicator 6 (R6)—the ratio of annual payments for servicing and repayment of the public debt to total budget revenues; debt cost-to-revenue ratio.
Indicators R4, R5, and R6 refer to the regulated indicators of the Budget Code of the Russian Federation.
Indicator 1 reflects the overall level of debt burden in the region’s economy, as well as the potential for debt repayment. Indicator 2 makes it possible to understand the degree of differentiation in the debt burden and reflects the demographic potential for generating tax revenues to repay and service debt obligations. Indicator 3 characterizes the volume of foreign trade with foreign countries and the CIS countries, which can be used to service and repay the internal regional debt. Indicator 4 reflects the debt burden on the region’s budget. Indicator 5 reflects the average cost for the region of borrowed funds. Indicator 6 characterizes the current solvency of the region. The choice of six indicators is due to the fact that, first, they are calculated on the basis of variables that showed a strong relationship with the amount of public debt but, at the same time, do not have multicollinearity; secondly, the selected indicators are very often found in the works of foreign and Russian scientists as indicators of debt security; and thirdly, half of them are indicators for which budgetary restrictions are set for regional budgets. Indicator 3 characterizes the possibility of repaying the public debt from external sources, while all other indicators show the potential for using domestic resources.
Thus, the values of the indicators were calculated for the regions of the Northwestern Federal District for the period from 2010 to 2020. A fragment of the study results was obtained, containing sample data by years (
Table 3). According to
Table 3, we can see that two regions stand out from the rest due to the low values of indicators, which allows us to anticipatorily classify them as regions with a high level of debt sustainability: St. Petersburg and the Leningrad Region. High values of the indicators for the analyzed period are most often observed in the Republic of Karelia, the Republic of Komi, the Vologda, Arkhangelsk, and the Pskov regions. Therefore, these regions of the Russian Federation will most likely be classified as regions with a low level of debt sustainability.
Standardization of the indicator values using the method of Euclidean distances, and further ranking of the resulting base of standardized estimates using the multivariate mean formula, made it possible to obtain a debt sustainability index for each region of the NWFD (
Table 4). The multivariate mean formula in our study correlates the value of a standardized indicator with the average value for the regions in the assessed year. It allows us to identify the regions where the level of stability is significantly higher than the average value, close to the average value, and substantially lower than the average value.
Due to such gradation, all regions are well classified into three groups: high, medium, and low debt sustainability (
Table 5).
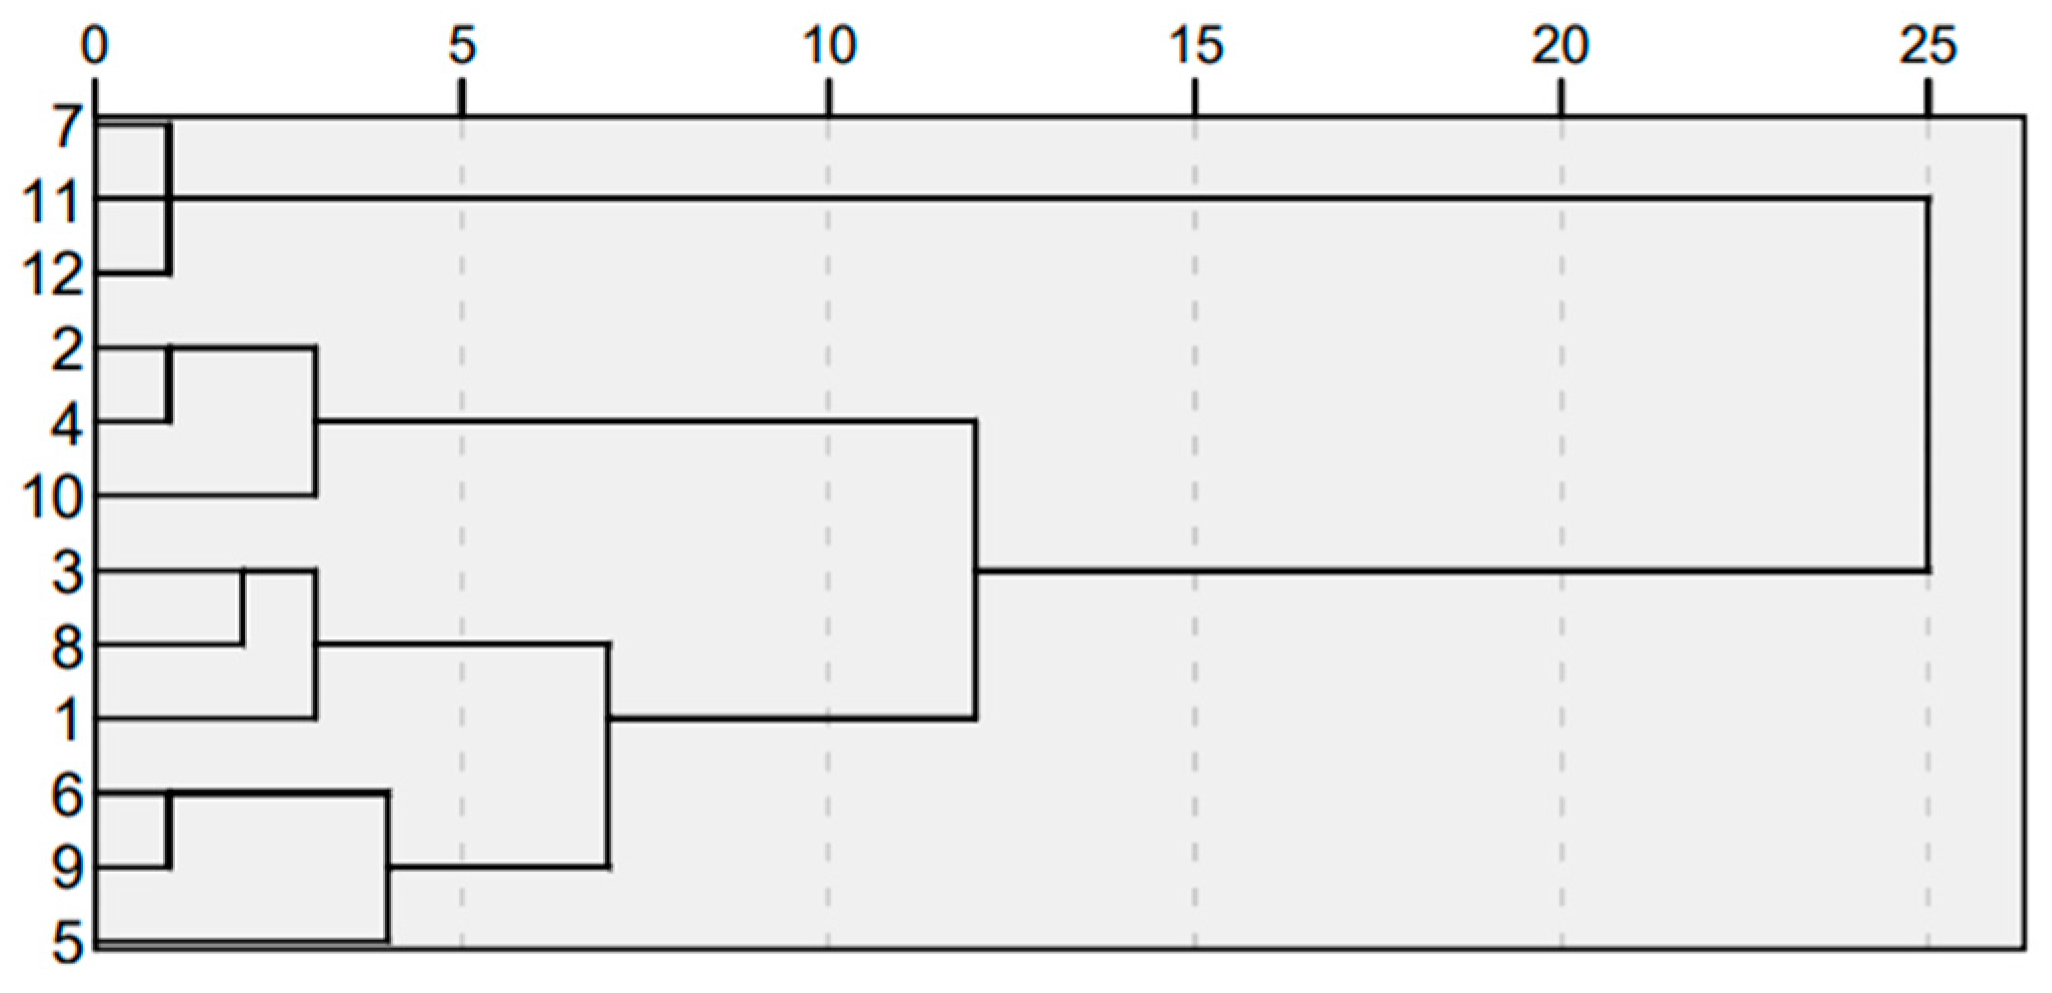
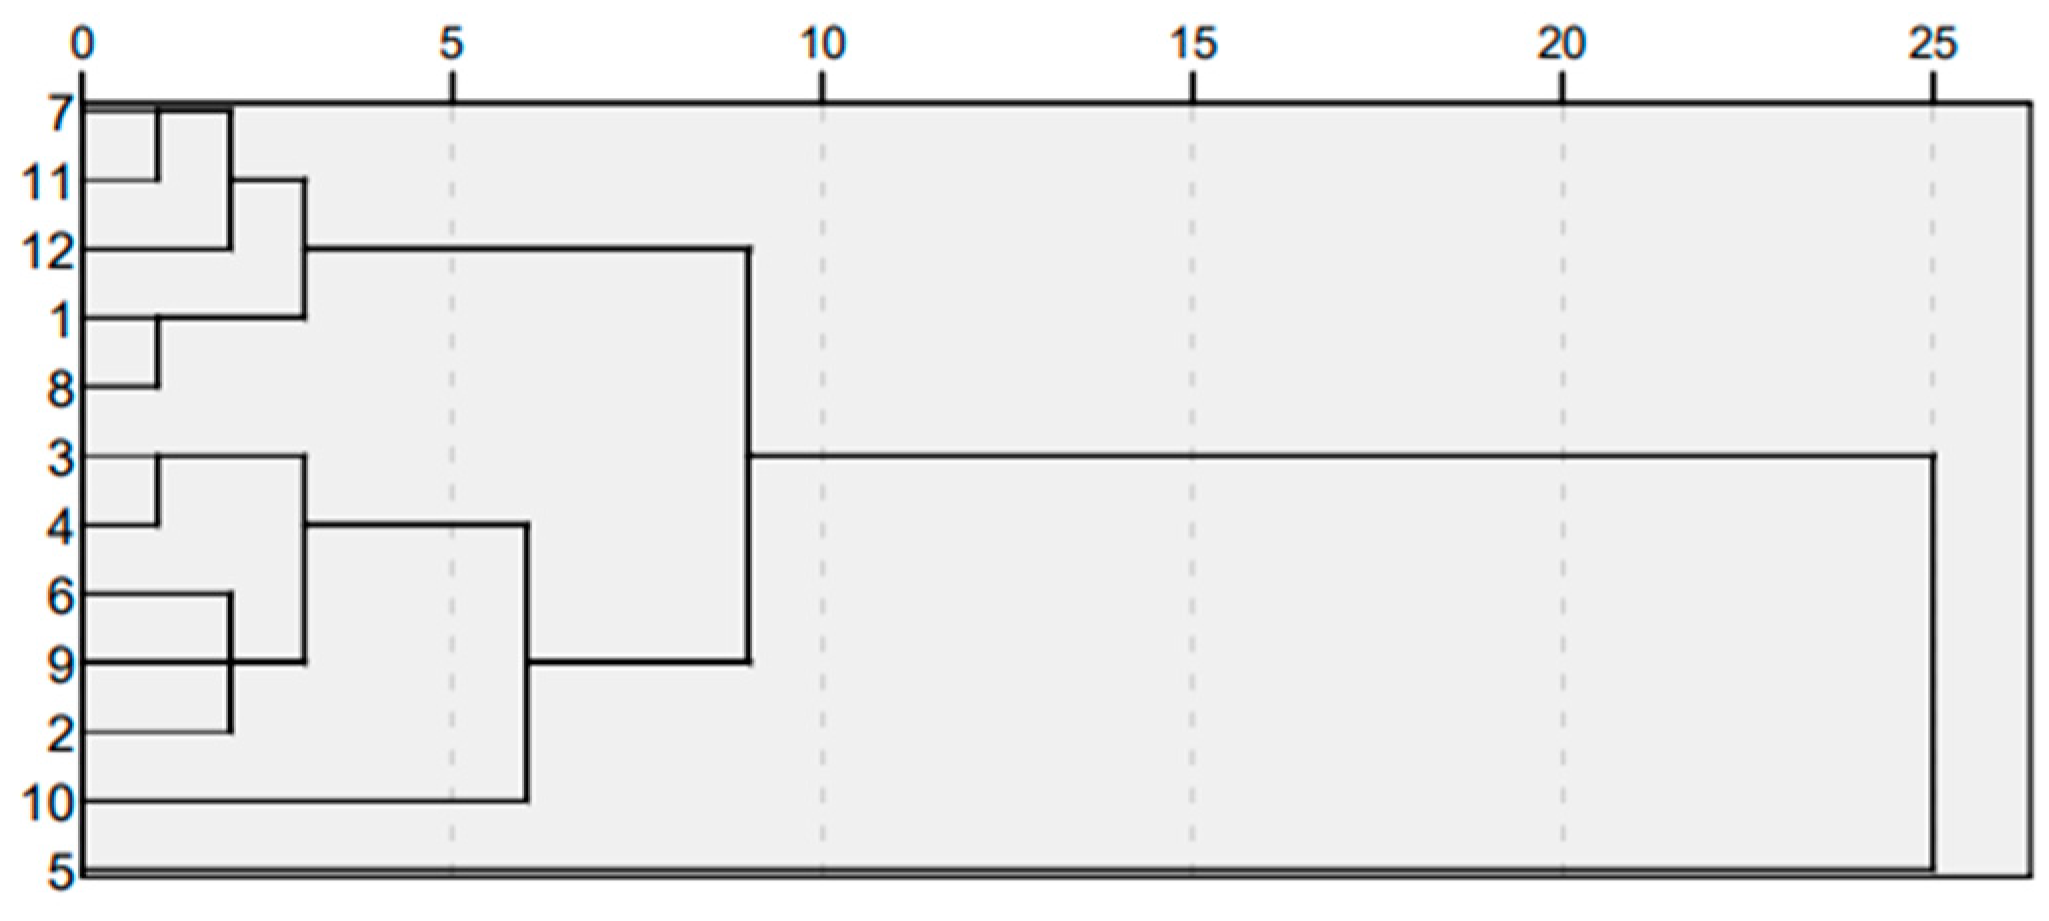
As we can see from the study results for the period from 2016 to 2018, the Republic of Karelia and the Republic of Komi, as well as the Pskov region, consistently fall into the group of regions with low debt sustainability, which allows us to conclude that there is a high risk of insolvency (default) and the need to establish some differentiated budgetary restrictions on the debt obligations in these regions. Novgorod and Arkhangelsk regions are also in the credit risk zone as they fell into regions with low debt sustainability in 2019 and 2017. To determine the limits of the public debt and justify the budget constraints for each indicator for the NWFD regions, hierarchical cluster analysis was applied in the final stage of the study. Using a distance matrix of indicators over the NWFD regions for each analyzed period, the regions were classified into three clusters with simultaneous identification of cluster centroids for each indicator. As a method of clustering, we used the method of intergroup communication, and as a measure of the similarity between objects, we used the Euclidean distance. The analysis was carried out using SPSS software. Here, we present the results of clustering by indicators R1 and R4 (
Table 6,
Table 7 and
Table 8,
Figure 4 and
Figure 5); a similar procedure was carried out for other indicators. We also present the obtained values of debt limits for each debt sustainability indicator (
Table 9).
Table 6,
Table 7 and
Table 8 demonstrate that the studied datasets are well grouped into three clusters and that the value of cluster centroids is subject to change. Nevertheless, the amplitude of fluctuations is not significant. The table indicates the need to change the budget constraints by year, depending on the macroeconomic situation in Russia. In our opinion, the results obtained also indicate the need to consider the time lag when setting the limits (upper boundaries) of the public debt, which is about 2–3 years.
In addition, in the opinion of the authors, as the government is ultimately responsible for the public debt policy and its reliability, the authors propose to update and revise the budget constraint values for each region every three years. Estimated values must be determined on the basis of the data of the Federal State Statistics Service, and these estimates should be used to set limits while coordinating them with the norms of the budget code. The simplicity and accessibility of the developed methodology allows us to carry out all of this. It is also recommended that the federal government set budget limits, taking into account the dynamics of changes in the debt limits over the past 5 years and the possibility of repaying the debt by the region. The main hypothesis of this paper is that by using the cluster analysis method, it is possible to increase the accuracy of determining the values of the limits of the budget constraints of the region’s financial system.
The study results also identified that the NWFD regions belong to three clusters: Cluster 1—high debt stability: St. Petersburg, Leningrad region, and Nenets Autonomous region; Cluster 2—medium debt sustainability: St. Petersburg, Vologda, Murmansk, and Kaliningrad regions; Cluster 3—low debt sustainability: the Republic of Komi, Republic of Karelia, Arkhangelsk region, Novgorod region, and Pskov region.
After analyzing the results obtained in different stages of the study, we can state with assurance that two regions of the NWFD (St. Petersburg and the Leningrad region) belong to regions with high debt sustainability, and three regions (the Komi Republic, the Republic of Karelia, and the Pskov region) need a reduction in the size of public debt and an establishment of strict budget constraints.
4. Discussion
The results of the study allow us to draw two important conclusions: first, the results of clustering are consistent with the results of assessing the integral debt sustainability index; secondly, there is no constant presence of the same region in the cluster, and the belonging to clusters of regions varies from year to year. The table also shows that such regions as the Republic of Karelia, the Republic of Komi, the Arkhangelsk, and Pskov regions are combined into a cluster with high values of indicators quite often, which makes it possible to classify these regions as regions with low debt sustainability. According to the results of the study, the level of debt in these regions is unsustainable, and the regions may be recommended a mandatory reduction in the level of debt through the repayment of part of the debt obligations. Of particular interest are the values of indicators R4, R5, and R6, as the upper limits of these indicators are regulated by the Budget Code of the Russian Federation and, at the moment, the indicators in these regions are on the verge of acceptability according to the norms. However, it is important to note that, according to the results of the study using the cluster analysis method, the eligibility limit has already been passed, and if the regions do not reduce their debt burden, they may soon face difficulties in repaying it and financing debt obligations.
At the same time, if we compare the level of global debt and Russia’s public debt, according to the main indicators of the country’s debt security “debt-to-GDP ratio”, the results of the study showed that Russia’s debt policy in comparison with the world borrowing practice is characterized by restraint. Japan, the USA, and the Eurozone countries are traditionally characterized by a high volume of public debt. Nevertheless, the assessment of the debt sustainability of the budgets of the Russian regions confirmed the need to reduce the debt burden for some regions of the NWFD.
The debt sustainability issues of the Russian Federation budget system are of decisive importance for maintaining the country’s debt security. In this paper, we sought to advance the understanding of debt sustainability, paying special attention to the Russian regions’ targeted formation of debt limits. In this regard, we proposed a reliable and understandable methodological apparatus for assessing debt sustainability of the budget system of Russian regions and tested it on data from 11 regions of one federal district. At the same time, the authors can recommend that other researchers use the chosen methodology to confirm the results of a broader dataset. The chiefs of municipal entities can use the data we have obtained to objectively assess the acceptable level of the debt burden and manage the size of the public debt in the event of a decrease in the debt sustainability of budgets. Further research directions within the framework of the given topic are determined by the need for an annual statistical justification of the differentiated values of the upper limits of the local government debt, taking into account the macroeconomic situation in Russia and the regional priorities of socio-economic development.
5. Implications and Conclusions
The results obtained during the course of the study made it possible to present a complete picture of the state and development of the local government debt, as well as to assess the debt sustainability index of Russian regions that are part of the Northwestern Federal District, using the identification of the level of safe boundaries of the debt sustainability according to six indicators. Using data on 11 regions of the Northwestern Federal District from 2010 to 2020, our estimates reflect a decrease in the debt sustainability of most NWFD districts and the need to establish differentiated budget constraints for each constituent entity of the federal district.
The analysis of the state and development of debt financing in Russian regions showed that the volume of the Russian Federation’s local government debt over the past 10 years tends to grow moderately (7.4%). Moreover, the main direction of using the local government debt is covering the regional budget deficit, which is primarily due to a decrease in revenue due to changes in Russian tax legislation and an increase in social expenditures. A negative aspect is the small share of debt investments in fixed assets of the Russian regions (investments at the expense of the public debt), which does not stimulate Russia’s GDP growth through debt obligations and does not contribute to economic growth.
The value of one of the main debt sustainability indicators, debt-to-GDP ratio, suggests that, compared to world borrowing practices, Russia’s debt policy is distinguished by restraint and moderateness compared to economically developed countries such as Japan, the USA, and Euro region countries. In 2020, the share of debt in the GDP of Japan amounted to 237%; Greece, 177%; Italy, 156%; USA, 108%; France, 98%; China, 52%; Russian Federation, 15%. Nevertheless, the relevance of assessing the debt sustainability of budgets of Russian regions is confirmed by the results of an indicative analysis, which showed that the values of 6 indicators for 11 regions of the Northwestern Federal District have a high degree of differentiation (the maximum differentiation is 25 times).
The ranking of the NWFD regions based on the debt sustainability index revealed the regions with an index value greater than 1. They include the city of St. Petersburg, Leningrad, and Kaliningrad regions. Such index values indicate high debt sustainability. Regions with low debt sustainability included regions with the minimum values of the debt sustainability index: the Republic of Komi, the Republic of Karelia, and the Pskov region.
As a result of classification of the NWFD regions into three clusters using the cluster analysis, the regions were divided into three clusters according to types of debt sustainability. The regions with high debt sustainability include St. Petersburg, the Leningrad region, and the Nenets Autonomous region, which characterizes these regions as regions with an effective debt policy of the regional authorities. The group of regions with low debt sustainability included 46% of the regions of the Northwestern Federal District: the Republic of Komi, the Republic of Karelia, the Arkhangelsk region, the Novgorod region, and the Pskov region. Therefore, the authors conclude that there is a high risk of insolvency and a need to establish strict budget constraints using the values of the indicators obtained in the study for the regions of this cluster.


 ,
, 


