
Food Inflation Examination through the Dynamic Nexus between Olive Oil and Substitutes

Department of Economics, University of Thessaly, 28th October 78, P.C. 38333 Volos, Greece
Economies 2024, 12(3), 57; https://0-doi-org.brum.beds.ac.uk/10.3390/economies12030057
Submission received: 3 January 2024
/
Revised: 20 January 2024
/
Accepted: 17 February 2024
/
Published: 25 February 2024
Abstract
:This study provides insights into food inflation by investigating the dynamic interconnectedness of the prices of olive oil, soybean oil, sunflower oil, and palm oil. Using data from January 1990 to October 2023, averaged dynamic and extended joint connectedness analyses are conducted by employing the innovative Time-Varying Parameter Vector Autoregressive (TVP-VAR) methodology. The findings reveal that olive oil presents a low connection with substitute oils and generates net spillover effects, especially at the onset of COVID-19 but also at later stages and during the Russia–Ukraine war. Palm oil transmits effects on the system of oils before the Global Financial Crisis (GFC) but renders a net receiver afterward, while sunflower oil follows the opposite way. Systemic connectedness is the highest during the GFC and remains elevated during QE-tapering. It slightly increases during COVID-19 outbursts and illustrates higher spikes when the Russia–Ukraine conflict begins. These linkages are even stronger among only the substitute oils.
JEL Classification:
E21; E31; E44; E52; E58; E71; G151. Introduction
Abrupt increases in market values of agricultural commodities have significantly contributed to the loss of purchasing power to a worldwide extent. Food price inflation is considered to be of major importance for social cohesion, wealth and income disparities, and policymaking (Peersman 2022). There is also the notion that food inflation is much more volatile than headline inflation (Kotz et al. 2023). Moreover, food market values are believed to remain high if supply-side price pressures persist and aggregate demand for food commodities does not weaken (Scott et al. 2023). Food prices have displayed strong connectedness in the past, and this is more obvious during crises (Ahumada and Cornejo 2016). It is a general perception that low-income and middle-income households and economies are mostly damaged from the severe consequences of food inflation, and this is more pronounced when the latter generates second-round effects on inflation (Ginn and Pourroy 2020). This study does not employ data on food inflation but provides insights into the dynamic connectedness between pairs and among groups of oil food categories so as to estimate whether they present a weak or strong nexus and at what level this could prove to be useful for increasing consumption capacities by directing demand to substitute products of olive oil with no great loss of utility.
Olive oil constitutes one of the most important elements of the Mediterranean diet, which enjoys increasing levels of popularity around the globe due to the extensive promotional campaigns conducted by the European Union that emphasize the benefits of a diet rich in olive oil. This has resulted in the latter being considered one of the major food commodities in terms of demand (Rallatou and Tzouvelekas 2016). Consequently, inflationary pressures on the price of olive oil are significant drivers of food inflation overall. The importance of inflationary pressures concerning agricultural food commodities strengthens in stressed periods such as a health crisis when good nutrition plays a pivotal role. Moreover, the price of olive oil is crucial in periods of troubled food supply management, such as the Russia–Ukraine conflict, as agricultural commodity markets experience shortages in supply and intense demand-driven but also supply-driven inflation. The escalation of issues surrounding food inflation in major agricultural commodity markets is the reason why this study undertakes the strenuous task of unveiling dynamic links between olive oil and its substitutes. The aim of this paper is to serve as a pivotal resource for policymakers and market participants by offering insights into the levels of substitutability between olive oil and cheaper oil products.
This paper overlaps with two strands of the literature. The first strand builds on the nexus among food commodity markets that gains attention because their pass-through to inflation becomes stronger as crises evolve. The second strand relates to the nascent literature focusing on whether inflationary phenomena could be confronted with the use of substitutes for food commodities of primary importance and special characteristics (such as olive oil) and a better allocation of resources. The innovative Time-Varying Parameter Vector Autoregressive (TVP-VAR) framework is adopted for the purposes of investigating the net pairwise as well as the dynamic extended joint connectedness among olive oil, soybean oil, sunflower oil, and palm oil from January 1990 to October 2023.
Econometric evidence reveals that olive oil displays low dynamic connectedness with soybean oil, sunflower oil, and palm oil. Differently said, olive oil, which is highly valuable from a nutritional perspective and especially useful for preserving good health, has only weak substitutes, and this leads to high prices in periods of high demand and scarcity in the quantity supplied. Soybean oil and palm oil display the highest connection with each other. Interestingly, olive oil is an absorber of systemic spillover impacts in normal economic conditions and the Global Financial Crisis but turns into a generator of impacts during the COVID-19 health crisis—which raises the necessity for good health—and the Russia–Ukraine conflict, which reduces real disposable income due to high inflationary pressures. This happens as these two major crises result in obstacles in supply chain management and cause excessive demand for food commodities of major importance. Notably, health crises and geopolitical tensions and conflicts bring to the forefront the more sizeable impacts generated on the real economy by major and high-quality agricultural food commodities such as olive oil.
The remainder of this study is structured as follows. Section 2 provides the main literature about olive oil or relevant oil markets and how food inflation is linked with overall inflation and economic growth. Section 3 presents the data and methodology employed for estimations. Furthermore, in Section 4, the econometric outcomes are laid out and analyzed and the economic implications are provided. Finally, Section 5 offers the conclusions and suggests avenues for further research.
2. Literature Review
The number of academic papers about food commodities has been rapidly growing. Inter alia, the literature about the drivers of olive oil prices has been proliferating, and this is more pronounced since the latest crises, which have brought to the forefront the struggle to fight inflationary pressures while achieving no loss of purchasing capacity regarding basic commodities. Moreover, the nexus of food inflation with overall inflation and GDP growth has resuscitated vivid academic interest.
By examining the determinants of oil prices, Xiong et al. (2014) support that income elasticity for virgin oils coming from the European Union is high but demand for non-virgin oils is inelastic. Olive oil demand in general is also inelastic. They reveal that olive oil types are highly substitutable with each other but not with vegetable oils. Olive oil is argued to be very popular due to the spread of the Mediterranean diet. Furthermore, Romo Munoz et al. (2015) provide evidence that the most influential determinants of oil market values are the oil acidity level, the tin can container of imported oil, and the origin. On the contrary, the retailer house brand and the plastic container are found to be negatively influential on olive oil prices. In a similar vein, Carbone et al. (2018) support that olive oil markets evolve rapidly by achieving vertical as well as horizontal differentiation that is very influential on their price and quantity. The raw material used, the type of producer and the production area constitute determinants of prices. By focusing on the nexus between oil types, Hassouneh et al. (2012) document that biodiesel, sunflower and crude oil market values exhibit a long-run equilibrium connection. It is found that energy prices are influential toward sunflower oil prices, and this effect is enabled through short-run dynamics. Santeramo et al. (2021) provide evidence of strong linkages between the prices of sunflower and soy oils and that vegetable oils such as rapeseed, soy, and sunflower oils are highly competitive with each other, so they constitute net substitutes in supply. Higher palm oil and sunflower oil prices are negatively influential on rapeseed. In a similar vein, Chandrarin et al. (2022) reveal that the exchange rate in Indonesia responds to shocks in palm oil prices, especially at extreme quantiles of the Indonesian national currency in the long term.
There is also a rapidly growing strand of academic research on the nexus among an array of other agricultural products. Luo and Ji (2018) reveal the existence of weak volatility spillovers from the US crude oil market to China’s agricultural commodity markets. The emergence of negative volatility spillovers as significantly more influential than positive ones implies that volatility transmission generates a leverage impact across markets. Moreover, Ahumada and Cornejo (2016) document that examining corn, soybeans, and wheat markets by considering their strong interdependence leads to more robust estimations and efficiently tackles problems in forecasting accuracies. In their study, Zhang and Broadstock (2020) provide evidence that the global commodity markets have become significantly more linked with each other as concerns prices since the 2008 Global Financial Crisis. It is stressed that the food commodity price index contributes to the overall commodity system by more than 80%. This is argued to be striking compared with its lower than 20% contribution up to 2008. When it comes to Umar et al. (2021), they reveal that canola and corn transmit effects toward agricultural commodity markets, while orange juice, lean hog, sugar and rubber receive impacts. Systemic connectedness is higher during crises. Moreover, oil risk shocks are more influential than oil demand shocks or oil supply shocks. Moreover, Umar et al. (2022) present that softs, grains, and livestock are mostly connected with the COVID-19 Media Coverage Index during the first and the third wave of the pandemic. This media sentiment index is found to receive only weak effects from these agricultural commodities.
It is interesting to present the proliferating bulk of academic research that centers interest on the relation between food inflation, the overall inflation of an economy and growth perspectives. Mao et al. (2021) argue that flourishing economies, high interest rates and low inflation are related to the creation of price bubbles in agricultural commodities markets. Moreover, speculation and high liquidity in international markets reduce the probability of bubbles on China’s corm prices but increase the bubble probabilities for China’s soybeans. Breman and Storm (2023) support that higher future prices for crude oil generate impacts on oil spot prices and the futures prices of corn and soybeans. This suggests that speculation in oil markets is responsible for higher commodity inflation overall in the US. Samal and Goyari (2023) reveal that a small number of primary foods display larger food inflation due to real factors, while inflationary factors are more obvious and substantial in the case of manufactured food products. Notably, the food basket price levels are mainly influenced by one-quarter of the food commodities within it.
Gelos and Ustyugova (2017) document that economies in which food inflation is an important constituent of overall inflation and price increases have been persistent in the past are more inclined to present high and enduring inflationary pressures from shocks in commodity market values. These impacts are fortified when monetary authorities suffer from a lack of autonomy. Cavallo and Kryvtsov (2023) reveal that larger stockout levels during COVID-19 nourish noteworthy inflationary impacts in a three-month horizon. These phenomena are more intense concerning imported goods and sectors with large levels of imports. Product shortages are found to be significant drivers of inflation.
A number of interesting findings also emerge when the examination is centered on large economies. Reimers et al. (2023) argue that inflation is negatively influenced by real GDP growth in the Euro area when it takes values higher than the inflation target of 2%. Ferrante et al. (2023) document that US inflation during the COVID-19 health crisis was triggered by demand reallocation from services to goods. The cost of reallocation constitutes a serious impediment to a higher supply of goods and so creates higher market values. These inflationary pressures are not so intense due to the flexibility of goods prices in comparison with services market values. The inflation due to demand reallocation does not easily fade out after the pandemic. In a similar vein, Scott et al. (2023) support that US food inflation is higher than overall US inflation and processed food products have been the driving force of such increases in prices. Inflation is also strengthened by tight labor markets that lead to higher production costs. It is argued that high demand combined with high production and distribution costs could maintain elevated inflationary pressures.
By focusing on the nexus between food inflation and central bank activity, Kara (2017) argues that monetary policymaking by the Federal Reserve is not strongly influenced by food inflation. This happens as food market values are not assigned a weight analogous to their share in the economy when considered in the central bank’s policy rule. This is in contrast to Ginn and Pourroy (2020), who reveal that food inflation is important for shaping monetary action-taking in Chile. More specifically, higher food inflation leads to the imposition of higher interest rates. Food inflation also generates effects on non-food inflation later on. Overall, the economy enjoys higher welfare when monetary authorities focus on headline inflation targeting.
3. Data and Methodology
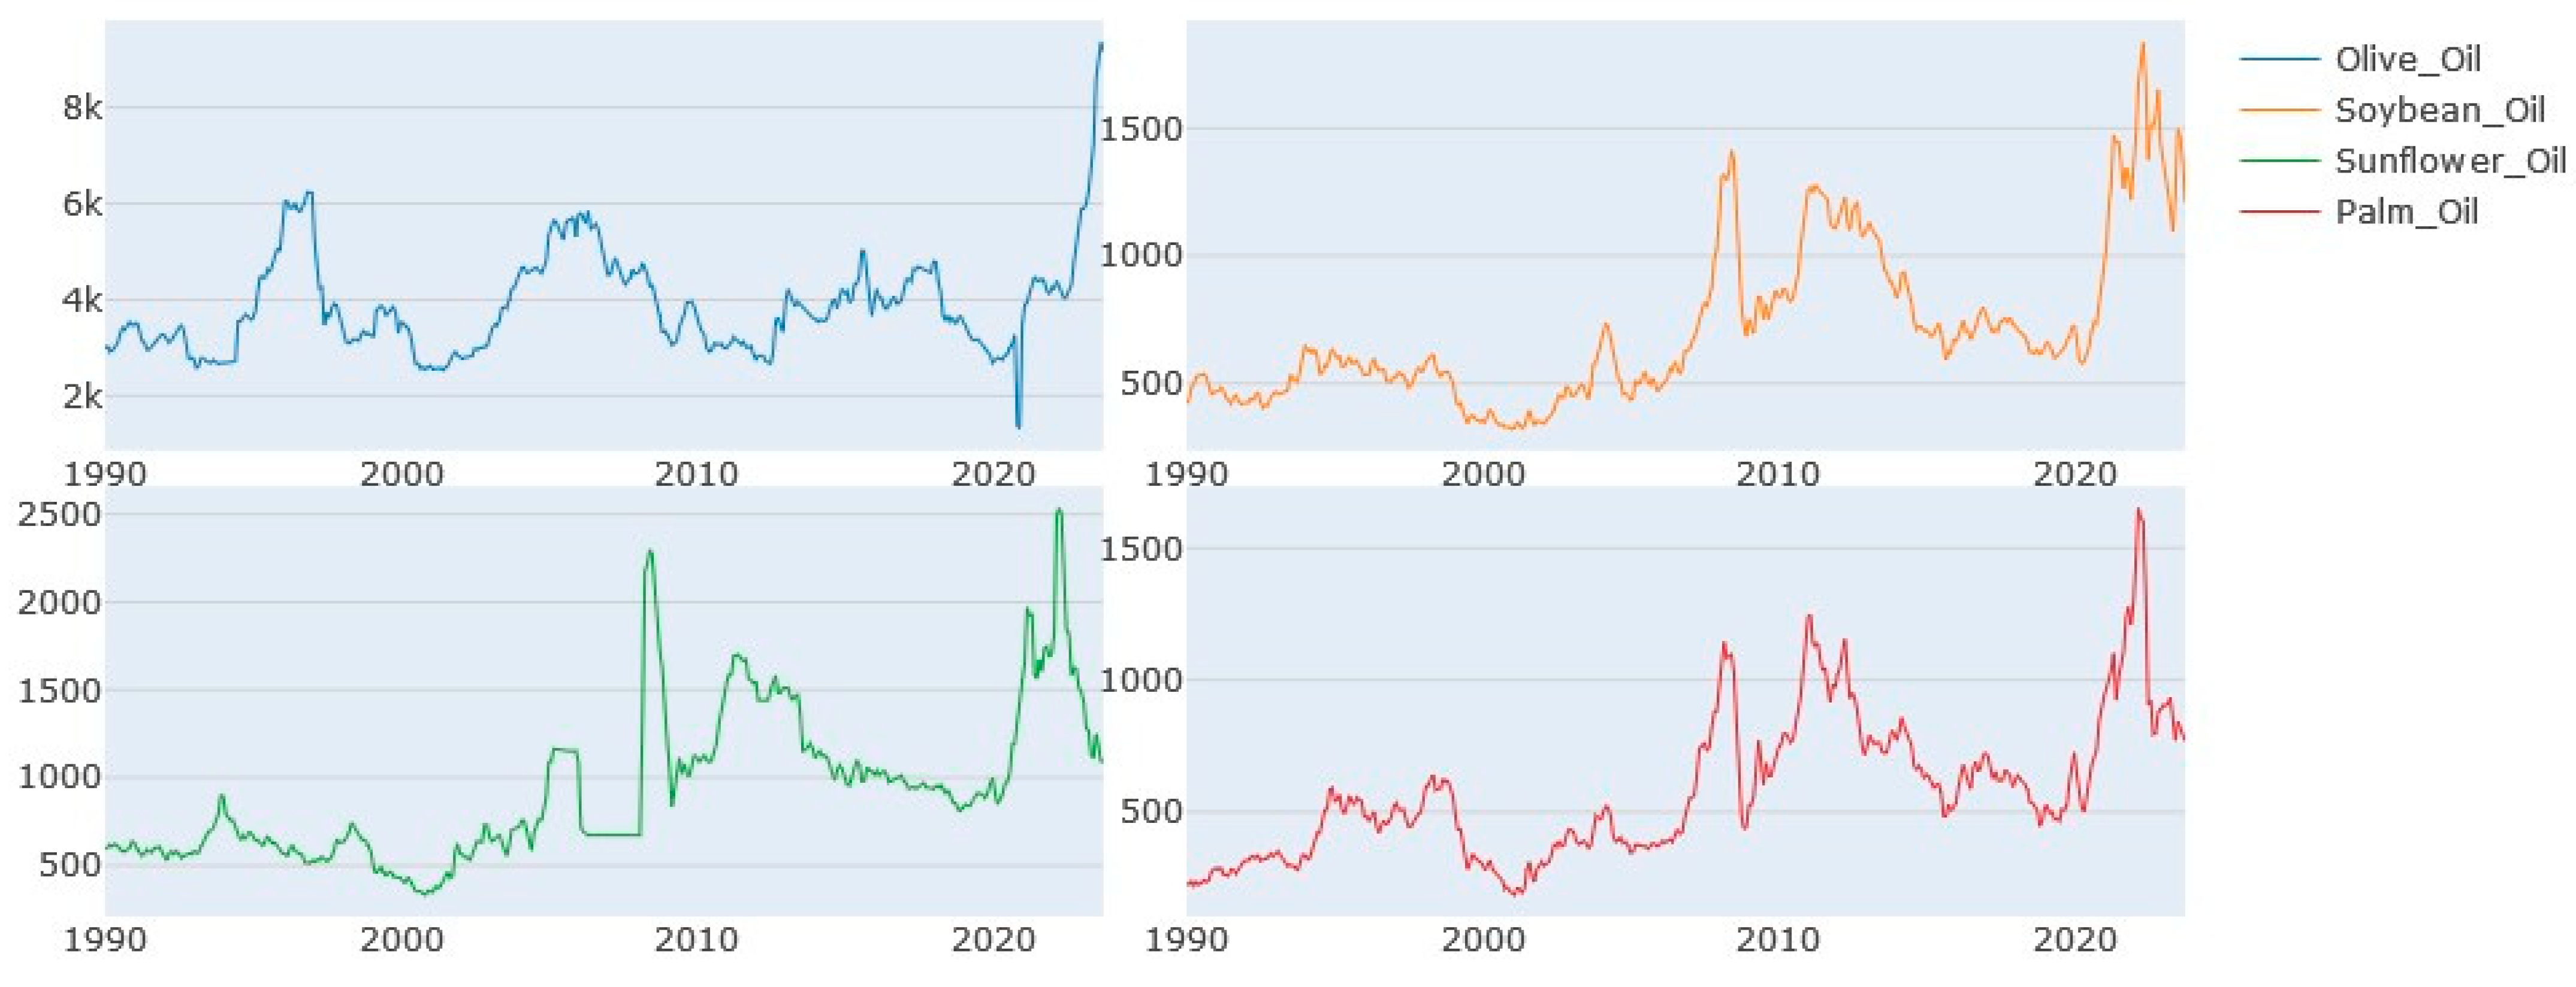
The data employed span the period from January 1990 to October 2023 and cover a range of normal periods and crises. Data represent the global prices (in US dollars per metric ton) of olive oil, soybean oil, sunflower oil, and palm oil. They are downloaded from the International Monetary Fund (IMF) database. They are expressed in monthly frequencies and transformed into logarithmic differences for the purposes of estimations.
Figure 1 displays the time evolution of prices of different types of oils. It can be seen that the substitutes of olive oil present large spikes at the outbreak of the Global Financial Crisis (GFC) as lower wealth levels increase their demand. They also present decreases in market values during the monetary tightening by central banks and the phase of post-crisis normalization in economies. This happens as better economic conditions are favorable for more expensive and higher-quality oil. Notably, all types of oil illustrate their highest peak after the onset of the Russia–Ukraine conflict. Remarkably, olive oil presents a delayed bull tendency in relation to the remaining types of oil as the initial phase of this crisis led to the higher popularity of alternative products.
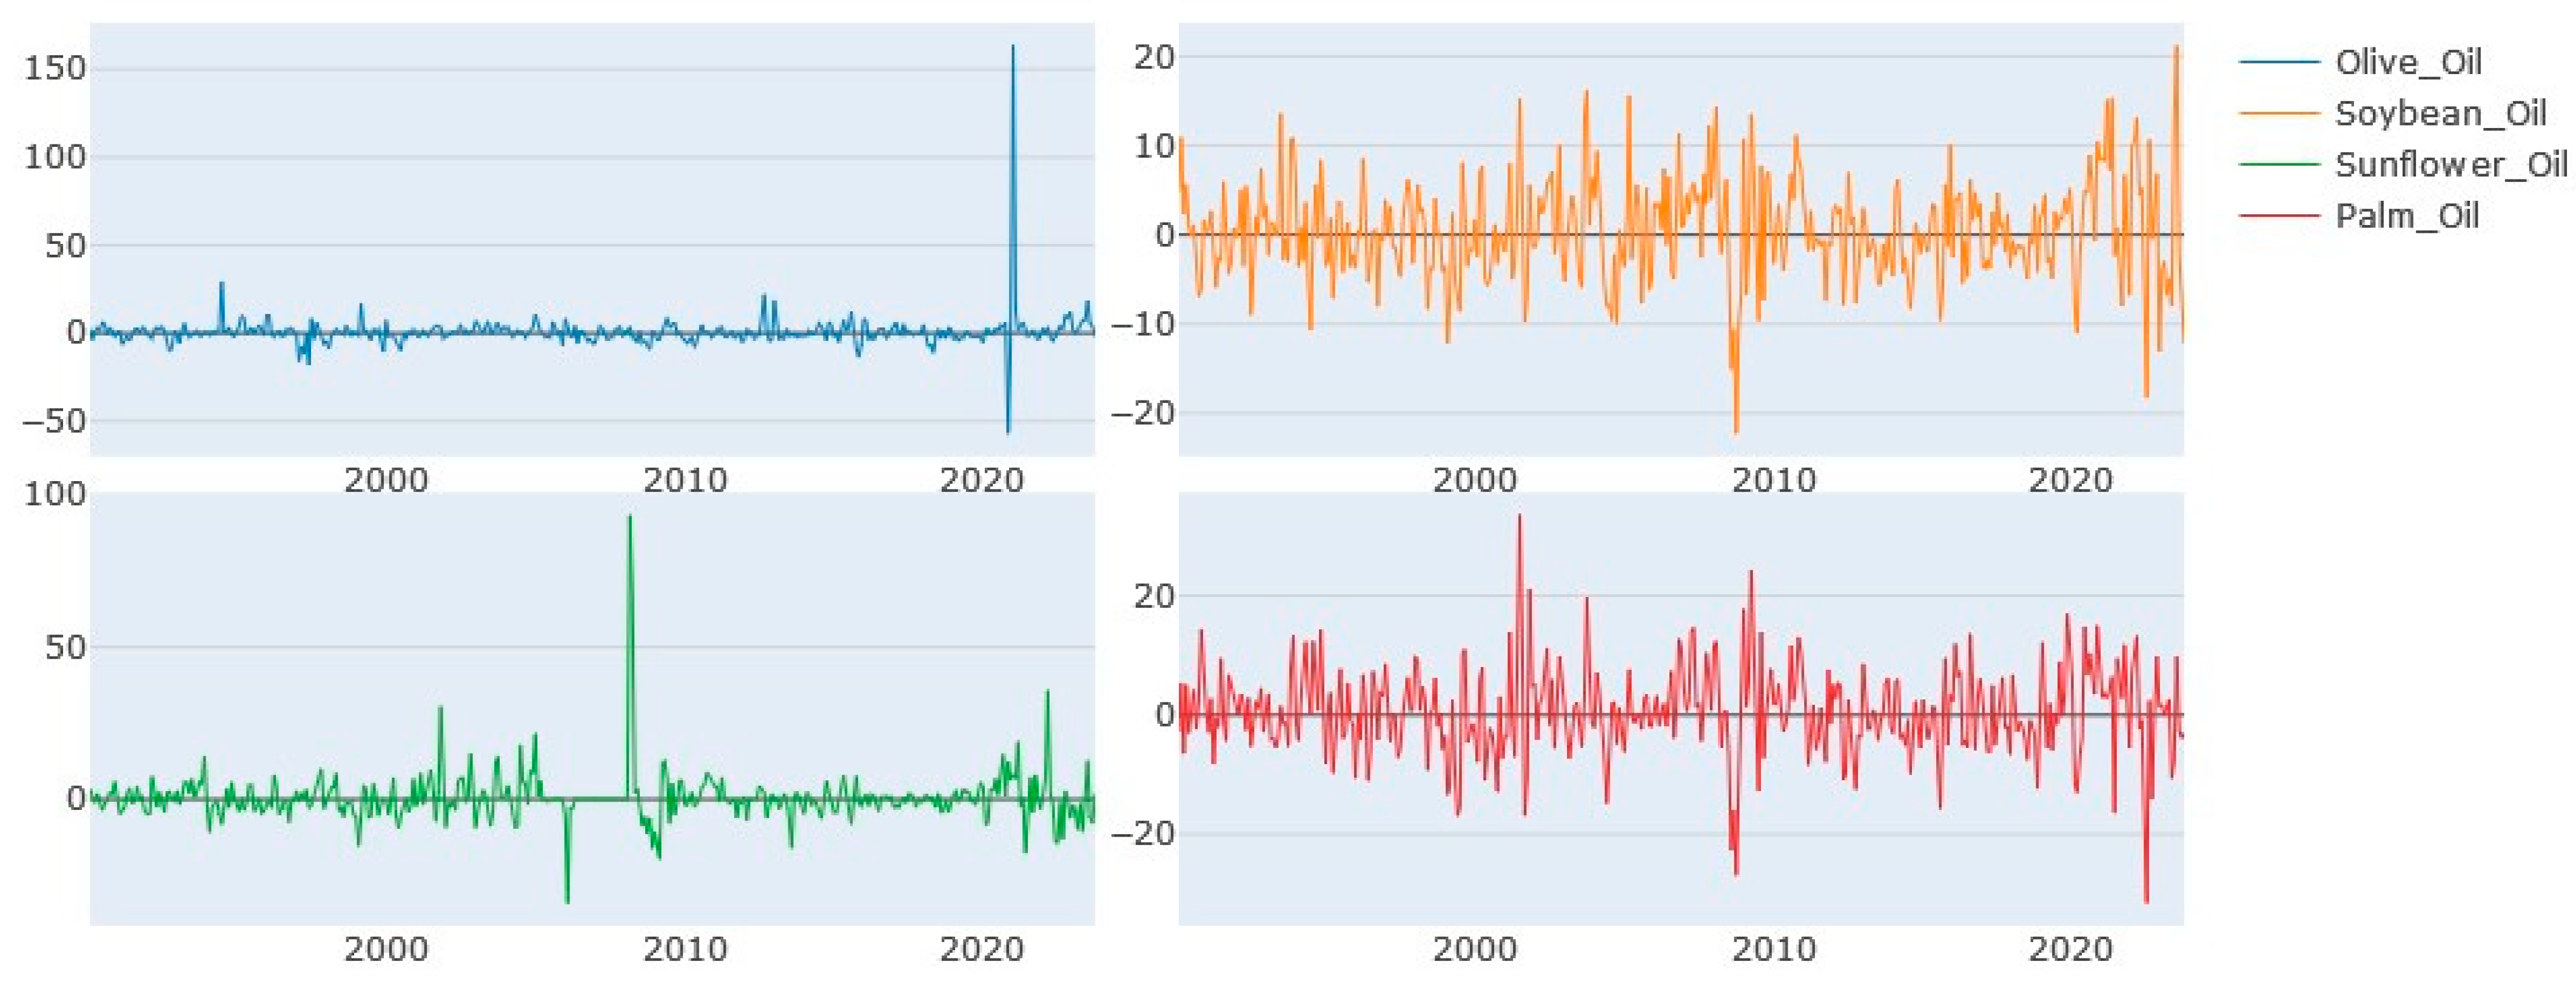
Figure 2 depicts the returns of these oil types. It should be emphasized that despite olive oil displaying modest levels of volatility overall, the recent crises generated very large fluctuations (both upward and downward) in its returns. Furthermore, sunflower oil has its most extreme values before and during the onset of the GFC. Moreover, soybean oil and palm oil present frequent alterations in the signs of their returns.
The descriptive statistics of returns are provided in Table 1. Olive oil is found to be the most profitable type of oil (0.626) but also the most volatile (97.726) and so presents the poorest risk-adjusted performance. On the contrary, soybean oil, which is the worst performing (0.426) type of oil, exhibits the highest risk-adjusted performance. Non-normality is detected in all variables examined. Apart from this, all types of oil reject the unit root hypothesis, and the Fisher and Gallagher weighted portmanteau test indicates that the adequately fitted ARCH process hypothesis is rejected.
The methodology used for estimating dynamic connectedness is the innovative Time-Varying Vector Autoregression (TVP-VAR), which based on Adekoya et al. (2022) and Kyriazis et al. (2023).
The TVP-VAR framework is laid out in (1) and (2):
where and are dimensional vectors while and constitute dimensional matrices; and stand for dimensional vectors and is a matrix with dimensions. The parameters ) and the nexus across series can alter over time. Moreover, the variance–covariance matrices, and , are also not constant as time evolves.
Apart from this, the generalized spillover table is constructed by the total directional connectedness generated from others toward variable and the total directional connectedness transmitted toward others and sourced from a shock in variable . These effects, as constructed based on (3) and (4), illustrate the systemic influence on and the reverse.
The Total Connectedness Index (TCI) reflects the systemic risk, which constitutes a significant determinant of investment decisions. The TCI depicts the average total directional connectedness from (to) others, and its formula is provided in (5):
A high TCI means a high market risk and a large extent of risk spillovers.
Moreover, the net pairwise directional spillovers are calculated based on (6):
So, the systemic risk ), which stems from both the joint spillover impacts that a specific variable exerts on the system but also the joint effects that the group (system) exerts on the specific variable, illustrates higher dynamic connectedness. This implies that it is harder to fight systemic risk as variables move in the same direction. Even though connectedness could be very high, the net result could be very low or zero if the spillovers that a specific variable transmits toward the system are approximately equal to the impacts it receives from it. In this case, the overall nexus ( could be very high but the net impact would be almost zero.
When is larger than , variable is a net generator of spillover impacts on variable , so the latter is an absorber of shocks from the former. It is evident that the net pairwise effect ( could be zero even though the impact ( that a variable generates on another could be high. This is the case in which the effect that this variable receives from the other ( would be equal to the impact it generates.
The dynamic connectedness in pairs allows for the better identification of the nexus between olive oil and each of the substitute types of oil and enables the examination of how inflation in food commodities of major importance (olive oil price increases) influences food inflation overall (directly but also indirectly through its impacts on the rhythm of changes in market values of substitutes’ markets). Moreover, the systemic spillover effects of olive oil inflation on food oil markets render possible the investigation and detection of the size and sign of causality as regards the systemic food oil inflation. This casts light on which of its main constituents are the generators of effects and main responsible factors of lower purchasing capacity during crises.
4. Econometric Findings
By focusing on the averaged dynamic connectedness among these four types of oil (Table 2), it is revealed that olive oil is very weakly connected with the other three types. Thereby, no close substitutes for olive oil are found. This justifies why large increases in its demand nourish large increases in its market values, as consumers have no alternatives with similar characteristics. Notably, though, the connection among the other three types of oil is stronger. More specifically, soybean oil receives significant effects from palm oil (36.11) and weaker impacts from sunflower oil (15.28), while palm oil is mainly influenced by soybean oil (36.07). Sunflower oil is the least connected with the remaining substitute oils. The overall dynamic nexus of the system of oils is low to medium, as shown by the Total Connectedness Index (33.34).
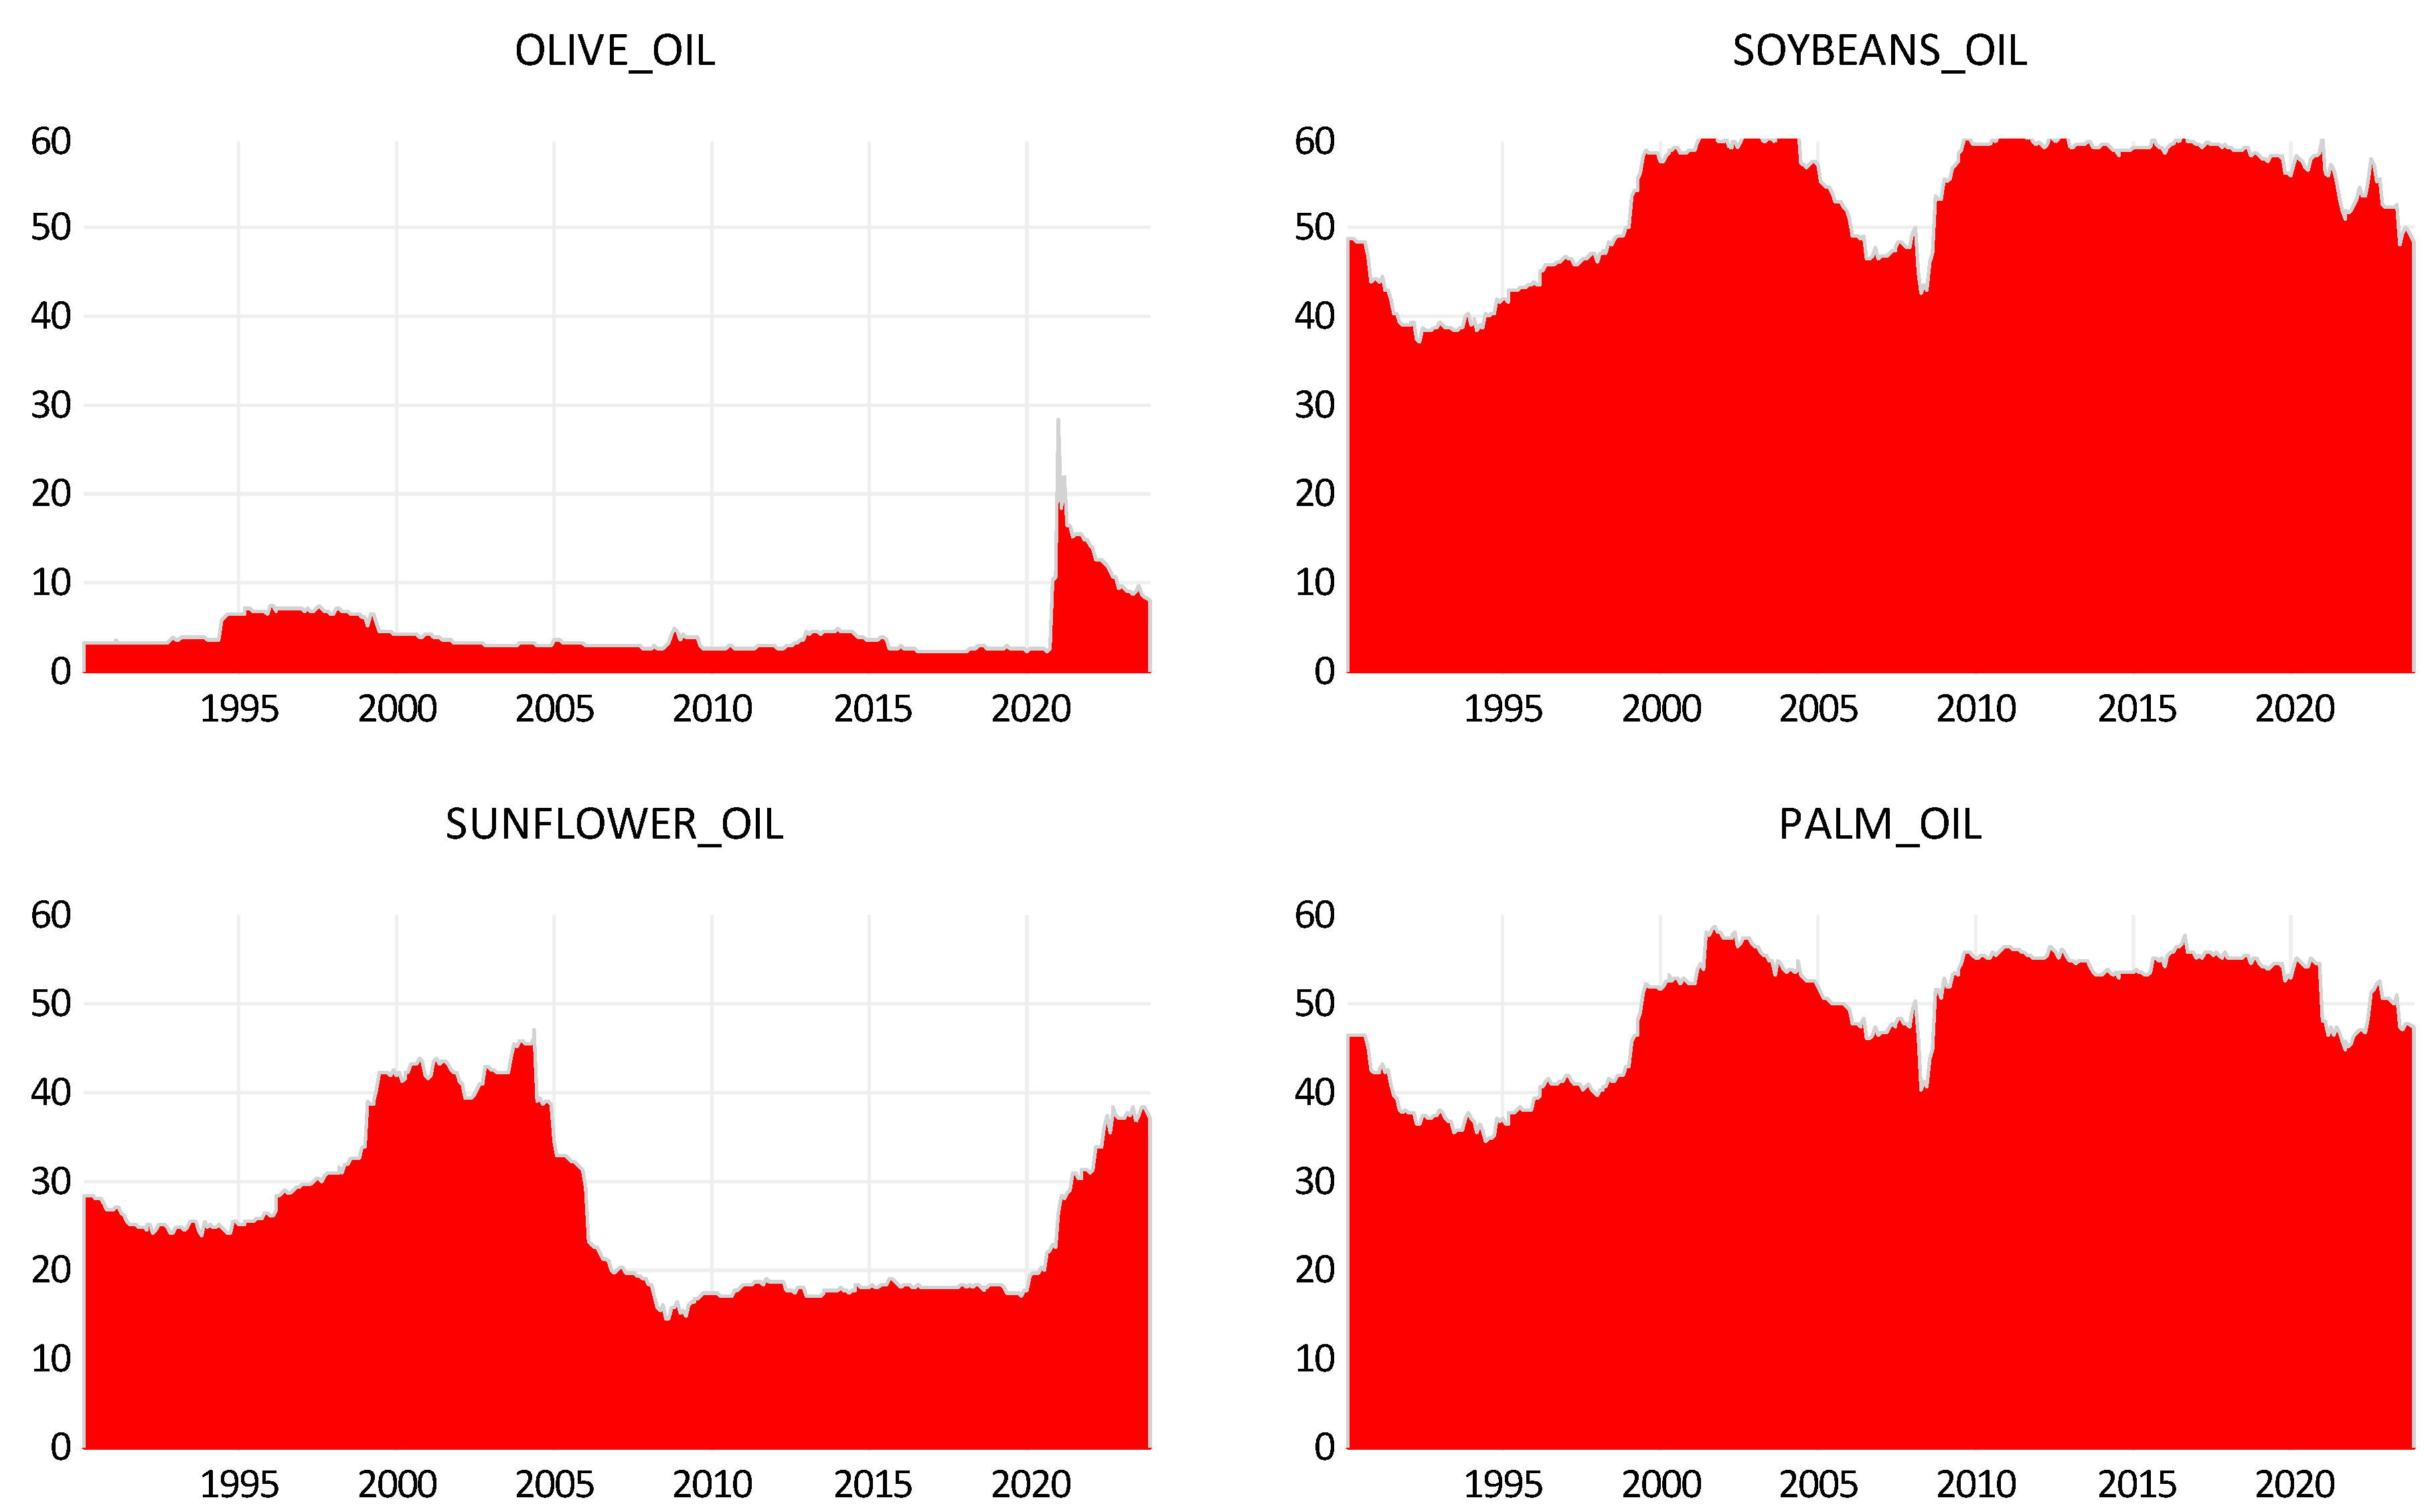
When centering interest on the dynamic extended joint connectedness regarding the system of different oil types, the spillover impacts generated by each type (Figure 3) as well as the effects received from (Figure 4) the remaining types of oil are laid out.
In Figure 3, it can be seen that olive oil presents low levels of causal spillovers toward the system of the remaining types of oil. It should be stressed that olive oil caused very weak effects (lower than 5%) toward them before 1995, but this connection exceeds 5% in the 1995–2000 period. Notably, this dynamic joint nexus decreases later on and only exhibits small increases at the outburst of the Global Financial Crisis and at the initial phase of QE-tapering in the US (but remains lower than 5%). Remarkably, though, these dynamic linkages strengthen at the outbreak of the COVID-19 health crisis. This is the reason why a large spike appears in oil-price causal spillover impacts on olive oil substitutes. This constitutes the only occasion where these joint directional effects take values above 20%. It is also found that these linkages become weaker during the COVID-19 crisis and as the Russia–Ukraine conflict progresses. Nevertheless, even at the later stages of the conflict examined, this nexus remains non-negligible as it remains higher than 10% during the pandemic and reaches about 7% at its minimum level.
In the case of soybean oil, its causal effects on the system of olive oil, sunflower oil, and palm oil are quite different. A causality slightly lower than 50% is detected before 1995, and increasing tensions are traced from 1995 to 2000. This continues with weak increases until 2005 when joint connectedness from soybean oil reaches 60%. Interestingly, these interrelations fall to 40% until the early phase of the Global Financial Crisis and then rebound to approximately the 60% level. This level of nexus remains stable until the onset of the pandemic when small falls lead to the connection being slightly lower than 50%. It should be highlighted that palm oil displays almost the same trajectory as soybean oil in terms of influential impacts on the system of remaining variables. It should be mentioned though that the joint causal impact it exerts is slightly lower in comparison with the joint impact generated by soybean oil.
Moreover, as concerns sunflower oil, it is illustrated that it displays significantly higher joint connectedness toward the remaining types of oil than olive oil does. Furthermore, its joint effect is smaller in relation to the cases of soybean oil and palm oil. While the joint nexus starts from a somewhat lower level than 30%, it reaches almost a 45% level from 2000 to 2005. It should be underlined that this keeps falling until the launch of the Global Financial Crisis—when it falls below 20%—and remains stable until unconventional monetary practices commence, as well as the US QE-tapering era. It should be mentioned, though, that significant upside tendencies were brought about during the two latest crises. To be more precise, these linkages toward the system increased during the pandemic and reached a peak during the Russia–Ukraine war, displaying a level slightly lower than 40%. This is approximately 10% lower compared with the cases of soybean oil and palm oil.
Soybean oil and palm oil are illustrated to be the largest generators of spillover causality, and sunflower oil follows, while olive oil is the least influential type of oil. Notably, soybean oil and palm oil present decreases in the levels of overall connectedness when the GFC begins. Sunflower oil is a driver of spillovers mainly during flourishing markets but also during the latest crises. Somewhat surprisingly, olive oil is rendered a transmitter of spillover impacts when the COVID-19 disease spread and fell to lower levels (but still higher than in earlier periods) afterward.
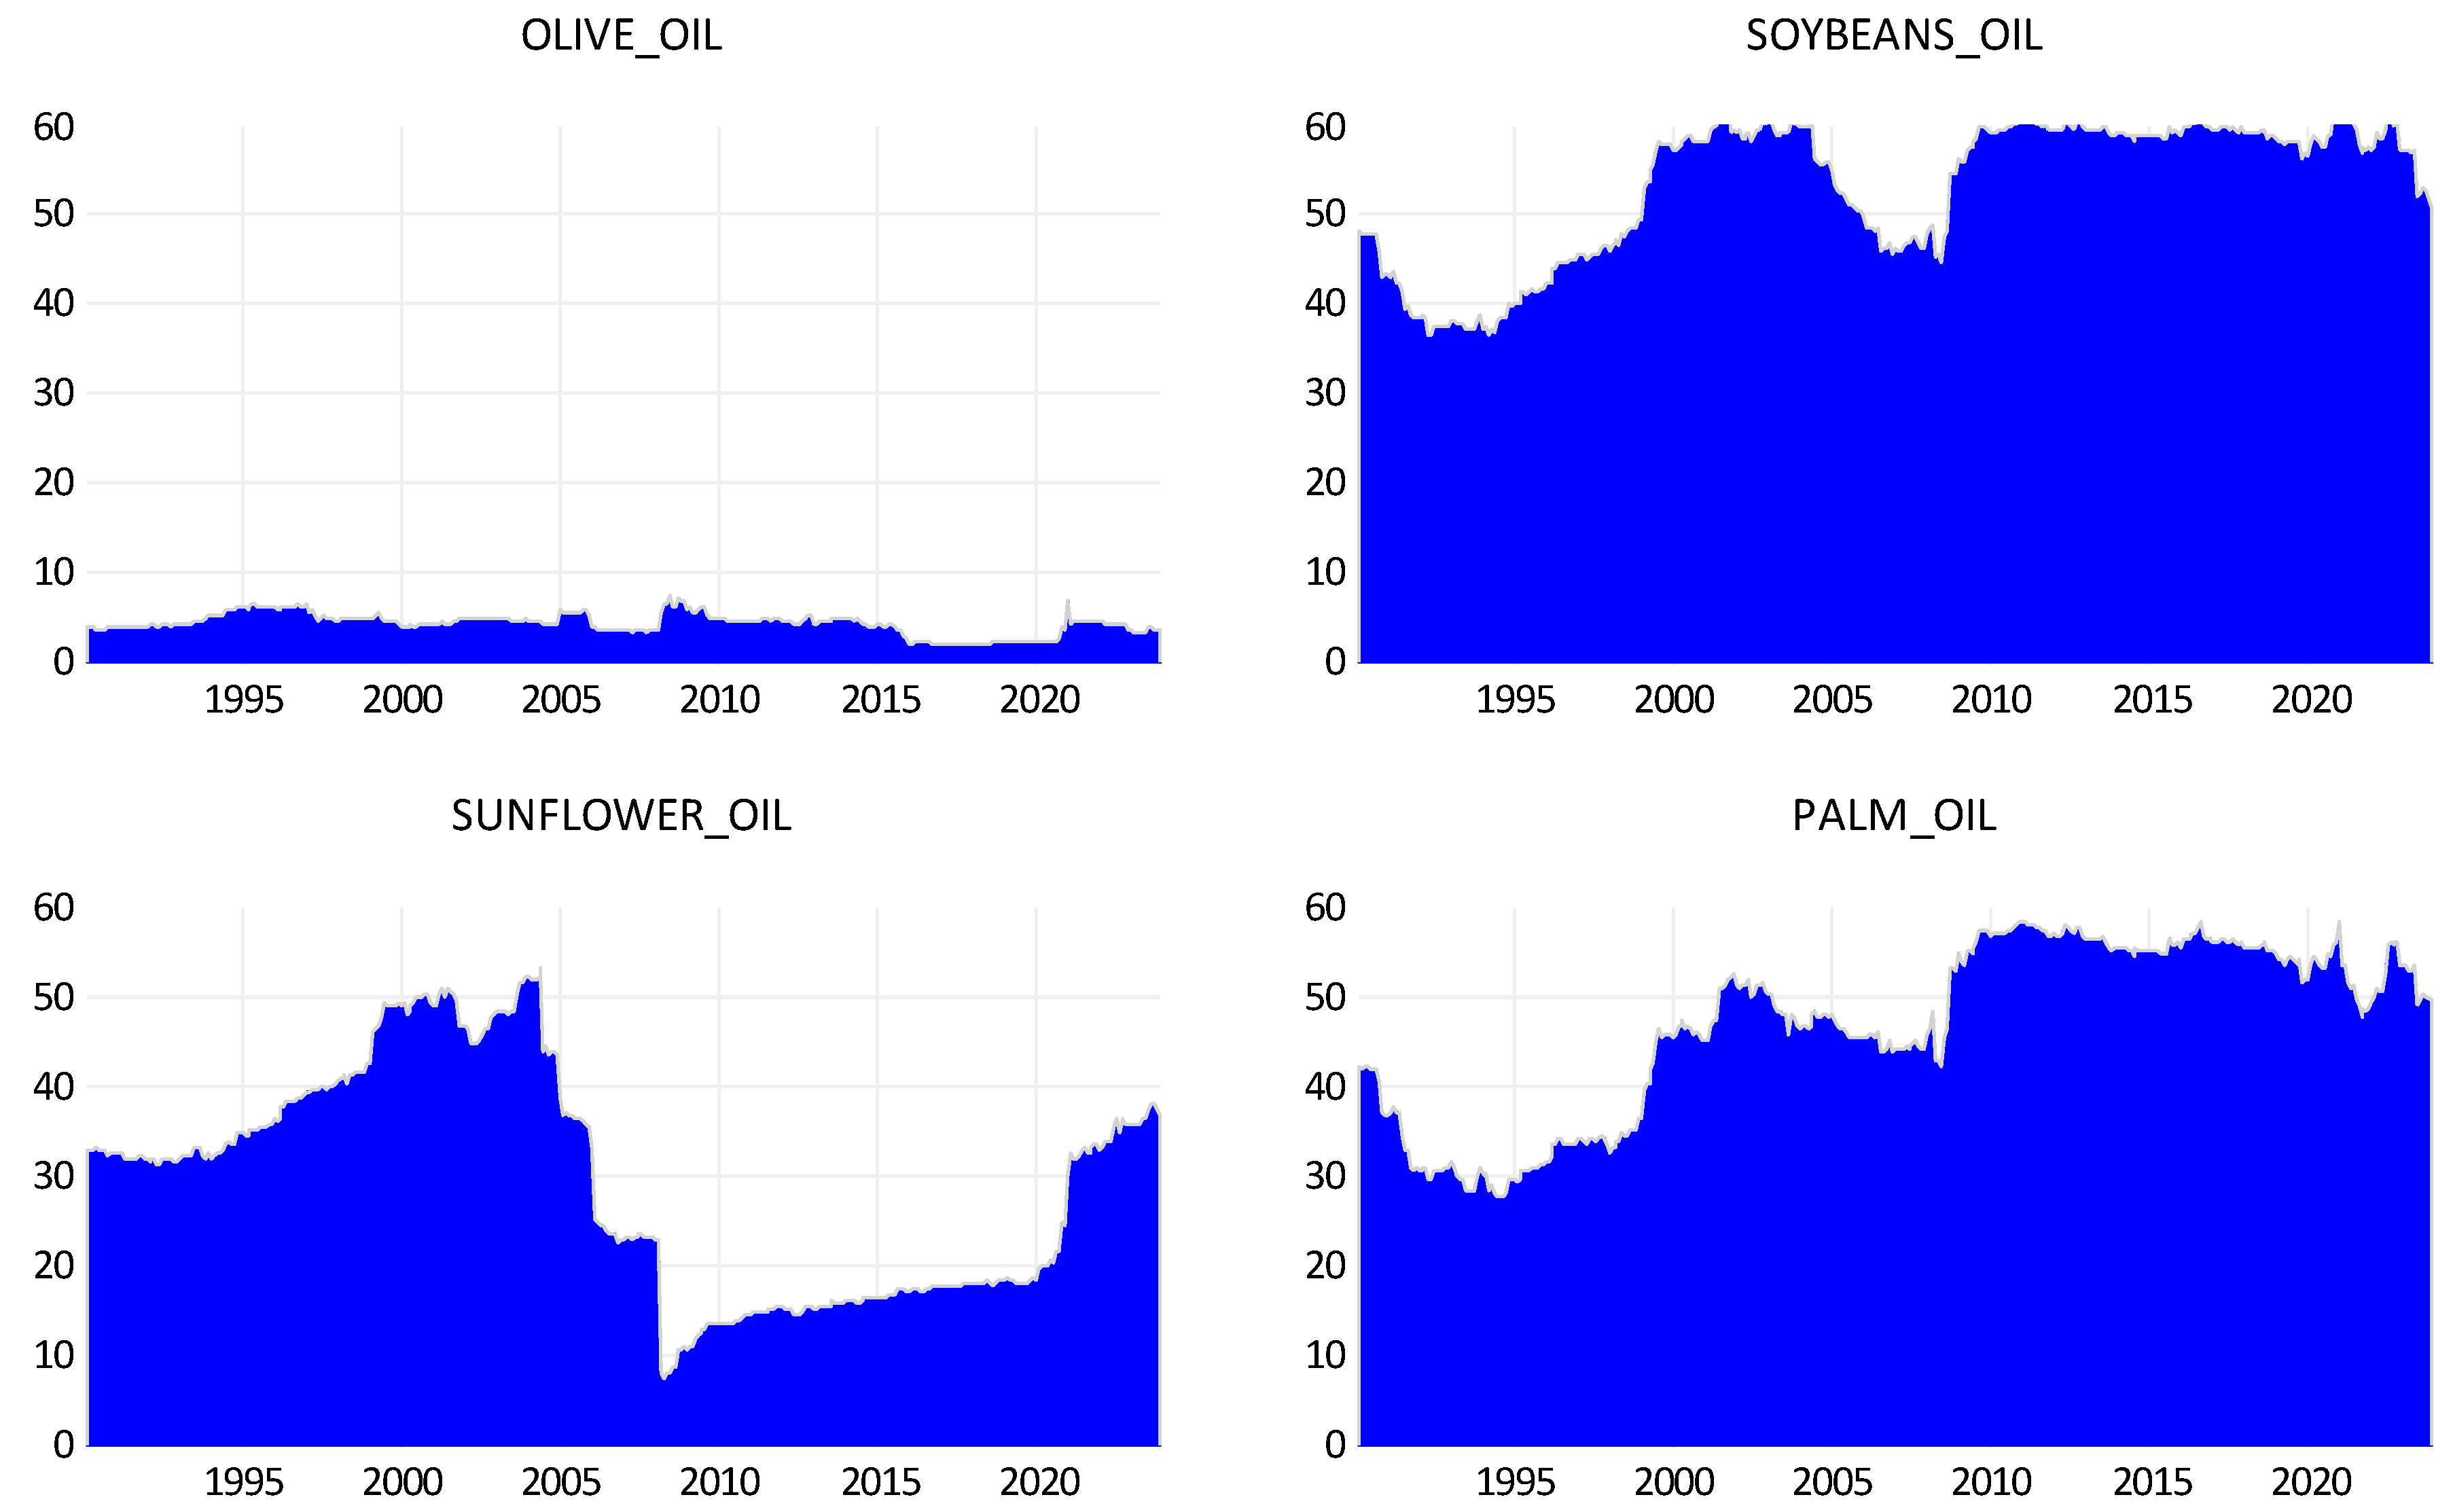
Moreover, the examination in Figure 4 of the joint spillover effects received by each of the oil types brings about similar findings about each of the three substitute oils. However, olive oil is found to be a significantly weaker recipient than a generator of impacts. The results about the joint dynamic connectedness received by olive oil bring to the surface that it follows a journey similar to that of its joint directional connectedness toward the system of types of oil in the largest part of the period examined. It should be underlined that this similarity changes during the two latest crises. In terms of higher precision, olive oil receives slightly higher spillover impacts during the COVID-19 and the Russia–Ukraine war than in the QE-tapering period. This nexus, though, struggles to exceed the 5% level of connection. This is in contrast to the high spike of impacts generated by olive oil in the same period, as illustrated in Figure 3. This finding does not abide by the higher levels of connectedness received by olive oil since 2000 in relation to the nexus transmitted from this major commodity. Surprisingly, olive oil switches into a net generator of impacts during the pandemic and the war, not because of being less influenced but thanks to being more influential.
As regards the joint impacts exerted on soybean oil, it can be seen that they are slightly smaller than the spillover effects generated by this type of oil on the system of the remaining oils until the outbreak of the Global Financial Crisis. This is the reason why soybean oil was a weak generator of impacts until 2008. The QE-tapering period displays almost equal impacts generated with effects received by soybean oil. It should be emphasized, though, that this type of oil is rendered a non-negligible absorber of spillover impacts during the pandemic and the Russia–Ukraine conflict at a level that overcomes the extent of spillovers it exerts on the system of remaining types of oil. This fortifies the notion that soybean oil could act as a hedge against systemic risk in turbulent periods. When it comes to sunflower oil, it is revealed that the joint impacts it receives are larger than the ones it generates until the GFC, but the causality it nourishes falls to a lower extent than the causality it receives during this major crisis and the QE-tapering that follows. Interestingly, the joint nexus received by sunflower oil is higher than the impacts exerted from it during the pandemic, but this goes the other way during the Russia–Ukraine war. As concerns the case of palm oil, it is remarkable that it follows the opposite direction to sunflower oil as its influence toward the system is higher than its influence from the system until the GFC. Notably, though, palm oil receives stronger impacts than the ones it exerts during the crises, and this is more pronounced during the COVID-19 pandemic and the war that follows.
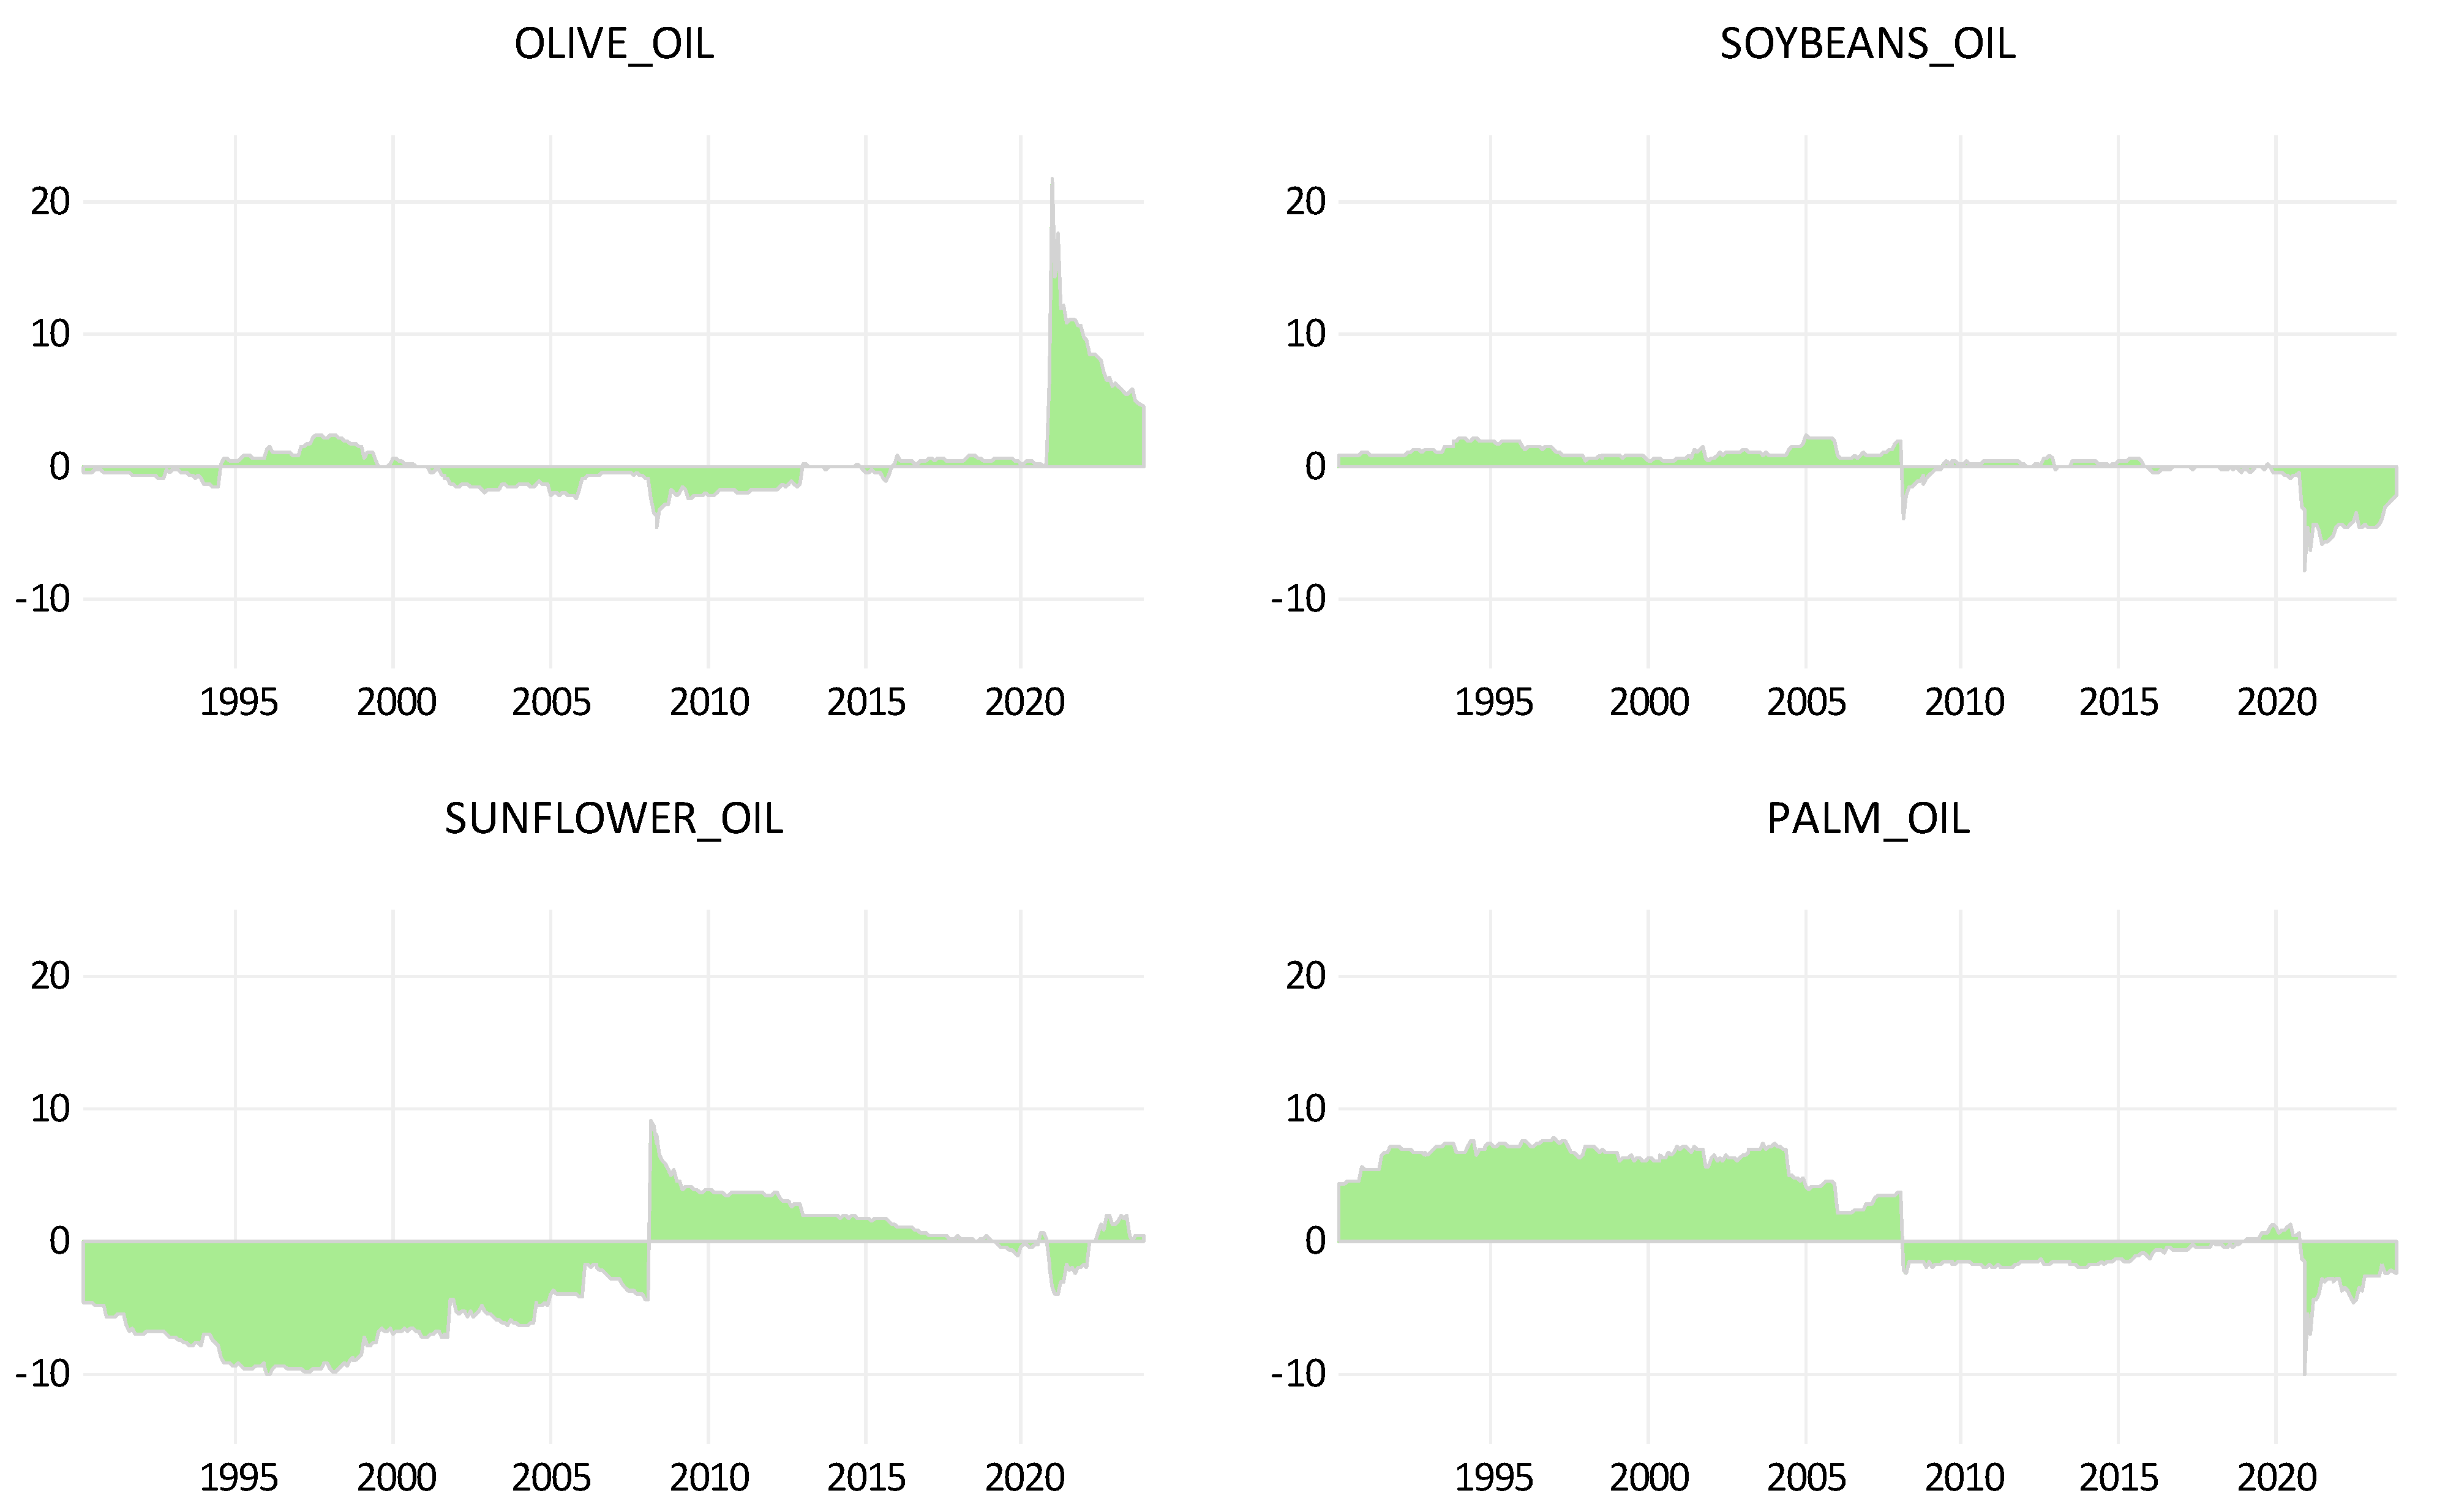
This is more clearly depicted in Figure 5, where the net result of dynamic extended joint connectedness is presented. Remarkably, olive oil becomes a net generator of spillover impacts during the COVID-19 pandemic, and this continues during the Russia–Ukraine war. This does not abide by the findings concerning the GFC or the normal period afterward when olive oil acted as a net receiver of impacts from substitute types of oil. Interestingly, the remaining three types are all net receivers of effects during the latest crises. It is noteworthy that sunflower oil is revealed to be a net receiver of effects during flourishing eras but a net contributor after major crises (such as the GFC). Notably, palm oil follows the opposite way.
Overall, these findings reinforce the notion that modern types of crises render food commodities of primary importance (such as olive oil) drivers of markets of relevant food commodities. The lack of close substitutes for olive oil does not leave space for consumers to alter their preferences without a large loss of utility. This fortifies the perspectives for non-negligible olive oil price increases. This high-quality product, despite being weakly connected with substitute goods markets during the financial crisis (GFC) and normal periods, is found to constitute a significant influential factor of market prices during the health crisis due to its crucial role in the preservation of good health. Moreover, during the Russia–Ukraine conflict—which caused supply-driven food inflation and so reduced real disposable income—the price of olive oil is the determinant of market values of alternative types of oil that display lower-quality nutritional features. Arguably, olive oil takes better advantage of its special characteristics when health issues or the lack of alternative or equal-quality food resources prevail. This could be useful advice for investors seeking profitable investment opportunities in stressed eras.
5. Conclusions
The investigation of food inflation in times of crisis constitutes one of the major issues in modern economies and has resuscitated interest during the COVID-19 pandemic and the Russia–Ukraine conflict. This study examines the dynamic averaged pairwise and net joint extended connectedness of olive oil with substitutes such as soybean oil, sunflower oil, and palm oil. This serves to cast light on unknown determinants of inflation in oil markets and provides insights into whether inflationary pressures could weaken if consumer preferences altered.
The dynamic nexus among these four alternative types of oil is examined by using the innovative TVP-VAR methodology, as employed by Adekoya et al. (2022) and Kyriazis et al. (2023). The period under scrutiny covers from January 1990 to October 2023 in order to examine the linkages in an array of alternative economic conditions. Econometric results bring to the surface the low dynamic connection of olive oil with soybean oil, sunflower oil, and palm oil. This reveals that olive oil has only weak substitutes, explaining the appearance of high market values for this high-quality product. Soybean oil and palm oil are mostly linked with each other. This gives credence to the belief that each could be easily replaced with the other in consumers’ preferences and shopping baskets.
Notably, olive oil constitutes an absorber of impacts during normal periods and the GFC but generates effects during the COVID-19 health crisis and the Russia–Ukraine war, when the latter leads to supply chain malfunctioning and excessive demand for major agricultural commodities. Thereby, olive oil becomes a leader of the relevant markets when the necessity for good nutrition is more obvious than ever as health crises emerge, and demand-driven olive oil inflation is apparent. Moreover, war conflicts bring about higher pressures on disposable real income due to the elevated supply-led shortages in basic food commodities. Higher olive oil prices prove to be generators of spillovers on substitute types of oil, so high-quality nutrition also has a leading role during war. Remarkably, despite the weak role of olive oil as a receiver of effects during the Global Financial Crises, health crises and geopolitical risks reveal the significantly higher dependence of the real economy on major agricultural food commodities such as olive oil. The non-existence of close substitutes for this high-quality product shows that it gains prominence in turbulent and inflationary eras and that olive oil could prove to be a lucrative investment. The higher growth in olive oil markets due to alterations of preferences toward healthier nutrition, and also due to the excessive demand for low-supplied quality products, reveals the transition toward higher market shares for olive oil in the oil markets. The stronger dominance of olive oil in relevant markets during modern crises makes the three other types of oil weaker substitutes of olive oil than before, and consumers’ demand for olive oil becomes more inelastic. This makes it more costly for consumers to preserve their olive oil consumption at high levels as olive oil inflation keeps growing.
This study contributes to a better understanding of the forces that drive food inflation in normal versus turbulent eras. It provides a compass for policymakers, consumers, and investors in order to improve their income and wealth management by adjusting their preferences regarding consumption. Potential avenues for further research in this field could be the examination of a larger spectrum of agricultural products through the prism of their interconnectedness or the impacts received from economic or climate policy uncertainties.
Funding
This research received no external funding.
Informed Consent Statement
Not applicable.
Data Availability Statement
Data are available upon request.
Conflicts of Interest
The author declares no conflict of interest.
References
- Adekoya, Oluwasegun B., Ademola B. Akinseye, Nikolaos Antonakakis, Ioannis Chatziantoniou, David Gabauer, and Johnson Oliyide. 2022. Crude oil and Islamic sectoral stocks: Asymmetric TVP-VAR connectedness and investment strategies. Resources Policy 78: 102877. [Google Scholar] [CrossRef]
- Ahumada, Hildegart, and Magdalena Cornejo. 2016. Forecasting food prices: The case of corn, soybeans and wheat. International Journal of Forecasting 32: 838–48. [Google Scholar] [CrossRef]
- Anscombe, Francis John, and William J. Glynn. 1983. Distribution of the kurtosis statistic b 2 for normal samples. Biometrika 70: 227–34. [Google Scholar] [CrossRef]
- Breman, Carlotta, and Servaas Storm. 2023. Betting on black gold: Oil speculation and US inflation (2020–2022). International Journal of Political Economy 52: 153–80. [Google Scholar] [CrossRef]
- Carbone, Anna, Luca Cacchiarelli, and Valentina Sabbatini. 2018. Exploring quality and its value in the Italian olive oil market: A panel data analysis. Agricultural and Food Economics 6: 6. [Google Scholar] [CrossRef]
- Cavallo, Alberto, and Oleksiy Kryvtsov. 2023. What can stockouts tell us about inflation? Evidence from online micro data. Journal of International Economics 146: 103769. [Google Scholar] [CrossRef]
- Chandrarin, Grahita, Kazi Sohag, Diyah Sukanti Cahyaningsih, Dani Yuniawan, and Heyvon Herdhayinta. 2022. The response of exchange rate to coal price, palm oil price, and inflation in Indonesia: Tail dependence analysis. Resources Policy 77: 102750. [Google Scholar] [CrossRef]
- D’Agostino, Ralph B. 1970. Transformation to normality of the null distribution of g1. Biometrika, 679–81. [Google Scholar]
- Ferrante, Francesco, Sebastian Graves, and Matteo Iacoviello. 2023. The inflationary effects of sectoral reallocation. Journal of Monetary Economics 140: S64–S81. [Google Scholar] [CrossRef]
- Fisher, Thomas J., and Colin M. Gallagher. 2012. New weighted portmanteau statistics for time series goodness of fit testing. Journal of the American Statistical Association 107: 777–87. [Google Scholar] [CrossRef]
- Gelos, Gaston, and Yulia Ustyugova. 2017. Inflation responses to commodity price shocks–How and why do countries differ? Journal of International Money and Finance 72: 28–47. [Google Scholar] [CrossRef]
- Ginn, William, and Marc Pourroy. 2020. Should a central bank react to food inflation? Evidence from an estimated model for Chile. Economic Modelling 90: 221–34. [Google Scholar] [CrossRef]
- Hassouneh, Islam, Teresa Serra, Barry K. Goodwin, and José M. Gil. 2012. Non-parametric and parametric modeling of biodiesel, sunflower oil, and crude oil price relationships. Energy Economics 34: 1507–13. [Google Scholar] [CrossRef]
- Jarque, Carlos M., and Anil K. Bera. 1980. Efficient tests for normality, homoscedasticity and serial independence of regression residuals. Economics Letters 6: 255–59. [Google Scholar] [CrossRef]
- Kara, Engin. 2017. Does US monetary policy respond to oil and food prices? Journal of International Money and Finance 72: 118–26. [Google Scholar] [CrossRef]
- Kotz, Maximilian, Friderike Kuik, Eliza Lis, and Christiane Nickel. 2023. The Impact of Global Warming on Inflation: Averages, Seasonality and Extremes. No. 2821. Frankfurt am Main: European Central Bank. [Google Scholar]
- Kyriazis, Nikolaos A., Stephanos Papadamou, and Panayiotis Tzeremes. 2023. Are benchmark stock indices, precious metals or cryptocurrencies efficient hedges against crises? Economic Modelling 128: 106502. [Google Scholar] [CrossRef]
- Luo, Jiawen, and Qiang Ji. 2018. High-frequency volatility connectedness between the US crude oil market and China’s agricultural commodity markets. Energy Economics 76: 424–38. [Google Scholar] [CrossRef]
- Mao, Qianqian, Yanjun Ren, and Jens-Peter Loy. 2021. Price bubbles in agricultural commodity markets and contributing factors: Evidence for corn and soybeans in China. China Agricultural Economic Review 13: 22–53. [Google Scholar] [CrossRef]
- Peersman, Gert. 2022. International food commodity prices and missing (dis) inflation in the euro area. Review of Economics and Statistics 104: 85–100. [Google Scholar]
- Rallatou, Dionysia, and Vangelis Tzouvelekas. 2016. An analysis of the trade patterns of olive-oil in the European Union. Agricultural Economics Review 17: 55–69. [Google Scholar]
- Reimers, Hans Eggert, Dieter Gerdesmeier, and Barbara Roffia. 2023. Investigating the Inflation–Output Nexus for the Euro Area: Old Questions and New Results. Economies 11: 265. [Google Scholar] [CrossRef]
- Romo Munoz, Rodrigo, Mario Lagos Moya, and José M. Gil. 2015. Market values for olive oil attributes in Chile: A hedonic price function. British Food Journal 117: 358–70. [Google Scholar] [CrossRef]
- Samal, Asharani, and Phanindra Goyari. 2023. Food price inflation and relative price variability in India: Evidence from decomposition analysis. Studies in Microeconomics 11: 320–39. [Google Scholar] [CrossRef]
- Santeramo, Fabio Gaetano, Leonardo Di Gioia, and Emilia Lamonaca. 2021. Price responsiveness of supply and acreage in the EU vegetable oil markets: Policy implications. Land Use Policy 101: 105102. [Google Scholar] [CrossRef]
- Scott, Francisco, Cortney Cowley, and Ty Kreitman. 2023. Tight Labor Markets Have Been a Key Contributor to High Food Inflation. Federal Reserve Bank of Kansas City, Economic Bulletin, 1–4. [Google Scholar]
- Stock, J., G. Elliott, and T. Rothenberg. 1996. Efficient tests for an autoregressive unit root? Econometrica 64: 813–36. [Google Scholar]
- Umar, Zaghum, F. Jareño, and A. Escribano. 2021. Agricultural commodity markets and oil prices: An analysis of the dynamic return and volatility connectedness. Resources Policy 73: 102147. [Google Scholar] [CrossRef]
- Umar, Zaghum, F. Jareño, and A. Escribano. 2022. Dynamic return and volatility connectedness for dominant agricultural commodity markets during the COVID-19 pandemic era. Applied Economics 54: 1030–54. [Google Scholar] [CrossRef]
- Xiong, Bo, Daniel Sumner, and William Matthews. 2014. A new market for an old food: The US demand for olive oil. Agricultural Economics 45: 107–18. [Google Scholar] [CrossRef]
- Zhang, Dayong, and David C. Broadstock. 2020. Global financial crisis and rising connectedness in the international commodity markets. International Review of Financial Analysis 68: 101239. [Google Scholar] [CrossRef]
Figure 1.
Time evolution of market values.

Figure 2.
Time evolution of returns (in percentages).

Figure 3.
Dynamic extended joint connectedness (TVP-VAR) generated by each type of oil.

Figure 4.
Dynamic extended joint connectedness (TVP-VAR) received by each type of oil.

Figure 5.
Dynamic NET extended joint connectedness (TVP-VAR) of each type of oil.


Table 1.
Descriptive statistics of returns.
| Olive Oil | Soybean Oil | Sunflower Oil | Palm Oil | |
|---|---|---|---|---|
| Mean | 0.626 | 0.426 | 0.448 | 0.574 |
| Variance | 97.726 | 33.194 | 69.885 | 54.873 |
| Skewness | 10.772 *** | 0.126 | 4.768 *** | −0.067 |
| Ex. Kurtosis | 185.896 *** | 0.900 *** | 48.203 *** | 2.051 *** |
| JB | 591,002.9 *** | 14.757 *** | 40,744.5 *** | 71.301 *** |
| ERS | −8.058 *** | −5.235 *** | −7.052 *** | −6.369 *** |
| Q(10) | 22.096 *** | 38.303 *** | 59.628 *** | 44.704 *** |
| Q2(10) | 5.085 | 43.592 *** | 58.866 *** | 34.465 *** |
Notes: *** displays significance at 1%; Skewness: D’Agostino (1970) test; Kurtosis: Anscombe and Glynn (1983) test; JB: Jarque and Bera (1980) normality test; ERS: Stock et al. (1996) unit-root test with constant; Q(20) and Q2(20): Fisher and Gallagher (2012) weighted portmanteau test.
Table 2.
Averaged dynamic connectedness.
| Olive Oil | Soybean Oil | Sunflower Oil | Palm Oil | From | |
|---|---|---|---|---|---|
| Olive Oil | 95.88 | 1.93 | 1.72 | 0.47 | 4.12 |
| Soybean Oil | 1.86 | 46.75 | 15.28 | 36.11 | 53.25 |
| Sunflower Oil | 1.43 | 15.37 | 70.67 | 12.53 | 29.33 |
| Palm Oil | 1.14 | 36.07 | 9.45 | 53.35 | 46.65 |
| TO | 4.43 | 53.37 | 26.46 | 49.10 | |
| NET | 0.31 | 0.12 | −2.87 | 2.44 | TCI = 33.34 |
Disclaimer/Publisher’s Note: The statements, opinions and data contained in all publications are solely those of the individual author(s) and contributor(s) and not of MDPI and/or the editor(s). MDPI and/or the editor(s) disclaim responsibility for any injury to people or property resulting from any ideas, methods, instructions or products referred to in the content. |
© 2024 by the author. Licensee MDPI, Basel, Switzerland. This article is an open access article distributed under the terms and conditions of the Creative Commons Attribution (CC BY) license (https://creativecommons.org/licenses/by/4.0/).
Share and Cite
MDPI and ACS Style
Kyriazis, N.A. Food Inflation Examination through the Dynamic Nexus between Olive Oil and Substitutes. Economies 2024, 12, 57. https://0-doi-org.brum.beds.ac.uk/10.3390/economies12030057
AMA Style
Kyriazis NA. Food Inflation Examination through the Dynamic Nexus between Olive Oil and Substitutes. Economies. 2024; 12(3):57. https://0-doi-org.brum.beds.ac.uk/10.3390/economies12030057
Chicago/Turabian StyleKyriazis, Nikolaos A. 2024. "Food Inflation Examination through the Dynamic Nexus between Olive Oil and Substitutes" Economies 12, no. 3: 57. https://0-doi-org.brum.beds.ac.uk/10.3390/economies12030057
Note that from the first issue of 2016, this journal uses article numbers instead of page numbers. See further details here.