
Investor Behavior in Gold, US Dollars and Cryptocurrency during Global Pandemics


Western Australian School of Mines, Curtin University, Locked Bag 30, Kalgoorlie, WA 6433, Australia
*
Author to whom correspondence should be addressed.
Economies 2024, 12(3), 64; https://0-doi-org.brum.beds.ac.uk/10.3390/economies12030064
Submission received: 19 January 2024
/
Revised: 1 March 2024
/
Accepted: 1 March 2024
/
Published: 6 March 2024
(This article belongs to the Section Macroeconomics, Monetary Economics, and Financial Markets)
Abstract
:COVID-19 and SARS are epidemics which have influenced the largest global economic crisis in recent years. This research reveals that both SARS and COVID-19 have led to fluctuations in the prices of gold and the US dollar index; however, there is no direct causal relationship be-tween COVID-19 and the price of bitcoin. The USD index saw a significant increase during the SARS outbreak, while gold prices surged during the COVID-19 pandemic. The notion that cryptocurrency will surpass the value of gold or traditional currencies seems improbable, given the lack of evidence linking bitcoin prices to COVID-19. Gold is expected to maintain its value in the long term, offering lower risk compared to other currencies.
1. Introduction
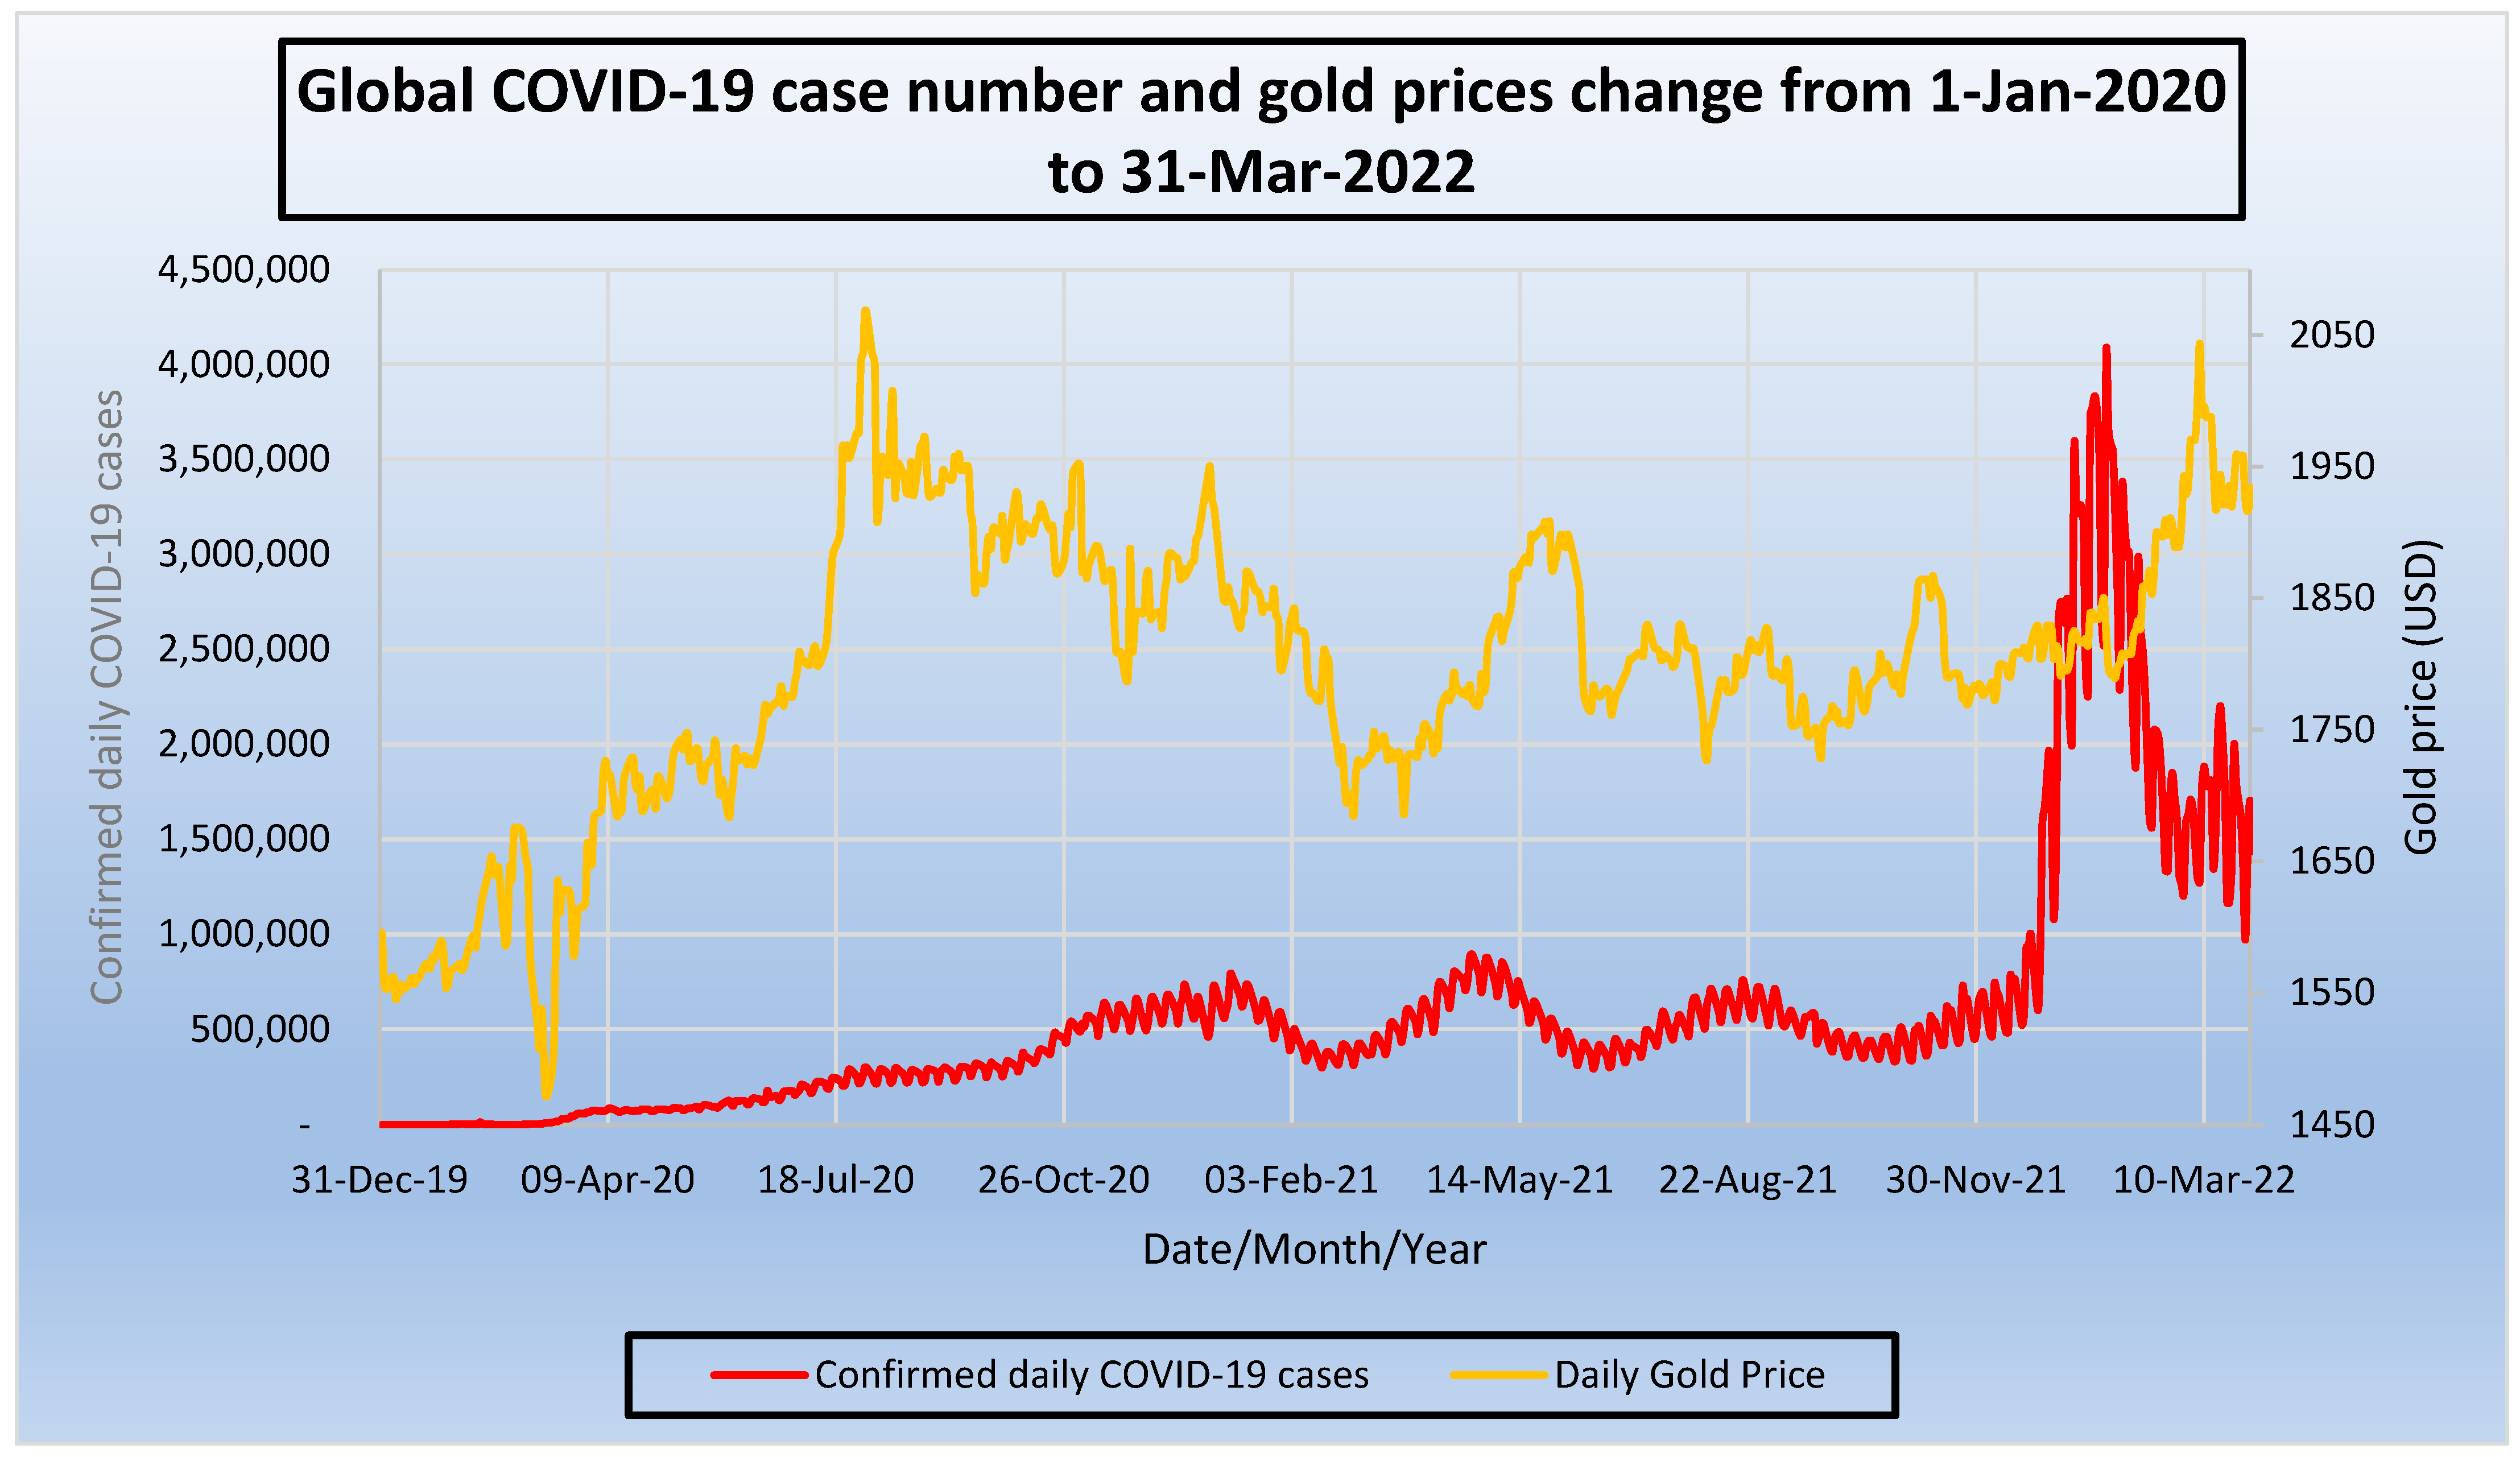
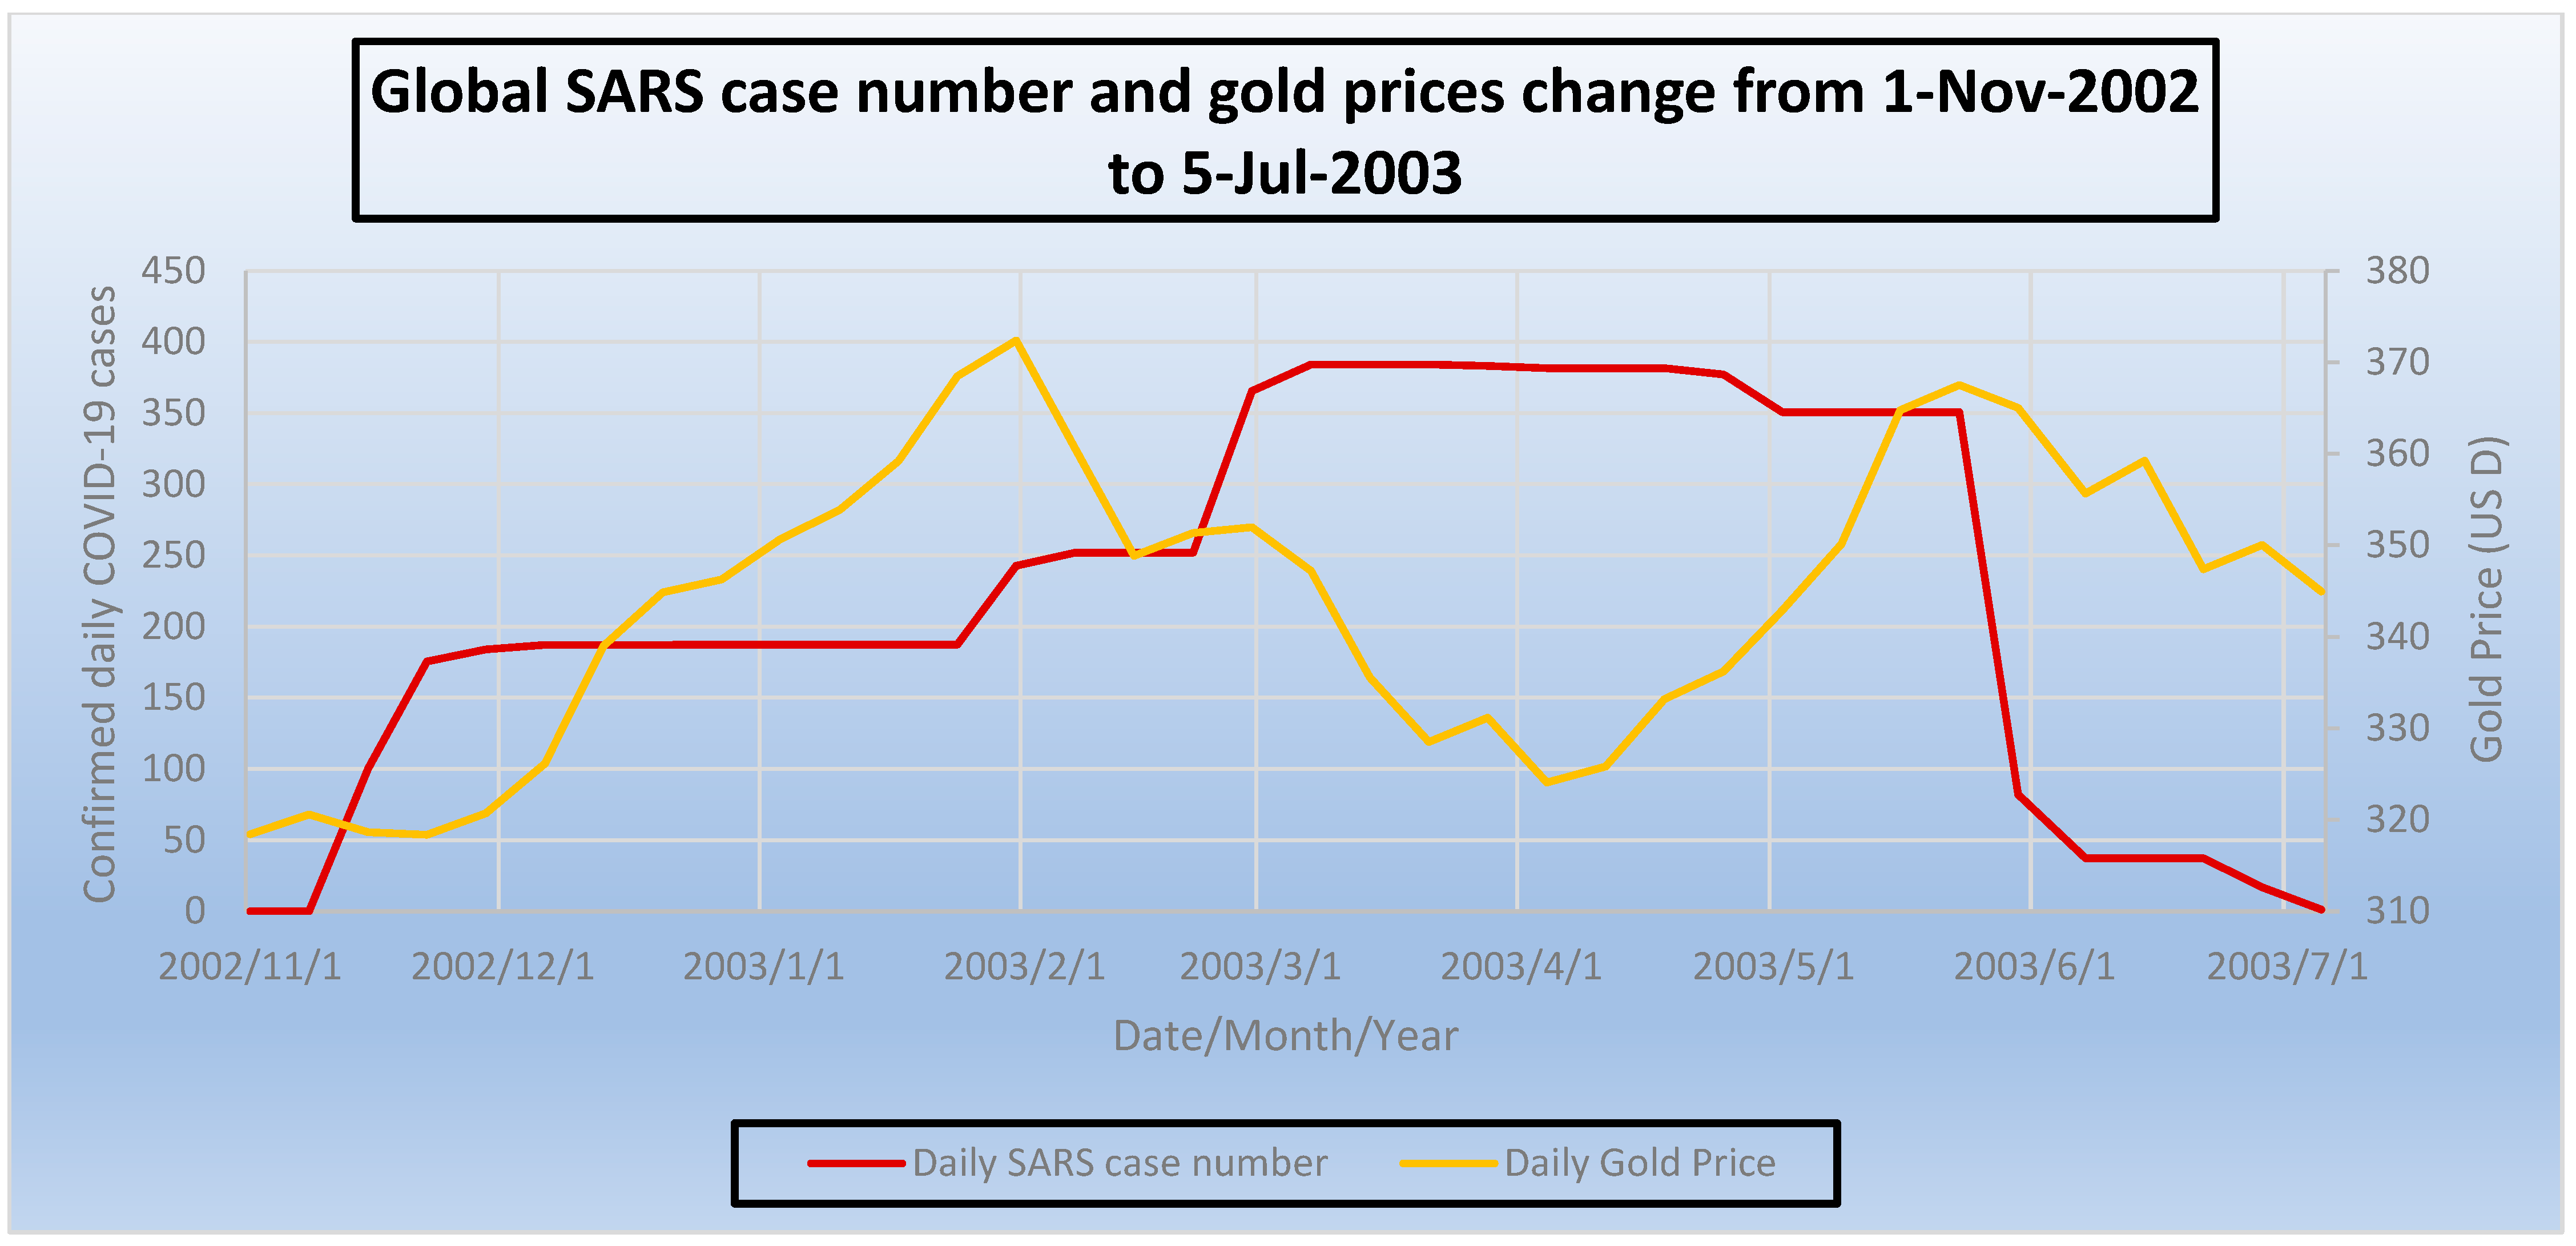
The recent COVID-19 pandemic greatly influenced the global economy due to unprecedented social distancing and lockdowns, the shutdown of travel and businesses as well as quarantine measures and the cancellation of public gatherings (Jackson et al. 2021). Pandemics have caused gold price increases as investors invested heavily in gold during the instability of global finance and the economy, as gold has long been considered the most stable and secure commodity (Baur and Lucey 2007). It was observed that during SARS, in 2003, and the COVID-19 pandemic, from January 2020 to March 2022, the gold price increased rapidly. The gold price during SARS started from US$ 320 to peak at US$ 370s (an increase of 15% approximately) and from USD 1510s to peak at US$ 2000s (an increase of approx. 25%) during COVID-19 (USA Gold 2023). The importance of gold is especially emphasized during international crises, notably virus outbreaks as well as war. Most recently, the COVID-19 outbreak caused an increase in the gold price; and a co-integrating relationship exists between the gold price and COVID-19 case numbers (Gautam et al. 2022).
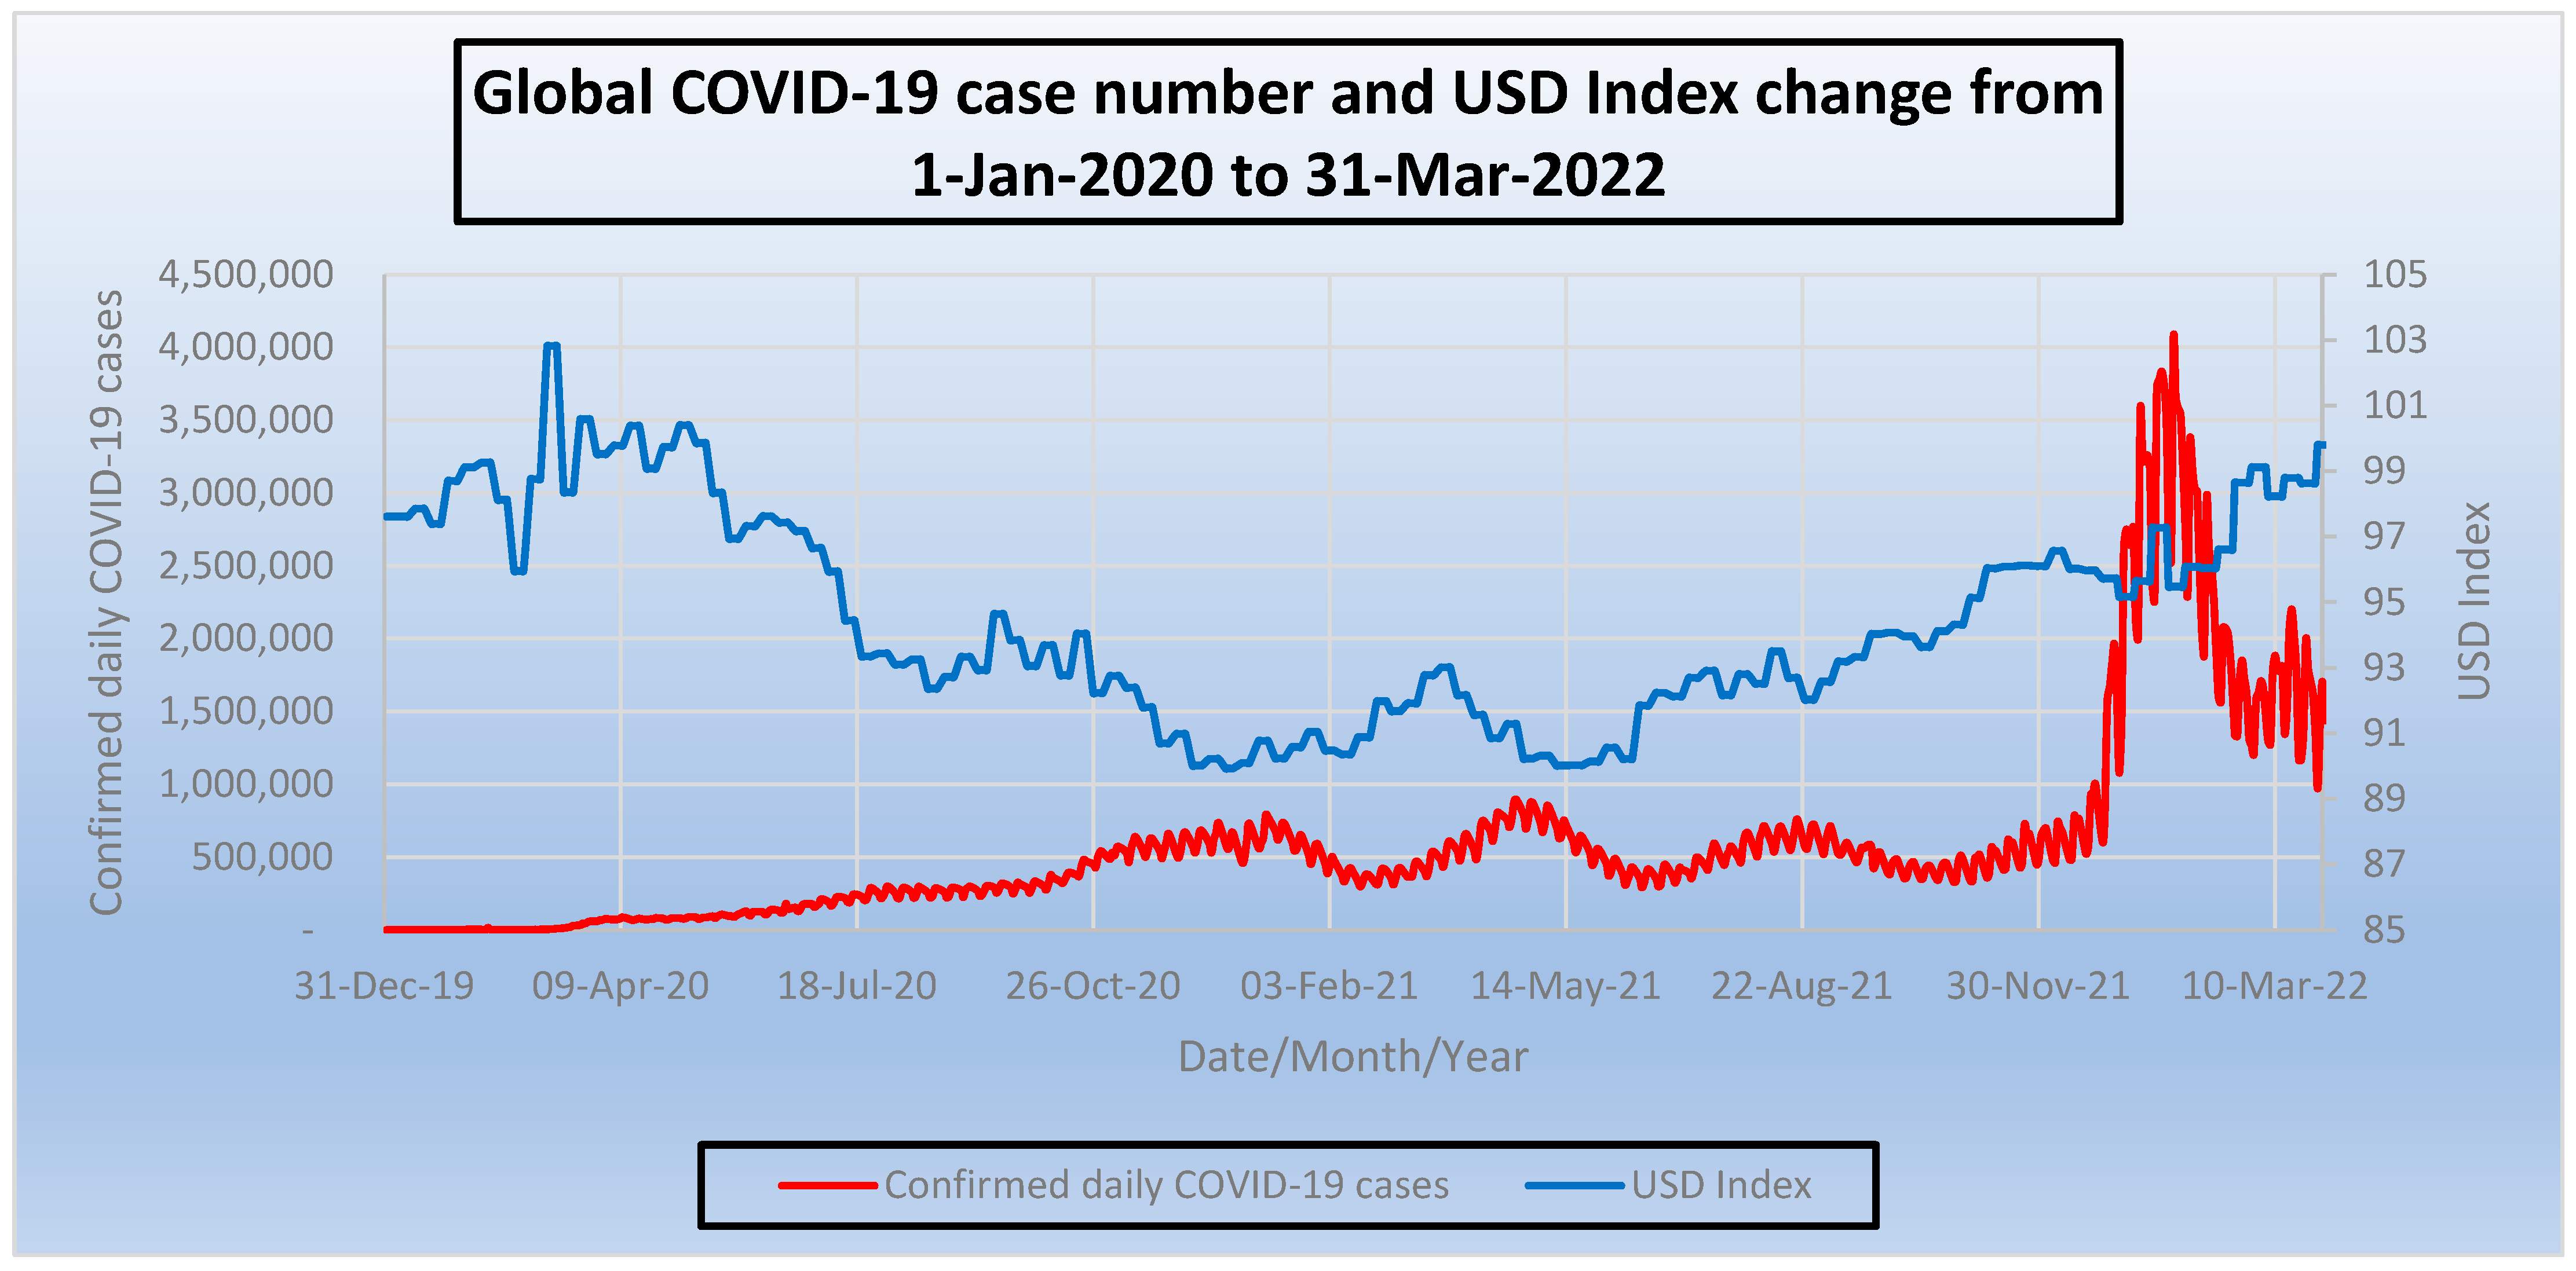
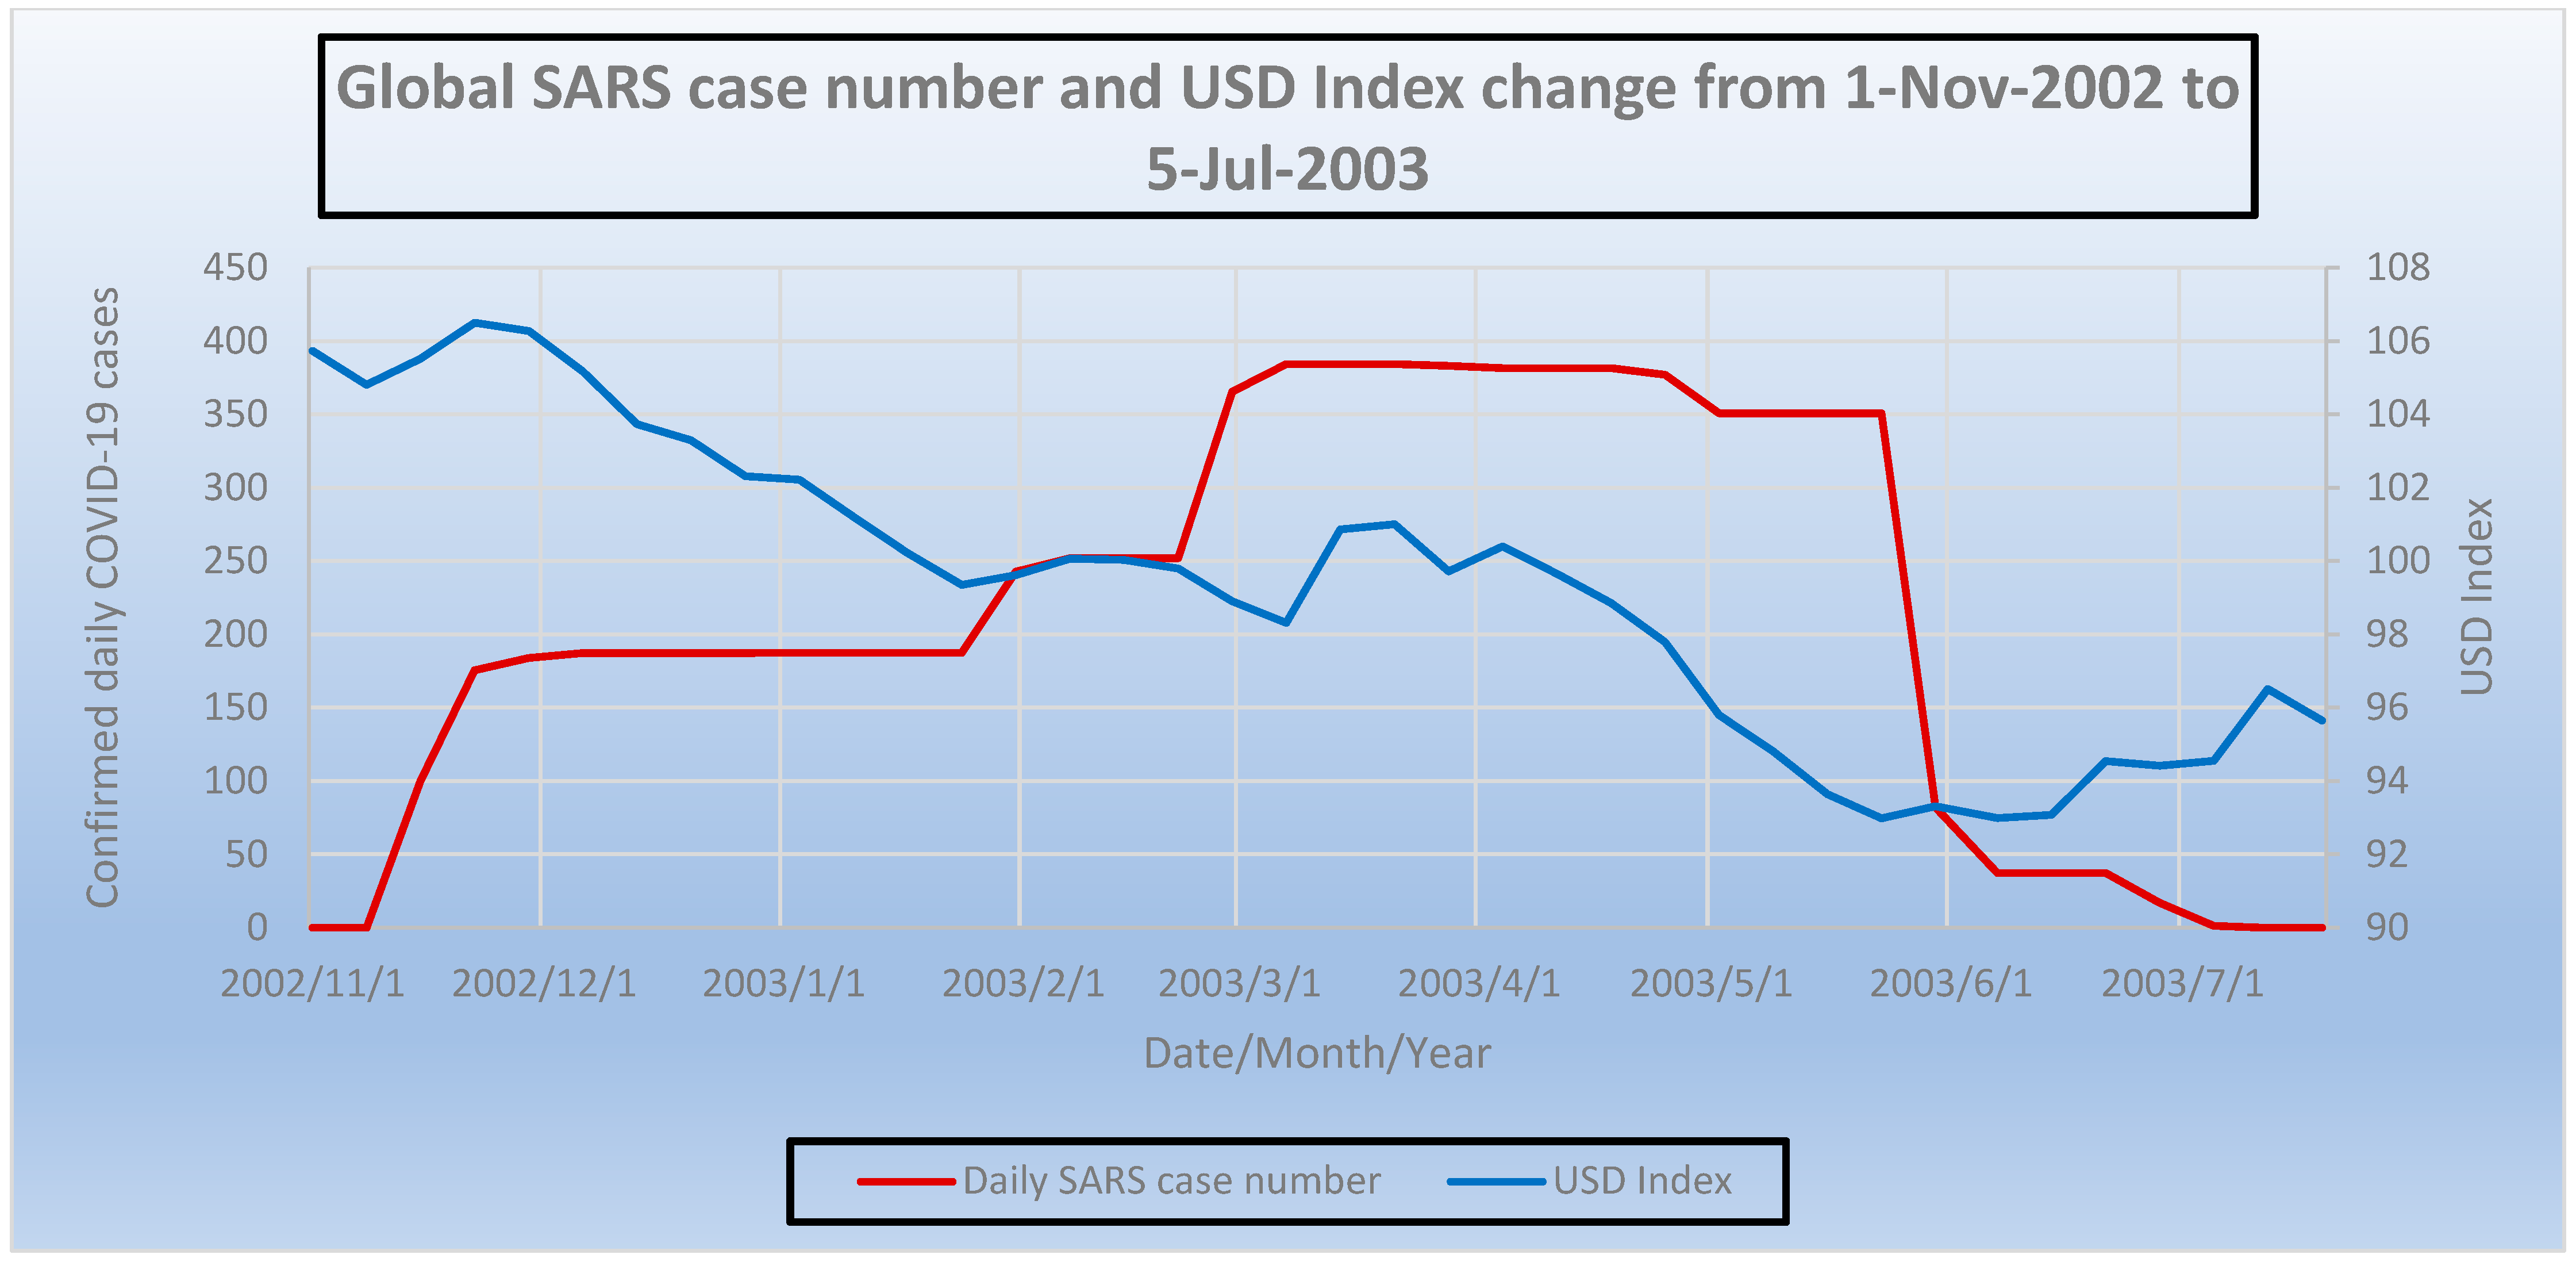
The USD has been a key international currency for the past century and arguably the most influential and traded currency since the mid-20th century and constitutes more than 40% of international transactions (Hall-Smith 2020). It is also the world’s primary ‘reserve currency’ which makes up nearly 63% of currency reserves by volume (IMF 2023) and the majority of world commodities are priced and traded in USD (Hall-Smith 2020). There was often a trend of a strong USD during international crises. A similar pattern was witnessed between gold and the USD where a number of countries also rushed to the USD and US government bonds in their foreign reserves, which is understood as a hedging or risk mitigation strategy during global crisis, as the US is arguably one of the most stable financial hubs in the world. During COVID-19, the USD index increased from 85 to 103, and from 90 to 105 during the SARS pandemic.
Cryptocurrencies are digital currencies which allow people to make payments directly to each other through an online system non-reliant on any central authorities (i.e., decentralized system), such as a government or bank, by eliminating the requirement for intermediaries during fund transactions between two entities. Although there are a number of arguments as to whether cryptocurrencies will eventually become a key currency that is recognized amongst the central banks around the world, it is important to note that there were heavy investments in cryptocurrencies from investors in the past decade where market capitalization of bitcoin hit USD 1.28 trillion on 9th November 2021 from USD 1.3 billion on 1st May 2013 (globaldata.com 2023). The recent volatility in the equity market followed by the COVID-19 pandemic may have been the contributor for investors to invest in bitcoin as an alternative (Anamika and Subramaniam 2021). There are different types of digital currencies, and the most notable cryptocurrency is bitcoin, and that is the reason for its choice for testing against COVID-19 case numbers. More specifically, (1) bitcoin is the oldest cryptocurrency, and accordingly, the longest pricing system is available; (2) it is one of the only cryptocurrencies with a limited supply of only 21 million coins (Cryptolist 2022); and (3) it is the most invested cryptocurrency today (Movsesyan 2022). However, during the SARS pandemic, cryptocurrencies were not an available tool for investment, and accordingly, no analysis can be performed in this context.
The aim of this paper is to investigate whether gold or USD values have been affected by the two recent pandemics, SARS and COVID-19 and their possible impact on bitcoin price; and whether it is gold or USD that is able to preserve its value better during times of global pandemic, such as COVID-19 and SARS. Furthermore, the paper investigates and compares the behavioral changes of the investors concerning international currency options during a global pandemic. This was achieved by carrying out unit root tests on all data to ensure non-stationary data were applied, Granger causality and Johansen co-integration tests to assess if there is any causal and co-integrating relationship, and VECM to obtain the beta coefficient which determines the % change per 1% increase between data.
There have been considerable efforts made by a few researchers to investigate how the gold price interacts with other economic indices or commodity prices as similar techniques were utilized. Haque et al. (2015) analyzed the relationship between the gold price (USD) and the Australian dollar to the USD (AUD/USD) exchange rates from 1996 to 2014 using an augmented vector auto-regression model and concluded that there is a long-term bi-directional causality relationship between gold price and USD exchange rate. Kim et al. (2022) determined that there is a long-term co-integrating and causal relationship between 12 different commodity prices including iron ore, oil, copper, gold, LNG, aluminum, nickel, silver, copper, etc., which causes rapid fluctuations in commodity prices magnifying the impact on net profit value (NPV), internal rate return (IRR) and ultimate pit limit (UPL) of resource production. Kim et al. (2023) suggested that an accurate prediction model of commodity prices can consequently optimize UPL as well as NPV and IRR which would maximize profit margins and minimize financial risks for mining investors. The gold price increased throughout the SARS pandemic (Radomski 2023), and its price increase in 2020–2022 was confirmed to be the result from increase in COVID-19 case numbers (Gautam et al. 2022).
Since the Bretton Woods system, the USD has been traded as the most important currency in the international currency market. Although there has been no previous statistical analysis carried out on the relationship between COVID-19 case numbers and the USD index, Ahmed and Ponthus (2021) suggested that the USD surged during the pandemic and Ranjan (2022) observed that the USD rose in line with real 5-year government yield rates and speculated that current dynamics would support the USD to remain strong for several years.
Bitcoin recently emerged as a safe-haven asset which should be integrated with commodities and equities for the purpose of providing an efficient investment strategy and a diverse allocation in assets for investors before and during the COVID-19 pandemic (Trichilli and Abbes 2022). Gherghina and Simionescu (2023) studied data related to COVID-19 such as the Coronavirus Fake News Index, Sentiment Index and Coronavirus Panic Index against bitcoin returns using a non-linear autoregressive distributed lag approach and Granger causality to conclude that Bitcoin was resistant to the pandemic crisis and may serve as a hedge during times of turmoil in the market.
There were also previous studies to compare gold, USD and bitcoin and their performance during global crisis. Das et al. (2020) studied the USD, gold, and bitcoin prices during the time of volatility in the oil price and concluded that the USD outperformed bitcoin and bitcoin outperformed gold. However, Zhu et al. (2022) found that gold is a hedge against global risk for both long- and short-term, while bitcoin is only in the short-term, using a non-linear autoregressive distributed lag model.
It is widely understood that the Granger causality test is effective in determining causality between several variables. Along with others, Gautam et al., determined that the gold price increase in 2020–2022 was confirmed to be caused by COVID-19 cases by using the Granger causality test (Gautam et al. 2022). Hong et al. (2022) also examined causality with the Granger causality test, but between gold and stock markets during COVID-19, determined the strong causality between gold and the stock markets which was largely influenced by COVID-19. Qian et al. (2023) studied the risk spillovers between the Chinese stock market and twelve major international markets by testing for Granger causality, determining unilateral extreme risk spillovers from China to the United States, France, and Germany and bilateral spillovers between China and the United States, Japan, as well as Australia.
This study concentrated on examining the collective impact on the preservation value of gold, USD currency, and Bitcoin prices during epidemics such as SARS and COVID-19. Previous studies have primarily focused on individual price fluctuations, i.e., Gherghina and Simionescu (2023) on bitcoin prices, Gautam et al. (2022) on gold prices in relation to COVID-19 cases, Bampinas and Panagiotidis (2015) on the hedging capability of gold exclusively, while Ahmed and Ponthus (2021) and Ranjan (2022) focused on the trend of the USD in correlation with 5-year government yield rates.
The findings suggest that the price of gold and USD were impacted by both SARS and COVID-19, although there was no clear causal link from COVID-19 and the price of bitcoin.
The paper is structured as follows: Section 1 reviews the important literature in this research field, Section 2 presents the research methods and data used in the paper, as well as quantitative results from the implementation of the methods and findings. Section 3 presents analyses of the results and discusses the findings. Finally, the main conclusions of the paper are presented in Section 4.
2. Research Methods, Data and Results
2.1. Sources of Data
The data were sourced between 1 January 2020 to 31 March 2022 for daily Global COVID-19 case numbers, gold prices (in USD), bitcoin price (in USD) as well as USD index, and from 1 November 2002 to 5 July 2003 for daily SARS case numbers, gold prices (in USD), and USD index. Daily gold price, USD index and bitcoin price were collected from websites providing the accurate daily price or index history from their live databases (Coindesk 2022, USA Gold 2023, Yahoo Finance 2022). Data for daily global confirmed number of COVID-19 cases were imported from the World Health Organization (WHO) database (WHO 2022) and SARS case numbers also from WHO database (WHO 2015). MATLAB (jcitest MathWorks 2022) (vec model MathWorks 2022) packages were used for econometric and statistical analysis. USD index is a measure of the influence of USD, which is a weighted geometric mean of the dollar’s value relative to six different currencies, Euro (57.6%), Japanese yen (13.6%), pound sterling (11.9%), Canadian dollar (9.1%), Swedish krona (4.2%) and Swiss franc (3.6%). The USD index was established by the Federal Reserve in 1973 to track the value of the USD following the declaration, in 1971, that the Federal Reserve would abandon the gold standard, meaning the USD would no longer be directly convertible to gold (Federal Reserve History 1971). This resulted in free floating of the USD value in foreign exchange markets, and consequently, the investors often use the USD index as a litmus test for U.S. economic performance.
Duggan and Curry (2023) comment that there are limitations in the USD index, given the weightings of the currencies used to calculate the index were based on the United States’ biggest trading partners in the 1970s. Therefore, this calculation may not truly reflect current USD value as currency trading share today is quite different, as shown in Table 1. To determine whether USD index is over- or under-represented, comparison has been made against the actual % of different currency trade, excluding USD. The data in Hall-Smith (2020) share the world currency trade % for respective countries. Then, Equation (1) presents the relationship used to calculate the actual % of different currency trade excluding USD.
where 44.15% is the proportion ratio of USD trade in the world currency market (Duggan and Curry 2023).
Table 1 shows that the Euro, Canadian dollar, and Swedish krona were over-represented, whereas Japanese Yen, Australian dollars, Swiss franc, Chinese renminbi (CNY), Hong Kong dollar and New Zealand dollar were under-represented. However, there is no other direct data that are readily available to assess the value of USD and thus, the USD index was tested against SARS and COVID-19 case numbers.
2.2. Trend of Data
Figure 1 demonstrates the number of daily COVID-19 cases and the price of gold over the period from 1 January 2020 to 31 March 2022 (611 days). Similarly, Figure 2 shows the number of daily SARS case numbers and the price of gold over the period from 1 January 2020 to 31 March 2022 (approx. 242 days). As reflected in these figures, there is a lagged response from SARS and COVID-19 case numbers on the price of gold.
Figure 3 and Figure 4 demonstrate COVID-19 case numbers and USD index change and the relationship of SARS case number with USD index during the same period, respectively. A similar lagged response from COVID-19 and SARS case numbers on the USD index change may be observed from these two figures.
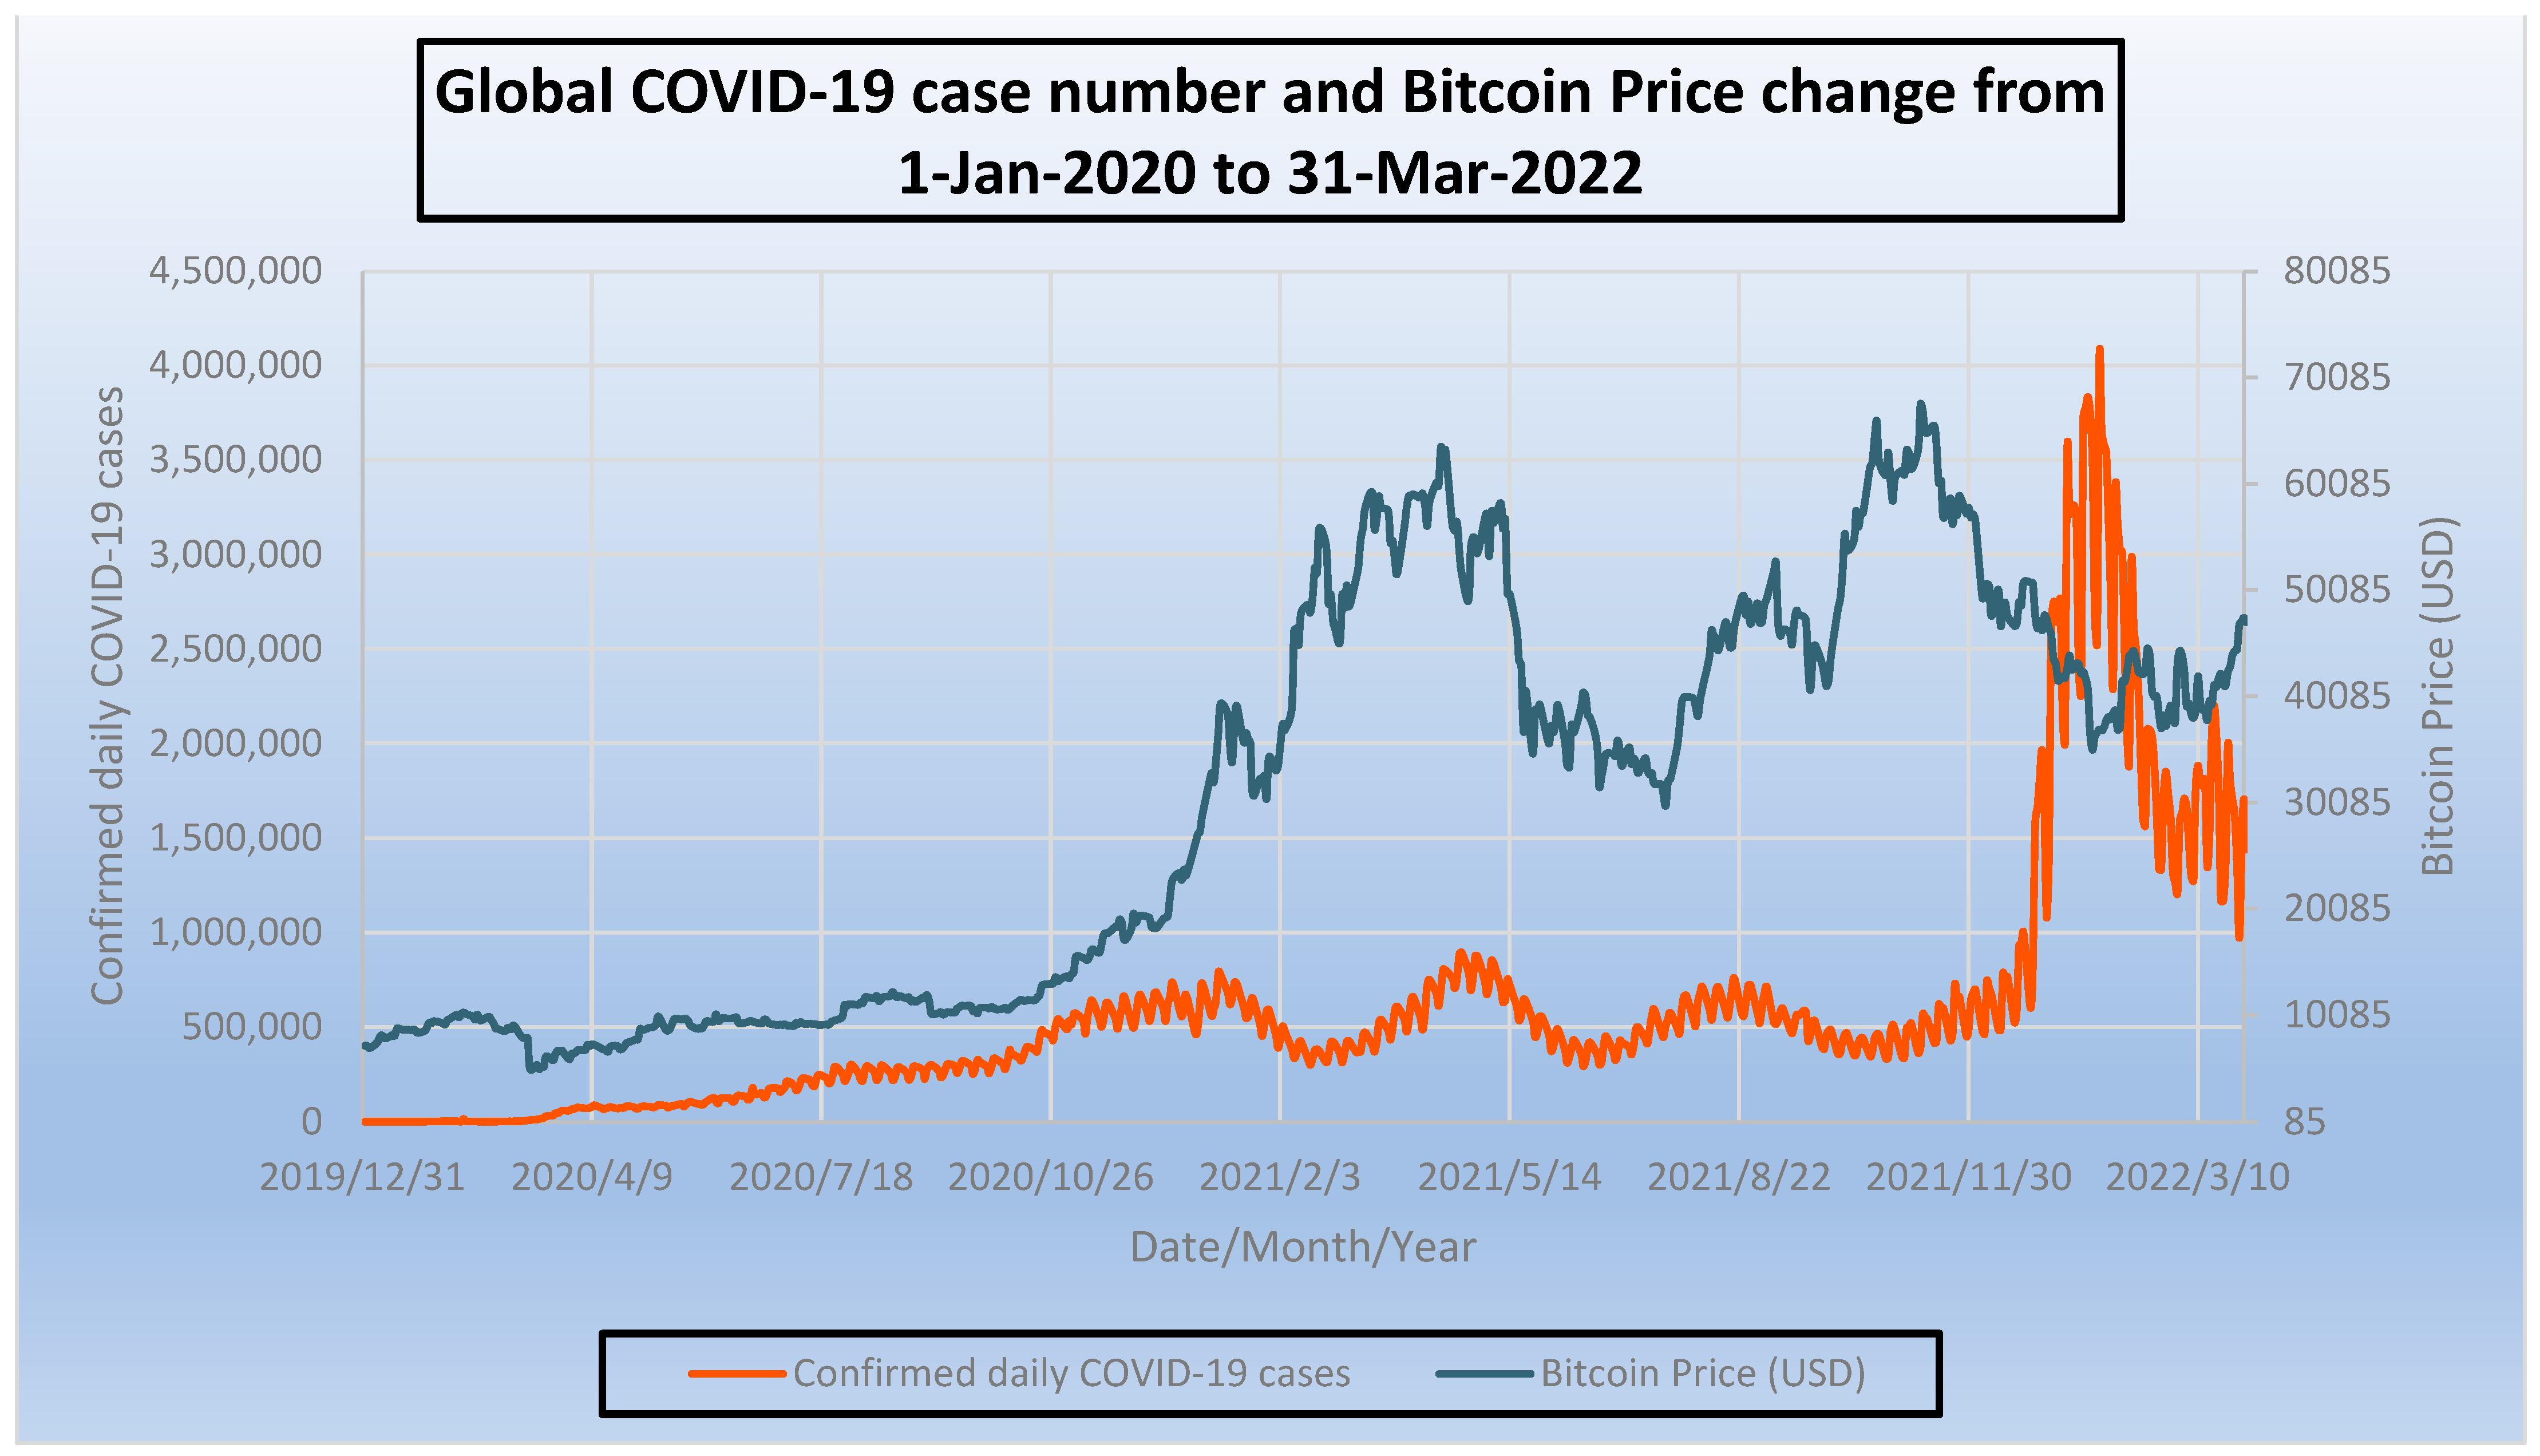
Also, Figure 5 displays COVID-19 case numbers and bitcoin price in USD; the bitcoin price also shows a positively proportional relationship again COVID-19 case numbers. It is important to note that bitcoin did not exist during SARS, hence no data are available and this comparison is therefore discarded from this research.
2.3. Unit Root Test (Augmented Dickey–Fuller Test)
An augmented Dickey–Fuller (ADF) test was used to determine whether the series has a unit root or otherwise. This test facilitates the investigation of the relationship between COVID-19, SARS case numbers, USD index, gold price and bitcoin price (Dickey and Fuller 1979). The purpose of the ADF test is to ensure the co-integration test is applicable; a co-integration test is possible when the variables contain unit roots. Testing whether unit roots exist in a time series variable is performed by a stochastic autoregressive (AR) model which is stated as:
where X(t) is the time series variable, εt is the stochastic disturbances (or error terms), and Φ is a k × k matrix (note that the unit root exists when Φ = 1 and is non-stationary and unit root does not exist when Φ ≠ 1 and is stationary).
The null hypothesis of the ADF test is that the variable contains a unit root, and hence, is non-stationary. At 5% significance or at 95% confidence interval, the outcome is interpreted when p > 0.05, i.e., the null hypothesis cannot be rejected, contains unit root, and is non-stationary. On the other hand, when p < 0.05, the null hypothesis is rejected, does not contain unit root, and is stationary. The tests were carried out at 5% significance level.
Results
COVID-19 case numbers and gold price data are non-stationary (Gautam et al. 2022) as shown in Table 2. SARS case numbers, USD index and bitcoin price all contain unit roots at all lags for periods between 0 to 6 months, for all models, hence the time series variables are non-stationary, as shown in Table 3. Based on the ADF test results, it may be concluded that the null hypothesis (unit root exists) can be accepted (or cannot be rejected) at 5% significance level (or with 95% confidence level) for SARS case numbers, USD index and bitcoin price. Hence, all time-series variables contain unit roots and are non-stationary. Therefore, the co-integration test can be carried out.
2.4. Granger Causality Test
The Granger causality test was developed for testing causality relationship between two econometric variables where 2 × 2 unrestricted VAR models are applied (Granger 1969):
where Xt represents the causing econometric variable and Yt represents the caused econometric variable, α is the coefficient matrix of the error correction term and the adjusted long-run disequilibrium of the variables, β is the coefficient matrix of the co-integrating vector, k is causality rank, e1t and e2t are stochastic disturbances, i.e., these are error terms.
Results
Table 4 summarizes the null hypothesis for Granger causality tested from COVID-19 cases against gold price, USD index and bitcoin price. Table 4 reflects that:
- The null hypothesis for Granger causality has not been accepted for COVID-19 cases to gold price (i.e., the Granger causality exists);
- The null hypothesis for Granger causality has not been accepted for COVID-19 cases to USD index (i.e., the Granger causality exists);
- The null hypothesis for Granger causality has been accepted for COVID-19 cases to bitcoin (i.e., the Granger causality does not exist).
The results show that COVID-19 cases have causality to gold, bitcoin price and USD index; however, there is no causality the other way around. Table 5 presents the null hypothesis for Granger causality tested between SARS cases against gold price, USD index and bitcoin price. The results in Table 5 explain the following:
- The null hypothesis for Granger causality has been accepted for SARS cases to gold price (i.e., the Granger causality does not exist);
- The null hypothesis for Granger causality has been accepted for SARS cases to USD index (i.e., the Granger causality does not exist);
- Therefore, there is causality from SARS case numbers to gold price as well as to USD.
The results show that SARS case numbers have causality to both gold and USD index.
2.5. Johansen Co-Integration Test and VECM Parameters for Bivariate Modelling Using Engle—Granger Test
The Johansen co-integration is a VAR model to determine whether co-integration exists between two econometric variables (Johansen 1991). Also, the vector error correction model (VECM) adds error correction features to a multi-factor model known as VAR. The VAR model between COVID-19 cases or SARS against gold price, bitcoin price and USD index is estimated using Equations (4) and (5) below, where yt represents the COVID-19 or SARS case variable and xt represents the gold price, bitcoin price and USD index variable:
This translates into a matrix representation as given in Equation (6):
where α is the coefficient matrix of the error correction term and the adjusted long-run disequilibrium of the variables, β is the coefficient matrix of the co-integrating vectors, Γj is the coefficient that estimates short-run shock effects on ∆X(t), v is a constant term, δt is the linear time trend term, and et is the normally distributed error term.
Similarly, Equation (8) presents a bivariate VAR (1) model:
Since X(t) is co-integrated with one co-integrating vector rank (∏) = 1, it can be decomposed to:
The VECM equation to show the change in X(1t) and X(2t) can be written as:
Results
The results for Johansen co-integration and VECM on COVID-19 vs. gold price, USD index and bitcoin price are tabulated in Table 6, where
- Co-integration exists between COVID-19 cases and gold price (h = 1) with a beta coefficient of 0.0166.
- Co-integration exists between COVID-19 cases and USD index (h = 1) with a beta coefficient of 1.9004 × 10⁻⁷.
- Co-integration exists between COVID-19 cases and bitcoin price (h = 1) with a beta coefficient of 1.9.
Similarly, the results for Johansen co-integration and VECM on SARS vs. gold price and USD index are presented in Table 7, where
- Co-integration exists from SARS cases to gold price (h = 1) and the beta coefficient is −0.0173.
- Co-integration exists from SARS cases to USD index (h = 1) and the beta coefficient is −0.0328.
3. Results Analysis and Findings of the Research
This research will broaden the understanding of gold and USD which are not only international currency, but also key indicators for economic climate as well as market risk profile; hence, it is essential to be able to forecast their movements especially during crises when prices are turbulent. The findings of this study may not only facilitate potential investors in understanding the responsiveness of the gold price, USD and cryptocurrency (bitcoin) to global pandemics, but may also assist in forecasting future prices during pandemic, natural disaster, or financial crises.
Based on the findings from the Granger causality test, both SARS and COVID-19 had Granger causality to gold price and USD index. There was also no Granger causality to bitcoin price with COVID-19. Johansen co-integration presented very similar results where both SARS and COVID-19 had a co-integrating relationship with gold price and USD index. The bitcoin price from the Granger causality test should be discarded because the results contradict the Johansen co-integration test. A limitation of Granger causality is that when it is applied to non-stationary variables (in this case, COVID-19 case numbers), the results may not be reliable, because the Granger causality test may result in spurious regression for non- stationary data.
Based on VECM analysis, the beta coefficient of 0.0166 from VECM between COVID-19 cases and the gold price indicated that a 1% increase in COVID-19 cases led to a 0.0166% increase in gold price. Considering the 17.38% average growth per day during the period from 1 January 2020 to 31 March 2022, a 0.2885% increase in gold price per day was attributed from COVID-19 cases (Gautam et al. 2022). In addition, SARS cases to gold price had a beta coefficient of 0.0173, considering a 3.67% increase per day in the total number of SARS cases during the pandemic period. The SARS pandemic was attributed with a 0.06349% appreciation in gold price per day. Beta coefficients of 0.0166 (COVID-19 to gold) and 0.0173 (SARS to gold) indicate that COVID-19 and SARS had similar effects on gold price for a 1% increase in case numbers. By understanding that the beta coefficient is the % increase in gold price per 1% increase in SARS and COVID-19 case numbers and observing that COVID-19 had a significantly higher number of case numbers, hence COVID-19 impacted the gold price far more than SARS due to its high case numbers.
The VECM between COVID-19 cases to USD index had a beta coefficient of −1.9004 × 10⁻⁷, which meant that a 1% increase in COVID-19 case numbers led to a mere 0.0000019% increase in the USD index. This shows that COVID-19 had far less impact on the USD index compared to gold (1% COVID-19 impacts 0.0166% gold price appreciation). The VECM result for SARS and the USD index had a beta coefficient of −0.0328 and considering a 3.67% increase per day in the total number of SARS cases during the pandemic period, a mere 0.12% increase in the USD index was observed. Beta coefficients of −1.9004 × 10⁻⁷ (for COVID-19 to USD index) and −0.0328 (for SARS to USD index) indicated that COVID-19 had far less impact on the USD index compared to SARS for a 1% increase in its case numbers. Due to the high COVID-19 number, it is not feasible to directly compare its long-term influence on the USD index. This result was likely to be contributed to by the escalation of greater conflict than the pandemic itself, such as US–China trade sanctions, the possibility of war in various parts of the world, and international decoupling. It is also interesting to note that Russia had purchased 1,500 tons of gold from 2011 to 2021 (Bajpai 2022), indicating Russia may have been preparing for the recent wars in Crimea and Ukraine.
However, in contrast to the behavior shown between gold vs. SARS and COVID-19, due to the high number of cases for COVID-19, a direct comparison may not be made for the SARS effect on the USD index. These analyses exclude the other factors such as world political crisis, Federal Reserve Bank of US decisions, etc. For the COVID-19 cases to bitcoin price, the beta coefficient was 0.01, which revealed a 0.01% increase in bitcoin price per 1% increase in COVID-19 cases, and then considering the 15.59% average increase per day, it is a 0.1559% increase in the bitcoin price per day. As there was no bitcoin price available during the SARS pandemic, data were not available for the tests.
4. Conclusions
This research focused on the fluctuation in the gold price, the USD index and bitcoin prices during the recent pandemics (SARS and COVID-19) that the human race has experienced in the past two decades and to understand the relationship between these indices during the pandemics. Furthermore, this study investigated the behavioral changes in the international currency options during global pandemic. The determination of the relationship was specifically accomplished on causality and co-integration along with VECM to establish the beta coefficient.
Granger causality test and Johansen co-integration test were able to assess how gold and the USD were affected by SARS and COVID-19, as well as how bitcoin was affected by COVID-19. The Granger causality test determined that there is one-directional causality existing from SARS and COVID-19 case numbers to gold price and the USD index. The Johansen co-integration test also displayed similar results for gold price and USD index, except for bitcoin price. The Granger causality result between COVID-19 and bitcoin price was discarded due to its limitation of showing spurious regression for non-stationary data.
In the VECM results for both SARS and COVID-19 case numbers against gold, the USD indicated that USD remained a better hedge against inflation than gold during the SARS pandemic; in other words, the USD was able to preserve its value almost twice as well as gold during SARS. This is because a number of central banks were selling gold between the 1970s to 2019 (Strauss-Kahn 2019). On the other hand, gold was a better hedge than the USD during the COVID-19 pandemic, meaning the gold price has shown a trend of preserving its value far better than the USD. COVID-19 and SARS had similar effects on gold price at a 1% increase in case numbers. Due to exponentially higher case numbers for COVID-19 as compared to SARS, COVID-19 had far more effect than SARS in the context of the gold price. In addition, based on the beta coefficient, COVID-19 had far less impact on the USD index compared to SARS for a 1% increase in its case numbers. However, due to the high number of cases for COVID-19, it was not feasible to directly compare its long-term influence on the USD index. The USD was able to preserve its value better than gold during the SARS period. COVID-19 on the other hand, displayed an opposite outcome (gold was able to preserve its value better than the USD). This phenomenon was likely attributable to the escalation of greater conflict than to the pandemic itself, such as US–China trade sanctions, the possibility of war in various parts of the world, international decoupling, etc.
Theoretically, this may imply that the scarcity of gold is usually higher in pandemics unless there were interventions by central banks between the 1970s to 2019 (Strauss-Kahn 2019). Practically, it is forecasted that the scarcity of gold will be higher in the event of upcoming conflicts in global politics and the economy, which may potentially lead to a solid increase in the gold price in upcoming decades, underlining its stability.
There are however limitations in the research due to limited data. The research has focused only on the SARS and COVID-19 periods; there are other pandemics in history which impacted globally, such as Spanish flu; however, they were omitted in this research due to limited access to data, as no USD index had been established during these periods. Also, there are limitations in the assumptions made in this research; the results from pandemic data may not totally represent the outlook for data during political economic crisis, but the risk is similar in nature. Also, the risk of spurious outcomes for non-stationary variables in the Granger causality test posed a difference in results from the Johansen co-integration, specifically for bitcoin price; this outcome has been discarded throughout the interpretation of results.
Furthermore, there is speculation that cryptocurrency will eventually take the value of gold or other currencies; however, understanding that 1. not all cryptocurrencies are limited in terms of their supply which means that scarcity may be disputed; 2. a number of central banks around the world still restrict the use of cryptocurrencies for either payment or banking; and 3. the example that there was no Granger causality from the COVID-19 case numbers on cryptocurrency (USD index and gold price showed causality), it is too early to conclude its eventual substitution for existing currencies or gold.
In addition, cryptocurrency is expected to follow a similar trajectory as previous currencies like silver and bronze. Historically, silver and bronze were also considered alternatives to gold. For example, silver coins known as ‘Shekel’ (Kusimba 2017) and the ‘Drachma’ (Britannica 2022), along with bronze knife money such as ‘Myungdojeon’ (Yoon 1989), were potential substitutes. However, these efforts to replace gold ultimately failed. This can be attributed to the fact that gold possesses a shiny and rare quality, making it visually appealing and incredibly durable. Moreover, gold is highly malleable and resistant to air, heat, moisture, and most solvents. These characteristics enable gold to maintain its form, thus retaining its value over the course of human history. As a result, gold has long been considered a means of preserving wealth.
The application of similar methods of research would enable effective future investment between gold, USD and cryptocurrency (bitcoin) during pandemic, natural disaster, or financial crises, and be able to forecast if there were any sign of decline or continuous dominance of the USD against gold and other currencies. Also, the same method can be used to forecast the USD, Chinese yuan and gold price for potential economic or military conflicts that may occur between the US and its allies against Russia–China and its allies. As bitcoin is a relatively established cryptocurrency, future research may be carried out on other cryptocurrencies and whether they are able to preserve their value better than bitcoin.
Author Contributions
Conceptualization: E.T., Methodology: Y.K., Software: Y.K., Validation: E.T. and Y.K., Formal analysis: E.T. and Y.K., Investigation: E.T. and Y.K., Data curation: Y.K., Writing—original draft preparation: Y.K. and E.T., Writing—review and editing: E.T., Y.K., A.K.G. and M.W.A.A., Supervision: E.T., A.K.G. and M.W.A.A., Project administration: Y.K. and E.T. All authors have read and agreed to the published version of the manuscript.
Funding
This research received no external funding.
Informed Consent Statement
Not applicable. No human involvement in the study.
Data Availability Statement
Data is available together with the publication.
Conflicts of Interest
The authors declare no conflict of interest.
References
- Ahmed, Saqib Iqbal, and Julien Ponthus. 2021. Dollar Edges Higher Amid Pandemic Concerns; U.S. Inflation Data Eyed. Reuters. Available online: https://www.reuters.com/business/dollar-steadies-amid-pandemic-concerns-inflation-focus-2021-07-12/ (accessed on 22 December 2022).
- Anamika, Madhumita Chakraborty, and Sowmya Subramaniam. 2021. Does sentiment impact cryptocurrency? Journal of Behavioral Finance 24: 202–18. [Google Scholar] [CrossRef]
- Bajpai, Prableen. 2022. Which Nations Have Been Buying Gold? NASDAQ. Available online: https://www.nasdaq.com/articles/which-nations-have-been-buying-gold (accessed on 21 October 2022).
- Bampinas, Georgios, and Theodore Panagiotidis. 2015. Are gold and silver a hedge against inflation? A two century perspective. International Review of Financial Analysis 41: 267–76. [Google Scholar] [CrossRef]
- Baur, Dirk G., and Brian M. Lucey. 2007. Is Gold a Hedge or a Safe Haven? An Analysis of Stocks, Bonds and Gold. The Financial Review 45: 217–29. [Google Scholar] [CrossRef]
- Britannica. 2022. Drachma. Available online: https://www.britannica.com/money/drachma (accessed on 15 October 2022).
- Coindesk. 2022. Bitcoin Price. Available online: https://www.coindesk.com/price/bitcoin/ (accessed on 21 October 2022).
- Cryptolist. 2022. Cryptocurrencies with a Fixed Max Supply. Available online: https://cryptoli.st/lists/fixed-supply (accessed on 17 October 2022).
- Das, Debojyoti, Corlise Liesl Le Roux, R. K. Jana, and Anupam Dutta. 2020. Does Bitcoin hedge crude oil implied volatility and structural shocks? A comparison with gold, commodity and the US Dollar. Finance Research Letters 36: 101335. [Google Scholar] [CrossRef]
- Dickey, David A., and Wayne A. Fuller. 1979. Distribution of the estimators for autoregressive time series with a unit root. Journal of the American Statistical Association 74: 427–31. [Google Scholar] [CrossRef]
- Duggan, W., and B. Curry. 2023. The U.S. Dollar Index. Forbes. Available online: https://www.forbes.com/advisor/investing/dollar-index/ (accessed on 28 October 2022).
- Federal Reserve History. 1971. Nixon Ends Convertibility of U.S. Dollars to Gold and Announces Wage/Price Controls. Federal Reserve History. Available online: https://www.federalreservehistory.org/essays/gold-convertibility-ends (accessed on 21 October 2022).
- Gautam, Roshan, Yoochan Kim, Erkan Topal, and Michael Hitch. 2022. Correlation between COVID-19 cases and gold price fluctuation. International Journal of Mining, Reclamation and Environment 36: 574–86. [Google Scholar] [CrossRef]
- Gherghina, Ştefan Cristian, and Liliana Nicoleta Simionescu. 2023. Exploring the asymmetric effect of COVID-19 pandemic news on the cryptocurrency market: Evidence from nonlinear autoregressive distributed lag approach and frequency domain causality. Financial Innovation 9: 21. [Google Scholar] [CrossRef] [PubMed]
- globaldata.com. 2023. Bitcoin’s Market Capitalization History, Global Data. Available online: https://www.globaldata.com/data-insights/financial-services/bitcoins-market-capitalization-history/ (accessed on 5 February 2023).
- Granger, Clive W. J. 1969. Investigating causal relations by econometric models and cross-spectral methods. Econometrica 37: 424–38. [Google Scholar] [CrossRef]
- Hall-Smith, Will. 2020. What Are the Top 10 Most Traded Currencies in the World? IG Australia. Available online: https://www.ig.com/au/trading-strategies/what-are-the-top-10-most-traded-currencies-in-the-world-200115 (accessed on 19 October 2022).
- Haque, Md Aminul, Erkan Topal, and Eric Lilford. 2015. Relationship between Gold Price and Australian Dollar-US Dollar Exchange Rate. Mineral Economics Journal 28: 65–78. [Google Scholar] [CrossRef]
- Hong, Yanran, Feng Ma, Lu Wang, and Chao Liang. 2022. How does the COVID-19 outbreak affect the causality between gold and the stock market? New evidence from the extreme Granger causality test. Resources Policy 78: 102859. [Google Scholar] [CrossRef] [PubMed]
- International Monetary Fund (IMF). 2023. Available online: https://data.imf.org/regular.aspx?key=41175 (accessed on 19 October 2022).
- Jackson, James K., Martin A. Weiss, Andres B. Schwarzenberg, Rebecca M. Nelson, Karen M. Sutter, and Michael D. Sutherland. 2021. Global Economic Effects of COVID-19, Congressional Research Service. Available online: https://sgp.fas.org/crs/row/R46270.pdf (accessed on 17 March 2021).
- jcitest MathWorks. 2022. Jcitest, MATLAB Mathworks. Available online: https://au.mathworks.com/help/econ/jcitest.html (accessed on 28 April 2021).
- Johansen, Søren. 1991. Estimation and hypothesis testing of co-integration vectors in Gaussian vector autoregressive models. Journal of Econometrica 59: 1551–80. [Google Scholar] [CrossRef]
- Kim, Yoochan, Apurna Ghosh, Erkan Topal, and Ping Chang. 2022. Relationship of iron ore price with other major commodity prices. Mineral Economics 35: 295–307. [Google Scholar] [CrossRef]
- Kim, Yoochan, Apurna Ghosh, Erkan Topal, and Ping Chang. 2023. Performance of different models in iron ore price prediction during the time of commodity price spike. Resources Policy 80: 103237. [Google Scholar] [CrossRef]
- Kusimba, Chapurukha. 2017. When—And Why—Did People First start Using Money? Theconversation.com. Available online: https://theconversation.com/when-and-why-did-people-first-start-using-money-78887?xid=PS_smithsonian (accessed on 14 November 2022).
- Movsesyan, Marisha. 2022. Most Traded Cryptocurrencies. IFC Markets. Available online: https://www.ifcmarkets.com/en/learn-about-crypto/most-traded-cryptocurrencies (accessed on 20 October 2022).
- Qian, Lingling, Yuexiang Jiang, and Huaigang Long. 2023. Extreme risk spillovers between China and major international stock markets. Modern Finance 1: 30–34. [Google Scholar] [CrossRef]
- Radomski, P. 2023. Will Gold Manage to Break above Its Mid-2022 Top? investing.com. Available online: https://www.investing.com/analysis/will-gold-manage-to-break-above-its-mid2022-top-200634099 (accessed on 27 February 2023).
- Ranjan, Pritosh. 2022. Why Has the Dollar Been so Strong—And Can It Continue? Schoroders Wealth Management. Available online: https://www.schroders.com/en-us/us/wealth-management/insights/why-has-the-dollar-been-so-strong-and-can-it-continue/ (accessed on 20 December 2022).
- Strauss-Kahn, Isabelle. 2019. Central Banks Return to Gold, Gold Hub. Available online: https://www.gold.org/goldhub/research/gold-investor/central-banks-return-to-gold (accessed on 21 October 2022).
- Trichilli, Yousra, and Mouna Boujelbène Abbes. 2022. The impact of COVID-19 on the portfolio optimization. EuroMed Journal of Business 18: 207–28. [Google Scholar] [CrossRef]
- USA Gold. 2023. Daily Gold Price History, USA Gold. Available online: https://www.usagold.com/daily-gold-price-history/ (accessed on 29 March 2022).
- vec model MathWorks. 2022. Estimate VEC Model Parameters. MATLAB Mathworks. Available online: https://au.mathworks.com/help/econ/estimate-vec-model-parameters.html (accessed on 2 February 2021).
- World Health Organization (WHO). 2015. Summary of probable SARS cases with onset of illness from 1 November 2002 to 31 July 2003. Available online: https://www.who.int/publications/m/item/summary-of-probable-sars-cases-with-onset-of-illness-from-1-november-2002-to-31-july-2003 (accessed on 21 October 2022).
- World Health Organization (WHO). 2022. Coronovirus (COVID-19) Dashboard. Available online: https://covid19.who.int (accessed on 1 April 2022).
- Yahoo Finance. 2022. US Dollar/USDX—Index. Available online: https://finance.yahoo.com/quote/DX-Y.NYB/history/ (accessed on 21 October 2022).
- Yoon, N. H. 1989. Myungdojeon–Wealth of ancient Gojoseon. Weolgan Samtur 20: 111–15. [Google Scholar]
- Zhu, Xuehong, Zibo Niu, Hongwei Zhang, Jiaxin Huang, and Xuguang Zuo. 2022. Can gold and bitcoin hedge against the COVID-19 related news sentiment risk? New evidence from a NARDL approach. Resources Policy 79: 103098. [Google Scholar] [CrossRef] [PubMed]
Figure 1.
Global COVID-19 case number and gold prices change from 1-Jan-2020 to 31-Mar-2022.

Figure 2.
Global SARS case numbers and gold prices change from 1-Nov-2002 to 5-Jul-2003.

Figure 3.
Global COVID-19 case number and USD index change from 1-Jan-2020 to 31-Mar-2021.

Figure 4.
Global SARS case numbers and USD index change from 1 November 2002 to 5 July 2003.

Figure 5.
Global COVID case numbers and bitcoin price change from 1-Jan-2020 to 31-Mar-2022.


Table 1.
Weight ratio from USD index vs. actual % of different currency trade excluding USD.
| Currency | Weight Ratio from USD Index | World Currency Trade (%) * | Calculation for Actual % of Different Currency Trade Excluding USD | Over- or Under- Representation (+/−) in USD Index |
|---|---|---|---|---|
| US Dollars (USD) | N/A | 44.15% | N/A | N/A |
| Euro | 57.6% | 16.14% | 28.7% | |
| Japanese Yen | 13.6% | 8.4% | −1.44% | |
| Pound Sterling | 11.9% | 6.4% | 0.44% | |
| Australian Dollars (AUD) | ~0% | 3.38% | −6.05% | |
| Canadian Dollar | 9.1% | 2.52% | 4.59% | |
| Swedish Krona | 4.2% | 1.11% | 2.21% | |
| Swiss Franc | 3.6% | 4.44% | −0.84% | |
| Chinese Renminbi | ~0% | 2.16% | −3.87% | |
| Hong Kong Dollar | ~0% | 1.77% | −3.17% |
Note *: (Hall-Smith 2020).
Table 2.
p-Value for ADF test for unit roots (at 5% significance level) on COVID-19 case numbers and gold price) (Gautam et al. 2022).
Table 2.
p-Value for ADF test for unit roots (at 5% significance level) on COVID-19 case numbers and gold price) (Gautam et al. 2022).
| COVID-19 Case Numbers | Gold Price (USD) | |||
|---|---|---|---|---|
| Lag (Days) | p Value | Decision | p Value | Decision |
| 0 | 0.1975 | Non-stationary | 0.7715 | Non-stationary |
| 1 | 0.1720 | Non-stationary | 0.8025 | Non-stationary |
| 2 | 0.6608 | Non-stationary | 0.8040 | Non-stationary |
| 3 | 0.9757 | Non-stationary | 0.8003 | Non-stationary |
| 4 | 0.9973 | Non-stationary | 0.8247 | Non-stationary |
| 5 | 0.9353 | Non-stationary | 0.8409 | Non-stationary |
| 6 | 0.8734 | Non-stationary | 0.8304 | Non-stationary |
Table 3.
p-Value for ADF test for unit roots (at 5% significance level) on SARS case numbers, USD index and bitcoin price).
Table 3.
p-Value for ADF test for unit roots (at 5% significance level) on SARS case numbers, USD index and bitcoin price).
| SARS Case Numbers | USD Index | Bitcoin Price (USD) | ||||
|---|---|---|---|---|---|---|
| Lag (Days) | p Value | Decision | p Value | Decision | p Value | Decision |
| 0 | 0.1975 | Non-stationary | 0.7715 | Non-stationary | 0.4314 | Non-stationary |
| 1 | 0.1720 | Non-stationary | 0.8025 | Non-stationary | 0.4433 | Non-stationary |
| 2 | 0.6608 | Non-stationary | 0.8040 | Non-stationary | 0.4419 | Non-stationary |
| 3 | 0.9757 | Non-stationary | 0.8003 | Non-stationary | 0.4347 | Non-stationary |
| 4 | 0.9973 | Non-stationary | 0.8247 | Non-stationary | 0.4193 | Non-stationary |
| 5 | 0.9353 | Non-stationary | 0.8409 | Non-stationary | 0.4137 | Non-stationary |
| 6 | 0.8734 | Non-stationary | 0.8304 | Non-stationary | 0.4026 | Non-stationary |
Table 4.
Granger causality results—COVID-19 case numbers vs. gold price (USD), USD index and bitcoin price (USD) (at 5% significance level).
Table 4.
Granger causality results—COVID-19 case numbers vs. gold price (USD), USD index and bitcoin price (USD) (at 5% significance level).
| COVID-19 → Gold | COVID-19 → USD Index | COVID-19 → Bitcoin | |
|---|---|---|---|
| Outcome | h = 1 | h = 1 | h = 0 |
| p value | 0.027 | 1.2095 × 10⁻¹⁰ | 0.801 |
Table 5.
Granger causality results—SARS case numbers vs. gold price (USD) and USD index (at 5% significance level).
Table 5.
Granger causality results—SARS case numbers vs. gold price (USD) and USD index (at 5% significance level).
| For SARS → GOLD | For SARS → USD | |
|---|---|---|
| Outcome | h = 1 | h = 1 |
| p value | 0.0252 | 0.007 |
Table 6.
Johansen co-integration and VECM results for COVID-19 cases number vs. gold price, USD index and bitcoin price.
Table 6.
Johansen co-integration and VECM results for COVID-19 cases number vs. gold price, USD index and bitcoin price.
| COVID-19 → Gold | COVID-19 → USD Index | COVID-19 → Bitcoin | |
|---|---|---|---|
| Outcome | h = 1 | h = 1 | h = 1 |
| p value | 0.031 | 0.0292 | 0.001 |
| Beta | [1, −0.0166] | [1, −1.9004 × 10⁻⁷] | [1, −1.9] |
Table 7.
Johansen co-integration and VECM results for SARS cases number vs. gold price and USD index.
Table 7.
Johansen co-integration and VECM results for SARS cases number vs. gold price and USD index.
| SARS → Gold Price | SARS → USD | |
|---|---|---|
| Outcome | h = 1 | h = 1 |
| p value | 0.023 | 0.035 |
| Beta | [1, −0.0173] | [1, −0.0328] |
Disclaimer/Publisher’s Note: The statements, opinions and data contained in all publications are solely those of the individual author(s) and contributor(s) and not of MDPI and/or the editor(s). MDPI and/or the editor(s) disclaim responsibility for any injury to people or property resulting from any ideas, methods, instructions or products referred to in the content. |
© 2024 by the authors. Licensee MDPI, Basel, Switzerland. This article is an open access article distributed under the terms and conditions of the Creative Commons Attribution (CC BY) license (https://creativecommons.org/licenses/by/4.0/).
Share and Cite
MDPI and ACS Style
Kim, Y.; Topal, E.; Ghosh, A.K.; Asad, M.W.A. Investor Behavior in Gold, US Dollars and Cryptocurrency during Global Pandemics. Economies 2024, 12, 64. https://0-doi-org.brum.beds.ac.uk/10.3390/economies12030064
AMA Style
Kim Y, Topal E, Ghosh AK, Asad MWA. Investor Behavior in Gold, US Dollars and Cryptocurrency during Global Pandemics. Economies. 2024; 12(3):64. https://0-doi-org.brum.beds.ac.uk/10.3390/economies12030064
Chicago/Turabian StyleKim, Yoochan, Erkan Topal, Apurna Kumar Ghosh, and Mohammad Waqar Ali Asad. 2024. "Investor Behavior in Gold, US Dollars and Cryptocurrency during Global Pandemics" Economies 12, no. 3: 64. https://0-doi-org.brum.beds.ac.uk/10.3390/economies12030064
Note that from the first issue of 2016, this journal uses article numbers instead of page numbers. See further details here.