
The Dual Pillars of Progress: Institutional and Cultural Dynamics in Economic Development


Department of Economics, National and Kapodistrian University of Athens, Sofokleous 1 Street, Office 616, 10559 Athens, Greece
Economies 2024, 12(4), 76; https://0-doi-org.brum.beds.ac.uk/10.3390/economies12040076
Submission received: 17 December 2023
/
Revised: 21 March 2024
/
Accepted: 24 March 2024
/
Published: 27 March 2024
(This article belongs to the Special Issue Beyond the Economic Horizon: Delving into the Deep Roots of Economic Development)
Abstract
:This study examines the critical interplay between institutional and cultural backgrounds and their collective impact on economic development, suggesting that their synchronized evolution—timing, pace, and direction—boosts economic development, while misalignment hinders it. It seeks to determine if these backgrounds complement or substitute each other in fostering economic development. The analysis employs an unbalanced panel dataset encompassing 113 countries across four decades (1980–2019) through a fixed-effects model enhanced by robustness checks (adding control variables, using alternative analysis methods, and applying adjustment criteria). The analysis uncovers a synergistic relationship between institutional and cultural backgrounds in which each element reinforces the other’s impact on economic development. Countries with robust institutional and cultural backgrounds exhibit the highest levels of economic development, whereas those with weaker backgrounds experience diminished economic progress. This study further reveals that the influence of institutional background on economic development is more pronounced than that of cultural background. However, this effect is significantly amplified when both institutional and cultural backgrounds are considered. Considering these insights, this study recommends that effective development strategies prioritize simultaneously nurturing institutional and cultural backgrounds. This approach is essential for crafting a successful and comprehensive development roadmap.
1. Introduction
In this study, “cultural background” is a complex and multifaceted concept encompassing society’s predominant values, beliefs, norms, and practices. These cultural elements are not static; they evolve and are shaped by historical, social, and economic factors. Cultural background significantly influences individual and collective behaviors, decision-making processes, and economic interactions. Through these lenses, the current study examines its pivotal role in molding economic outcomes and the development and functioning of economic institutions. By understanding cultural background in this broader context, we can better appreciate its dynamic interaction with economic variables, as evidenced by the findings of Gaganis et al. (2019) and Bakas et al. (2020) regarding economic outcomes and the insights of Frederking (2002) and Xiu et al. (2023) on economic institutions. Conversely, institutions are the laws and social structures that govern individuals, societies, and economies (Bowles 2004; Borovic and Radicic 2023). Incentives provided by institutions influence economic outcomes and investment decisions, thereby affecting economic output (North and Weingast 1989; Hall and Jones 1999; Correa da Cunha et al. 2022; Le Clech and Guevara-Pérez 2023).
However, the relationship between cultural background and institutions is more fluid, and institutions also reciprocally influence cultural background (Knight 1992; Basu 2021). The distribution of resources and institutional frameworks can create disparities in the dominance of certain cultural norms. Additionally, industrialization and post-industrialization processes can shape societal values (Inglehart 1990, 1998; Kafka and Kostis 2021).
Cultural backgrounds and institutions interact and evolve together with mutual feedback. The same institutions may function differently in distinct cultural contexts, while cultural backgrounds can adapt and change in response to an institutional environment (Alesina and Giuliano 2015). This dynamic interplay between cultural backgrounds and institutions plays a pivotal role in organizing real-world institutions and influencing the motivations of economic and political actors (Tabellini 2010).
The compatibility between the evolution of institutions and cultural background has far-reaching implications for economies. This intricate issue encompasses the dimension of time and the qualitative nature of the changes involved, leading to imbalances and inefficiencies within the operating system as its components evolve at varying rates.
A lack of compatibility can manifest in two ways. Firstly, institutions may change while the cultural background remains stagnant, or conversely, cultural attitudes may transform while institutions fail to adapt in tandem. Moreover, even when institutions and cultural attitudes evolve, their combined state may need to reach an optimal and harmonious equilibrium. An even more problematic scenario arises when institutional changes are met with cultural attitudes that oppose and undermine them and vice versa. This situation occurs when institutional reforms aimed at promoting economic development and growth in the short or medium term are hindered and rendered ineffective by deeply ingrained cultural attitudes.
Societal progress through institutional changes hinges on how well a culture’s traits align with economic development requirements. Cultures open to adaptation and innovation foster environments conducive to development. At the same time, those marked by risk aversion, limited entrepreneurship, minimal research investment, suppressed individualism, and low trust often resist change, affecting their economic potential. Weber’s ([1930] 1996) seminal exploration of the Protestant ethic and the spirit of capitalism offers a foundational perspective on how cultural values can drive economic development. Extending this framework, Bourdieu (1986) introduces the concept of cultural capital, which includes knowledge, skills, education, and other cultural assets that influence individuals’ ability to navigate and succeed within various social and economic contexts. This notion of cultural capital is pivotal in understanding how cultural values and norms shape economic behavior and opportunities. Hopp and Stephan (2012) further highlight the critical role of socio-cultural environments in affecting the performance and success of nascent entrepreneurs, underlining the impact of community culture and individual motivation. Huggins and Thompson (2014) delve into a spatial analysis of culture and entrepreneurship, evidencing that regions with strong cultural support for innovation and risk-taking exhibit uneven, yet often more vigorous, economic development. Moreover, Patuelli et al. (2020) shed light on the influence of familial and community networks on entrepreneurial intentions among high school students, showcasing the significant effect of cultural norms and values in molding economic aspirations and capabilities.
The primary objective of this study is to elucidate the interconnectedness between institutional and cultural backgrounds and its consequential effects on economic development. The central inquiry revolves around whether these two dimensions of society and economy, namely institutional and cultural backgrounds, function in a complementary or substitutive manner regarding their role in economic development. Consequently, the aim is to contribute to the ongoing debate surrounding the co-evolution of these factors. To achieve this objective, this study investigates the independent and combined impacts of institutional and cultural backdrops on the GDP per capita of a sample comprising 113 countries over four decades (1981–2019).
This study builds on the premise that while the independent roles of institutions and culture in economic development have been extensively examined, their combined effects—especially through the lens of coevolution and synchronization—have not been thoroughly explored within the current economic literature. This oversight represents a significant gap as the dynamic interplay between cultural values and institutional frameworks may be critical in devising more nuanced and effective development strategies. This research delves into how these dimensions complemented or substituted each other in fostering economic development over the last four decades, introducing a new perspective to the discourse. This analysis does not merely reaffirm the significance of institutions and culture to economic development; rather, it investigates the less-explored dynamic interplay between them, arguing that their alignment or misalignment plays a crucial role in shaping economic paths. Consequently, this study contributes a new layer of understanding to the debate, offering insights into how the co-evolution of institutional and cultural backgrounds can inform the development of comprehensive, culturally aware, and institutionally aware development policies. This approach aims to bridge a critical gap in understanding the mechanisms driving economic development.
This study is structured as follows: in Section 2, a literature review is carried out on the interconnection of cultural and institutional backgrounds, and the issue of their co-evolution is also presented. Section 3 describes the data and methodology used in the empirical analysis, and Section 4 presents this study’s empirical results. Finally, Section 5 presents this paper’s discussion, conclusions, and policy implications.
2. Literature Review on the Interplay between Cultural and Institutional Backgrounds
2.1. Formal and Informal Institutions and Economic Development
The relationship between cultural backgrounds and institutions is a complex and multifaceted topic that has captivated scholars from various disciplines. This extensive body of research delves into how cultural norms (informal institutions) and institutional frameworks (formal institutions) collectively shape economic development and societal evolution, revealing a nuanced and intricate interplay.
Thorstein Veblen’s pioneering work (Veblen 1898) introduced the concept of “habits of thought”, emphasizing the adaptability and persistence of cultural tendencies in shaping economic behavior. Veblen’s perspective, linking economic development to the co-evolution of culture and institutions, marked a significant departure from his time’s dominant neoclassical economic theory. This approach, initially sidelined, has regained prominence and relevance in contemporary economic discourse. Genes and institutions are seen as norms and culturally transmitted rules that shape individuals’ behaviors during social interactions (Antrup 2013).
Max Weber’s seminal work (Weber [1930] 1996) explored the relationship between religious ethics, particularly Protestantism, and the development of capitalist economies. Weber’s analysis provided a foundational understanding of how cultural values can profoundly influence economic systems, setting a precedent for considering the broader implications of cultural factors in economic development.
David McClelland’s (1961) work on achievement motive theory further contributed to this field by linking psychological factors, such as the need for achievement, with economic development. McClelland argued that certain cultural traits play a crucial role in the economic development of a society.
Although Veblen builds a framework for examining the interplay between institutions and culture, their significant roles as deeper sources of economic development and growth (Spolaore and Wacziarg 2013) were eliminated for many decades due to the dominance of the mathematicized neoclassical economic theory. Some decades ago, both notions started gaining the prestige they were worth again, given that several works started quantifying both concepts. Numerous studies have provided empirical evidence by quantifying the impact of cultural background on economic development and growth (Hofstede 1980; House et al. 2004).
2.2. The Co-Evolution of Culture and Institutions and Economic Development
Thus, more recently, the co-evolution of cultural background and institutions has garnered significant attention in the relevant literature (Boyd and Richerson 2002; Bowles et al. 2003; Bowles 2006; Choi and Bowles 2007; Gintis 2007). Researchers have explored the intricate interplay between culture and institutions, investigating their co-evolution and shedding light on how specific institutions and behaviors confer competitive advantages to the individuals or populations within their respective environments (Lewis and Steinmo 2012).
Bowles’s influential contributions to co-evolution have been well-documented (Bowles 2004; Bowles and Gintis 2000; Choi and Bowles 2007). His works emphasize the substantial role played by economic institutions in shaping individuals’ behaviors. Different institutional contexts induce individuals to draw from their repertoire of behaviors, prompting diverse behavior patterns (Bowles 1998). Bowles also elucidated how social interaction structures contribute to cultural evolution and how economic policies influence personal preferences, reinforcing co-evolution dynamics as described in Bowles (2000). Bowles et al. (2003) further demonstrated that the rise of particular institutions is often linked to the characteristics of the groups they benefit, thus sustaining the co-evolutionary cycle.
In her exploration of the relationship between formal institutions and informal institutions (cultural background) and their impact on economic development, Williamson (2009) employs distinct approaches (Glaeser et al. 2004; Tabellini 2010). By utilizing the political institutions framework developed by Glaeser et al. (2004), she constructs an index to measure formal institutions. To assess informal institutions, she draws upon Tabellini’s work (Williamson 2009). Williamson’s findings challenge prevailing assumptions by highlighting the predominant influence of strong informal institutions on economic growth, independent of the strength of formal institutions. Moreover, she observes that the interaction between formal and informal institutions can be variable, manifesting as complements or substitutes depending on specific contextual factors (Williamson 2009).
In a study conducted by Williamson and Mathers (2011), the relationship between cultural background, economic institutions, and economic growth was examined. Analyzing data from 128 countries between 1981 and 2007, they found that cultural background and economic institutions independently contribute to economic growth. However, the strong association between cultural background and development weakens when considering the simultaneous effects of cultural background and institutions. In contrast, institutions maintain a positive and significant relationship with economic growth. This suggests that cultural background and institutions act as substitutes, contradicting Williamson’s (2009) conclusions.
Mathers and Williamson (2011) further explored the interaction between cultural background and institutions on economic well-being. Using data from 74 countries spanning 1980 to 2004, they discovered that economic freedom, represented by institutions, positively impacts economic growth. Additionally, incorporating cultural background into the analysis partially explained the diverse economic outcomes resulting from similar institutions. Cultural background amplified the effect of economic freedom on growth by around ten percentage points, demonstrating its complementary and enhancing role in economic outcomes.
Greif and Tabellini (2017) analyzed the interplay between institutions and cultural backgrounds in shaping economic activity, using social organizations and groups as the fundamental units of cooperation. The moral commitment of group members within social organizations reduced enforcement costs and facilitated collective actions, influencing institutional development. This created positive feedback loops between ethics, institutions, and the implied cooperation mode.
Furthermore, Bisin and Verdier (2015) examined cultural backgrounds and institutions’ simultaneous evolution and interaction. They introduced the concept of the cultural (or institutional) multiplier, which measured the overall impact of changes in institutions or culture on economic welfare relative to the direct effect. This approach sheds light on whether cultural background and institutions co-evolve or undergo asynchronous changes.
More recently, Travkina et al. (2023) explored the significant role of culture in shaping the quality of institutions and its subsequent impact on economic and financial development. The authors argued that cultural factors, including historical heritage, societal values, and behavioral attitudes, are key drivers of institutional change, influencing macroeconomic dynamics and financial market development. The study highlights the interdependence between high-quality institutions and positive economic outcomes, particularly in emerging economies. It emphasizes the need for modernizing institutional frameworks to foster sustainable economic growth, using Russia as a case study to illustrate the challenges and potential solutions in aligning cultural attitudes with economic development goals.
The relationship between cultural background and institutions raises a significant inquiry regarding how cultural background evolves with institutions. It is imperative for institutions, being human constructs, to align with the cultural background of individuals to fulfill their intended purposes. Failure to do so gives rise to controversies and undermines the efficacy of institutions. In essence, institutions should be responsive to the needs of society members and act as catalysts for economic growth (Acemoglu and Robinson 2012). Societies are in a perpetual state in which historical influences shape individual preferences and the overall trajectory of institutions.
In most cases, the evolution of culture and institutions occurs asynchronously. Social interaction structures have been observed to expedite the development of preferences (Bowles 2009). Additionally, the speed at which institutions and cultural backgrounds change necessitates the consideration of co-evolution. Formal or informal institutions can be fast-changing or slow-changing (Johnston 1996; De Jong 2009; Schwarz 2009; Kostis et al. 2018; Kafka and Kostis 2021). Consequently, inquiries arise regarding the co-evolution or independent evolution of cultural background and institutions and the causal directionality of their evolution. Complementarity in the evolutionary dynamics of cultural background and institutions is critical for successful reforms in both domains. When abrupt institutional changes disrupt co-evolution, the efficiency of the economic system becomes contingent.
3. Materials and Methods
3.1. Empirical Strategy
This study explores how cultural and institutional backgrounds complement or substitute each other, primarily by correlating these variables with GDP per capita. The investigation begins by individually assessing the impact of each variable on GDP per capita before delving into their combined influence on this economic indicator.
The methodology of this study is informed by previous research (Inglehart 1988; Tabellini 2010; Bützer et al. 2013; Kostis et al. 2018; Kafka et al. 2020) and draws upon a diverse array of cultural values, including generalized trust, control over life, independence, honesty, competition affinity, work ethic, and respect1. These values were selected because they represent a comprehensive framework for assessing cultural influences on economic outcomes, as evidenced by their recurring significance in scholarly research. This selection is further supported by their availability and reliable measurement through the World Values Survey (WVS) and the European Values Study (EVS), ensuring a robust empirical basis for our analysis. The selection of cultural values focused on those with a well-documented impact on economic development and which were measurable across studied economies. Appendix A’s Table A1 details the measurement questions. The WVS and EVS provide a comprehensive and reliable dataset of cultural values through a standardized questionnaire, enabling consistent cross-national comparisons.
This study’s methodology involves a multifaceted estimation equation (Equation (1)) to analyze the relationships between cultural and institutional backgrounds and GDP per capita. This equation is pivotal in determining (a) the individual effects of cultural and institutional backgrounds on GDP per capita, (b) the combined impact of these variables, (c) the influence of the product of these two variables, and (d) the effect of their quotient on GDP per capita. The product of cultural and institutional variables is particularly significant, indicating their complementarity. A higher product between culture and institutions indicates strong complementarity; a lower product suggests weaker complementarity. Intermediate product values point to either strong institutions with weak culture or vice versa. Analyzing the culture-to-institutions quotient provides deeper insight into their combined effect on GDP, moving beyond simple additive models to explore how their interaction influences economic paths. A higher quotient may signal greater cultural impact on economic outcomes, while a lower quotient indicates stronger institutional influence. This inclusion aims to reveal the joint effects of culture and institutions on economic growth, challenging the idea of their independent or additive roles and highlighting the importance of their interaction.
GDP per capitait = αi + β1 × Cultureit + β2 × Institutionsit + γ × Χit + δ × Υit + ε × Ζit + λt + uit
The analysis encompasses up to 113 economies, denoted as “i”, and spans seven waves of the WVS, indicated as “t”. The primary dependent variable in this analysis is the logarithm of GDP per capita, serving as an indicator of economic development.
The key independent variables in this study are “Culture” and “Institutions”, representing the cultural and institutional backgrounds of the societies, respectively. Additionally, two derived variables are introduced: “X”, the product of the “Culture” and “Institutions” variables, and “Y”, their quotient. These variables explore the interplay and combined effects of cultural and institutional factors on economic development. The analysis also includes “Z”, a vector of control variables, to account for other influential factors.
Kafka et al. (2020) further delve into the interplay between cultural and institutional backgrounds and their impact on GDP per capita. They employ a scatter plot divided into four quadrants to categorize countries based on their cultural and institutional strengths. Quadrant A includes countries with strong institutional but weak cultural backgrounds, B encompasses countries strong in both aspects, C represents countries weak in both, and D includes those with strong cultural but weak institutional backgrounds. This study calculates the average values for each country’s cultural background, institutional background, and GDP per capita over the entire analysis period. Following Williamson’s (2009) methodology, countries are classified as having a strong cultural or institutional background if they score above seven and as weak if they score below five. The current analysis, drawing upon the theoretical framework established by Kafka et al. (2020), investigates the relationship between cultural and institutional backgrounds and their impact on GDP per capita.
3.2. Data
The GDP per capita data, adjusted for Purchasing Power Parity and based on 2011 international dollars, was sourced from the IMF’s World Economic Outlook database. These data were then averaged over several periods from 1981 to 2019 for analytical consistency, and logarithmic transformations were applied in all calculations.
Choosing GDP per capita as the dependent variable reflects its role as a key indicator of economic development, enabling a direct comparison across economies. It suits the study’s focus on the immediate effects of culture and institutions on economic well-being despite not covering all development aspects. Its broad acceptance and relevance justify its use in evaluating cultural and institutional impacts, ensuring the methodology’s clarity and suitability for our research goals.
The analysis was structured into seven distinct waves, a format necessitated by the periodic availability of cultural background data. These waves are primarily from the WVS for 1981–1984, 1990–1994, 1995–1998, 1999–2004, 2005–2009, and 2010–2014. For the most recent wave spanning 2017–2019, this study incorporated data from the EVS. Additionally, to enhance the comprehensiveness of the dataset, EVS data from the years 1981, 1990, 1999, and 2008 were integrated into the analysis to complement the WVS data.
To quantify cultural background, this study employed a Principal Component Analysis (PCA)2, following standard procedures for dimensionality reduction. The first principal component was selected as a composite measure of cultural values, justified by its ability to capture the largest variance among the variables considered. This decision was grounded in the principal component’s efficacy in representing a broad spectrum of cultural dimensions, making it a comprehensive measure of cultural background. The selection criteria for retaining components included eigenvalues greater than 1.3 and a cumulative percentage of variance explained threshold, ensuring that retained components offer significant explanatory power. This measure encapsulated generalized trust, control of life, independence, honesty, competition affinity, work ethic, and respect.
Separate PCAs were conducted for dimensions such as honesty, competition affinity, and work ethic based on the theoretical and empirical expectation that these dimensions may exhibit distinct patterns and impacts within the broader cultural framework. The rationale behind this approach stems from the complexity of these dimensions, each represented by responses to multiple survey questions in the WVS and EVS datasets. Recognizing that a single question cannot adequately encapsulate the breadth of these cultural attributes, a PCA was employed to aggregate the responses from these multiple questions into singular, coherent indicators for each dimension. This methodological choice allows for a nuanced representation of honesty, competition affinity, and work ethic, reflecting the composite nature of these cultural values and ensuring their accurate measurement and inclusion in the analysis. Conversely, the cultural dimensions of trust, control of life, independence, and respect were derived from individual questions within the WVS and EVS. Given their derivation from single survey items, these dimensions were directly included in the analysis without the need for a PCA. This straightforward inclusion reflects the methodological consideration that each of these dimensions, while complex, can be effectively captured by a single, well-defined survey question.
The principal component score for the overall cultural background measurement was normalized to a 0 to 10 scale to facilitate its direct comparison with institutional backgrounds. This normalization process involved applying the min–max normalization technique, which rescales data to fit within a target range. This approach, aligned with Williamson and Mathers (2011), ensured that the composite measure of cultural background was directly comparable across different contexts, enhancing the interpretability of the findings of the current study.
This research also incorporates the Economic Freedom of the World Index, as Gwartney et al. (2019) detailed, to represent the institutional background. This index, developed by the Fraser Institute, rates countries on a scale from 0 to 10, with 10 indicating the highest level of economic freedom. The index evaluates economic freedom based on five critical aspects: the size of government, legal structure and property rights, access to sound money, freedom to trade internationally, and the regulation of credit, labor, and business.
The choice of this index was guided by its comprehensive coverage and its established reliability in quantifying economic institutions, as supported by its widespread adoption in the economic literature (Gwartney et al. 2019; Hall and Lawson 2014; Gwartney et al. 2004; Lothian 2006; Williamson and Mathers 2011; Mathers and Williamson 2011). The Economic Freedom of the World Index is favored since it evaluates economic freedom based on five critical aspects, providing a multifaceted view of economic institutions. Moreover, previous studies have consistently highlighted a positive correlation between economic freedom and economic development, underscoring the relevance of this index in assessing institutional impacts on economic outcomes. This consistency is crucial for comparative analyses and for building upon existing research findings.
Previous studies, including those by Hall and Lawson (2014), have highlighted the positive correlation between economic freedom and economic development. This index has been widely used in the economic literature as a measure of economic institutions, as evidenced in works by Gwartney et al. (2004), Lothian (2006), Williamson and Mathers (2011), and Mathers and Williamson (2011).
Table 1 presents descriptive statistics for the variables included in the analysis.
3.3. Estimation Strategy and Economic Issues
The estimation process in this analysis utilizes a fixed-effects (FE) analysis, allowing for the consideration of economy-specific heterogeneity through distinct fixed terms for each economy. Thus, in Equation (1), this model includes αi, a fixed term for each economy, which addresses country-specific fixed effects and accounts for unobserved and time-invariant heterogeneity across countries. Additionally, λt, a set of dummy variables for each WVS wave, controls wave-specific effects that are common across countries. Thus, to further refine the analysis, time dummies are incorporated for each wave, including time effects common to all countries in the sample. This approach is compatible with the standard Ordinary Least Squares (OLS) method. Moreover, country-specific clustered robust estimates of standard error estimates are calculated to ensure robustness and accuracy. This step is crucial for addressing potential issues of correlation and heteroskedasticity within each economy. The FE model is the primary method used to provide a clear and interpretable foundation for the analysis. This approach allows for a straightforward assessment of cultural and institutional impacts on economic development, adjusting for unobserved country and time effects.
This study employs a comprehensive robustness analysis to validate its findings, involving several key strategies: (a) the inclusion of control variables—this step involves integrating a variety of control variables into the analysis. The objective is to observe if and how the inclusion of these variables impacts the established relationship between cultural and institutional backgrounds and economic development. By varying the combinations of control variables, this study assesses the stability and consistency of the initial findings. (b) The utilization of an alternative estimation method—beyond fixed-effects estimations, this study also applies the Generalized Method of Moments (GMM) estimator proposed by Arellano and Bond (1991). This method is particularly advantageous in addressing issues of endogeneity and unobserved heterogeneity. The GMM estimator is known for enhancing the efficiency of results, especially under persistence conditions, such as autocorrelation and individual effects over time, as discussed by Alonso-Borrego and Arellano (1996). The decision to present GMM results as a robustness check stems from the method’s complexity and a desire to ensure the primary findings are accessible and grounded in a widely understood methodology. The GMM analysis validates the robustness of the FE results, reinforcing this study’s conclusions. The GMM approach tackles autocorrelation by employing time-lagged variables as internal instruments. These instruments are crucial for handling the endogeneity between explanatory variables and the correlation between the error term and the time-lagged dependent variable. The effectiveness of the GMM method is further scrutinized through two specific tests: (b1) The Hansen J Test—developed by Hansen and Singleton (1982), this test evaluates orthogonality between instruments and residuals. It is used to verify the validity of the instruments in a regression by comparing estimated moments with sample moments. This test is particularly relevant in the presence of heteroscedasticity or autocorrelation. (b2) The Arellano and Bond Test—this test, formulated by Arellano and Bond in 1991, checks for first- and second-order serial correlations. It is used to test a hypothesis of no autocorrelation between residuals. (c) An adjustment of categorization criteria—this study revises criteria used in a previous study by Kafka et al. (2020) to classify countries into various quadrants based on their cultural and institutional backgrounds. In this revised approach, countries with a score above seven are categorized as having a strong cultural or institutional background. Conversely, those with a score below six are considered to have a weak cultural or institutional background. This adjustment allows for the inclusion of a broader range of countries in the analysis, potentially offering a more nuanced understanding of the relationship between cultural and institutional factors and economic development.
In examining the impact of cultural and institutional backgrounds on macroeconomic outcomes, this study incorporates a comprehensive set of control variables, referred to as the Z vector. This inclusion is informed by a range of previous studies that explored the influence of these backgrounds on economic indicators. (a) The previous year’s real GDP per capita: Following the approach of Knack and Keefer (1997) and Roth (2009), the logarithm of the previous year’s real GDP per capita is included as a control variable. This metric serves as an indicator of the broader economic conditions within each economy. (b) Investment levels and foreign direct investments (FDIs): This study considers the level of investments as a percentage of GDP and the net inflow of FDIs (measured in US dollars). This inclusion is based on the established relationship in the literature, as noted by Levine and Renelt (1992), between natural capital and economic development and growth. Additionally, research by Dawson (1998), Bengoa and Sanchez-Robles (2003), and Gwartney et al. (2004) highlights the direct and indirect effects of economic freedom on economic growth through investment growth and productivity enhancements. (c) Higher education enrollment: The percentage of gross higher education enrollment is used as a measure of human capital, drawing on insights from studies by Knack and Keefer (1997), Roth (2009), and Tabellini (2010). (d) As discussed in Yegorov (2015), population density is included to gauge broader living conditions in the societies under study. These variables provide a more nuanced understanding of the socio-economic environment.
The source for these control variables is the World Bank database, ensuring the reliability and consistency of the data used in the analysis. By incorporating these diverse control variables, this study aims to provide a more comprehensive and accurate assessment of the relationships between cultural and institutional backgrounds and macroeconomic outcomes.
This study has not employed lagged regressors in the primary analysis, a decision grounded in several key considerations. Firstly, the analysis focuses on the contemporaneous impact of cultural and institutional variables on economic development, as measured by GDP per capita. This approach is driven by the theoretical premise that cultural norms and institutional quality exert immediate influences on a country’s economic conditions, allowing for the direct observation of these effects within the same time frame. Secondly, the theoretical framework of this research posits that the dynamics between culture, institutions, and economic development are complex and can be effectively captured through a contemporaneous analysis. This perspective is aligned with the hypothesis that the relationships between these variables are not merely sequential but are also characterized by simultaneous interactions that are crucial for understanding their impact on economic outcomes. Furthermore, incorporating lagged regressors would introduce additional complexity, particularly in identifying appropriate lag structures and navigating potential data limitations. Given this study’s broad cross-sectional nature and the variability in data availability across different countries and periods, a contemporaneous approach ensures a consistent and robust analysis within the existing data constraints. Lastly, it is important to note that this study’s methodological framework, including the Arellano–Bond approach for robustness checks, complements the primary analysis by offering insights into potential temporal dynamics without necessitating the lagging of regressors. This decision is carefully considered to maintain the clarity and focus of the analysis, ensuring that the exploration of cultural and institutional impacts on economic development is methodologically sound and aligned with the study’s theoretical underpinnings.
4. Empirical Results
To derive the variables for honesty, competition affinity, and work ethic, the analysis employed a PCA, focusing on identifying and extracting the first principal component for each dimension.
For the honesty cultural dimension, the PCA revealed that the initial principal component held an eigenvalue of 1.751, accounting for 87.60% of the total variance. This significant proportion indicates that the two underlying sub-variables effectively contribute to and define the concept of honesty.
Similarly, in the case of competition affinity, the foremost principal component emerged with an eigenvalue of 1.263, explaining 63.16% of the total variance. This finding suggests that the sub-variables combine positively to construct the overall idea of competition affinity.
In the analysis of the work ethic variable using a PCA, the leading component displayed an eigenvalue of 1.068, elucidating 53.14% of the variance. This result indicates that the various sub-variables constructively contribute to the formation of the work ethic variable.
Continuing this analysis, Table 2 delineates the PCA results for the cultural background variable. This variable consolidates elements from several dimensions: trust, control of life, independence, honesty, competition affinity, work ethic, and respect. The PCA identified the dominant principal component for cultural background, which possesses an eigenvalue of 2.463, explaining 35.20% of the variance. Subsequent components, with lower eigenvalues and variance contributions, are deemed less significant in this context.
As it is formed by this principal component, the cultural background variable is positively influenced by trust, respect, and independence. Conversely, it shows a negative influence from competition affinity and work ethic. The elements of control of life and honesty have a minimal impact on this principal component. Therefore, the character of this principal component seems more inclined toward cultural values that prioritize trust, respect, and independence, diverging from values centered around competition and a robust work ethic. This pattern suggests that the principal component may represent a cultural dimension contrasting collective or competitive values against those valuing individualism and mutual trust.
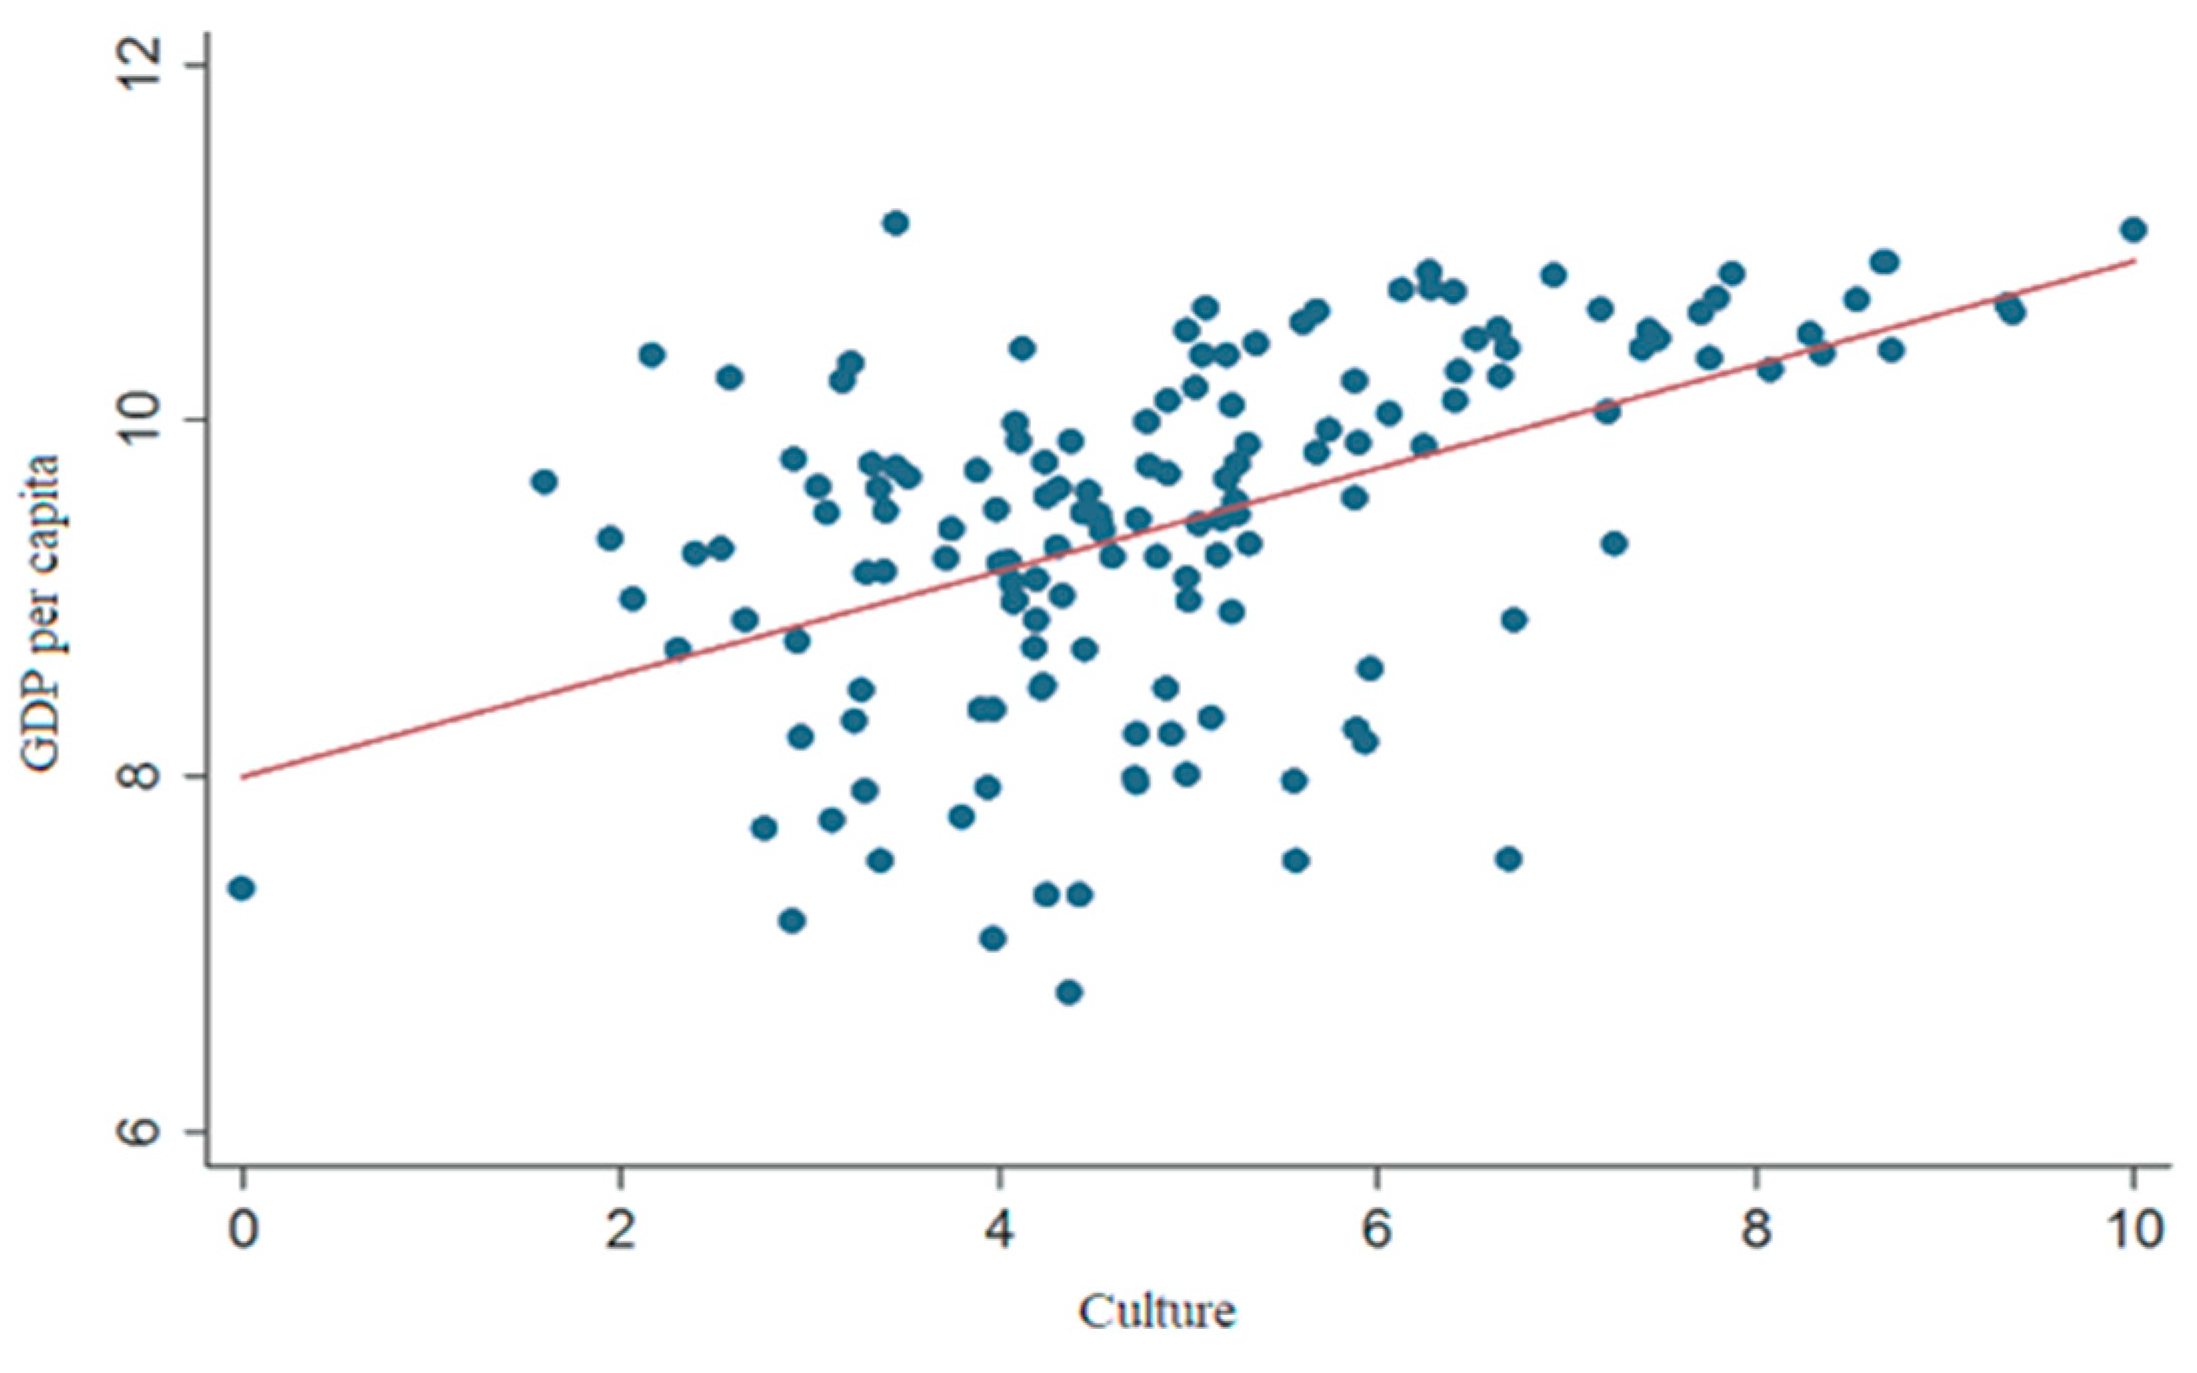
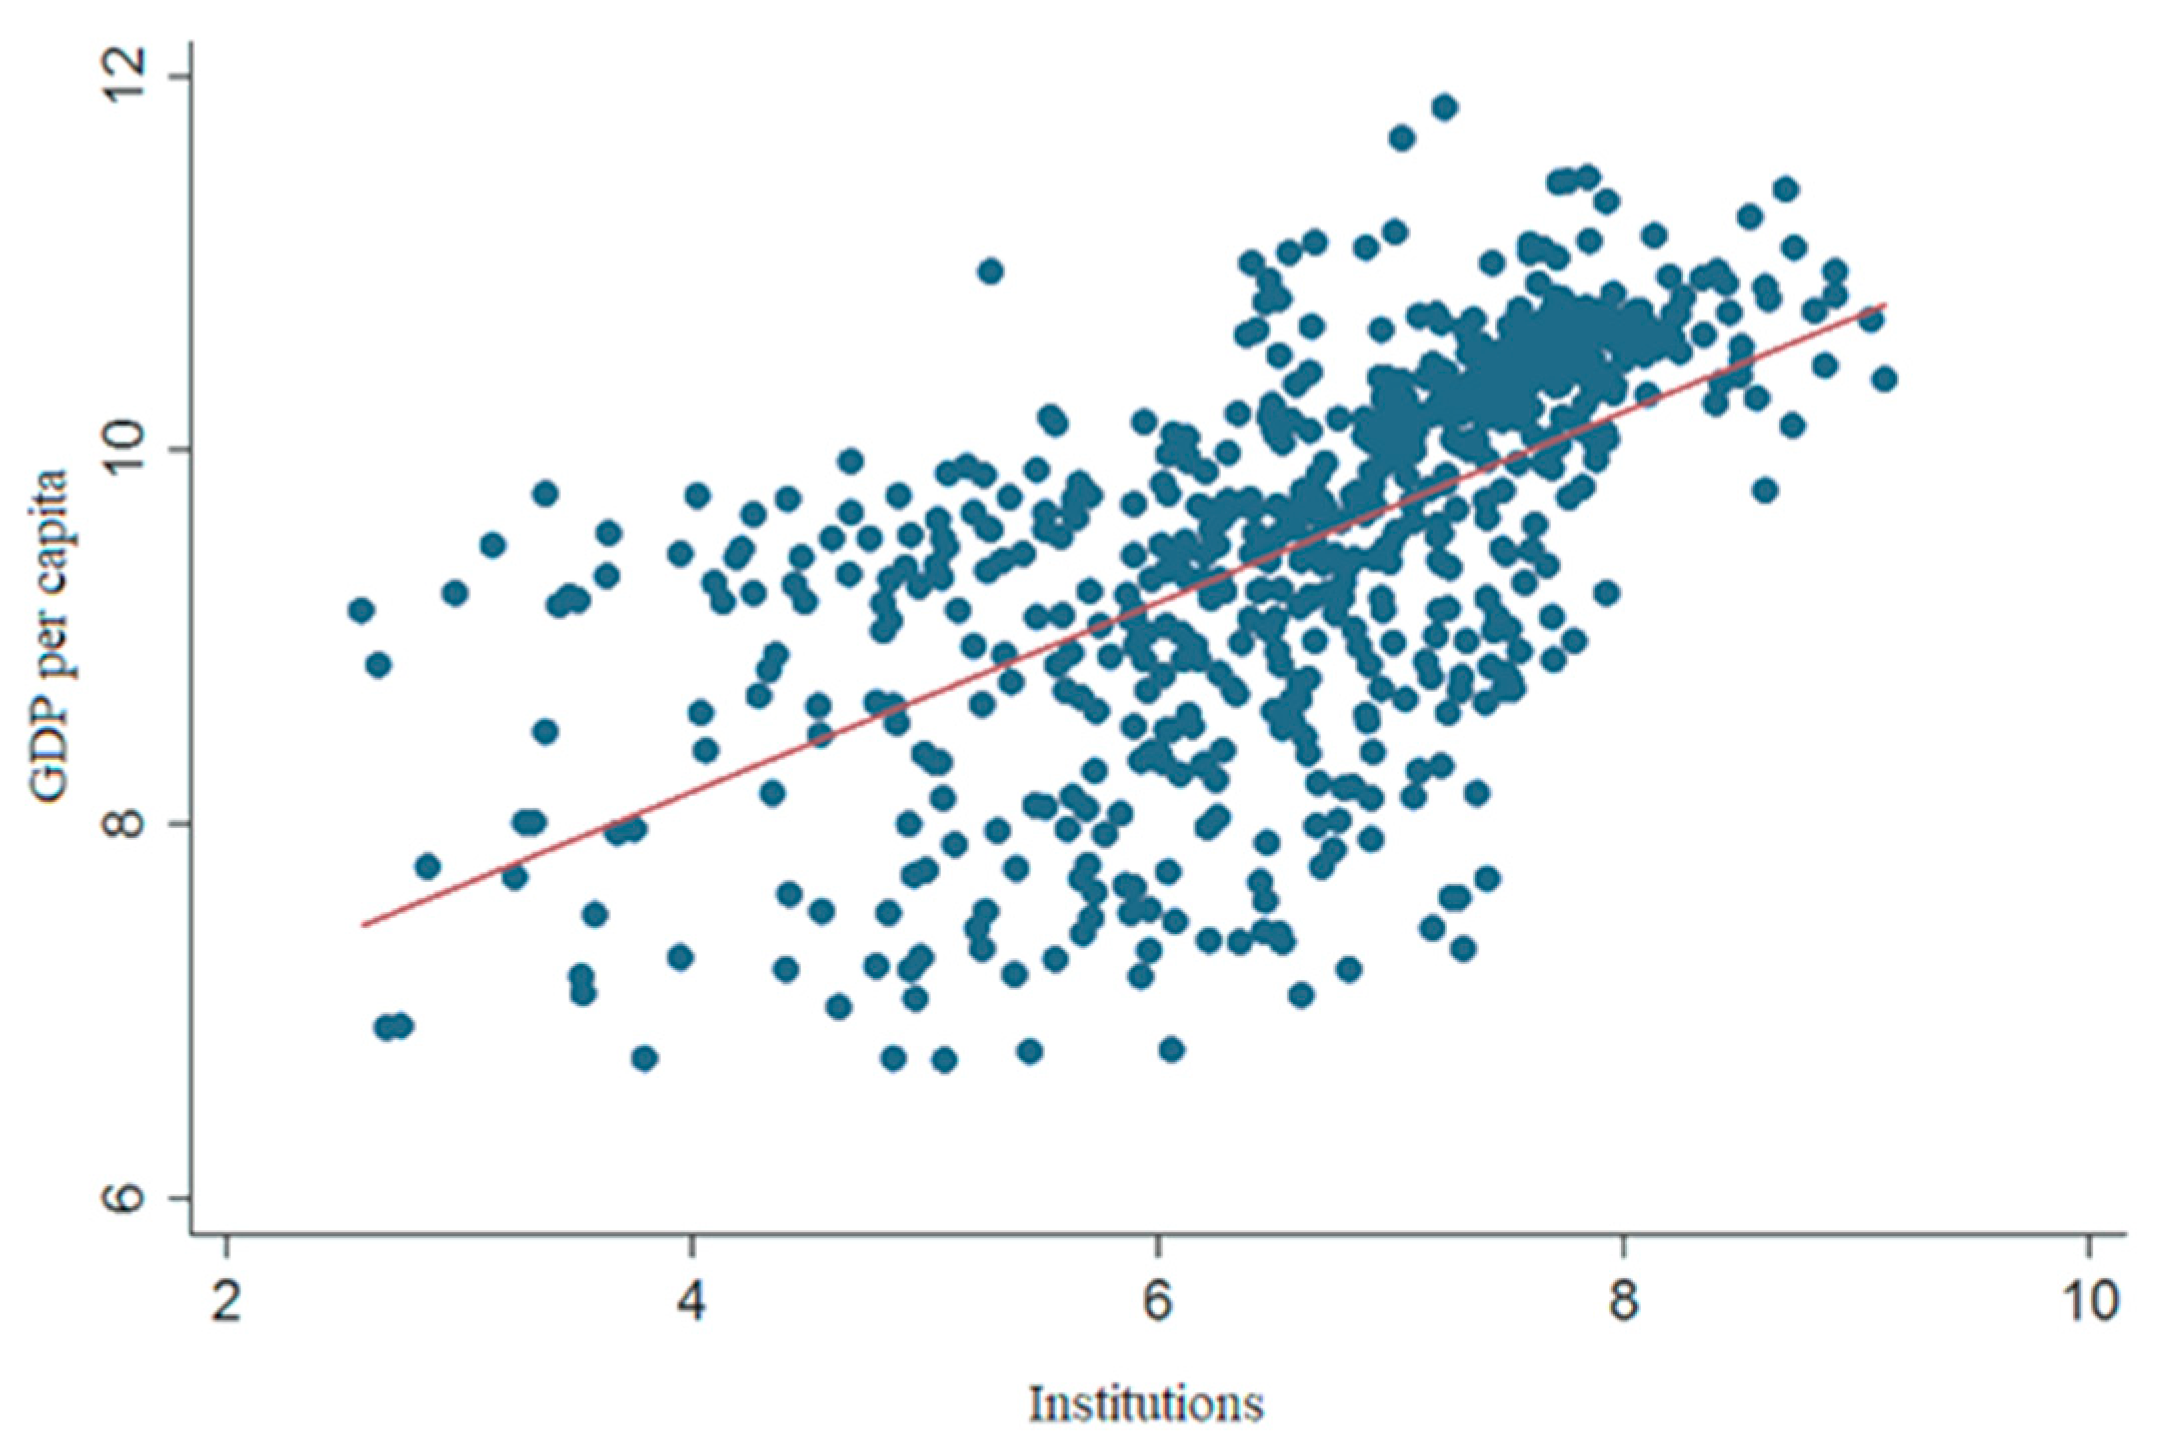
Graphical representations depicting the correlation between GDP per capita and factors such as cultural and institutional background can be found in Figure 1 and Figure 2. These illustrations provide a visual analysis of how GDP per capita is influenced by or relates to these background variables.
The insights derived from the figures above offer preliminary observations about the relationship between the variables which, as anticipated, is likely to be positive in both examined scenarios. A detailed analysis is conducted to assess the impact of cultural and institutional backgrounds on GDP per capita. This involves evaluating the influence of each of these backgrounds, individually and collectively, on GDP per capita and examining their respective product and quotient impacts on this economic indicator. For this purpose, Equation (1) is applied to an unbalanced panel dataset encompassing 113 countries and spanning seven waves from 1981 to 2019. The findings of this analysis3 are compiled in Table 3, which displays the outcomes of applying Equation (1) without incorporating control variables.
The findings from Regression (1) underscore the positive and statistically significant impact of institutional background on GDP per capita, highlighting the pivotal role of institutions in fostering economic development. Conversely, the analysis presented in Regression (2) reveals that cultural background does not exert a statistically significant influence on GDP per capita when considered in isolation. This outcome initially appears puzzling given the substantial literature suggesting culture’s critical role in economic development. However, Regression (3) offers insightful revelations by examining the combined effects of institutional and cultural backgrounds. This analysis not only reaffirms the significance of institutional quality but also unveils the latent impact of culture on economic outcomes, as evidenced by the enhanced effect size for institutional background (increasing from 0.05 in Regression (1) to 0.11 in Regression (3)). This interaction effect suggests a nuanced narrative in which culture, though not directly measurable in its impact on GDP per capita in isolation, plays a crucial role in magnifying the effectiveness of institutions. It implies that cultural values and norms may underpin the operational efficacy of institutions, thereby contributing to economic performance in a complementary fashion. Such an interpretation is consistent with the hypothesis that cultural and institutional factors do not operate in silos but interact dynamically, with culture providing the social and normative bedrock upon which institutions build to drive economic progress. This means that the influence of culture on economic outcomes may be subject to threshold effects such that its impact becomes significant only above or below certain levels of institutional development (see Alesina and Giuliano 2015; Kafka et al. 2020; Murphy 2021). Without accounting for the level of institutions, the effect of culture alone may not capture these conditional dynamics.
Several potential explanations are identified upon further reflecting on the observed non-significance of the cultural variable when considered as a standalone regressor. Firstly, excluding key variables, such as institutions that profoundly impact the dependent variable, may lead to the misrepresentation or obscuring of culture’s true effect. This is particularly relevant given the complex interdependencies between culture and institutions and their collective influence on economic outcomes. Secondly, the nature of the data used to represent culture warrants scrutiny. Cultural variables are inherently slow-moving and may lack the necessary variation to significantly impact the dependent variable in isolation. The literature acknowledges the incremental evolution of cultural backgrounds (Kafka and Kostis 2021), which may not manifest in observable economic effects over short periods (Johnston 1996; De Jong 2009; Petrakis and Kostis 2013). Analyzing culture alongside institutions directly influencing economic outcomes and showing greater variation underscores culture’s importance. This reveals the critical interplay between culture and institutions in driving economic development, emphasizing the need to consider both to fully understand their effects. Culture’s impact on the economy, mediated by complex psychological and social processes, becomes clearer through institutions, advocating for a comprehensive approach that includes both cultural and institutional factors to grasp their influence on economic outcomes fully.
Further exploration in Regressions (4) to (9) introduces an interaction term as per Williamson (2009), focusing on the product and ratio of institutional and cultural backgrounds. Regression (5) reaffirms the complementary nature of these variables; as the product of institutional and cultural backgrounds increases, so does GDP per capita, aligning with Kafka et al. (2020)’s quadrant (B) findings. Conversely, a decrease in this product correlates with lower GDP per capita levels, confirming quadrant C’s hypothesis.
Regressions (7) and (9) underline the influence of institutional background over cultural background in shaping GDP per capita. In both scenarios, the significance of institutional background is enhanced when considering cultural background.
These outcomes corroborate Kafka et al. (2020)’s descriptive analysis of the relationship between cultural/institutional backgrounds and GDP per capita. They underscore the complementary relationship between these variables in economic development and highlight the importance of institutional background in this context.
Robustness Analysis
The findings mentioned are further validated through a robustness analysis incorporating various checks: (a) the inclusion of control variables in the analysis, (b) the application of alternative estimation methods, and (c) the modification of the criteria categorizing countries into different quadrants.
To execute the first robustness check, the model’s estimations based on Equation (1) are expanded by integrating the GDP per capita of the preceding year as a control variable. This approach aims to discern the influence of institutional and cultural backgrounds on GDP per capita while accounting for the economic performance of the previous year. The outcomes of this analysis, which includes the prior year’s GDP per capita as a control factor, are detailed in Table 4. This table provides an insightful perspective on how the interaction between institutional and cultural backgrounds impacts the GDP per capita, considering the economic backdrop of the previous year.
In all regressions (10 to 18), the results from Table 3 are strengthened following the exact relationship between the independent and dependent variables. Also, the regressions reinforce the effect of institutional background on the level of economic development.
In addition, the results of regressions (3) and (12), examining the simultaneous relationships of institutional and cultural backgrounds to GDP per capita, are extended by adding additional control variables. Table 5 presents the relationship between institutional and cultural backgrounds and their effect on GDP per capita, using different control variables.
In examining regressions (19) to (22), it is consistently observed that both institutional and cultural backgrounds maintain a positive and statistically significant correlation with GDP per capita. Notably, the influence of institutional background consistently surpasses cultural background across all these regressions.
Furthermore, the complementarity analysis between institutional and cultural backgrounds is further developed by incorporating additional control variables. This extended investigation delves deeper into the interplay between these two backgrounds. The results of this expanded analysis are presented in Table 6, which focuses on the impact of the combined institutional and cultural backgrounds (their product) on GDP per capita, factoring in a range of diverse control variables for a more comprehensive understanding.
In the series of regressions from (23) to (26), the findings support the complementarity between institutional and cultural backgrounds in their influence on GDP per capita. Across these regressions, these two variables’ interaction (product) consistently demonstrates a positive and statistically significant impact on GDP per capita.
Additionally, the robustness of these conclusions is further assessed through an alternative method for estimating the effects of institutional and cultural backgrounds on GDP per capita. This approach employs the Arellano–Bond Generalized Method of Moments (GMM) estimator, a technique for addressing endogeneity and unobserved heterogeneity. This method is particularly advantageous over fixed-effects models as it enhances the efficiency of estimators, especially under conditions of persistence, such as autocorrelation and time-invariant individual effects, as Alonso-Borrego and Arellano (1996) noted.
The outcomes of applying this Arellano–Bond two-stage GMM methodology are detailed in Table 7, offering insights into the relationship between institutional and cultural backgrounds and GDP per capita under this advanced econometric approach.
In the analysis encompassing regressions 27, 31, and 32, the combined impact of institutional and cultural backgrounds on GDP per capita consistently emerges as positive and statistically significant. This trend persists despite the various additional control variables incorporated into the models. Furthermore, the positive and significant influence of the product of institutional and cultural backgrounds on GDP per capita is reaffirmed in regressions 28, 33, and 34.
The validity of the instruments used in these regressions is supported by the Hansen test values in many regressions exceeding the 0.1 threshold. Additionally, the Arellano–Bond AR(1) and AR(2) tests, also registering above 0.1, indicate the absence of an autocorrelation between residuals. These outcomes reinforce the earlier conclusions about the complementary relationship between institutional and cultural backgrounds and the significant role of institutional background in influencing GDP per capita.
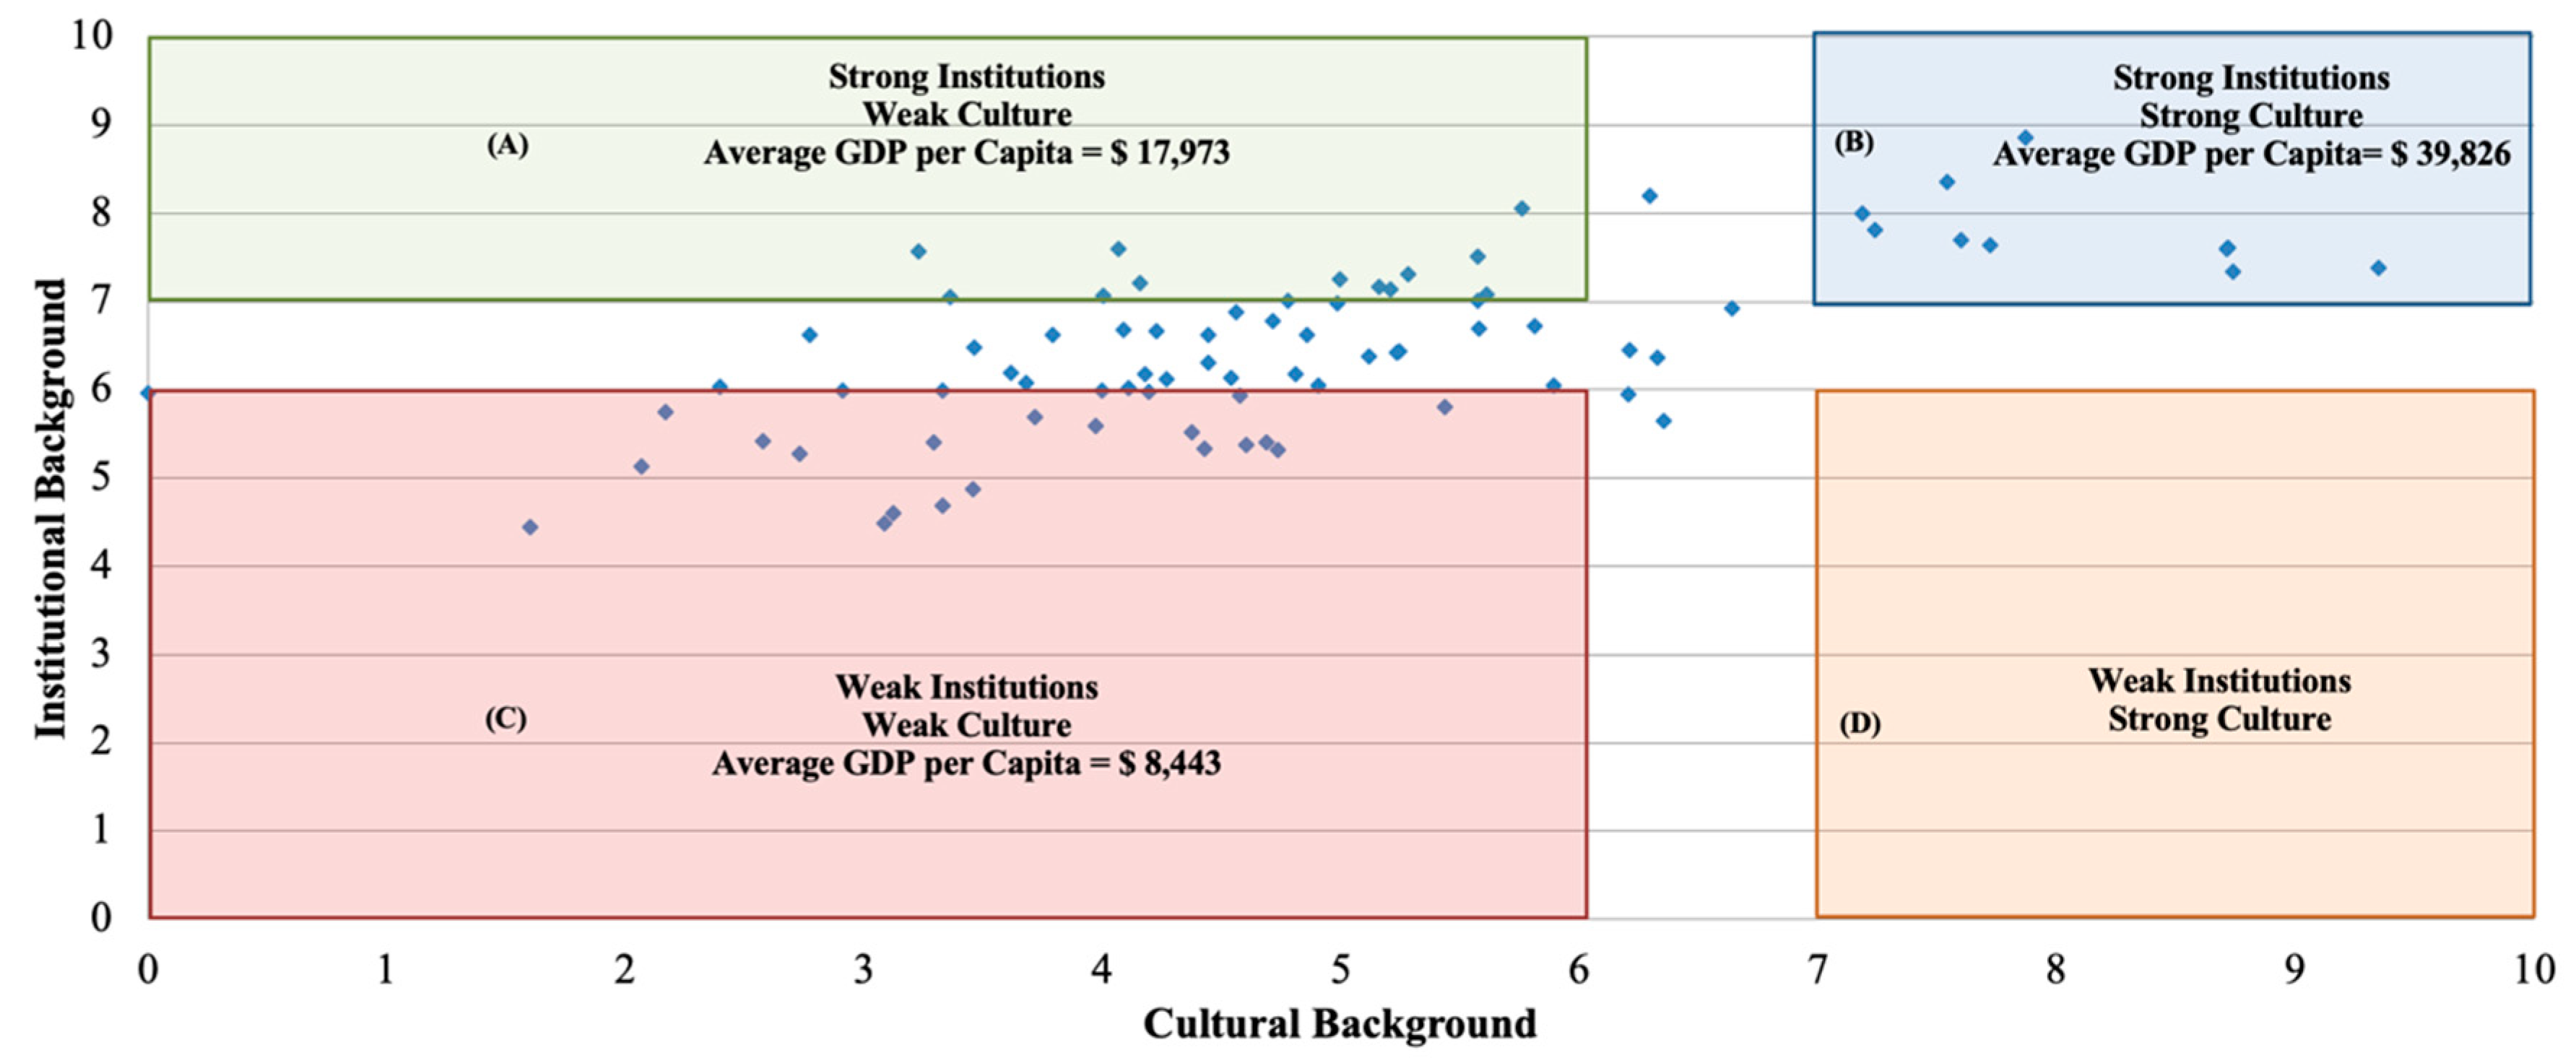
An additional robustness check is performed by relaxing the criteria used to categorize countries, as described by Kafka et al. (2020). This revised approach considers countries with scores above seven to have a strong cultural or institutional background. At the same time, those scoring below six are viewed as having a weak background in these areas. Figure 3 presents a scatter diagram illustrating the distribution of countries across different quadrants and the average GDP per capita for each quadrant. Detailed information about the countries classified within each quadrant is provided in Table A2 in Appendix A.
An examination of Figure 2 further reinforces the critical findings of this study. Notably, countries in quadrant (B), which are marked by strong institutional (average score of 7.83) and cultural backgrounds (average score of 8.07), exhibit the highest average GDP per capita, amounting to USD39,826. This group is consistent with those identified in Kafka et al. (2020) as the benchmarks defining strong institutional or cultural backgrounds have remained unchanged.
Conversely, countries in quadrant (C), characterized by weaker institutional (average score of 5.39) and cultural backgrounds (average score of 3.41), demonstrate the lowest average GDP per capita at USD 8443. The stark economic disparity between quadrants (B) and (C) underscores the synergistic effect of institutional and cultural backgrounds; countries that are strong in both dimensions achieve markedly higher economic development.
A further analysis shows countries in quadrant (A), with strong institutional (average score of 7.21) but weaker cultural backgrounds (average score of 4.84), have an average GDP per capita of USD17,973. This suggests that enhancing institutional strength leads to significantly improved economic outcomes compared to quadrant (C).
Interestingly, the scatter diagram lacks representation from quadrant (D), which would include countries with a weak institutional background but strong cultural background. Instead, the observed pattern in quadrant (A) indicates that a robust cultural background is rarely present without a strong institutional counterpart. This observation further supports the hypothesis that institutional and cultural backgrounds are complementary, each playing a crucial role in shaping a country’s economic development.
5. Discussion and Conclusions
5.1. Synergy between Institutional and Cultural Backgrounds
This study underscores the synergistic interplay between institutional and cultural backgrounds in fostering economic development. When both these backgrounds are robust, the highest levels of economic development are observed. Conversely, economic development tends to be significantly lower when either or both backgrounds are weak. This complementary nature of the two dimensions is further evidenced by the doubling effect of institutional background on economic development when cultural background is included in the analysis. Similarly, cultural background’s impact becomes statistically significant when it is considered alongside the institutional background.
The findings highlight the critical role of economic institutions in driving development. However, the most optimal economic development is achieved when these institutions are complemented by social behaviors that promote development, such as high levels of generalized trust, respect, and independence. Additionally, the positive and significant effect of the interaction term (the product of institutional and cultural backgrounds) on economic development across all control scenarios further reinforces the complementarity of these two factors. The more considerable impact that occurs when both elements are simultaneously strong points to their synergistic relationship.
This analysis lends credence to Pejovich’s (2003) assertion, “It’s the culture, stupid”, illustrating that the effectiveness of economic development is intricately tied to the prevailing cultural context. This relationship shows why certain economic policies, like structural reforms, may succeed in some countries but fail in others. It challenges the notion of universal “one-size-fits-all” policies, emphasizing the need for tailored approaches that consider different countries’ unique institutional and cultural landscapes, as noted in Kafka (2020).
This insight into the complementary nature of institutional and cultural backgrounds offers valuable guidance for policymakers and practitioners of economic policy, whether in developing or developed economies, underscoring the need for a nuanced understanding of these factors in shaping effective economic strategies.
This research highlights that while institutional and cultural backgrounds are essential for economic development, the institutional aspect, exemplified by the degree of economic freedom, exerts a more pronounced impact than cultural factors. This insight is particularly relevant for policymakers as they typically have more influence and capacity to shape institutional frameworks through various economic policies, including structural reforms (Acemoglu et al. 2005).
On the other hand, altering the cultural background of societies presents a more formidable challenge, often addressed indirectly through long-term educational initiatives (Chadwick and Valenzuela 2008). The results of such cultural shifts through education tend to unfold over extended periods, making immediate impacts less likely.
5.2. Policy Implications and Challenges
However, designing and implementing effective policies that bolster the institutional background is complex. Policymakers face difficulties in acquiring the necessary knowledge and fostering incentives to create institutions that propel economic development. Acemoglu and Robinson (2012) caution that while institutional structures are more tangible and can be modeled after successful frameworks from other economies, this approach should be approached cautiously.
As Alesina and Giuliano (2015) point out, one key reason for the difficulty in establishing a robust institutional background is its interdependence with society’s prevailing cultural values. These cultural values deeply influence the effectiveness of economic policy and institutional frameworks and a society’s readiness to embrace the changes these policies entail. This interplay suggests that while institutions can be more directly shaped by policy, their success is inextricably linked to the cultural context within which they operate.
Thus, most economies exhibit a state of limited progress characterized by stagnant development which can be attributed to specific features stemming from their institutional and cultural contexts, resulting in their inherent weakness (Petrakis et al. 2017). Societal dynamics can support development, lead to stagnation, or produce mixed effects, resulting in unclear outcomes. Transitioning from stagnation to robust development depends critically on the synchronized evolution of institutions and culture. Without this alignment, stagnation can become entrenched and persist over time.
5.3. Transformative Policy Interventions
Addressing the challenge of shifting from stagnant to dynamic development patterns depends on transformative policy interventions targeting the institutional background. The evolutionary interdependence between institutional and cultural backgrounds makes altering this trajectory difficult. However, implementing ambitious institutional changes through appropriate structural reforms can pivot a stagnant development pattern toward one that fosters economic development (Da Silva et al. 2017). For such policies to be effective, institutional evolution must align with cultural background, even if this alignment occurs over different time scales, as has been analyzed.
The pivotal question is how can institutional and cultural backgrounds be simultaneously steered in the same direction, especially toward a more robust state, in economies characterized by stagnant development patterns? While the optimal sequence for institutional change is somewhat understood, the path for cultural adaptation during these institutional shifts remains unclear. Effecting a transformation that concurrently optimizes institutional and cultural backgrounds is an intricate task demanding comprehensive planning and execution. It poses a significant challenge for policymakers (Petrakis et al. 2020).
The potential misalignment between institutional reforms and the existing cultural milieu exacerbates the complexity of this task. Such incompatibility can lead to failed attempts to establish a modern institutional framework and a cultural environment conducive to development (Kafka 2020). This discordance can result in economies remaining stagnant, unable to break free from their current state despite ambitious plans for structural reforms. This scenario highlights the need for a nuanced and synchronized approach to institutional and cultural change to foster sustainable economic development.
5.4. Limitations and Directions for Future Research
This analysis possesses certain limitations. Despite employing all the data accessible to convey the cultural contexts of the societies examined, encompassing data from the initial to the most recent waves of the WVS and the EVS up until 2019, certain economies were included in the surveys solely during specific waves. Furthermore, the metric employed to assess institutional background, namely the Economic Freedom Index, primarily pertains to economic institutions within economies and neglects the consideration of political and social institutions prevalent in societies.
Future research should expand on measuring institutional backgrounds and exploring their impact, alongside cultural factors, on economic development. This includes examining a broader range of cultural values and institutional metrics to understand their interplay better. It should also investigate if these relationships vary between developed and developing economies and consider the impact of external events like the 2008 financial crisis or the recent pandemic. Additionally, addressing endogeneity more thoroughly in future studies could deepen our understanding of these complex dynamics.
Funding
This research received no external funding.
Informed Consent Statement
Not applicable.
Data Availability Statement
Data are available upon request.
Conflicts of Interest
The author declares no conflicts of interest.
Appendix A
Table A1 presents the questions used to quantify the cultural dimensions.

Table A1.
Definitions of cultural dimensions.
| Cultural Dimension | Question/Definition | |
|---|---|---|
| Generalized trust | “In general, would you say that most people can be trusted or that you should be very careful in dealing with people?” The level of trust in each country is measured as the percentage of respondents who answered that “most people can be trusted”. | |
| Control of life | “How much freedom of choice and control do you feel you have over how you live your life”? The respondents’ response “a great deal of freedom of choice and control” is the one taken into account. | |
| Independence | “Which quality do you consider to be particularly important to teach to your children? Obedience or independence»?” The variable is defined as the percentage of respondents reporting “independence” as the most important quality. | |
| Honesty | Honesty I | “Is it justified to evade taxes? Honesty I corresponds to the answer “not acceptable”. |
| Honesty II | “Is it justified to avoid paying a fare on public transport?” Honesty II is derived from the percentage of respondents who also answer, “not acceptable”. | |
| Competition affinity | Competition affinity I | “How would you place your view, on a scale of 1 to 10, from competition being good to competition being harmful?” Competition I corresponds to the answer “competition is good”. |
| Competition affinity II | “Can people only get rich at the expense of others?” Competition II is derived from the percentage of respondents answering, “at the expense of others”. | |
| Work ethic | Work ethic I | “What quality is considered particularly important to teach your children?” “Work Ethic I” corresponds to the responses “hard work”. |
| Work ethic II | “Work is very important to your life?” Work Ethic II is derived from the percentage of respondents answering, “very important”. | |
| Respect | “Which quality do you consider to be particularly important to teaching your children?” The variable “respect” is defined as the percentage of respondents in each country reporting the quality “tolerance and respect for others” as important. | |
A method of relaxing the boundaries that categorize countries is followed to include other countries in the analysis. Thus, all countries scoring above seven are taken as having a strong cultural background/institutional background, while correspondingly, all countries with a score below six are identified to have a weak cultural background/institutional background.
Table A2.
Countries in quadrants, scores, and GDP per capita.
| Strong Institutions–Weak Culture | Strong Institutions–Strong Culture | ||||||
|---|---|---|---|---|---|---|---|
| Country | Culture | Institutions | GDP Per Capita | Country | Culture | Institutions | GDP Per Capita |
| Vietnam | 5.89 | 6.05 | 3330.30 | Norway | 9.35 | 7.38 | 55,653.87 |
| New Zealand | 5.76 | 8.05 | 28,268.62 | Sweden | 8.74 | 7.34 | 37,068.91 |
| Georgia | 4.06 | 7.59 | 5716.39 | Netherlands | 8.71 | 7.61 | 40,332.87 |
| Armenia | 3.23 | 7.57 | 5075.77 | Finland | 8.71 | 7.60 | 33,646.95 |
| Estonia | 5.57 | 7.52 | 19,887.70 | Hong Kong | 7.87 | 8.86 | 37,889.14 |
| Chile | 5.28 | 7.31 | 15,360.80 | Japan | 7.72 | 7.65 | 33,247.75 |
| Latvia | 4.99 | 7.25 | 16,185.53 | Germany | 7.60 | 7.69 | 37,573.25 |
| Czech republic | 4.15 | 7.21 | 26,175.23 | Switzerland | 7.54 | 8.35 | 49,494.08 |
| Lithuania | 5.16 | 7.16 | 19,989.40 | Australia | 7.24 | 7.81 | 36,647.47 |
| Spain | 5.21 | 7.14 | 28,817.90 | Canada | 7.18 | 8.00 | 36,705.35 |
| France | 5.61 | 7.08 | 34,558.47 | Average | 8.07 | 7.83 | 39,825.96 |
| Slovakia | 4.00 | 7.07 | 20,558.37 | ||||
| Lebanon | 3.36 | 7.05 | 12,649.27 | ||||
| Malaysia | 5.57 | 7.01 | 17,286.46 | ||||
| Kazakhstan | 4.78 | 7.00 | 15,735.42 | ||||
| Average | 4.84 | 7.21 | 17,973.04 | ||||
| Weak Institutions–Weak Culture | Weak Institutions–Strong Culture | ||||||
| Country | Culture | Institutions | GDP per capita | Country | Culture | Institutions | GDP per capita |
| Burkina Faso | 2.91 | 5.99 | 1195.23 | - | - | - | - |
| India | 3.33 | 5.99 | 3413.81 | ||||
| Dominican Rep. | 4.19 | 5.98 | 9441.76 | ||||
| Haiti | 0.00 | 5.96 | 1777.94 | ||||
| Russia | 4.58 | 5.94 | 19,549.52 | ||||
| Poland | 5.44 | 5.81 | 16,716.41 | ||||
| Ghana | 2.17 | 5.75 | 3585.80 | ||||
| Ecuador | 3.72 | 5.69 | 8530.45 | ||||
| Pakistan | 3.97 | 5.59 | 3639.66 | ||||
| Ethiopia | 4.37 | 5.52 | 977.15 | ||||
| Mali | 2.57 | 5.43 | 1641.60 | ||||
| Zambia | 3.29 | 5.41 | 2782.47 | ||||
| Egypt | 4.69 | 5.40 | 8778.71 | ||||
| Argentina | 4.60 | 5.38 | 15,807.43 | ||||
| Bangladesh | 4.43 | 5.34 | 2180.83 | ||||
| Ukraine | 4.74 | 5.32 | 7201.05 | ||||
| Brazil | 2.73 | 5.27 | 12,418.27 | ||||
| Nigeria | 2.07 | 5.13 | 4075.95 | ||||
| Iran | 3.46 | 4.87 | 14,920.61 | ||||
| Libya | 3.33 | 4.69 | 26,331.32 | ||||
| Zimbabwe | 3.12 | 4.60 | 2540.86 | ||||
| Algeria | 3.09 | 4.48 | 11,667.48 | ||||
| Venezuela | 1.60 | 4.45 | 15,032.13 | ||||
| Average | 3.41 | 5.39 | 8443.76 | ||||
| 1 | See Kostis et al. (2018) for a discussion on the role of generalized trust in economic development. See Banfield (1958) for the role of control of life in economic outcomes. To see the role of honesty, see Guiso et al. (2010) for a discussion on the extent to which individuals try to increase their benefits regardless of the potentially negative social externalities of their actions. See Inglehart and Baker (2000) and Phelps (2006) for a discussion on the roles of competition affinity and work ethic in economic outcomes. See Tabellini (2010) for a discussion on the role of respect in the economy. |
| 2 | Given socio-economic research’s dynamic and evolving nature, applying a PCA over time warrants careful consideration. It is essential to address potential concerns regarding introducing bias in constructing composite indicators, as highlighted by Mazziotta and Pareto (2016, 2018). These authors provide valuable insights into adjusting composite indices to reflect changes more accurately over time, emphasizing the importance of methodological rigor in longitudinal analyses. However, it is pertinent to note the distinctive characteristics of cultural values compared to other socio-economic phenomena. Cultural values are inherently stable and evolve over significantly longer horizons than economic indicators or institutional changes. This inherent stability of cultural dimensions provides a methodological advantage when applying a PCA over time in this study. The long-lasting nature of cultural values suggests that potential biases associated with temporal dynamics are considerably mitigated, allowing for the reliable use of a PCA to aggregate cultural indicators across different time periods. |
| 3 | The variation in the number of observations across different specifications and robustness checks in this study is attributed to data availability for the variables related to institutions and culture. Specifically, the analyses incorporating “institutions” as the sole independent variable include a broader dataset, reflecting the comprehensive availability of institutional data across all countries over the seven analysis waves. In contrast, when “culture” is introduced as a variable, the number of observations is reduced due to the more limited availability of cultural data. This discrepancy is consistent across all tables and is an inherent study limitation influenced by the external constraint of data availability. Despite these variations, the data utilized across all analyses remain consistent, ensuring the integrity of the comparative analysis within the bounds of the available data. |
References
- Acemoglu, Daron, and James Robinson. 2012. Why Nations Fail: The Origins of Power, Prosperity, and Poverty. New York: Crown Publishing. [Google Scholar]
- Acemoglu, Daron, Simon Johnson, and James Robinson. 2005. Chapter 6 Institutions as a Fundamental Cause of Long-Run Growth. In Handbook of Economic Growth. Edited by Philippe Aghion and Steven N. Durlauf. Amsterdam: Elsevier, Volume 1, Part A. pp. 385–472. [Google Scholar] [CrossRef]
- Alesina, Alberto, and Paola Giuliano. 2015. Culture and Institutions. Journal of Economic Literature 53: 898–944. [Google Scholar] [CrossRef]
- Alonso-Borrego, Cesar, and Manuel Arellano. 1996. Symmetrically Normalised Instrumental Variable Estimation Using Panel Data. CEMFI Working Paper No. 9612. Madrid: Center for Monetary and Financial Studies (CEMFI). [Google Scholar]
- Antrup, Andreas Hermann. 2013. Co-evolution of Institutions and Preferences: The Case of the (Human) Mating Market. Journal of Theoretical Biology 332: 9–19. [Google Scholar] [CrossRef]
- Arellano, Manuel, and Stephen Bond. 1991. Some Tests of Specification for Panel Data: Monte Carlo Evidence and an Application to Employment Equations. Review of Economic Studies 58: 277–97. [Google Scholar] [CrossRef]
- Bakas, Dimitrios, Pantelis Kostis, and Petrakis Panagiotis. 2020. Culture and Labour Productivity: An Empirical Investigation. Economic Modelling 85: 233–43. [Google Scholar] [CrossRef]
- Banfield, Edward. 1958. Moral Basis of a Backward Society. New York: Free Press. [Google Scholar]
- Basu, Basudha. 2021. Do Institutional Norms Affect Behavioral Preferences: A View from Gender Bias in the Intra-Household Expenditure Allocation in Iran. Economic Modelling 97: 118–34. [Google Scholar] [CrossRef]
- Bengoa, Marta, and Blanca Sanchez-Robles. 2003. Foreign Direct Investment, Economic Freedom and Growth: New Evidence from Latin America. European Journal of Political Economy 19: 529–45. [Google Scholar] [CrossRef]
- Bisin, Alberto, and Thierry Verdier. 2015. On the Joint Evolution of Culture and Institutions. New York: Mimeo. [Google Scholar]
- Borovic, Zoran, and Dragana Radicic. 2023. Productivity Gap between the ‘New’ and ‘Old’ Europe and Role of Institutions. Economies 11: 254. [Google Scholar] [CrossRef]
- Bourdieu, Pierre. 1986. The Forms of Capital. In Handbook of Theory and Research for the Sociology of Culture. Edited by J. Richardson. New York: Greenwood, pp. 241–58. [Google Scholar]
- Bowles, Samuel. 1998. Endogenous Preferences: The Cultural Consequences of Markets and Other Economic Institutions. Journal of Economic Literature 36: 75–111. [Google Scholar]
- Bowles, Samuel. 2000. Group Conflicts, Individual Interactions, and the Evolution of Preferences. In Social Dynamics. Edited by Stephen Durlauf and Peyton Young. Cambridge: MIT Press. [Google Scholar]
- Bowles, Samuel. 2004. Microeconomics: Behavior, Institutions, and Evolution. Princeton: Princeton University Press. [Google Scholar]
- Bowles, Samuel. 2006. Group Competition, Reproductive Leveling, and the Evolution of Human Altruism. Science 314: 1569–72. [Google Scholar] [CrossRef]
- Bowles, Samuel. 2009. Did Warfare Among Ancestral Hunter-Gatherers Affect the Evolution of Human Social Behaviors? Science 324: 1293–98. [Google Scholar] [CrossRef]
- Bowles, Samuel, and Herbert Gintis. 2000. Walrasian Economics in Retrospect. Quarterly Journal of Economics 115: 1411–39. [Google Scholar] [CrossRef]
- Bowles, Samuel, Jung-Kyoo Choi, and Astrid Hopfensitz. 2003. The Co-Evolution of Individual Behaviors and Social Institutions. Journal of Theoretical Biology 223: 135–47. [Google Scholar] [CrossRef]
- Boyd, Robert, and Peter J. Richerson. 2002. Group Beneficial Norms Can Spread Rapidly in a Structured Population. Journal of Theoretical Biology 215: 287–96. [Google Scholar] [CrossRef]
- Bützer, Stefan, Christa Jordan, and Livio Stracca. 2013. Macroeconomic Imbalances: A Question of Trust? Working Paper 1584. Frankfurt: European Central Bank. [Google Scholar]
- Chadwick, Clifton, and Soledad Valenzuela. 2008. Culture, Change, and Educational Improvement. Educational Technology 48: 27–36. Available online: http://0-www-jstor-org.brum.beds.ac.uk/stable/44429590 (accessed on 15 March 2024).
- Choi, Jung-Kyoo, and Samuel Bowles. 2007. The Coevolution of Parochial Altruism and War. Science 318: 636–40. [Google Scholar] [CrossRef] [PubMed]
- Correa da Cunha, Henrique, Mohamed Amal, and James Mark Viminitz. 2022. Formal vs. Informal Institutional Distances and the Competitive Advantage of Foreign Subsidiaries in Latin America. Economies 10: 114. [Google Scholar] [CrossRef]
- Da Silva, Antonia Dias, Audrey Givone, and David Sondermann. 2017. When Do Countries Implement Structural Reforms? ECB Working Paper Series, No. 2078. Frankfurt am Main: European Central Bank. [Google Scholar]
- Dawson, John W. 1998. Institutions, Investment, and Growth: New Cross-Country and Panel Data Evidence. Economic Inquiry 36: 603–19. [Google Scholar] [CrossRef]
- De Jong, Eelke. 2009. Culture and Economics: On Values, Economics, and International Business. London: Routledge. [Google Scholar]
- Frederking, Laurence C. 2002. Is There an Endogenous Relationship Between Culture and Economic Development? Journal of Economic Behavior and Organization 48: 105–26. [Google Scholar] [CrossRef]
- Gaganis, Chrysovalantis, Fotios Pasiouras, and Fotini Voulgari. 2019. Culture, Business Environment and SMEs’ Profitability: Evidence from European Countries. Economic Modelling 78: 275–92. [Google Scholar] [CrossRef]
- Gintis, Herbert. 2007. A Framework for the Unification of the Behavioral Sciences. Behavioral and Brain Sciences 30: 1–16. [Google Scholar] [CrossRef]
- Glaeser, Edward L., Rafael La Porta, Florencio Lopez-de-Silanes, and Andrei Shleifer. 2004. Do Institutions Cause Growth? Journal of Economic Growth 9: 271–303. [Google Scholar] [CrossRef]
- Greif, Avner, and Guido Tabellini. 2017. The Clan and the Corporation: Sustaining Cooperation in China and Europe. Journal of Comparative Economics 45: 1–35. [Google Scholar] [CrossRef]
- Guiso, Luigi, Sapienza Paola, and Zingales Luigi. 2010. Civic Capital as the Missing Link. NBER Working Paper 15845. Cambridge: National Bureau of Economic Research, Inc. [Google Scholar]
- Gwartney, James D., Randall A. Holcombe, and Robert G. Lawson. 2004. Economic Freedom, Institutional Quality, and Cross-Country Differences in Income and Growth. Cato Journal 24: 205–33. [Google Scholar]
- Gwartney, James, Robert Lawson, and Joshua Hall. 2019. Economic Freedom of the World: 2019 Annual Report. Calgary: Fraser Institute. ISBN 978-0-88975-561-1. [Google Scholar]
- Hall, Joshua, and Robert Lawson. 2014. Economic Freedom of the World: An Accounting of the Literature. Contemporary Economic Policy 32: 1–19. [Google Scholar] [CrossRef]
- Hall, Robert E., and Charles I. Jones. 1999. Why Do Some Countries Produce So Much More Output Per Worker than Others? The Quarterly Journal of Economics 114: 83–116. [Google Scholar] [CrossRef]
- Hansen, Lars Peter, and Kenneth J. Singleton. 1982. Generalized Instrumental Variables of Nonlinear Rational Expectations Models. Econometrica 50: 1269–86. [Google Scholar] [CrossRef]
- Hofstede, Geert. 1980. Culture’s Consequences: International Differences in Work-Related Values. Beverly Hills: Sage Publications. [Google Scholar]
- Hopp, Christian, and Ute Stephan. 2012. The Influence of Socio-Cultural Environments on the Performance of Nascent Entrepreneurs: Community Culture, Motivation, Self Efficacy and Start-Up Success. Entrepreneurship & Regional Development 24: 917–45. [Google Scholar]
- House, Robert J., Paul J. Hanges, Mansour Javidan, Peter W. Dorfman, and Vipin Gupta. 2004. Culture, Leadership, and Organizations: The GLOBE Study of 62 Societies. Thousand Oaks: Sage Publications. [Google Scholar]
- Huggins, Robert, and Piers Thompson. 2014. Culture, Entrepreneurship, and Uneven Development: A Spatial Analysis. Entrepreneurship & Regional Development 26: 726–52. [Google Scholar]
- Inglehart, Ronald. 1988. The Renaissance of Political Culture. American Political Science Review 82: 1028–34. [Google Scholar] [CrossRef]
- Inglehart, Ronald. 1990. Culture Shift in Advanced Industrial Society. Princeton: Princeton University Press. [Google Scholar]
- Inglehart, Ronald. 1998. The New Political Culture: Changing Dynamics of Support for the Welfare State and Other Policies in Postindustrial Societies. In The New Political Culture. Edited by Terry N. Clark and Vincent Hoffmann-Martinot. Colorado: Westview Press. [Google Scholar]
- Inglehart, Ronald, and Wayne E. Baker. 2000. Modernization, Culture Change, and the Persistence of Traditional Values. American Sociological Review 65: 19–51. [Google Scholar] [CrossRef]
- Johnston, Lucy. 1996. Resisting Change: Information-Seeking and Stereotype Change. European Journal of Social Psychology 26: 799–825. [Google Scholar] [CrossRef]
- Kafka, Kyriaki I. 2020. Economic Theory and Economic Reality: A Continuously Dialectic Relationship. In Bridging Microeconomics and Macroeconomics and the Effects on Economic Development and Growth. Edited by Pantelis C. Kostis. Hershey: IGI Global. [Google Scholar] [CrossRef]
- Kafka, Kyriaki I., and Pantelis C. Kostis. 2021. Post-Materialism and Economic Growth: Cultural Backlash, 1981–2019. Journal of Comparative Economics 49: 901–17. [Google Scholar] [CrossRef]
- Kafka, Kyriaki I., Panagiotis E. Petrakis, and Pantelis C. Kostis. 2020. Why Coevolution of Culture and Institutions Matters for Economic Development and Growth? In Perspectives on Economic Development—Public Policy, Culture, and Economic Development. Edited by R. M. Yong and Intech Open Publications. London: Intech Open. [Google Scholar] [CrossRef]
- Knack, Stephen, and Philip Keefer. 1997. Does Social Capital Have an Economic Payoff? A Cross-Country Investigation. The Quarterly Journal of Economics 112: 1251–88. [Google Scholar] [CrossRef]
- Knight, Jack. 1992. Institutions and Social Conflict. Cambridge: Cambridge University Press. [Google Scholar]
- Kostis, Pantelis C., Kyriaki I. Kafka, and Panagiotis E. Petrakis. 2018. Cultural Change and Innovation Performance. Journal of Business Research 88: 306–13. [Google Scholar] [CrossRef]
- Le Clech, Néstor, and Juan Carlos Guevara-Pérez. 2023. Latin America and the Caribbean’s Productivity: The Role of Pro-Market Policies, Institutions, Infrastructure, and Natural Resource Endowments. Economies 11: 142. [Google Scholar] [CrossRef]
- Levine, Ross, and David Renelt. 1992. A Sensitivity Analysis of Cross-Country Growth Regressions. American Economic Review 82: 942–63. [Google Scholar]
- Lewis, Orion, and Sven Steinmo. 2012. How Institutions Evolve: Evolutionary Theory and Institutional Change. Polity 44: 314–39. [Google Scholar] [CrossRef]
- Lothian, James R. 2006. Institutions, Capital Flows and Financial Integration. Journal of International Money and Finance 25: 358–69. [Google Scholar] [CrossRef]
- Mathers, Rachel L., and Claudia R. Williamson. 2011. Cultural Context: Explaining the Productivity of Capitalism. Kyklos 64: 231–52. [Google Scholar] [CrossRef]
- Mazziotta, Matteo, and Adriano Pareto. 2016. On a Generalized Non-compensatory Composite Index for Measuring Socio-economic Phenomena. Social Indicators Research 127: 983–1003. [Google Scholar] [CrossRef]
- Mazziotta, Matteo, and Adriano Pareto. 2018. Measuring Well-Being Over Time: The Adjusted Mazziotta–Pareto Index Versus Other Non-compensatory Indices. Social Indicators Research 136: 967–76. [Google Scholar] [CrossRef]
- McClelland, David C. 1961. The Achieving Society. Princeton: Van Nostrand. [Google Scholar]
- Murphy, Ryan H. 2021. The Soft Stuff of Institutional Development: Culture, Cohesion, and Economic Freedom. Journal of Private Enterprise 36: 37–66. [Google Scholar]
- North, Douglass C., and Barry R. Weingast. 1989. Constitutions and Commitment: The Evolution of Institutions Governing Public Choice in Seventeenth-Century England. The Journal of Economic History 49: 803–32. [Google Scholar] [CrossRef]
- Patuelli, Roberto, Enrico Santarelli, and Annie Tubadji. 2020. Entrepreneurial Intention among High-School Students: The Importance of Parents, Peers and Neighbors. Eurasian Business Review 10: 225–51. [Google Scholar] [CrossRef]
- Pejovich, Svetozar. 2003. Understanding the Transaction Costs of Transition: It’s the Culture, Stupid. ICER Working Papers 24-2003. Torino: ICER—International Centre for Economic Research. [Google Scholar]
- Petrakis, Panagiotis E., and Pantelis C. Kostis. 2013. Economic Growth and Cultural Change. Journal of Behavioral and Experimental Economics (Formerly ”The Journal of Socio-Economics”) 47: 147–57. [Google Scholar] [CrossRef]
- Petrakis, Panagiotis E., Dionysis G. Valsamis, and Kyriaki I. Kafka. 2017. From an Optimal to a Stagnated Growth Prototype: The Role of Institutions and Culture. Journal of Innovation and Knowledge 2: 97–105. [Google Scholar] [CrossRef]
- Petrakis, Panagiotis E., Dionysis G. Valsamis, and Kyriaki I. Kafka. 2020. Economic Growth and Development Policy. London: Palgrave MacMillan. ISBN 978-3-030-43181-5. [Google Scholar]
- Phelps, Anne E. 2006. Emotion and Cognition: Insights from Studies of the Human Amygdala. Annual Review of Psychology 57: 27–53. [Google Scholar] [CrossRef]
- Roodman, David. 2008. Through the Looking-Glass, and What OLS Found There: On Growth, Foreign Aid, and Reverse Causality. Working Papers 137. Washington, DC: Center for Global Development. [Google Scholar]
- Roth, Felix. 2009. Does Too Much Trust Hamper Economic Growth? Kyklos 1: 103–28. [Google Scholar] [CrossRef]
- Schwarz, Shalom H. 2009. Culture Matters: National Value Cultures, Sources, and Consequences. In Understanding Culture. Edited by Robert S. Wyer, Chi-yue Chiu and Ying-yi Hong. New York: Psychology Press. [Google Scholar]
- Spolaore, Enrico, and Romain Wacziarg. 2013. How Deep Are the Roots of Economic Development? Journal of Economic Literature 51: 325–39. [Google Scholar] [CrossRef]
- Tabellini, Guido. 2010. Culture and Institutions: Economic Development in the Regions of Europe. Journal of the European Economic Association 8: 677–716. [Google Scholar] [CrossRef]
- Travkina, Elena Vladimirovna, Alim Borisovich Fiapshev, Marianna Tolevna Belova, and Svetlana Evgenievna Dubova. 2023. Culture and Institutional Changes and Their Impact on Economic and Financial Development Trajectories. Economies 11: 14. [Google Scholar] [CrossRef]
- Veblen, Thorstein. 1898. The Theory of the Leisure Class: An Economic Study of Institutions. New York: MacMillan. [Google Scholar]
- Weber, Max. 1996. The Protestant Ethic and the Spirit of Capitalism. Translated by Talcott Parsons. Los Angeles: Roxbury. First published 1930. [Google Scholar]
- Williamson, Claudia R. 2009. Informal Institutions Rule: Institutional Arrangements and Economic Performance. Public Choice 139: 371–87. [Google Scholar] [CrossRef]
- Williamson, Claudia R., and Rachel L. Mathers. 2011. Economic Freedom, Culture, and Growth. Public Choice 148: 313–35. [Google Scholar] [CrossRef]
- Xiu, Zhou, Rui Liu, Peng Feng, and Jing Yin. 2023. Does Social Culture Matter for Firms’ Access to Trade Credit? Evidence from China. Economic Modelling 119: 106163. [Google Scholar] [CrossRef]
- Yegorov, Yuriy. 2015. Economic Role of Population Density. Paper presented at 55th Congress of the European Regional Science Association: “World Renaissance: Changing Roles for People and Places”, Lisbon, Portugal, August 25–28; Louvain-la-Neuve: European Regional Science Association (ERSA). [Google Scholar]
Figure 1.
Scatterplot showing the relationship between GDP per capita and cultural background.

Figure 2.
Scatterplot showing the relationship between GDP per capita and institutional background.

Figure 3.
A descriptive depiction of the relationship of cultural/institutional backgrounds and average GDP per capita—a relaxation of the limits. Note: The countries in each group are presented in detail in Appendix A. “Quadrant A” refers to economies with strong institutions and weak culture, “Quadrant B” to economies with strong institutions and strong culture, “Quadrant C” to economies with weak institutions and weak culture, and “Quadrant D” to economies with weak institutions and strong culture.

Table 1.
Descriptive statistics.
| N | Avg. | St. dev. | Min | Max | |
|---|---|---|---|---|---|
| GDP per capita | 712 | 9.44 | 1.09 | 6.35 | 11.83 |
| Institutions | 610 | 6.57 | 1.24 | 2.59 | 9.12 |
| Culture | 152 | 0.00 | 1.57 | −4.52 | 4.58 |
| Trust | 366 | 28.40 | 15.63 | 2.50 | 77.40 |
| Control of life | 352 | 15.36 | 8.52 | 0.00 | 43.90 |
| Respect | 359 | 67.87 | 13.24 | 14.20 | 96.30 |
| Independence | 364 | 48.10 | 18.79 | 7.90 | 90.00 |
| Honesty | 331 | 0.00 | 1.32 | −3.84 | 3.67 |
| Honesty I | 354 | 60.04 | 14.73 | 20.30 | 98.10 |
| Honesty II | 338 | 55.93 | 15.58 | 12.60 | 96.30 |
| Competition | 178 | 0.00 | 1.12 | −1.73 | 6.14 |
| Competition I | 327 | 26.10 | 12.32 | 3.70 | 66.30 |
| Competition II | 183 | 7.66 | 6.95 | 0.30 | 77.30 |
| Work ethic | 335 | 0.00 | 1.03 | −2.73 | 2.43 |
| Work ethic I | 362 | 52.85 | 25.43 | 2.10 | 94.60 |
| Work ethic II | 338 | 61.82 | 14.95 | 26.10 | 95.10 |
| FDI | 687 | 10.31 | 32.47 | −51.77 | 322.05 |
| Tertiary education | 579 | 33.42 | 23.43 | 0.27 | 113.77 |
| Investments | 672 | 24.04 | 6.72 | 3.35 | 49.31 |
| Population density | 742 | 253.66 | 860.10 | 1.99 | 7934.36 |
Table 2.
The configuration of the variable “cultural background”.
| Cultural Value | Principal Component Score |
|---|---|
| Trust | 0.466 |
| Control of life | −0.226 |
| Independence | 0.389 |
| Honesty | 0.027 |
| Competition | −0.457 |
| Work ethic | −0.507 |
| Respect | 0.325 |
| Eigenvalue | 2.463 |
| Var | 35.2% |
Table 3.
Impact of institutional and cultural factors on economic development.
| (1) | (2) | (3) | (4) | (5) | (6) | (7) | (8) | (9) | |
|---|---|---|---|---|---|---|---|---|---|
| Institutions | 0.05 *** (2.51) | 0.11 *** (5.05) | 0.08 ** (2.24) | 0.09 ** (2.01) | 0.19 *** (5.19) | 0.11 *** (2.40) | 0.23 *** (5.46) | 0.19 ** (2.08) | |
| Culture | 0.01 (0.27) | 0.04 ** (2.01) | 0.05 * (1.66) | 0.05 ** (2.35) | 0.07 * (1.59) | ||||
| Institutions × Culture | 0.01 * (1.65) | 0.08 *** (2.43) | |||||||
| Institutions/Culture | 0.17 ** (2.10) | 0.17 (0.98) | |||||||
| Culture/Institutions | −0.48 *** (−2.76) | −0.32 * (1.41) | |||||||
| Ν | 607 | 149 | 135 | 135 | 134 | 135 | 134 | 135 | 134 |
| R2 | 64.21% | 69.81% | 77.74% | 78.03% | 78.63% | 76.46% | 76.20% | 75.43% | 64.85% |
| F-stat | 108.43 *** | 32.19 *** | 27.00 *** | 65.13 *** | 79.71 *** | 181.02 *** | 189.26 *** | 182.08 *** | 33.82 *** |
Notes: The t-statistic values are shown within parentheses. The symbols *, **, and *** denote levels of statistical significance at 10%, 5%, and 1%, respectively. Each column represents a separate regression model. To control for unobserved heterogeneity, both time-fixed effects (to capture common temporal shocks) and country-fixed effects (to account for unchanging country-specific attributes) are included in all models. This allows for a more accurate estimation of the impact of institutional and cultural backgrounds on GDP per capita. Additionally, clustered robust standard error corrections by country are employed to account for within-country error correlation, enhancing the robustness of the regression analyses. These adjustments ensure that the standard errors are not underestimated, and the statistical significance levels are reliable.
Table 4.
Impact of institutional and cultural factors on economic development, using the previous year’s GDP per capita as a control variable.
Table 4.
Impact of institutional and cultural factors on economic development, using the previous year’s GDP per capita as a control variable.
| (10) | (11) | (12) | (13) | (14) | (15) | (16) | (17) | (18) | |
|---|---|---|---|---|---|---|---|---|---|
| Institutions | 0.09 *** (9.03) | 0.14 *** (5.25) | 0.11 *** (4.63) | 0.11 *** (4.09) | 0.13 *** (5.30) | 0.14 *** (8.21) | 0.13 *** (7.40) | 0.14 *** (5.90) | |
| Culture | 0.02 (1.11) | 0.03 ** (1.95) | 0.03 * (1.78) | 0.03 * (1.69) | 0.04 * (1.63) | ||||
| Institutions × Culture | 0.01 * (1.91) | 0.01 * (1.69) | |||||||
| Institutions/Culture | 0.13 * (1.67) | 0.01 (0.34) | |||||||
| Culture/Institutions | −0.16 *** (−2.54) | −0.11 (1.19) | |||||||
| GDP per capita previous year | 0.64 *** (15.36) | 0.86 *** (11.61) | 0.58 *** (7.14) | 0.53 *** (8.90) | 0.54 *** (8.90) | 0.53 *** (8.94) | 0.58 *** (12.32) | 0.58 *** (6.85) | 0.53 *** (8.94) |
| Ν | 534 | 143 | 133 | 133 | 131 | 132 | 131 | 133 | 131 |
| R2 | 87.04% | 76.05% | 90.80% | 91.10% | 91,17% | 90.92% | 90.80% | 79.17% | 91.33% |
| F-stat | 505.15 *** | 73.12 *** | 77.24 *** | 138.14 *** | 109.48 *** | 135.14 *** | 133.27 *** | 184.35 *** | 111.62 *** |
Notes: The t-statistic values are shown within parentheses. The symbols *, **, and *** denote levels of statistical significance at 10%, 5%, and 1%, respectively. Each column represents a separate regression model. To control for unobserved heterogeneity, both time-fixed effects (to capture common temporal shocks) and country-fixed effects (to account for unchanging country-specific attributes) are included in all models. This allows for a more accurate estimation of the impact of institutional and cultural backgrounds on GDP per capita. Additionally, clustered robust standard error corrections by country are employed to account for within-country error correlation, enhancing the robustness of the regression analyses. These adjustments ensure that standard errors are not underestimated and that the statistical significance levels are reliable.
Table 5.
Impact of institutional and cultural factors on economic development, using additional control variables.
Table 5.
Impact of institutional and cultural factors on economic development, using additional control variables.
| (19) | (20) | (21) | (22) | |
|---|---|---|---|---|
| Institutions | 0.17 *** (5.66) | 0.16 *** (5.86) | 0.12 *** (3.38) | 0.17 *** (5.17) |
| Culture | 0.05 ** (2.28) | 0.05 *** (2.64) | 0.05 * (1.81) | 0.04 ** (2.01) |
| GDP per capita previous year | 0.01 *** (4.28) | 0.01 *** (3.87) | 0.01 * (1.86) | 0.01 * (1.61) |
| Investments | 0.02 * (1.83) | 0.01 * (1.63) | 0.02 * (1.80) | −0.01 (−0.06) |
| Population density | 0.01 *** (5.02) | 0.01 *** (4.79) | −0.01 * (−1.88) | |
| Tertiary Education | 0.01 *** (2.49) | 0.01 (0.87) | ||
| FDI | 0.01 *** (2.77) | |||
| Ν | 132 | 130 | 114 | 111 |
| R2 | 74.16% | 78.47% | 77.62% | 85.76% |
| F-stat | 23.93 *** | 30.83 *** | 17.59 *** | 24.54 *** |
Notes: The t-statistic values are shown within parentheses. The symbols *, **, and *** denote levels of statistical significance at 10%, 5%, and 1%, respectively. Each column in the table corresponds to a distinct regression analysis. In all regression models, the impact of the time variable has been incorporated to account for effects shared among countries in each wave. Additionally, varying constant terms have been included to consider unique effects on individual economies. Furthermore, adjustments have been made to standard errors, employing clustered robust standard error corrections.
Table 6.
The effect of the product of institutional and cultural backgrounds on GDP per capita, using additional control variables.
Table 6.
The effect of the product of institutional and cultural backgrounds on GDP per capita, using additional control variables.
| (23) | (24) | (25) | (26) | |
|---|---|---|---|---|
| Institutions × Culture | 0.01 *** (3.05) | 0.01 *** (3.49) | 0.01 *** (2.67) | 0.01 *** (4.11) |
| GDP per capita previous year | 0.49 *** (4.28) | 0.48 *** (3.98) | 0.47 *** (3.21) | 0.37 ** (2.34) |
| Investments | 0.02 *** (7.03) | 0.02 *** (5.42) | 0.02 *** (5.05) | 0.01 *** (3.25) |
| Population density | 0.01 (0.27) | 0.01 (0.16) | −0.01 ** (−2.26) | |
| Tertiary Education | 0.01 (0.45) | 0.01 (0.69) | ||
| FDI | 0.01 * (1.89) | |||
| Ν | 132 | 130 | 114 | 111 |
| R2 | 92.48% | 85.37%% | 89.44% | 92.51% |
| F-stat | 93.88 *** | 89.35 *** | 69.15 *** | 33.91 *** |
Notes: The t-statistic values are shown within parentheses. The symbols *, **, and *** denote levels of statistical significance at 10%, 5%, and 1%, respectively. Each column in the table corresponds to a distinct regression analysis. In all regression models, the impact of the time variable has been incorporated to account for effects shared among countries in each wave. Additionally, varying constant terms have been included to consider unique effects on individual economies. Furthermore, adjustments have been made to standard errors, employing clustered robust standard error corrections.
Table 7.
Impact of institutional and cultural factors on economic development, using the Arellano–Bond methodology (two-stage GMM).
Table 7.
Impact of institutional and cultural factors on economic development, using the Arellano–Bond methodology (two-stage GMM).
| (27) | (28) | (29) | (30) | (31) | (32) | (33) | (34) | |
|---|---|---|---|---|---|---|---|---|
| Institutions | 0.12 *** (3.06) | 0.13 *** (2.98) | 0.11 *** (2.59) | 0.12 ** (2.91) | 0.09 ** (2.09) | 0.05 * (1.82) | 0.07 ** (2.42) | 0.12 ** (2.91) |
| Culture | 0.06 ** (1.95) | 0.05 ** (1.93) | 0.04 ** (1.89) | 0.04 ** (1.79) | 0.05 * (1.79) | 0.04 ** (2.24) | 0.04 * (1.63) | 0.04 * (1.61) |
| Institutions × Culture | 0.01 *** (4.21) | 0.01 *** (2.50) | 0.01 *** (2.91) | |||||
| Institutions/Culture | −0.02 (−0.29) | |||||||
| Culture/Institutions | 0.03 (0.24) | |||||||
| GDP per capita previous year | 0.73 *** (12.94) | 0.75 *** (13.21) | 0.87 *** (17.50) | 0.88 *** (24.27) | 0.78 *** (11.36) | 0.92 *** (16.52) | 0.82 *** (13.72) | 0.88 *** (2.18) |
| Investments | 0.01 * (1.89) | 0.01 *** (3.51) | 0.01 *** (2.42) | 0.01 ** (2.31) | ||||
| Population density | −0.01 (−0.70) | −0.01 (−1.19) | −0.01 (−0.92) | −0.01 (−0.83) | ||||
| Tertiary education | −0.01 (−1.34) | 0.01 (0.21) | ||||||
| FDI | −0.01 (−0.43) | 0.01 (0.48) | ||||||
| Arellano–Bond AR(1) test | 0.307 | 0.632 | 0.367 | 0.399 | 0.395 | 0.942 | 0.721 | 0.879 |
| Arellano–Bond AR(2) test | 0.318 | 0.472 | 0.258 | 0.237 | 0.291 | 0.263 | 0.374 | 0.294 |
| F-statistic | 246.76 *** | 324.29 *** | 352.67 *** | 512.47 *** | 269.29 *** | 680.02 *** | 411.37 *** | 476.41 *** |
| Hansen test | 0.086 | 0.104 | 0.112 | 0.092 | 0.563 | 0.265 | 0.121 | 0.254 |
| No. of instruments | 31 | 23 | 23 | 23 | 33 | 18 | 23 | 18 |
| No. of groups | 75 | 73 | 73 | 73 | 73 | 68 | 72 | 67 |
| No. of observations | 174 | 172 | 172 | 172 | 171 | 136 | 170 | 135 |
Notes: In the analysis, t-test values are provided in parentheses, employing robust standard errors. The symbols *, **, and *** indicate levels of statistical significance at 10%, 5%, and 1%, respectively. Each column in the analysis corresponds to an individual regression model, with GDP per capita serving as the dependent variable across all regressions. In these models, institutional and cultural backgrounds are treated as having an endogenous relationship with GDP per capita. Other control variables, varying across each column, are introduced as instrumental variables. According to Roodman (2008), it is important to ensure that the number of instruments used is less than the number of groups to maintain the reliability of the Hansen test. The effectiveness of this methodology hinges on having a sufficient number of observations given the multiple levels of difference in the variables used. To accommodate this need, data for the overall measurement of cultural background were interpolated based on historical trends. This interpolation was applied for countries for which data were available for more than three of the seven waves in the study and was performed for 16 out of the 113 countries in the sample.
Disclaimer/Publisher’s Note: The statements, opinions and data contained in all publications are solely those of the individual author(s) and contributor(s) and not of MDPI and/or the editor(s). MDPI and/or the editor(s) disclaim responsibility for any injury to people or property resulting from any ideas, methods, instructions or products referred to in the content. |
© 2024 by the author. Licensee MDPI, Basel, Switzerland. This article is an open access article distributed under the terms and conditions of the Creative Commons Attribution (CC BY) license (https://creativecommons.org/licenses/by/4.0/).
Share and Cite
MDPI and ACS Style
Kafka, K.I. The Dual Pillars of Progress: Institutional and Cultural Dynamics in Economic Development. Economies 2024, 12, 76. https://0-doi-org.brum.beds.ac.uk/10.3390/economies12040076
AMA Style
Kafka KI. The Dual Pillars of Progress: Institutional and Cultural Dynamics in Economic Development. Economies. 2024; 12(4):76. https://0-doi-org.brum.beds.ac.uk/10.3390/economies12040076
Chicago/Turabian StyleKafka, Kyriaki I. 2024. "The Dual Pillars of Progress: Institutional and Cultural Dynamics in Economic Development" Economies 12, no. 4: 76. https://0-doi-org.brum.beds.ac.uk/10.3390/economies12040076
Note that from the first issue of 2016, this journal uses article numbers instead of page numbers. See further details here.